Paducah Gaseous DifrusioD' PlaD!t - paducah environmental ...
Paducah Gaseous DifrusioD' PlaD!t - paducah environmental ...
Paducah Gaseous DifrusioD' PlaD!t - paducah environmental ...

You also want an ePaper? Increase the reach of your titles
YUMPU automatically turns print PDFs into web optimized ePapers that Google loves.
•<br />
DOE/ORl07-1777 &Dl<br />
PRIMARY DOCUMENT<br />
Remedial Investigation Report<br />
for Waste Area Grouping 27<br />
at the<br />
<strong>Paducah</strong> <strong>Gaseous</strong> <strong>DifrusioD'</strong> <strong>PlaD</strong>!t<br />
<strong>Paducah</strong>, Kentucky<br />
Volume 1 of4<br />
Sections 1 through 8<br />
\<br />
•<br />
~'<br />
I<br />
N ,\<br />
~<br />
W<br />
~.<br />
CS<br />
,<br />
~<br />
~<br />
.~<br />
~<br />
December 1998<br />
•<br />
CLEARED FOR PUBLIC' RELEASE
Oepartment of :Energy<br />
Oak Ridge Operations<br />
<strong>Paducah</strong> Site Office<br />
P.O. Box 1410<br />
<strong>Paducah</strong>. KY 42001<br />
Mr. Robert H. Daniell~ Director<br />
Division of Waste Management<br />
Kentucky Department for Environmental Protection<br />
14 Reilly Road, Frankfort Office Park<br />
Frankfort, Kentucky 40601<br />
Mr. Carl R. Froede Jr.,P. G.<br />
United States Environmental Protection Agency<br />
Region IV<br />
DOE Remedial Section<br />
Federal Facilities Branch<br />
Waste Management Division<br />
61 Forsyth Street<br />
Atlanta, Georgia 30303<br />
December 23, 1998<br />
•<br />
Dear Mr. Daniell and Mr. Froede:<br />
WASTE AREA GROUPING 27 Dl REMEDIAL INVESTIGATION REPORT,<br />
PADUCAH GASEOUS DIFFUSION PLAN,PADUCAH, KENTUCKY<br />
Enclosed for your review and comment is the subject document. In order to maintain the current<br />
project schedule, the Department of Energy (DOE~requests that the Environmental Protection<br />
Agency and the Kentucky Department for Environmental Protection submit comments no later<br />
than March 26, 1999,. If you have any questions or require additional information, please call<br />
Myrna E. Redfield at (502) 441-6815.<br />
Enclosure<br />
cc w/enclosure:<br />
M.GutTey, KDEPfFrankfort<br />
J. Stickney, KDEPlFrankfort<br />
T. Taylor, KDEPlFrankfort<br />
Sincerely;<br />
\' ~ "" ('<br />
..<br />
-~~"<br />
,,~ .' ~~.<br />
\.?:~. \.."<br />
~0··<br />
•<br />
Document Identification:<br />
CERTIFICATION<br />
Transmittal of the Draft Remedial! Investigation Report of<br />
Waste Area Group 27 at the <strong>Paducah</strong> <strong>Gaseous</strong>Oiffusion Plant<br />
at <strong>Paducah</strong>, Kentucky ~OE/ORJ07-1777&Ol)<br />
I certify under penalty of law that ,this document and all attachments were prepared under my<br />
direction or supervision in accordance with a system designed to assure that qualified personnel<br />
properly gather and evaluate the information submitted. Based on my inquiry of the person or<br />
persons directly responsible for gathering the information, the information submitted is to the<br />
best of my knowledge and belief, true, accurate, and complete. I am aware that there are<br />
significant penalties for submitting false information, including the possibility of fine and<br />
imprisonment for knowing violations.<br />
u.s. Department of Energy (DOE)<br />
Owner and' Operator<br />
c'.<br />
\<br />
'\-" Jimmie C. Hodges, <strong>Paducah</strong> Site Manager<br />
•<br />
\ '~\-"\--':-:-<br />
Date Signed<br />
1 certify under penalty oflaw that this document and all attachments were prepared under my<br />
direction or supervision in accordance with a system designed to assure that qualified personnel<br />
properly gather and evaluate the information submitted. Based on my inquiry of the person or<br />
persons directly responsible for gathering the information, the information submitted is to the<br />
best of my knowledge and belief, true, accurate, and complete. I am aware that there are<br />
significant penalties for submitting false information, including the possibility of fine and<br />
imprisonment for knowing violations.<br />
Bechtel Jacobs Company LLC<br />
Co-Operator<br />
•<br />
/<br />
Manager of Projects<br />
) Date Signed
•<br />
D0E10Rl07 -1777&D 1<br />
PRIMA!RY DOCUMENT<br />
Remedial Investigation Report<br />
fOil" Waste Area Grouping 27<br />
at the <strong>Paducah</strong> <strong>Gaseous</strong> Diffusion Plant<br />
<strong>Paducah</strong>, Kentucky<br />
Volume 1 of 4. Sections 1 through 8<br />
Date Issued-December 1998<br />
.'<br />
Prepared by<br />
CH2M Hll..L. Inc.<br />
<strong>Paducah</strong>. Kenrucky<br />
under General Order 18B-99345C<br />
fONhe<br />
U.S. Department of Energy<br />
Office of Environmental Management<br />
Environmental Management Activities .at the<br />
PADUCAH GASEOUS DIFFUSION PLANT<br />
<strong>Paducah</strong>, Kentucky 42002<br />
managed by<br />
BECHTEL JACOBS COMPANY LLC<br />
for the<br />
U.S. DEPARTMENT OF ENERGY<br />
Under contract IDE-AC05-980R22700<br />
•
'.<br />
PREFACE<br />
DOElORl07-1777 &D 1<br />
PRlMARY'DOCUMENT<br />
This Integrated, Remedial Investigation Report for Waste Area Grouping (WAG) 27 at the<br />
<strong>Paducah</strong> <strong>Gaseous</strong> Diffusion Plant (DOFJORl07-1777&Dl) was prepared in accordance with the<br />
requirements under the Comprehensive Environmental Response, Compensation, and, Liability Act<br />
(CERCLA) and the Resource Conservation and Recovery Act (RCRA). This work was performed<br />
under Work Breakdown Structure 1.4.12.07.1O.L27~03 (Activity Data Sheet OR45301). This<br />
document provides information derived.from implementing the WAG 27 Remedial Investigation.<br />
In accordance with Section IV of the Federal Facilities Agreement for the I<strong>Paducah</strong>i<strong>Gaseous</strong><br />
Diffusion Plant, this integrated technical document was developed to satisfy both CERCLAand<br />
RCRA corrective action requirements. It is noted that the phases of the illvestigationprocess are<br />
referenced by CERCLA terminology within this document to reduce the potential for confusion .<br />
•<br />
A Tl\983500002 Contents·FinaU.doc<br />
III
•<br />
This page intentionally left blank.<br />
•<br />
•<br />
A Tl \983500002 . Contents·fll18lJ.doc<br />
IV
DOFJORl07-t 777&01<br />
PRIMARY DOCUMENT<br />
CONTENTS<br />
VOLUME 1<br />
FIGURES ........................................................................................................................................... viii<br />
TABLES ............................................................................................................................................... x<br />
ACRONYMS ..................................................................................................................................... xiii<br />
EXECUTIVE SUMl\4AR Y ................................................................................................ ,., .......... ES-l<br />
1. IN1'RODtITION ............................................................................................................................ 1-1<br />
1.1·PURPOSE OF ,REPORT ...................................................................................................... 1-1<br />
1.2 WAG 27 BACKGROUND INFORMATION ..................................................................... 1-1<br />
1.2.1 C-747-C Fonner Oil Landfann (SWMU 001) ............................................................. 1-2<br />
1.2.2 UF 6 Cylinder Drop Test Area (SWMU 091) ................................................................ 1-2<br />
1.2.3 C'-746-A'Septic SysteJllS (SWMU 1-96) ..............................................•........................ 1-3<br />
1.2.4 C-720 Complex (Compressor Shop Pit, SWMU 167, and Floor Drain Exit Points) ... 1-4<br />
1.3 PROJEcr SCOPE ................................................................................................................ '1-5<br />
1.4 REPORT ORGANIZATION: ............................................................................................... 1'.:5<br />
•<br />
•<br />
2. FIELD IN¥ESTIGATION ............................................................................................................. 2-1<br />
2.1 TRENClIING ACTWITlES ................................................................................................ 2-1<br />
2.2 SEDIMENT SAMPLING METHODS ................................................................................ 2-1<br />
2.3 SURFACE AND SUBSURFACE SOn.. SAMPLING METHODS .................................... 2-2<br />
2.4 CONE PENETROMEl'ER 'fESTS ...................................................................................... 2-3<br />
2.5 BOREHOLE GROUNDWATER GRAB SAMPLES .................................................... , .... 2-3<br />
2.6 PIEZOMETER INSTALLATION ....................................................................................... 2-4'<br />
2.7 SLUDGE SAMPLING METHODS' .................................................................................... 2-5<br />
2.8 AN~ YTICAL METHODS ................................................................................................ 2-5<br />
2.8.1 Close Support Laboratory Methods ............................................................................. 2-6<br />
2.8.2 Fixed-Base Laboratory Methods .................................................................................. 2-7<br />
2.8.3 Analytical Data Quality ............................................................................................... 2.7<br />
2.8.4 Data.Management ...................................................................................................... 2-11<br />
2.8.5 Data Assessment ........................................................................................................ 2-12<br />
2.8.6 Field Quality Control Procedures .............................................................................. 2-15<br />
2.9 CIVn.. SURVEy ................................................................................................................. 2-16<br />
2.10 SURFACE AND BOREHOLE GEOPHYSICAL SURVEYS ........................................ 2-16<br />
2.1'0.1 Surface Geophysical Surveys ................................................................................... 2-1 6<br />
2.1 0:2 Borehole Geophysical Surveys ................................................................................ 2 .. 17<br />
2.11lIEALTH AND SAFETY MONITORING ...................................................................... 2-17<br />
2.11:.1 Work Area Monitoring ............................................................................................. 2-17<br />
2.11'.2 Employee Biological Monitoring ............................................................................. 2-18<br />
2.12 DECONTAMINATION PRACfICES, ............................................................................ 2-19<br />
2.13 WAS'fE.HANDLING PRACTICES ................................................................................ 2-19<br />
2.13.1 Soil Cuttings and Drilling Mud ................................................................................ 2-20<br />
2.1'3.2 Well Development, Drilling Water, Decontamination Rinsate, and Purge Water ... 2-20<br />
2.13.3 Personal Protective Equipment and Dirty Plastic .................................................... 2-21<br />
2.l3.4 CSL Wastes .............................................................................................................. 2-21<br />
2.1'3.5 Non-contaminated 'IDW ......... , ................................................................................. 2-21<br />
ATl\983500002 Contents-FIIl8U.doc<br />
v
2.13.6 lOW Forms ....................................................... ; ...................................................... 2-21<br />
2.13.7 IDW Labeling ........................................ , ....................................... , ......................... 2-22 •<br />
2.13.8 IDW Storage ............................................................................................................ 2-22<br />
2.13.9 Types of Containers ................................................................................................. 2-22<br />
2.13.10 lOW Characterization, Sampling, and Analysis .................................................... 2-22<br />
2.14 DOCUMENTATION .......................................... , ........ , ................................................... 2-22<br />
3, PHYSICAL CHARACTERISTICS OF WASTE AREA GROUPING 27 .................................... 3-)<br />
3.1 REGION~ TOPOGRAPHY AND SURFACE WATER .................................................. 3-1<br />
3.2 METEROLOGY .................................................................................................................. 3-1<br />
3.3 SOn.. ................................•.•.................................................................................................. 3-2<br />
3.4 POPULATION AND LAND USE ....................................................................................... 3-3<br />
3.5 ECOLOGy ........................................................................................................................... 3-3<br />
3.5.1 Terrestrial Systems ....................................................................... , ............................... 3-3<br />
3.5.2 Aquatic Systems ........................................................................................................... 3-4<br />
3.5.3 Wetlands and Aoodplains .............. , .............................................................................. 3-4<br />
3.6 REGIONAL GEOLOGY ..................................................................................................... 3-5<br />
3,6,1 Regional Geologic Setting ........................................................................................... 3-5<br />
3.7 REGIONAL 'HYDROGEOLOGY ....................................................................................... 3-7<br />
3.7.1 Regional Surface Water ............................................................................................... 3-7<br />
3.7.2 Regional 'Groundwater ................................................................................................. 3-8<br />
3.8 WAG 27 SURFACE FEATURES, GEOLOGY, AND HYDROGEOLOGY ................... 3-1O<br />
3.8.1 WAG 27 Surface Features ......•.................................................................................. 3-10<br />
3.8.2 WAG 27 Geology ...................................................................................................... 3-11<br />
3.8.3 WAG 27 Hydrogeology .........................................................................................•... 3-13<br />
•<br />
4. NATURE AND EXTENT OF CONTAMINATION .............................•...................................... 4-1<br />
4.1 INTRODUCTION, .........................•...................................................................................... 4-1<br />
4.1.1. Screening Process ....................................................................................................... 4-1<br />
4.1.2 WAG 27 Soils ....................................................................................•....•.................... 4-2<br />
4.1.3 WAG 27 Groundwater ................................................................................................. 4-3<br />
4.1.4 Historical Data Review ................................................................................................ 4-4<br />
4.2 WAG 27 SOn.. AND GROUNDWATER. ........................................................................... 4-4<br />
4.2.1 SWMU 00,1' .................................................................................................................. 4-4<br />
4.2.2 UF 6 Cylinder Drop Test Area (SWMU 091) ..............................................................4-12<br />
4.2.3 C-746-A Septic Systems (SWMU 196) .......................................,.............................4-15<br />
4.2.4C-720 Complex .......................................................................................................... 4-20<br />
4.2.5 RGA and McNairy Groundwater ............................................................................... 4-29<br />
5. CONTAMINANT FATE AND TRANSPORT ............................................................................. 5-1<br />
5.1 INTRODUCTION ................................................................................................................ 5-1<br />
5.2 CONCEPrUAL SITE MODEL., ............................................................... , ..................... ; ... 5-2<br />
5.2.1 Contaminant Sources, Release Mechanisms, and Migration Pathways ................. , ..... 5-2<br />
5.2.2 Hydrologic Properties .................................................................................................. 5-4<br />
5.2.3 Site-related Chelllicals ....................................................................... , ......................... 5-5<br />
5.3 CHEMICAL PROPERTIES ................................................................................................. 5-6<br />
5.3.1' PAHsIPCBs .................................................................................................................. 5-7<br />
5.3.2 Chlorinated, VOAs .......................................................................... , ............................. 5-8<br />
5.3,3 Metals ......................................................................................................................... 5-10<br />
5.3.4 Radionuclides ............................................................................................................. 5-13 .'<br />
5.4 CHEMICAL MIGRATION RATES .................................................................................. 5-14<br />
ATL\983500002 Conlents·Final,J.doc<br />
vi
•<br />
5.4.1 Migration Pathways ................................................................................................... 5-15<br />
5.5 FAT'EANDmANSPORTMODELING .......................................................................... 5-17<br />
5.5.1 SWMU,OOI ................................................................................................................ 5-17<br />
5.5.2 SWMU 091 ................................................................................................................ 5-18<br />
5.5.3 SWMU 196 ................................................................................................................ 5-19<br />
5.5.4·C-720·Complex .......................................................................................................... 5-20<br />
6. RESULTS OF BASELINE RISK ASSESSMEN1' ....................................................................... 6-1<br />
6.1 CONCLUSIONS .................................................................................................................. 6-2<br />
6.2 OBSERVATIONS ................................................................................................................ ,6-2<br />
6.2.1 Observations of the Baseline Human Health Risk Assessment ................................... 6-2<br />
6.2.2 Observations.of the Baseline Ecological Risk Assessment ......................................... 6-4<br />
7. CONCLUSIONS ............................................................................................................................ 7-1<br />
7.1' INTRODUCTION ................................................................................................................ 7-1<br />
7.1.1 Major Findings of Contaminant Distribution ............................................................... 7-1<br />
7.1.2.Hydrogeologic Setting ................................................................................................. 7-1<br />
7 .2 WAG 27 SWMU-SPECIFIC DQO QUESTIONS ............................................................... 7-3<br />
7.3 BASELINE RISK ASSESSMEN1' ...................................................................................... 7-8<br />
7.3.1 Observations ,of the Baseline Human Health Risk Assessment ................................... 7-9<br />
7.3.2 Observations of the Baseline Ecological Risk Assessment ....................................... 7-10<br />
7.4 WAG 27 SWMU-Specific Decision Rules and Conclusions ............................................. 7-11<br />
•<br />
8. REFERENCES ............................................................................................................................... 8-1<br />
VOLUME 2<br />
APPENDIX A<br />
APPENDIXB<br />
APPENDIXC<br />
APPENDIXD<br />
APPENDIXE<br />
APPENDIXF<br />
BORING LOGS<br />
WATER LEVEL MEASUREMENTS<br />
CIVIL SURVEYING DATA<br />
BOREHOLE GEOPHYSICAL LOGS<br />
CONE PENETROMETER DATA<br />
GEOPHYSICAL SURVEY AND EXCA VA TION REPORT<br />
VOLUME 3<br />
APPENDIXG<br />
APPENDIXH<br />
APPENDIX!<br />
VOLUME 4<br />
~AL YTICAL GROUPS TESTED<br />
WAG 27 ANALYTICAL REPORTS<br />
HISTORICAL ANALYTICAL REPORTS<br />
BASELINE RISK ASSESSMENT<br />
•<br />
A TL\983500002 Contants-FIllaU.doc<br />
vii
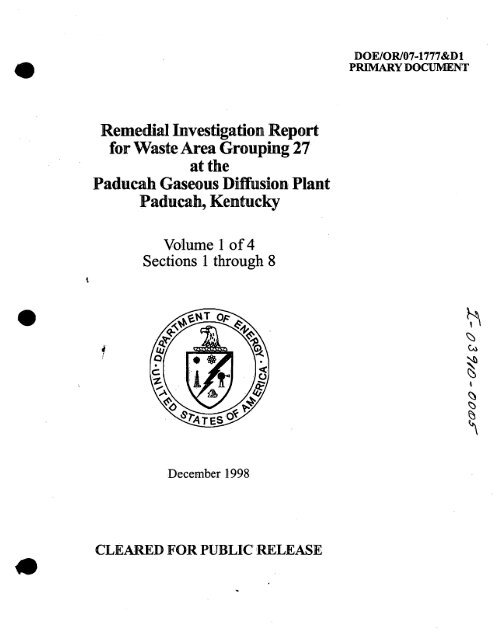
1.1 PGDP location map<br />
Figures<br />
•<br />
1.2 The C-720 Area and SWMUs included in the WAG 27 RI<br />
3.1 Wind rose diagram<br />
3.2 Physiographic province map for PGDP<br />
3.3 Lithostratigraphic column of the Jackson Purchase Region<br />
3.4 Surface water features in the vicinity of PGDP<br />
3.5 Water level elevations and geologic components of the regional groundwater flow system in<br />
the vicinity of PGDP<br />
3.6 SWMU and sample location map for WAG 27<br />
3.7 Regional stratigraphy for PGDP area<br />
3.8 WAG 27 cross section<br />
3.9 Northwest-southeast geologic cross section A-A' at SWMU 001<br />
•<br />
3.10 North-south geologic cross section A-A' at SWMU 091<br />
3.11 Northwest-southeast geologic cross section A-A' at C-720Complex<br />
3.12 North-south geologic cross section A-A'in northwest area of SWMU 196<br />
3.13 East-west geologic cross section A-A' in northwest area of SWMU 196<br />
3.14 East-west geologic cross sectionA-A'in northeast area of SWMU 196<br />
3.15 Ranges of hydraulic conductivity (k) from WAG 6 RIlaboratory results<br />
3.16 RGA potentiometric map for SWMU 001 and SWMU 091<br />
3.17 RGA potentiometric map of the C-720 Complex<br />
4.1 Sampling locations from Phases I and II Site Investigations: SWMU 001<br />
4.2 WAG 23 focused sampling grid at SWMU 001<br />
4.3 Sampling stations at SWMU 001<br />
4.4 Distribution of TCE in UCRS soil at SWMUOO 1<br />
4.5 East-west cross section A-A' showing TCE distribution in UCRS soils at SWMU 001<br />
4.6 North-south cross section B-B' showing 'FCE distribution in UCRS .soils at SWMU 001<br />
4.7 Distribution of arsenic, cadmium, manganese, and silver in UCRS soil at SWMU 001<br />
4.8 Distribution of antimony and magnesium in UCRS soil at SWMU 001<br />
4.9 SWMU 001 site conceptual model<br />
•<br />
ATL\983500002Contents-FinaU.doc<br />
viii
•<br />
4.10<br />
Sample locations from Phase I and II and WAG 27 RI activities at SWMU 091<br />
4.11 Distribution of select metals at SWMU 091<br />
4.12 Distribution of radionuc1ides detected at SWMU 091<br />
4.13 SWMU09'1 site conceptual model<br />
4.14 Sample locations for C-7 4~A septic systems at SWMU 196<br />
4.15 Distribution of antimony atSWMU 196<br />
4.16 Distribution of all detected metals at 196-013<br />
4.17 Distribution of aluminum and nickel detected at SWMU 196<br />
4.18 SWMU 196 site conceptual model<br />
4.19 Location of Compressor Shop and major building exit drains at C-720 Building<br />
4.20 Compressor Shop pit plan and details<br />
4.21 Sample locations at C-720'Complex<br />
4.22 VOAs detected in subsurface soils at C-720 Complex<br />
4.23 North-south cross section A-A' showing TeE distribution in VCRS soils<br />
4.24 SVOAs detected in subsurface soils at C-720 Complex<br />
• 4.25 Metals detected at C-720Complex<br />
4.26 VOAs detected in VCRS groundwater at C.., 720 Complex<br />
4.27 Parameters detected in Compressor Shop pit sump sample at G· 720 Complex<br />
4.28 C-720 site conceptual model<br />
4.29 Maximum concentration of TCE detected in RGA groundwater above PRG at each sample<br />
location<br />
4.30 Northwest-southeast cross . section A-A' showing distribution of TCE in groundwater at<br />
SWMU 001 and C-720 Complex<br />
4.31 Maximum concentration of Tc-99 detected above BG and PRO in RGA groundwater at each<br />
sample location<br />
•<br />
ATh\983500002 Contents·FrnalJ.doc<br />
ix
2.1 <strong>Paducah</strong> EMEF program procedures<br />
Tables<br />
2.2 Number of sample types by SWMU or.area<br />
2.3 Samples with inadequate or 00 purging or collected by bailer<br />
2.4 Piezometer water level information<br />
2.5 CSL analyses<br />
2.6 Analytical methods and sample requirements for CSL screening samples<br />
2.7 Analytical methods. preservation. and container type for all samples analyzed by the fixedbase<br />
laboratories<br />
2.8 Average spike recovery and duplicate relative percent difference (RPD) for the CSLs<br />
2,9 Health and safety parameters monitored using real-time instruments<br />
3.1 Monthly average precipitation. temperature. potential evapotranspiration. estimated actual<br />
evapotranspiration. and inflltration and runoff: 1969-1989<br />
4.1 Metals. background values<br />
4.2<br />
4.3<br />
Radioactive isotopes background values<br />
PreliminaI}' Remediation Goals<br />
4.4 VOA compounds detected in UCRS soil at SWMU 001<br />
4.5 SVOA and PCB compounds detected in UCRS soil at SWMU 001<br />
4.6 Metals detected above BG in UCRS soil at SWMUool<br />
4.7 Radioactive isotopes detected above BG in UCRS soil at SWMU 00 1<br />
4.8 VOA compounds detected in UCRS groundwater at SWMU 001<br />
4.9 Radioactive isotopes detected above BG in UCRS groundwater at SWMUOOI<br />
4.10 Frequency of detection of organic compounds, metals, and radioactive isotopes exceeding BG<br />
in SWMU 001 trench. sediment. UCRS soil,and UCRSgroundwater samples<br />
4.11 Metals detected above BO in UCRS soil at SWMU 091!<br />
•<br />
•<br />
4.12 Radioactive isotopes detected above BG in UCRS soil at SWMU09'1<br />
4.13 Frequency of detection of metals and radioactive isotopes exceeding BG in SWMU 091<br />
sediment samples<br />
4.14 PCB compounds detected in UCRSsoil at SWMU 196<br />
4.15 Metals detected above BG in UCRS soil at SWMU 196<br />
4.16 Radioactive isotopes detected above BG in UCRS soil atSWMU 196<br />
•<br />
ATL\983500002 Contents·FINICr,doc<br />
x
e<br />
4.17<br />
Frequency of detection of organic compounds, metals, and radioactive isotopes exceeding BG<br />
in SWMU 196 sludge, surfacesoil,.sediment, and UCRS soil samples<br />
4.18 VOA compounds detected in UCRS soil at C-720 Complex<br />
4. i 19 SVOA and PCB compounds detected in UCRSsoil at C-720'Complex<br />
4.20 Metals detected above BG in UCRS soil at C-720 Complex<br />
4.21 Radioactive isotopes detected above BG in VCRS soil: at C-720Complex<br />
4.22 VOA compounds detected in UCRS groundwater at C-720 Complex<br />
4.23 Frequency of detection of organic compounds, metals, and radioactive isotopes exceeding BG<br />
in C-720 Complex sludge, UCRS soil, and: UCRS groundwater samples<br />
4.24 VOA compounds detected in RGA groundwater<br />
4.25 Metals detected above BG in RGA groundwater<br />
4.26 Radioactive isotopes detected above BG in RGA groundwater<br />
4.27 Frequency Of detection of organic compounds, metals, and radioactive isotopes exceeding BG<br />
in RGA groundwater<br />
4.28 VOA compounds detected in McNairy groundwater<br />
ie<br />
4.29 Metals detected above BG in McNairy groundwater<br />
4.30 Radioactive isotopes detected above BG in McNairy groundwater<br />
4.31 Frequency of detection of organic compounds, metals, and radioactive isotopes exceeding BG<br />
in McNairy groundwater<br />
5.1 Physical and chemical properties of volatile and semi-volatile compounds<br />
5.2 Distribution coefficients (Kct) for inorganic COPCs at WAG 27 sites<br />
5.3 Radioactive half-lives, decay constants, and distribution coefficients (Kct) for radionuclide<br />
COPCsat WAG 27 sites<br />
5.4 Horizontal groundwater migration potential<br />
5.5 MEP AS results for SWMU 001<br />
5.6 MEPAS results for SWMU 091<br />
5.7 M£PAS results forSWMU 196<br />
5.8 MEPAS results for C-720 Complex<br />
6.1 Land uses and media assessed for each SWMV and area of WAG 27<br />
6.2 Scenarios for which human health risk exceeds de minimis levels<br />
•<br />
6.3 Summary of risk characterization results for SWMH 001 without lead asa COPC<br />
6.4 Summary of risk characterization results for SWMU 091 without lead as a COPC<br />
6.5 Summary of risk characterization results for SWMU 196 without lead as a COPC<br />
ATL\983500002 Contents-FmaU.doc<br />
xi
6.6<br />
6.7<br />
Summary of risk characterization results for C-720 Complex without lead as a COPC<br />
Summary of hazard quotients for chemicals posing potential future risks to nonhuman<br />
receptors<br />
7.1 WAG 27 SWMU DOl-specific decision rules and conclusions<br />
•<br />
7.2 WAG 27 SWMU 091-specific decision rules and conclusions<br />
7.3 WAG 27 SWMU 196-specific decision rules and conclusions<br />
7.4 WG 27 C-720 Complex-specific decision rules. and conclusions<br />
•<br />
A Tl\983500002 Conten~Fmatr.doc<br />
xii
•<br />
•<br />
•<br />
ACO<br />
AFIRO<br />
Am-241<br />
amsl<br />
ANSI<br />
AGC<br />
ARARs<br />
ASTM<br />
AWQC<br />
BCF<br />
BEHP<br />
BERA<br />
BG<br />
bgs<br />
BHHRA<br />
BJCLLC<br />
BMP<br />
BRA<br />
BTEX<br />
CERCLA<br />
CFR<br />
CGI<br />
CLP<br />
cm/s<br />
COCs<br />
COE<br />
COPCs<br />
COPECs<br />
cpm<br />
CPT<br />
CRP<br />
Cs-134<br />
Cs-137<br />
CSL<br />
CSM<br />
CWA<br />
DCE<br />
DI<br />
DNAPL<br />
DNT<br />
DOE<br />
DOT<br />
ACRONYMS<br />
Administrative Order by Consent<br />
available for infiltration or surface runoff<br />
americium-241<br />
above mean sea level<br />
American National Standards Institute<br />
Area ofConcem .<br />
applicable or relevant and appropriate requirements<br />
American Society for Testing and Materials<br />
Ambient Water Quality Criteria<br />
bioconcentration factor<br />
bis(2'-ethylhexyl)phthalate<br />
baseline ecological risk assessment<br />
background<br />
below ground surface<br />
baseline human health risk assessment<br />
Bechtel Jacobs Company LLC<br />
Biological Monitoring Program<br />
Baseline Risk Assessment<br />
benzene, toluene,ethylbenzene, and xylenes<br />
Comprehensive Environmental Response, Compensation, and Liability<br />
Act<br />
Code of Federal Regulations<br />
combustible gas indicator<br />
Contract Laboratory Program<br />
centimeter per second<br />
contaminants of concern<br />
U.S. Anny Corps of Engineers<br />
chemicals of potential concern<br />
chemicals of potential ecological concern<br />
counts per minute<br />
cone penetrometer test<br />
Community Relations Plan<br />
cesium-134'<br />
cesium-137<br />
Close Support Laboratory<br />
Conceptual Site Model<br />
Clean Water Act<br />
dichloroethene<br />
deionized<br />
dense. nonaqueous-phase liquid<br />
dinitrotoluene<br />
U.S. Department of Energy<br />
U.S. Department of Transportation<br />
ATL\983500002 Contents·FinaU.doc<br />
xiii
dpm<br />
DPT<br />
DQOs<br />
DRO<br />
DRMP<br />
DWRC<br />
EDDs<br />
EDGe<br />
ElMS<br />
ELCR<br />
EMEF<br />
EPA<br />
ESPs<br />
ER<br />
ERWM<br />
ETS<br />
FCRF<br />
FFA<br />
FOP<br />
FR<br />
FS<br />
FSP<br />
GRO<br />
GC<br />
GSA<br />
GWPP<br />
HASP<br />
HEAST<br />
HI<br />
HQ<br />
HSWA<br />
I.D.<br />
lOW<br />
IRIS<br />
KDEP<br />
KPA<br />
KPDES<br />
LCD<br />
LMES<br />
LMUS<br />
MCL<br />
MDL<br />
MEPAS<br />
mgd<br />
MSDSs<br />
disintegrations per minl:lte<br />
direct push technology<br />
data quality objectives<br />
diesel-range organic<br />
Data and Records Management<br />
dual i wall reverse circulation<br />
electronic data deliverables<br />
Engineering, Design & Geosciences Group, Inc.<br />
Environmental Information Management System<br />
excess lifetime cancer risk<br />
Environmental Management and Enrichment Facilities<br />
United States Environmental Protection Agency<br />
Environmental Surveillance Procedures<br />
Environmental Restoration<br />
Environmental Restoration and Waste Management<br />
Environmental Technical Services<br />
Field Change Request FOml<br />
Federal Facilities Agreement<br />
Field Operating Procedure<br />
Federal Register<br />
Feasibility Study<br />
Field Sampling Plan<br />
gasoline-range organic<br />
gas chromatograph<br />
generator storage area<br />
Groundwater Protection Program<br />
Health and Safety Plan<br />
Health Effects Assessment Summary Table<br />
hazard index<br />
hazard quotient<br />
Hazardous and Solid Waste Amendments<br />
inside diameter<br />
investigation-derived waste<br />
Integrated Risk Information System<br />
Kentucky Department for Environmental Protection<br />
kinetic phosphorescence anal yzer<br />
Kentucky Pollutant Discharge Elimination System<br />
Lower Continental Deposits<br />
Lockheed Martin Energy Systems, Inc. (also referred to as Energy<br />
Systems)<br />
Lockheed Martin Utility Services, Inc.<br />
maximum contaminantlevel<br />
method detection limit<br />
Multimedia Environmental Pollutant Assessment System<br />
million gallons per day<br />
Material Safety Data Sheets<br />
•<br />
•<br />
•<br />
ATL\983S00002 Contents-Final..:r.doc<br />
xiv
•<br />
•<br />
•<br />
MSIMSD<br />
NAPL<br />
NCP<br />
ND<br />
NEPA<br />
NFA<br />
NOVD<br />
Np-237<br />
NPL<br />
NRC<br />
NTU<br />
O.D.<br />
OREIS<br />
ORO-SMO<br />
OSHA<br />
OSWR<br />
OU<br />
OVA<br />
OVM'<br />
PAH<br />
PARCC<br />
PCB<br />
pCiIL<br />
PCSR<br />
PEL<br />
PEMS<br />
PODP<br />
PID<br />
POC<br />
PPE<br />
ppm<br />
PQL<br />
PRG<br />
Pu-239<br />
PVC<br />
QAPP<br />
QNQC<br />
RCRA<br />
RF<br />
RID<br />
RFD<br />
RGA<br />
RI<br />
ROD<br />
rpm<br />
matrix spike/matrix spike duplicate<br />
nonaqueous-phase liquid<br />
National Oil and Hazardous Substances Pollution Contingency Plan<br />
non-detect<br />
National Environmental Policy Act<br />
No Further Action<br />
National Geodetic Vertical Datum<br />
neptunium-237<br />
National Priorities List<br />
Nuclear Regulatory Commission<br />
nephelometric turbidity unit<br />
outside diameter<br />
Oak Ridge Environmental Information Systems<br />
Oak Ridge Sample Management Office<br />
Occupational Safety and Health Administration<br />
Off-Site Waste Release<br />
operable unit<br />
organic vapor analyzer<br />
organic vapor meter<br />
polycyclic aromatic hydrocarbon<br />
precision, accuracy ,representativeness, completeness, and<br />
comparability<br />
polychlorinated biphenyl<br />
picoCurie per liter<br />
Preliminary Characterization Summary Report<br />
permissible exposure limit<br />
Project Environmental Measurements System<br />
<strong>Paducah</strong> <strong>Gaseous</strong> Diffusion Plant<br />
photoionization detector<br />
pathway of concern<br />
personal protective equipment<br />
parts per million<br />
Practical Quantitation Limit<br />
Preliminary Remediation Goal<br />
plutonium-239<br />
polyvinyl chloride<br />
Quality Assurance Project Plan<br />
quality assurance/quality control<br />
Resource Conservation and Recovery Act<br />
retardation factor<br />
reference dose<br />
Request for Disposal<br />
Regional Gravel Aquifer<br />
remedial investigation<br />
Record of Decision<br />
revolutions per minute<br />
ATL\983500002 Contents-FlIlat.r.doc
RPP<br />
RWP<br />
SAA<br />
SAR<br />
SARA<br />
SDWA<br />
SHSO<br />
SI<br />
SMP<br />
SPT<br />
SQL<br />
SVOA<br />
SWMU<br />
TAL<br />
1,1,1-TCA<br />
Tc-99<br />
TCE<br />
TCL<br />
'YCLP<br />
Th-230<br />
TLD<br />
TRU<br />
TSCA<br />
TVA<br />
UCD<br />
U-234<br />
U-235<br />
U-238<br />
VCRS<br />
UF6<br />
USEC<br />
USGS<br />
UST<br />
VOA<br />
WAG<br />
WKWMA<br />
WMP<br />
Radiation Protection Program<br />
radiation work permit<br />
satellite accumulation area<br />
SWMU Assessment Report<br />
Superfund Amendments and Reauthorization Act of 1986<br />
Safe Drinking Water Act<br />
Site Health and Safety Officer<br />
site investigation<br />
Site Management Plan<br />
Standard ,Penetration Test<br />
Standard! Quantitation Limit<br />
semivolatile organic analyte<br />
solid waste management unit<br />
Target Analyte List<br />
trichloroethane<br />
technetium-99<br />
trichloroethene<br />
Target Compound List<br />
Toxicity Characteristic Leaching Procedure<br />
thorium-230<br />
thermoluminescent dosimeter<br />
transuranic<br />
Toxic Substances Control Act<br />
Tennessee Valley Authority<br />
Upper Continental Deposits<br />
uranium-234<br />
uranium-235<br />
uranium-238<br />
Upper Continental Recharge System<br />
uranium hexafluoride<br />
United States Enrichment. Corporation<br />
U. S. Geological Survey<br />
underground storage tank<br />
volatile organic analyte<br />
Waste Area Grouping<br />
West Kentucky Wildlife Management Area<br />
Waste Management Plan<br />
•<br />
•<br />
•<br />
ATL\983500002 Contents-Finatr.doc<br />
xvi
•<br />
EXECUTIVE SUMMARY<br />
In 1998, the U.S . Department of Energy (DOE) conducted a Remedial Investigation (RI) at<br />
three solid waste management units (SWMUs: 001,091 , and 196) and the C-720 Complex in Waste<br />
Area Grouping (WAG) 27 at the <strong>Paducah</strong> <strong>Gaseous</strong> Diffusion Plant (PGDP) in <strong>Paducah</strong>, Kentucky.<br />
The purpose of this activity was to assess the presence, nature, and extent of contaminants at each of<br />
the sites. The investigation focused on source characterization of the surrounding soils and the<br />
potential impacts of contaminants on groundwater. Investigative activities included sampling and<br />
analysis of sediment, surface and subsurface soils, and groundwater.<br />
C-747-C FORMER OIL LAND FARM (SWMU 001)<br />
The C-747-C former Oil Landfarm is a relatively flat, open, grass-covered area in the westcentral<br />
part of PGDP. The landfarm was active from 1973 to 1979. Two roughly parallel disposal<br />
plots are located in the north central part of the SWMU. Use of the landfarm was discontinued in<br />
1979.<br />
•<br />
Trichloroethene (TCE) was found in SWMU 001 soils at a maximum concentration of<br />
439,000 micrograms per kilogram (uglkg) at 15 ft below ground surface (bgs). This concentration is<br />
indicative of a dense, nonaqueous-phase liquid (DNAPL). Lower concentrations of several TCE<br />
degradation products are also present at the site. The areal extent of TCE contamination in the<br />
vadose zone soils on the north side ofthe site is approximately 175 x 115 ft. The TCE-impacted soil<br />
was found to extend from near ground surface to the top of the water table at 50 ft bgs. The volume<br />
of impacted soil is approximately 1,006,000 fe. Metals also were detected in the subsurface soils at<br />
concentrations that were 27 times background levels. The metals are widely dispersed throughout<br />
the SWMU, but the highest metals concentrations are generally restricted to the upper 20 ft of vadose<br />
soil. The maximum volume of soil contaminated by metals covers an area that is 290 x 200 x 28 ft<br />
for a volume of over 1,624,000 fe.<br />
A plume of contaminated groundwater containing as much as 1578 micrograms per liter<br />
(ugIL) of TCE and technetium-99 (Tc-99) at a maximum activity of 3709 picoCuries per liter (pCi/L)<br />
has been identified in the Regional Gravel Aquifer (RGA) at SWMU 001. The contaminant plume<br />
appears to be migrating to the west-northwest (downgradient) and currently extends beyond the plant<br />
security fence. Historically, TCE concentrations at levels of 20,000 ~gIL have been reported from<br />
the RGA near SWMU 001. The full extent of this contaminant plume has not been defined. The<br />
origin of the TCE observed in the RGA groundwater is primarily from leaching of Upper Continental<br />
Deposits (UCD) soils at SWMU 001; the source of the Tc-99 has not been defined. Downward<br />
migration of contaminants from the RGA is not indicated by the results of the field investigation.<br />
UF 6 CYLINDER DROP TEST SITE (SWMU 091)<br />
•<br />
PGDP conducted cylinder drop tests in late 1964 and early 1965 and in February 1979 to<br />
demonstrate the structural integrity of steel cylinders used to store and transport UF 6 • In the first test<br />
period, a brine-ice bath was used to chill one cylinder prior to its drop test. In the 1979 test, a TCE<br />
and dry-ice bath was used to chill one of the steel cylinders. Leakage from an in-ground pit that was<br />
A TU983500003 Exs um.r.doc<br />
ES·l
ES-2<br />
used to hold the TCE refrigerant and cylinder resulted in contamination of shallow soil and<br />
groundwater.<br />
•<br />
The UCD at SWMU 091 was investigated as part of a previous study. WAG 27 conducted<br />
limited sampling of the ditches and the RGA. From the ditch samples only metals and one<br />
radionuclide were detected above screening levels. Cadmium, at 6.53 mg/kg, was the only<br />
constituent found at a level that greatly exceeded background.<br />
No groundwater samples were collected from the Upper Continental Recharge System<br />
(UCRS) at SWMU 091 during the WAG 27 RI. Groundwater samples from the RGA and the<br />
McNairy flow system contained the following at concentrations above screening levels: volatile<br />
organic analytes (VOAs), i.e., TCE and its degradation products; radioactive isotopes; and metals.<br />
Contaminant migration within the RGA occurs predominantly as lateral flow and dispersion<br />
through the Lower Continental Deposits (LCD) as groundwater moves to the west-northwest. A<br />
contaminant plume of TCE and Tc-99 has been identified in the RGA groundwater beneath SWMU<br />
091. The maximum concentration of TCE detected in the RGA groundwater was 112 ugIL. The<br />
maximum activity of Tc-99 detected was 568 pCiIL. Leaching of contaminants from the UCD does<br />
not appear to contribute significant amounts of TCE or Tc-99 to the RGA groundwater. Evidence<br />
also does not suggest that the metals present in RGA groundwater were derived from SWMU 091.<br />
Groundwater samples from the McNairy Formation beneath SWMU 091 contain low levels<br />
ofTCE (1.9 ugIL), thorium-230 (Th-230) (maximum 53.77 pCiIL), and uranium (0.001 mgIL)'<br />
C-746-A SEPTIC SYSTEMS (SWMU 196)<br />
SWMU 196 is located in the north-central portion of the PGDP, on the north side of the<br />
C-746-A Building. The SWMU consists of two underground, out-of-service septic systems.<br />
Eighteen metals were detected above screening levels at SWMU 196. Many of the metals detected<br />
were only slightly above screening values. The area impacted by metals at the NE septic system is<br />
approximately 70 ft x 60 ft (includes septic tank and leachfield) and extends to approximately lOft<br />
bgs. The area impacted by the metals contamination along the NW drain lines is more extensive, and<br />
is approximately 100 ft x 10ft along the line extending north-south to the west of the building and<br />
180 ft x 10ft along the line extending east-west to the west of the septic tank. The contamination<br />
extends to approximately 10ft bgs along both of these lines. The metal most frequently detected<br />
above screening levels was antimony, which was found at a maximum concentration of 121<br />
milligrams per kilogram (mg/kg). Other metals detected above screening levels include beryllium at<br />
a maximum concentration of 113 mg/kg, cadmium at a maximum of 116 mg/kg, and thallium at a<br />
maximum of 114 mg/kg. In the borings drilled at SWMU 196, all of which were less than 50 feet<br />
deep, the water table was not encountered.<br />
•<br />
C-720 COMPLEX<br />
The C-720 Building is located in the west-central area of PGDP and consists of several<br />
repair and machine shops, as well as other support operations. The building was constructed in<br />
1953.<br />
Two separate areas of contamination were identified at the C-720 area. A large rectangular<br />
area impacted by TCE was defined north of the building measuring 1050 ft x 225 ft. An estimated<br />
•<br />
A TU983500003 Exsum_r.doc<br />
98350000
•<br />
ES-3<br />
4,725,000 fe of VOA-contaminated soil was reported from the zone between 17 and 42 ft bgs. The<br />
maximum TCE concentration was 14,000 Ilg/kg. The volume of metals-contaminated soil within<br />
this zone was 660,000 fe.<br />
A second area impacted by TeE was delineated south of the building and measures 825 ft x<br />
150 ft. The volume of VOA-impacted soils is 1,608,750 fe and metals contamination encompassed<br />
more than 312,000 fe. UCD soil south of the building had a maximum TCE concentration of 68,000<br />
Ilg/kg, an estimated maximum 1,2-DCE concentration of 450,000 J.lg/kg, and a maximum vinyl<br />
chloride concentration of 400 J.lg/kg. Several metals were detected above screening levels and<br />
bis(2ethylhexyl)phthalate was reported at a maximum concentration of 1, I 00 Ilg/kg·<br />
A sludge sample collected from the Compressor Shop sump had the highest TCE<br />
concentration (420,000 ug/kg) and the highest Tc-99 activity (27,520 pCilg) detected during the<br />
WAG 27 RI. Metals, 1, I-DCE, bis(2-ethylhexyl)phthalate, PCBs, and radionuclides were also<br />
detected in this sample. Based on the results of this sample, the Compressor Shop Pit sump has been<br />
designated as a SWMU (SWMU 209). Although no releases were identified during the WAG 27 RI,<br />
further assessment is planned.<br />
TCE, at a maximum concentration of 149 ugIL, and small quantities of TCE degradation<br />
products were the only contaminants reported in the UCRS water samples at the C-720 Building.<br />
•<br />
High levels of TCE and Tc-99 were detected in RGA groundwater near the C-720 Building.<br />
However, of these two contaminants, only TCE was present above screening levels in the UCD soils .<br />
Migration of the RGA contaminant plume from the C-720 Complex is to the west-northwest.<br />
Because of the high transmissivity of the RGA, migration of fluids from the RGA into the McNairy<br />
does not appear to be a major groundwater flow path. This is evidenced by the fact that the<br />
contaminant levels found in McNairy groundwater samples were much lower than the levels reported<br />
from the overlying RGA groundwater.<br />
BASELINE RISK ASSESSMENT<br />
For all four sites, the cumulative human health excess lifetime cancer risk (ELCR) and<br />
systemic toxicity exceed the accepted standards of the Kentucky Department of Environmental<br />
Protection (KDEP) and the United States Environmental Protection Agency (EPA) for one or more<br />
scenarios when assessed using default exposure parameters.<br />
The current industrial land use scenario has risk from dermal contact with soil or sediment<br />
that is above de minimis levels at each SWMU, except at the C-720 Building, where contact with<br />
surface soil is not possible and no ditches are present. The primary contaminants driving ELCR<br />
within this pathway are beryllium and radio nuclides (neptunium-237 and cesium-137) for all<br />
locations. Decisions about remedial action based on the dermal contact with soil exposure route<br />
should be carefully considered because of the uncertainty associated with risk from this exposure<br />
route.<br />
•<br />
Risk from use of groundwater (without the risk contribution of lead) drawn from both the<br />
RGA and the McNairy Formation exceeds de minimis levels for all risk scenarios at each site except<br />
SWMU 196, where no chemicals of potential concern (COPCs) were identified.<br />
A TU983500003 Exsum_r.doc<br />
98350000
ES-4<br />
Contaminants of concern (COCs) migrating from soil and groundwater sources as<br />
detennined by risk estimates for future residential groundwater users are phenanthrene, trans- I, 2-<br />
dichloroethene, TCE, vinyl chloride, xylenes, antimony, manganese, silver, thallium, and vanadium.<br />
Based on transport modeling, no radionuc1ide COCs are migrating from the site.<br />
•<br />
The most plausible future land use scenario, industrial use, has risk that is above de minimis<br />
levels at each site. The future industrial land use scenario is identical to the current industrial land<br />
use but also evaluates use of RGA and McNairy Formation groundwater. Addition of groundwater as<br />
a medium of exposure adds significantly to the risk for this scenario.<br />
Metals concentrations in surface soil from SWMU 196 and sediments in drainage ditches<br />
associated with SMWUs 00 1, 091 , and 196 were found to be at levels that may be greater than<br />
protective of nonhuman receptors. Adverse effects are not expected from exposure to radionuc1ides.<br />
RECOMMENDATIONS<br />
Conclusions based on the DQO process and the risk-based decision rules indicate that risk<br />
from exposure to contaminated media exists at SWMUs 001 , 091 , and 196 and at the C-720<br />
Complex. However, these risks do not pose an imminent or immediate threat to human health or the<br />
environment at any of these four locations. Risk-based analysis of data generated during the<br />
investigation indicates that response actions may be appropriate for impacted media at each of these<br />
four sites.<br />
•<br />
•<br />
A TU983500003 Exsum1doc<br />
98350000
•<br />
1. INTRODUCTION<br />
1.1 PURPOSE OF REPORT<br />
The <strong>Paducah</strong> <strong>Gaseous</strong> Diffusion Plant (PGDP), located in western Kentucky ,is an active<br />
uranium enrichment facility owned by the U. S. >Department of Energy (DOE) (Fig. 1.1). On<br />
July I, 1993, DOE leased the plant production operations facilities to the United States Enrichment<br />
Corporation, which in turn contracted with Lockheed Martin Utility Services, Inc. (LMUS) to<br />
provide operations and management services. Lockheed Martin Energy Systems, Inc.~LMES)<br />
managed the <strong>environmental</strong> restoration and waste management activities at PGOP for DOE. On<br />
April I, 1998, Bechtel Jacobs Company @3JC) LLC replaced' ~MES in implementing the<br />
Environmental Management and Enrichment Facilities (EMEF) Program.<br />
•<br />
DOE and BJCLLC have undertaken to identify, investigate, and remediate, as necessary, all<br />
Solid Waste Management Units (SWMUs) and Areas of Concern (AOCs) atPGDP. The regulatory<br />
driver for the Remedial Investigation .@U) to be performed at Waste Area Grouping (WAG) 27 has<br />
been administered by the U.S. Environmental Protection Agency (EPA) and the Commonwealth of<br />
Kentucky via the Resource Conservation and Recovery Act (RCRA) permits issued on July 16, 1991.<br />
The RCRA permit contains provisions of Hazardous and Solid Waste Amendments (HSWA) only,<br />
while the Commonwealth of Kentucky permit contains provisions to address hazardous waste<br />
management as well as the ,provisions of HSWA. The HSWAprovisions require evaluation of<br />
hazardous constituent releases and implementation of interim and fmal corrective measures roaddress<br />
such releases. In June 1994, PGOP was identified as a Superfund site under the Comprehensive<br />
Environmental Response, Compensation, and Liability Act (CERCLA) and placed on the Nationali<br />
Priorities List (NPl.). Both RCRA and CERCLA requirements have been integrated into the Federal<br />
Facilities Agreement ~ A) that has been negotiated by DOE, EPA, and the Commonwealth of<br />
Kentucky. The FFA isa result of PGDP's placement on the NPL.<br />
To facilitate the EMEF process at thePGDP and focus investigations ,toward, ,the most<br />
effective and· efficient remedial actions, operable units (OUs) have been defined. TheseOUs consist<br />
of two types: source control units (i.e., units that may contribute contamination to other units) and<br />
integrator units (i.e., units that "collect" contamination from source control units-in the specific<br />
instance of the PGDP, the groundwater and surface-water units). Five OUs exist at PGDP:<br />
Groundwater, Surface Water, Surface Soil, Burial' Grounds, and Comprehensive Site-wide (DOE<br />
1998b).<br />
This document reports the results of the RI conducted at WAG 27. The WAG 27 area is shown<br />
on Fig. 1.2. WAG 27 consists of four sites that were considered potential TCE DNAPL contributors<br />
on the west side of PGDP. The focus of the RI process was to collect data to define ,the nature and<br />
extent of contamination and to estimate the human health and <strong>environmental</strong> risks associated with<br />
contamination at the source control OUs. Collected data are also necessary to design the appropriate<br />
corrective measures where necessary. nata on the contaminant contribution from the source control<br />
OUs to the integrator OUs were also collected during implementation of the WAG 27 Work Plan.<br />
These data will be incorporated into subsequent studies focusing on remedial action for the<br />
Groundwater and Surface Soil OUs .<br />
•<br />
1·1
1-2<br />
1.2 WAG 27 BACKGROUND INFORMATION<br />
The WAG 27 RI addresses contamination at four sites: SWMUs 001, 091, and 196, and the C-<br />
720 Complex including the building and surrounding. areas.<br />
•<br />
o<br />
o<br />
o<br />
SWMU 001, C-747-C former Oil Landfann, located in the west-central portion of the plant;<br />
SWMU 091, UF 6 Cylinder Drop Test Area, !located in the west-central portion of the plant;<br />
SWMU 196, C-746-A Septic Systems, located in the north-central portion ·of the plant; and<br />
oC-720 Complex located in the southwest portion of the plant, including the Compressor Shop<br />
pit, the backflll areas surrounding the building floor drainage system where these drains exit the<br />
building, and SWMU 167, the White Room sump.<br />
1.2.1 C-747-C Fonner Oil Landfarm (SWMU 001)<br />
SWMU 001 is located in the west-central portion area of PGDP. The landfarm consisted of<br />
two plots of about 1125 sq. ft each that were plowed to a depth of 1 to 2 ft. The area was slightly<br />
depressed, causing superficial depressions to fill with water at times of heavy .precipitation. At some<br />
point, a layer ·of gravel was placed below the soil in the landfarm to improve drainage. A 6 to 12<br />
inch soil cover was placed over the plots following closure in 1979. The extent of the SWMU<br />
includes the area bounded by 4th Street to the east and by perimeter ditches on the north, west, and<br />
south. The total area is estimated to be 96,300 sq. ft.<br />
The landfarm was used for at least 6 years, from 1973 to 1979, for the biodegradation of waste<br />
oils contaminated with TCE, trichloroethane (l,l,l-TCA), uranium, and polychlorinated biphenyls<br />
(PCBs). It is estimated that at least 5000 gallons of waste oil was applied to the landfarm;oil was<br />
added at 3- to 4-month intervals. The sources of the waste oils were not reported, but it is assumed<br />
the oils were from virtually all areas of the plant.<br />
•<br />
Portions of SWMUOO1 were·characterized in previous investigations. In the CERCLA Phase I<br />
and 'II Site Investigations (SIs) (CH2M HILL 1991 and 1992), the landfarm was investigated. This<br />
study included a geophysical survey to locate the formerlandfarm plots, four Regional Gravel!<br />
Aquifer (RGA) soil borings, 10 shallow soil borings, and the installation of four monitoring wells.<br />
The geophysical survey identified several anomalies. Subsequent to the Phase I and 'II SIs, SWMU<br />
001 surface soil was re-evaluated as part of the WAG 23 RI. The results of the previous<br />
investigations are discussed in Sect. 4.2.1.3.<br />
Based on the review of available infonnation,three data gaps were identified at SWMU 001.<br />
Closing these gaps would allow for (1) development of a more accurate representation of the levels<br />
of contamination in the ditches surrounding the .unit, (2) determination of the origin of geophysical<br />
anomalies within the fonner oil landfarm, and (3) the extent of subsurface soil contamination at<br />
SWMUOOI and the potential impact associated with the leaching of these contaminants to the Upper<br />
Continental Recharge System (UCRS) and RGA groundwater.<br />
1.2.2 UF,Cylinder Drop Test Area(SWMU 091)<br />
SWMU 091 is located in the western portion of the fenced area of the PGDP. It is situated<br />
between the south side of the C-745-B cylinder yard and Virginia Avenue.<br />
•<br />
ATLJ983S00004 Secl:..r.doc
1-3<br />
PGDP conducted cylinder drop tests in late 1964, early 1965, and February 1979 to<br />
demonstrate the structural integrity of steel cylinders used to store and transport UF6• In the tests, a<br />
crane lifted the cylinders toa specified height and l dropped them on a concrete and steel pad to<br />
simulate worst-case transportation accidents. Deformation of the cylinders was documented, and<br />
these tests supported application for an interplanttransportation permit.<br />
Drop tests were used to.assess the effect of low temperatures on cylinder integrity. In the first<br />
test period, .a brine-ice bath was used to chill one cylinder prior to its drop test. In the 1979 test, a<br />
TCE and dry-ice bath was used to chill one of the steel cylinders. Leakage from an in-ground pit,<br />
used to hold the TCE refrigerant and cylinder, resulted in contamination of shallow soil and<br />
groundwater.<br />
Soil and groundwater s~ling took place during various investigations, including the Phase<br />
I and' U Sis . and the LASAGNA Technology demonstration. In general, many samples (Le., more<br />
than 25) have been. collected from soil associated with SWMU 091. However, fewer.groundwater<br />
samples, except those analyzed for TCE and Tc-99, have lbeen collected from this area. Resultsof<br />
the previous sampling for SWMU 091 are summarized in Sect. 4.2.<br />
•<br />
On the ,basis of available data, the nature and extent of contamination in SWMU 091,as well<br />
as its potential for release of contaminants to the environment, have been reasonably well<br />
characterized, especially with respect to TCE.. Sediment in the ditches that convey surface .runoff<br />
away from the TCE-impacted area had not been investigated. This data gap was to be filled during<br />
WAG 27 activities. To confirm that TCE contamination at the site had not been mobilized by<br />
remedial measures (e.g., LASAGNA TM demonstration) and to confmn that TCEhad not migrated<br />
downward to further contaminate the RGA groundwater, two deep soil borings were installed<br />
downgradient of SWMU 091 during WAG 27 RI activities. Results of the deep soil borings are<br />
presented in Sect. 4.2.5.3.<br />
1.2.3 C';746-A Septic Systems (SWMU 196)<br />
SWMU 196 is located in the north-central portion of the PGDP, on the north side of the C-746-<br />
A Building, The SWMU consists of two underground, out-of-service septic systems. On the<br />
northeast comer, the septic system consists of a 960-gal septic tank (rectangular: 40 in. wide x 84 in.<br />
long x66 in. deep} that feeds a 60-ft x20-ft leachfield. The leachfield consists of 4-in. drain tiles in<br />
shallow soil.<br />
C-746-A was used' as a warehouse during plant construction. Subsequent operations consisted<br />
primarily of metal storage and smelting. From 1956 until 1985, an aluminum smelter was operated<br />
in the west end of the building and from 1975 until 1985, a nickel smelter was operated in the east<br />
end of the building. Current operations include storage of hazardous and. PCB waste.<br />
•<br />
The northeast septic system was in operation from April: 1958 to February 1980. The septic<br />
system originally processed sanitary waste from a toilet, a urinal, a bathroom .floor drain, and a<br />
bathroom sink. Modifications were made in August 1975, when a change house and break area were<br />
added as part ·of the nickel smelter operation. The septic system then .processed sanitary waste from<br />
a kitchen sink,a water cooler, two showers, a' second urinal, and the change house floor drains,as<br />
well as the original toilet, ,urinal~bathroom floor drain, and bathroom sink. In 1980, the septic<br />
system was plugged and abandoned in place when C-746-A was tied into the C-615 sewage<br />
treatment plant system.
1-4<br />
The northwest septic system was in operation from November 1956 ,to February 1980. The<br />
system pr:ocessed sanitary waste from a ,toilet, two showers, a sink, and a water ,cooler installed<br />
shortly after construction of the aluminum smelter operation, No floor drain system exists in the<br />
area. In 1980, the septic system was plugged and abandoned in place when C-746-A was tied into<br />
the C-615 sewage treatment ,plant system. In :1982, regrading of a drainage ditch on 'the west end of<br />
C,·746-A resulted in the destruction of. approximately 25 ft of the vitreous clay pipe. Some sanitary<br />
waste that was in. the 4-in. line. upgradient(28 ft)at the itime of abandonment in 1980 may have been<br />
released to the,sediments of the drainage ditch.<br />
'.<br />
SWMU 196 was first defmed'in 1993. Due to its recent addition, it was not one ·of the areas<br />
sampled during the CERCLAPhase I and n SIs and no subsequent investigation has provided<br />
sufficient information to characterize the septic systems. SWMU 196 was placed in WAG 27 to<br />
investigate the ,possibility that potential releases of TCE through the sanitary septic system could ,be<br />
a contributing source to the U'CRS and. to the TCEplume in the RGA emanating from theC-746-A<br />
area.<br />
1.2.4 C-720'Complex (Compressor Shop Pit,SWMU 1'67, and Floor Drain ExitPoints)<br />
The C-720Bliilding is located in the west.:central area of 'PGDP to the southwest of theC400<br />
Building. The C-720 Building consists of several repair and i machine shops, as well as other support<br />
operations. The building was .constructed in 1953, with a. total area of 281,200 sq ft. Five SWMl]s<br />
are associated with this building. SWMU 090 (an underground petroleum naphtha pipe) and:SWMU<br />
141 (an inactive TCE degreaser) have been designated as No Further Action (NFA) in the Site<br />
Management Plan, or'SMP (DOE ,1998b). SWMl!J.027 (acid neutralization tank) is being addressed<br />
under WAG 9, and SWMU 031 (compressor ,pit storage tank) is being addressed under WAG 5.<br />
WAG 27 deals with .SWMU 167 (White Room sump) and the Compressor Shop pit. The<br />
Compressor Shop pit,. which is Ilocated in the eastern portion of the C-720 Building, has been<br />
designated as SWMU 209 based on the results of 'the WAG 27 RI. WAG 27 also addresses the<br />
backfiU areas around the major exit points from:the· building drainage system. The building drainage<br />
system discharges to the plantstormwater system.<br />
The White Room sump was sampled' during two separate events. During :thefirst event<br />
(:July 1992)~ the sludge was analyzed for total: cyanide to establish if Ihealth threats in theC-nO<br />
Building existed and to provide guidance for future sampling events. Cyanide compounds were not<br />
detected. The sump sludge was sampled a second time in December 1:992 and was analyzed for<br />
RCRA corrosivity parameters, RCRAignitability ,paran1eters, RCRA reactivity parameters, TCLP<br />
metals, 'FCLP volatile organics, 'FCLP .semivolatile organics, bulk metals, raw volatile organics<br />
including bulk TCE, bulk semi volatile organics, PCBs, and radionuclides.<br />
A monitoring well pair (MW-203and MW-204) was installed ,to the northeast of ,the 'C-720<br />
Building during theCERCLAPhase D SI to assess contamination associated with SWMUs 027 (add<br />
neutralization tank) and 141 (an inactive iCE degreaser) ..<br />
The C-720 Complex was included in the WAG 27 RI because it was recognized asa possible<br />
source of 'fCE in the southwestern part of the plant during the Phase 'IV groundwater investigation.<br />
A,detailed discussion of release :potential is included in Sect. 4.2.4.3.<br />
•
•<br />
1.3 PROJECT SCOPE<br />
1-5<br />
The scope of the WAG 27 field effort included conducting a RI at the C-720 Complex and<br />
three SWMUs located within the fenced security area at PGDP. The primary focus was to collect<br />
sufficient infonnation about surface and subsurface soil and the shallow groundwater of the UCRS<br />
to support an assessment of risks to human health and the environment and the selection of actions to<br />
reduce these risks, if required. In addition, contamination in the RGA was characterized during the<br />
RI to determine whether contamination in the RGA acts as a secondary source area. The uppermost<br />
50 ft of the McNairy Fonnationwascharacterized. AU data collected during the WAG 27 RI will be<br />
evaluated and incorporated as appropriate in future PGDP remedial' action planning documents.<br />
Within this scope, the goals of the WAG 27 RI were to:<br />
o<br />
characterize the nature of contaminantsource materials;<br />
o. defme the nature, extent (vertical and lateral), and magnitude of source area contamination in<br />
soils, sediments, and groundwater.<br />
•<br />
o<br />
o<br />
o<br />
identify and defme the extent of hot spots of groundwater contamination and migration trends;<br />
determine the presence, general location, if possible, and magnitude of any dense,non-aqueous<br />
phase liquid (DN~L) zones;<br />
provide sufficient information associated with the C-720 Building and three SWMUs to support<br />
a baseline risk assessment for WAG 27, the groundwater OU, and the surface-water au; and<br />
• gather adequate data to analyze contaminant transport mechanisms and support a feasibility<br />
study (FS).<br />
1.4 REPORT ORGANIZATION<br />
Sect. 1 of this report has presented a brief overview of the four sites, as wen as the rationale for<br />
RI field sampling. This section also discussed current and past activities conducted at PGOP.<br />
Sect. 2 describes the in:vestigative methods used to sample the various media, the analytical<br />
sampling parameters, and. the historical waste management practices at each of the four sites<br />
covered under ,this investigation.<br />
Sect. 3 details the physical characteristics of each SWMU, including the topography, surfacewater<br />
hydrology, geology, and hydrogeology. In addition, a description of the meteorology,<br />
ecology, demography, and land use at PGOP is ,presented.<br />
•<br />
Sect. 4 presents a discussion of the nature and extent of the contamination at each site as<br />
concluded from analyses of the ' data collected during the investigation. The history of contamination<br />
as found in previous investigations is also presented.<br />
ATU983500004 SeCl_r.doc
1-6<br />
Sect. 5 ,presents a discussion of the fate and transport of the contamination at each site. A<br />
conceptual site model has been developed in which exposure ,pathways of potential concern are<br />
discussed and contaminant .persistence is evaluated. Models of contaminant transport are also<br />
presented.<br />
•<br />
Sect. 6 presents the results of a baseline risk assessment, including results of previous studies,<br />
identification of contaminants of concern (COCs), the exposure assessment, the toxicity assessment,<br />
the risk characterization, conclusions, and site-specific ·remedial action goals. Also included in Sect.<br />
6 are the results of a baseline ecological risk assessment, including identification of contaminants,<br />
receptors, and exposure pathways of ·concern; any site that poses no risk; any site that may require<br />
immediate action; and any site that requires further investigation, as well as the data gaps that must<br />
,be filled to complete suchan investigation. The final sections (7 and 8) present the conclusions and<br />
references, respectively, of this report. Figures and· tables, in that order, appear at the end·of sections<br />
in which they are referenced.<br />
Volumes 2 and 3 present appendix material: referenced in this volume. Volume 4 presents the<br />
baseline risk assessment.<br />
•<br />
•<br />
ATlJ983500004 SecCr.doc<br />
----------
LEGEND<br />
c a ·.-a fe-'f ,~ ft.<br />
Kentucky<br />
Ē ----------- ----.---.-.---.<br />
-:-:~-:-::-:-<br />
-.-----.---.---<br />
DOH llBSEltVAllON<br />
WJLDL1PB JU.NAGBYBNT<br />
ABBAS . .. ..--.<br />
TVA LAND<br />
TRUE<br />
NORTH<br />
PLANT<br />
NORTH<br />
NOTtosCALB<br />
Fig. 1.1. PODP location map.<br />
•
•<br />
•<br />
:r:<br />
l<br />
E<br />
o<br />
" HZ<br />
t \ l;<br />
\\20"~ 0<br />
500<br />
1000<br />
~~~-<br />
i.<br />
1-<br />
Fig. 1.2. 1be C-720 Area and SWMUs included in the WAG 27RL<br />
•
•<br />
2. FIELD INVESTIGATION<br />
This section presents a description of the field investigation activities and methods used during<br />
the WAG 27 RI. Major topics include sampling activities. procedures. and equipment. as well as analyses<br />
conducted on the samples.<br />
All sampling at PGOP was conducted in accordance with the medium-specific procedures set<br />
forth in. the <strong>Paducah</strong>.EnvironmentaI Management and Enrichment Facilities (EMEF) Program Procedures<br />
Manual. These procedures are consistent with EPA Region IV Standard Operating Procedures<br />
(EPA 1996). Table 2.1 is a list of the PGOP procedures that provided guidance for the WAG 27 RI.<br />
2.1 TRENCHING ACTWITffiS<br />
•<br />
COM Federal Programs perfonnedtrenching activities at SWMUs 001 and 196 between January<br />
20 and February 6, 1998. Field activities included excavation of test pits at SWMU 001 and septic tanks<br />
at SWMU 196. Excavations were completed using a Nissan N21SS Mini-Giant excavator and a Case<br />
580L backhoe. All soil removed during the excavations was returned to the excavation following<br />
sampling to minimize waste generation. A site safety professional monitored all trenching activities using<br />
a photoionization detector (PID) for volatile organic compounds (VOAs) and a Geiger-Muller device for<br />
radioactivity. Five soil samples. including duplicates. were collected at SWMU OOL Seven sludge<br />
samples were collected from the septic tanks at SWMU '1·96. The SWMU 196 septic tanks were emptied<br />
and abandoned in place. Complete details of these activities are included in the report in Appendix F.<br />
Table 2.2 indicates the number of samples by sample type collected at each site.<br />
2.2 SEDIMENT SAMPLING METHODS<br />
Sediment samples were collected from the uppermost 1 ft ·of soil in accordance with PGOP<br />
Environmental Restoration and· Waste Management (ERWM) Field Operating Procedure (FOP) PTSA-<br />
4201. Surface Soil Sampling. Sediment samples were collected using a4-in.-outside-diameter (0. D.)<br />
stainless-steel buckethand auger.<br />
•<br />
Before a sediment sample was collected. plastic sheeting was ,placed over the sampling location.<br />
A hole was then cut through the :plastic and the upper 1 to 2 in. of soil or grass was removed to expose<br />
,fresh material. No aIiquots for volatile organic analyte (VOA) analyses were collected from sediment<br />
samples. The sediment was placed into a stainless-steel bowl and mixed thoroughly; a representative<br />
composite sample was then prepared in accordance with PTSA-4204. Composite Sample Preparation.<br />
After the sediment samples were containerized, a site safety professional field-scanned .the container using<br />
a direct-measure radioactivity meter. wiped the;container to determine radiation activity. and compared<br />
the readings against the free release criteria. A label was then affixed to the container and secured with<br />
tape. and the container was placed in a zippered plastic bag. The bags were then packed in ice within<br />
coolers and kept at a temperature of 4°C ± 2°C. A total of 13 sediment samples were collected'during<br />
the WAG 27 RI. Table 2.2 indicates the number of samples by sample type collected at each site .<br />
A TU983500005 Sec2J.doc 2-1
2.3 SURFACE ANDSUBSURF ACE SOIL SAMPLING METHODS<br />
2-2<br />
Surface and shallow subsurface soil samples were collected during the WAG 27 RI. Surface soil<br />
samples were collected in. accordance withPGDP ERWM FOP CP4-ER..:SAM4201, Collection of<br />
Sediment/Sludge Samples. This procedure was revised, and' replaced: with PTSA-4201, Surface Soil<br />
Sampling, on December 22, 1!997. Subsurface soil samples were collected in accordance with IPGDP<br />
ERWM FOP CP4-ER-SAM4202. Subsurface Soil Sampling, and EPA Region IV protocol (EPA }996~.<br />
The PGDP procedure was revised and replacedwithPTSA-4202, Subsurface Soil Sampling, on June 6;<br />
}997. Direct push technology (DPT) was used to collect surface and subsurface soil samples during the<br />
WAG27IU.<br />
•<br />
Before sampling was conducted ateach1site, plastic sheeting was placed on the sampling !Iocation<br />
and a hole cut through the plastic. Asphalt- and concrete-covered areas were. cored to expose the<br />
underlying soil. Surface· debris and the upper I, to 2 in. of soil were removed to expose fresh material.<br />
The majority of the shallow subsurface soil samples were collected using a nPT rig.<br />
DPT methods significantly minimized the volume of waste soil cuttings generated. Soil samples were<br />
collected using a 2-in.-O. D. 4-ft-Iong Geoprobe Macro-core continuous sampler fitted withc1earacetate<br />
liner. The sampler was. advanced in 2- and 4-ft intervals. Once a section of soil was collected in the<br />
sampler, the sampler was removed from the subsurface and detached. Before the sampler was opened~<br />
the entire sample (with additional, focus on the ends) was. screened 1 bya site safety professionaifor volatile<br />
organic vapors using a flame ionizationlphotoionization detector. The sampler was .also measured for<br />
alpha radioactivity emissions and betalgamma,radioactivity emissions.<br />
A new procedure, 'Environmental Radiological Screening,' was used' to screen subsurface soils.<br />
A sodium iodide (NaI) detector was used as a field screening instrument to identify areas ,of elevated<br />
radioactivity. Environmental, samples were collected for gamma spectroscopy and Tc-99 analysis when<br />
the radioactivity of the soil exceeded twice backgroliiidas measured with the Nal detector. These samples<br />
were submitted for isotopic and radioactivity determination. Soil samples collected from proposed<br />
intervals. that did not exceed: twice background were'submitted for Tc-99 analysis only. QAlQC samples<br />
(duplicates) were submitted for isotopic analysis to'confirm field screening results.<br />
•<br />
Samples were collected at 2-ftintervals at SWMU ,}'96 and 5~ft intervals at SWMU 001 and: the<br />
C-720 Building. VOA samples were collected first. VOA samples were collected for both. the off-site<br />
fixed-base laboratory and an on-site,Close Support Laboratory (CSL) using a veterinary syringe (with the<br />
end .cut off) to transfer,the soil from the fresh cut end of the liner to a 40-mL vial containing deionized<br />
(D. I.) water and hexane. The vial was sealed, labeled, and immediately placed on ice. Fifteen VOA<br />
samples were also collected for fixed-base laboratory analysis and consisted of a 6-in cut section of the<br />
acetate liner that was capped, taped, labeled:, and immediately placed: on ice. Subsurface soil samples<br />
collected for analyses other than VOAs were placed into stainless-steel bowls and mixed thoroughly. This<br />
representative composite sample was placed ;into appropriate sample container(s). These composite<br />
samples were prepared in accordance with PGDP Procedure PTSA-4204, Composite Sample 'Preparation.<br />
In most cases, the entire soil core was needed to fill the sample containers, significantly :reducing the<br />
waste generated during the RI.<br />
After the subsurface soil samples were containerized, a site. safety professional field-scanned the<br />
container using a direct-measure radioactivity meter, wiped the container to determine radiation activity,<br />
and compared the readings against the free release criteria. A label was then affixed to :the container and<br />
•<br />
ATU983500005 Sec:U.doc
2-3<br />
secured with tape, and the container was placed in a zippered plastic bag. The bags were then packed in<br />
ice within coolers and kept at a temperature of 4°C ± 2°C.<br />
One set of 4 subsurface soil'samples was collected using a 4-in. O.D. stainless-steel bucket hand<br />
auger at SWMV 196, location 196-003. Samples were collected at 2-ft :intervals.to a depth of 8 ft.<br />
Additionally, soil samples from location 720~30 were collected using 3-inO, D. split spoons through<br />
4.25-in inside diameter ~1. D.) hollow stem augers. Sample collection methods were identical to those<br />
used at the other subsurface sampling locations. Soil samples for chemical analysis were collected' only<br />
from the upper 50-ft. Samples for grain size analysis were collected' from the RGA at SWMUsOOl and<br />
091 via the Dual Wall Reverse Circulation (DWRC) rig's cyclone separator. Cuttings discharged through<br />
the separator were collected in a bucket and transferred to the sample container. Because of this<br />
technique, these samples are only somewhat representative of the formation grain size due to the<br />
disturbance and destruction caused by the drill: rig. However, the relative differences in grain size in the<br />
RGA can 'be approximated from these data.<br />
A total of 13 surface soil samples (all from SWMU 196) and' 424 subsurface soil samples ranging<br />
in depth from 2 to 50 feet were collected during the WAG 27 RI. Twenty-eight.grain size samples were<br />
collected from the RGA at depths from 55 to 1 00 ,ft. Table 2.2 indicates the number of samples by sample<br />
type collected at each site. Completed lithologic logs are included in Appendix A.<br />
•<br />
2.4 CONE PENETROMETER TESTS<br />
R.E. Wright Environmental used a 10-ton electronic subtraction cone to perform Cone<br />
Penetrometer Tests (CPTs). The CPT consisted of thrusting the cone into the soil at a constant rate of<br />
2 cm/sec. Measurements of tip bearing stress or resistance (Qc), Sleeve Friction (Fs), inclination (n, and<br />
pore pressure (u) were recorded at 5-cm intervals during the test to provide a nearly continuous<br />
stratigraphic log and interpretive Standard Penetration Test (SPT) N values. The data were transmitted<br />
as analog voltage signal via a cable (inside a rod string) to a computer data,acquisition system located on<br />
the CPT rig. All CPTs were perfonned in accordance with American Society for Testing and Materials<br />
(ASTM) standard ~D5778); Two CPT points at the C-720 Building, four points at SWMU OOII, and one<br />
point atSWMU 196 were completed during the RI. The complete report is included as Appendix E.<br />
2.5 BOREHOLE GROVNDW ATER GRAB SAMPLES<br />
Collection of borehole groundwater grab samples was attempted when shallow groundwater was<br />
encountered, L e.,
2-4'<br />
Borehole groundwatergrab,samples of the deep groundwater (i.e., >50-ft deep) were collected<br />
during drilling using the DWRC method. Boreholes drilled by the DWRC method were blown free of<br />
standing water before purging and sampling.<br />
•<br />
Purging and sampling were completed using a QED WeU Wizard bladder pump. The use of<br />
these pumps allowed low-:flow-ratepurging and! sampling, which significantly reduces the turbidity of<br />
the sample and results. in more ,representative metals concentrations.<br />
Selected water quality parameters including pH,temperature, dissolved oxygen (DO), and<br />
specific conductivity were monitored during purging and sampling using a QED water quality logger<br />
equipped with an,in-line flow cell. Purging was discontinued when (l}pH stabilized to within 0.10 unit,<br />
(2) specific conductivity stabilized to within 10 micromhos per centimeter (J.1mhos/cm), and (3)<br />
temperature stabilized to within 10 :percent.<br />
All samples were collected directly into appropriate sample containers from the discharge line<br />
of the pump~ VOA samples were collected ,first at a flow rate of approximately 100 mUmin. Samples<br />
for other parameters were collected at a flow rate of approximately TUmin. For some sampling intervals,<br />
the recharge rate was very slow and purging was not feasibleor·could not be completed. Several samples<br />
were collected through the bladder pump before adequate purging or by using a disposable 'Feflonbailer.<br />
These samples are identified in Table 2.3. After the borehole groundwater grab samples were<br />
containerized, a site safety professional field-scanned the container using a direct-measure radioactivity<br />
meter; wiped the container, and.compared the readings against the free release criteria. A label was then<br />
affixed to the container and secured With tape, and the container was placed in a zippered plastic bag. The<br />
bags were then packed in ice within coolers and kept ala temperature of 4°C ± 2°C.<br />
Two-hundred-thiny-eightgroundwater samples were collected: during the WAG 27 RI.<br />
Completed lithologic logs are included in Appendix A.<br />
2.6 PIEZOMETER INSTALLATION<br />
Five piezometers were installed at depths ranging from 83 ,to 85 feet during the WAG 27 RI. The<br />
piezometers were constructed with 1.5-in. diameter polyvinyl chloride (PVC) well screens and casing.<br />
Construction materials were selected' in accordance with the requirements and specifications ofPGDP<br />
IProcedure PTSA-4305-IAD, Filter Pack and Screen Selection for Wells and Piezometers. Piezometers<br />
were installed using aCME 85 hollow stem auger rig. lihe purpose of the piezometers was to measure<br />
the potentiometric surface of the RGA in the C-720:area. Waterlevel measurements were recorded twice,<br />
the second time to confirm the first measurements, and are presented in Table 2.4. Construction diagrams<br />
are included with the !boring logs in Appendix A.<br />
The .piezometer at location 720-012 was finished above ground surface witha4":in. protective<br />
steel casing and I-ft x l-ft x 6-in. thick concrete pad. The remaining piezometers, located in ,high traffic<br />
areas or on concrete, were finished below ground surface with a flush-mount vault sealed with concrete.<br />
Piezometers were surveyed in accordance with the PGDP Procedure 'PTSA-30B-JAD, Site Surveying .<br />
•<br />
ATIl983500005 Sec2_r.doc
2.7 SLUDGE SAMPLING METHODS<br />
Sludge samples were collected in accordance with PGDP Procedures, Collection of<br />
Sediment/Sludge Samples. Sludge samples were collected from ,the septic tanks atSWMU 1'96 and from<br />
the sump in the Compressor Shop pit at the C-720 Building. Details of the septic tank sampling are<br />
provided in Appendix F. The sump sampled at 'the C-720 Building is located below a staircase in the<br />
northwest comer of the Compressor Shop pit. The area is designated as a "Radiation Contamination<br />
Area," and the work was performed in accordance with the appropriate health and safety and mdiation<br />
work permit (RWP). For the sample collection event, a site safety professional continuously monitored<br />
for radioactivity and organic vapor emissions. The samplers donned the appropriate Personal Protective<br />
Equipment (PPE) as designated by the RWP to enter the Compressor Shop pit, but did not enter the sump.<br />
•<br />
The samples were obtained by connecting two 'IO-ft lengths of schedule 80 PVC pipe and<br />
securing a glass sample jar to the pipe using duct tape. The jar was then extended to the bottom of the<br />
sump to collect the sludge. When the .sludge was retrieved, it was placed in a stainless-steel bowL<br />
Aliquots for VOA analysis were immediately transferred to theappr()priate sample containers. Aliquots<br />
for analyses other than VOA were mixed thoroughly. This representative composite sample was placed<br />
into appropriate sample container(s). These composite samples were prepared in accordance withPGDP<br />
Procedure PTSA-4204, Composite Sample. A site safety professional then field-scanned the container<br />
using a direct-measure radioactivity meter, wiped the container to determine radiation activity, and<br />
compared the readings against the free releasecriteria~ A label was then affixed to the container and<br />
secured with tape, and the container was placed in a zippered plastic bag. The bags were then packed in<br />
ice within coolers and kept at a temperature of 4°C ± 2°C.<br />
2.8 ANALYTICAL METHODS<br />
During the analytical program for the WAG 27 Rt the following laboratories were used:<br />
• Close Support Labomtory (CSL) located on-site equipped with 2 gas chromatographs (GCs), one each<br />
for screening soil and groundwater samples;<br />
• CSL located on-site equipped with a gas proportional radioactivity counter for gross alpha and gross<br />
beta screening of soil, water, and wipe screens;<br />
o<br />
Fixed-Base Labomtory for soil and groundwater samples (Core Labomtory in Aurora, CO and LMUS<br />
C-710 laboratory and K25 lab for soil~;<br />
• Fixed-Base Laboratory for geotechnical samples (Southwest Research Institute, San Antonio, TX).<br />
•<br />
Previous sampling has allowed the development of a list of chemicals of potential concern<br />
(COPCs) associated with WAG 27. CSL screening techniques permitted adequate measurement of<br />
contaminant levels while reducing the overall cost of field and analytical services for the WAG 27 RI.<br />
Iilparticular, field screening was relied upon to assess the presence of VOAs, radionuclides, and IPCBs.<br />
An on-'site GC using SW846 methods (EPA 1986) was used to perform field screening for VOAs.<br />
Immunoassay analytical kits were used for on-site field screening for PCBs. A nuclear spectroscopy<br />
analyzer was used to perform field screening for gross alpha, beta, and gamma activities. Samples of<br />
groundwater for metals analysis were collected only if the conductivity was greater than 400 ~rnhos/cm.<br />
A TLJ983500005 Sec2_r.doc
2-6<br />
In addition, a minimum of 10% of the sample total (by medium) were split and submitted to an<br />
off-site fixed-base laboratory for analysis. These samples provided definitive data to confirm the results<br />
from the CSL screens. A separate sample aliquot was collected from each sample interval scheduled for<br />
off-site fixed-base laboratory analysis. This sample aliquot was analyzed at the CSL radiochemistry<br />
laboratory, where it underwent.radiation screening. A wipe sample also was collected from the exterior<br />
of each sample container. The WAG 27 RI sample shipping team detennined whether the samples could<br />
be shipped off-site for analysis based on wipe samples and radiological screening sample results<br />
compared to the U.S. Department of Transportation (DOT), 'International Air and Transportation<br />
Association ~IA TA), and DOE-specified limits. The DOT project specialist also prepared the shipment<br />
in accordance with DOT and lATA regulations for shipment of dangerous goods, if warranted.<br />
•<br />
2.S.1 Close Support Laboratory Methods<br />
A CSL was mobilized to analyze soil and groundwater samples. The samples were analyzed for:<br />
• VOA,<br />
• PCB screening, arid<br />
• Gross alpha and gross beta activity.<br />
Equipment. GC analysis was ,performed using two Hewlett-Packard HP5890 series U GCs. Owens<br />
Illinois electrolytic conductivity detectors (Models 4420 and 5200) were used for the assessment of TCE<br />
and its degradation products. One GC was used to analyze VOAs in soil' samples, and the other to<br />
analyze VOAs in water samples.<br />
Immunoassay analytical, kits manufactured by HACH Chemical Companyor:by Strategic Diagnostics<br />
Incorporated were used to assess levels of PCB contamination in soil samples.<br />
•<br />
Gross alpha and gross beta assessments were performed using a Tennelec Series 5 Low Background<br />
GasProportionai Counter.<br />
Methods. Table 2.5 indicates the types of analyses performed in the CSL.<br />
CSL VOA Analysis for Soil Samples
2-7<br />
o Eastern Environmental Radiation Facility, Radiochemistry Procedures Manual, EPA 5201 5-84-006,<br />
(EPA 1984); and<br />
o<br />
Environmental Measurements Laboratory Procedures Manual, HASL-300(DOE 1'982).<br />
Sample Requirements. Table 2.6 indicates the analytical methods and sample requirements for<br />
CSLanalysis.<br />
2.8.2 Fixed-Base Laboratory Methods<br />
Core Laboratory and Lockheed Martin Utility Services C-71 0 laboratory performed fixed~base<br />
laboratory analyses of soil and groundwater samples. these laboratories were contracted through the<br />
DOE Oak Ridge Sample Management Office (ORO-SMO) and are DOE-approved, Nuclear Regulatory<br />
Commission licensed laboratories. SW-846 methods were used for all samples, except those parameters<br />
for which other methods are necessary. The analysis followed SW -846 protocols and "Forms Only" data<br />
packages were provided along with electronic data deliv~rables. Table 2.7 summarizes the analytical<br />
methods and sample requirements of the fixed-base laboratories.<br />
2.8.3 Analytical Data Quality<br />
Precision, Accuracy, Representativeness, Completeness, and Comparability. An assessment<br />
of the precision, accuracy, representativeness, completeness, and comparability of field measurements<br />
and analytical data was .performed. The results of this assessment are discussed below.<br />
o<br />
o<br />
Precision. "Precision" is defined as the degree of agreement between repeated measurements<br />
of one property using .the same method or technique. Duplicate samples are collected as a measure<br />
of precision of .thesample collection and analytical process. For this field program, duplicate<br />
samples were collected for all media, at a frequency of 5%. Table 2.8 contains summary information<br />
on the WAG 27 data precision.<br />
Accuracy. "Accuracy" is defined as the degree of agreement of a measurement with an accepted<br />
reference or true value. Accuracy·of laboratory analyses is estimated: through the analysis of blank<br />
spikes, matrix spikes, or surrogate spikes. These laboratory .quality control (QC) samples are<br />
analyzed as required by the appropriate analytical method.<br />
• Representativeness. "Representativeness" is defined as the degree to which data accurately and<br />
precisely represent the nature and extent of contamination. The data·collected during the RI were<br />
both accurate and precise. As indicated' in Sect. 2.8.3, the samples required in the WAG 27 RI<br />
Work Plan. to define the nature and extent of contamination were collected. Based on the criteria<br />
noted above, the data from the WAG 27 RI' were deemed representative.<br />
•<br />
• Completeness. "Completeness" is defined as a measure of the amount of valid data obtained from<br />
a measurement system compared to the amount that was expected to be obtained. In this RI,<br />
"completeness" refers to the percentage of valid measurements versus the total measurements<br />
planned. The Quality Assurance Project Plan (QAPP) specified a completeness objective of 90%<br />
for the analyses performed. The WAG 27 RI achieved completeness above 97% .<br />
•<br />
Comparability. "Comparability" is defined as .the degree .of confidence with which one data set<br />
Aru983500005 Sec2_r.doc
2-8<br />
can be compared to another. Data collected for this investigation were generally collected according<br />
to ,the RI Work Plan and' QAPP, and all field ,changes were approved' by LMES.<br />
•<br />
Surveillances. HJC LLC and CH2M HILL conducted surveillances of the field activities and the<br />
CSL. Surveillance covered the followingareas:CSL activities, sample management activities, log<br />
keeping and chain-of-custodydocumentation, equipment decontamination, waste. management activities,<br />
sampling activities, implementation of quality-assured data policies, and well installation and<br />
development. CH2M HILL, as requested, corrected the findings that were identified. The ORO-SMO<br />
conducted laboratory surveillance ·of the fixed~base laboratories.<br />
Data Quality (i)bjectives. Data quality objectives (DQOs) are qualitative and quantitative<br />
criteria used to establish requirements for sample' collection and analysis and are based on the intended<br />
uses of the data. The overall intent of DQOs is to generate data of appropriate quality to support the<br />
assessment of risks to hUinan health and the environment and the selection of remedial actions.<br />
DQOs were documented in the approved WAG 27 RI Work Plan and were implemented as documented<br />
in the Field Sampling Plan and QAPP.<br />
The DQO process was used to focus the sampling strategy on SWMU-specific media,<br />
contamination and migration pathways. In addition, this process was used to identify the data<br />
requirements for the potential' remedial action alternatives and' FS.<br />
Decisions to be made during the RI process include a determination of whether releases have<br />
occurred and whether remediation of the site will be required. Risk-based analysis of data generated<br />
during the WAG 27 investigation was used to make one of three decisions for each of,the sites:<br />
1. Where no contamination or contamination not presenting unacceptable risk to human health or'the<br />
environment are found at the site, a detennination for no further action was made.<br />
•<br />
2. Where contamination presenting imminent,. immediate, unacceptable risks to human health and the<br />
environment is found, a determination for implementing interim remedial actions will be considered,<br />
The interim measures Iilay include ;institutional controls or temporary stabilization to prevent further<br />
contaminant migration and/or degradation.<br />
3. Where contamination presenting unacceptable risks to'human health and the environment is found<br />
but the risks are not imminent or immediate, an FS will be ,performed. An FS will also be performed<br />
for SWMUs or areas at which interim remedial actions were implemented.<br />
The results of the DQO process and decision rules analysis are presented in Sect. 7.<br />
CSL Performance. All data generated at the CSL were of sufficient quality to support the<br />
project decision-making process. Detection limits are method- and matrix-specific. CSL VOA reporting<br />
packages included: chromatograms for all samples and standards, chain-of-custody information, raw<br />
instrument output, sample and data management logs, complete reports of QC samples, copies of<br />
laboratory logbooks, and all other supporting documentation and QC. Reporting of semi volatile organic<br />
analytes (SVOA)conformedi to. standardSW -846 ,documentation for each analytical batch by date.<br />
e.<br />
Included ,in the dOCumentation were initial and continuing instrument calibration,performance<br />
results, determination of method detection limits, identification and quantification of compounds and<br />
analytes detected, and laboratory QC samples. Selected data were conveyed to the Data Coordinator for<br />
An:J983500005 Sec2_r.doc
•<br />
2-9<br />
direct download into the ,project database. The Project Chemist reviewed results before the data were<br />
input to the .project database. The following criteria were reviewed to determine acceptability:<br />
• Holding times-Most holding times were met. If holding times were not met, the fixed-base<br />
laboratories analyzed and qualified the samples.<br />
• Initial calibration-Most initial calibrations met. acceptance criteria. If the daily initial calibration<br />
criteria were not met, the instrument was recalibrated prior to use.<br />
• Continuing calibration checks~Most calibration checks met acceptance criteria. 'If continuing<br />
calibration criteria were not met, the sample was reanalyzed or qualified.<br />
• Method blanks-'If target compounds were found in the blank and' the associated sample, the sample<br />
records were flagged as '~estimated." Few records were assigned flags for this reason.<br />
• Laboratory duplicates-Most laboratory duplicates were within the acceptance criteria.<br />
•<br />
Iflgeneral,all GC data were assessed as usable for their intended purpose «field screening). For<br />
VOA analyses, average soil spike recoveries ranged from 84.l% for vinyl chloride to 104% for 1,]<br />
dichloroethene, and average water spike recoveries ranged from H~2.4% for vinyl chloride to 107.3% for<br />
trans-l,2-dichloroethene. The majority of duplicate VOAresults above the quantitation limit were for<br />
TCE, and the average relative percent difference ~D) for TCE. was 6.4% for soil and ] 0.8% for water.<br />
For gross alpha/gross beta. determinations, spiked water samples averaged] 07.1 % recovery for alpha and<br />
106.9% recovery for beta. For duplicate results above the minimum .detectable activity, water RPD<br />
averaged 27.5% for alpha and 14.1% for beta. For PCB (immunoassay test kit) .analysis, all duplicate<br />
results were non-detects. Table 2.8 presents the average precision and accuracy numbers for specific<br />
parameters analyzed atthe CSL.<br />
Fixed-Base Laboratory Perfonnance. Fixed'-'base laboratory performance was based on the<br />
results of laboratoryQC samples, matrix spike/matrix spike duplicate (MSIMSD) analysis, and adherence<br />
to laboratory procedures through data validation. 'The ,laboratories·are audited annually by the ORO-SMO<br />
and are contracted to follow the Analytical Master Specification documents for various analytical<br />
chemistry protocols mandated by the ORO-SMO.<br />
No significant data problems were ,reported for any of ,the laboratories used during this<br />
investigation. Specific laboratory problems with the data were addressed and resolved during the data<br />
assessment phase.<br />
•<br />
Comparison ofTCEResults in Soils Analyzed' Using Hexane EXtraction vs Conventional<br />
Methods. The WAG 27 RI is one of the first major investigations at PGDP to use hexane extraction for<br />
analysis of chlorinated solvents in soils. The methodology had' been refined on smaller projects, most<br />
notably in support of the LASANGA TM Technology demonstration, and incorporated in the PGDP<br />
subsurface soil sampling procedure. The method is relatively new, and most fixed-base laboratories ate<br />
not equipped· to use it. In a recent study, samples were analyzed at a CSL using hexane extraction, and<br />
a section of sample sleeve was sentto the fixed-base laboratory for more conventional analysis. As results<br />
were received ,from the fixed-base laboratory and compared with the CSL results, it became obvious that<br />
the results of the two methods were not directly comparable. The CSL always returned higher values 'than<br />
the fixed-base laboratory. On average, theCSLreported TCE values nearly 500 times greater than those<br />
reported by the fixed~base laboratory. In general, as TeE concentrations increased, the difference in the<br />
two results decreased and there was generally good agreement between the two sets of results, although<br />
slight differences were attributed to 'the differences in analytical.equipment.<br />
A TU983500005 Sec2_r.doc
2-10<br />
The comparison demonstrated the effectiveness of using hexane extraction for chlorinated<br />
solvents in soiL This method. however, does have several; disadvantages: (I) the method detection ,limit<br />
is 1 mglkg or I .ppm, and (2) the hexane method masks other VOAs.<br />
•<br />
Data Validation; Data validation isa process performed for a data set by a qualified individual<br />
independent from sampling, laboratory, project management, and other decision-making personnel for<br />
the project. In the data validation process, the hlboratory adherence to analytical method requirements<br />
is evaluated; Definitive data collected for this RI were validated by CDM Federal Programs according<br />
to the following procedures:<br />
• EMEF Intersite Procedure ERWMlER..:P2209, Radiochemical Data Verification andValidation,<br />
Revision 0<br />
• EMEF Intersite Procedure ERWMlER-P22 I 0, Volatile and Semivolatile Data Verification and<br />
Validation, Revision 0<br />
o<br />
EMEF Intersite Procedure ERWMlER-P22 I I, Pesticide and PCB Data Verification and<br />
Validation, Revision 0<br />
• EMEF Intersite Procedure ERWMlER~P2212, Inorganic Data Verification and Validation,<br />
Revision 0<br />
As ,part of the data review process, findings were:qualified as necessary to reflect data validation<br />
results. The following qualifiers were assigned by the data validators:<br />
U<br />
J<br />
~he material was analyzed fol', but was not detected. The associated numerical value is the<br />
quantitation limit.<br />
Estimated value, either because QC criteria were not met or because the amount detected is below<br />
the documented quantitation limit.<br />
•<br />
UJ<br />
OJ<br />
JR<br />
R<br />
Undetected, but the number reported as the quantitation limit is an estimated value.<br />
Duplicate control limits were exceeded, the number reported, as the quantitation 'limit is an<br />
estimated i value.<br />
Estimated' value and rejected, so data are of "information only" quality and should be<br />
supplemented with additional data for decision-making.<br />
Rejected, so data are of "information only" quality and should be supplemented with additional<br />
data for decision-making.<br />
= Data were validated; however, no qualifier was added.<br />
? Data were not validated.<br />
Data generated by Core Laboratory and ~MUS C-710 Laboratory were independently validated<br />
on a frequency of 10%. Actual data records indicated that 12%(6,299 data points) of the overall<br />
analytical data were validated.<br />
•<br />
ATIJ983500005 Sec:U.doc
2-\\<br />
Four data packages were validated for parameters including metals. cyanide. PCBs. and SVOAs.<br />
A review of the data validation summary reports indicates that the inajorityof data quality parameters.<br />
including MSIMSD recovery and RPD criteria. for the validated data packages were within established<br />
method-specific limits. Some quality problems with individual samples andlor analytes were identified<br />
in each of the validated packages; however, the only trends identified were for arsenic and zinc. Arsenic<br />
failed spike recovery criteria in three of the four validated data packages, and zinc failed serial dilution<br />
criteria in three out of the four validated data packages. Arsenic is difficult to quantitate accurately using<br />
the specified methods, and spike. recoveries for .this analyte are often erratic. The failed serial dilutions<br />
for zinc are indicative of matrix interference. Results that were not validated for these two analytes<br />
should be cautiously assessed during the project decision-making process.<br />
Of the· overall analytical data. 4831 data points (9%) were assigned one of the above qualifiers.<br />
Only 20 individual data points were rejected. The total number of data points collected and included in<br />
these percentages was 53,205.<br />
2.8.4 Data Management<br />
•<br />
The WAG 27 Project Environmental Measurements System (PEMS) was used to manage fieldgenerated<br />
data; import laboratory-generated data; add data qualifiers based on data verification.<br />
validation. and assessment; and transfer data to <strong>Paducah</strong>'s Oak Ridge Environmental Information System<br />
(<strong>Paducah</strong> OREIS). PEMS included a tracking system to identify, track, and monitor each sample and<br />
associated data from point of collection through final: data reporting. The system included field<br />
measurements. chain-of-custody information. and a tracking system for trackinghard-copy data packages<br />
and electronic data,deliverables (EDDs). PEMS also included information for field planning and data<br />
evaluation~<br />
All data packages and EDDs received from the laboratory were. tracked. reviewed. and<br />
maintained in a secure environment. When first received. data packages were assigned a document<br />
control number and then logged' into a tracking system. The following information was tracked: sample<br />
delivery group numbers, date received, document control number. number of samples, sample analyses,<br />
receipt of EDDs, and comments.<br />
The data verification ,processes for laboratory data were implemented for both hard-copy data and<br />
EDIDs. The data packages were reviewed'to·confirm that all samples had been analyzed for the requested<br />
,parameters. Discrepancies were reported'to the laboratory and the ,data validators. As part of a series of<br />
internal integrity checks withinPEMS, a check was run to identify which of the requested samples and<br />
analyses were not received in an EDD. lihe hard copy was checked to confirm that missing fractions were<br />
in fact analyzed for and that the missing fractions from the EDD had been requested from the laboratory.<br />
Integrity checks in PEMS were also used to check :the list of compounds generated by the laboratory to<br />
confirm that data were provided for all requested analytes. Discrepancies were reported to the laboratory<br />
and the data validators.<br />
Data verification within PEMS included standardization of analytical methods, chemical names<br />
and units, as well as checks for holding time violations and detections above background values.<br />
•<br />
V alidatedresults were imported ,electronically from the subcontracted third party data validators<br />
into PEMS. These results included data validation qualifiers .<br />
ATU983500005 Sec:!_r:doc
2-12<br />
PEMS system requirements included backups, security, change control, and ,interfacing with other<br />
data management systems. 'PEMS was housed on ,the <strong>Paducah</strong> 'EMEF network. System backups were<br />
:performed nightly following standardi <strong>Paducah</strong> EMEF network protocoL Updates made to the ·files were<br />
copied'to a computer backup tape each night, and: an entire backup was performed eacb week.<br />
•<br />
Security of PEMS and data used' for the data management effort was considered essential to<br />
success of the project. The security protocol followed by ,the data management team was consistent with<br />
that of the <strong>Paducah</strong> EMEF network. Access to the'network is password:.protected. Access toPEMS was<br />
limited; on an as-needed basis, tothe data management andprojectteam. Read-write, graded access to<br />
PEMS was :limited to the data management team, which ,consisted of the :Project Data Coordinator, the<br />
Data Entry Coordinator, :the Sample Manager, and: the nata Manager. Read-only access to PEMS was<br />
granted to other members ,of the ,project team, including the 'Fechnical Manager ..<br />
Sample Location and Identification Number. Each sampling location and sample collected<br />
during the WAG. 27 RI was assigned a discrete identification number, which consisted ofa four-part<br />
alpha/numeric sequence. ,For example:<br />
Each segment of the sequence is, used ,to designate information concerning the location from which<br />
a sample was collected, the medium from which it was:coUected~ the nature of the sample, and ,the depth<br />
from which ,the sample was collected. The first three-digit codeis a location definition corresponding to<br />
the SWMH from which the sample was collected (or "area" in the case of the C~720 Complex). 'For<br />
example, "720" would indicate.the C-720 Complex, and "001 "would indicate SWMU 001. This code<br />
is followed by another three-digit code used to defiile,theiboring orlocation within the SWMU (or area)<br />
from which the sample was collected. For'example, "Ol,S" would indicate the lSlhboring drilled: in that<br />
area lihe tWo-'letter sequence is used to indicate the nature of the sample. '~N" stands fora quality control<br />
sample. An "N" followed by an "E," "A," ''T,'' "P' or "P" means. equipment rinsate, ambient, trip, field,<br />
or preservative blank, respectively. Other codes in ,the,third field are: "WA" for watersampleand'''WD''<br />
for a duplicate water sample collected: from a single location; "SA" for a soil, sediment, or sludge sample,<br />
and "SO" for a duplicate soil sample collected from a single location. The predetermined three-digitfield'<br />
is used: ,to designate the approximate depth from which the sample was to have been collected. For<br />
example, '~095" would mean the sample was to have been collected at 95 ft. In conclusion, for the<br />
example above, the sample identification code "reads": within the area of the C-720 Building, from<br />
·boring location J 8, a water sample was collected at approximately 95 ft bgs.<br />
•<br />
2.8;5 Data, Assessment<br />
A large volume. of data was generated during the WAG 27 RI. With four field teams using two<br />
different drilling methods to collect samples and' five laboratories involved in sample analysis, the<br />
opportunities for problems, ,inconsistencies, and errors were significant. To confirm that the data set<br />
could be used, in thedecision~makingprocess, the RI team performed various checks and reviews during<br />
and after ,the fieldwork to maintain data consistency and identify problem areas. These checks and<br />
reviews included electronic verification and manual assessments by the RIlteam, as well as third-party<br />
validatioriof fixed-base ,laboratory data. More than 53,000 records were reviewed during the data'<br />
assessment.<br />
•<br />
A TIJ983500005' Sec2-,r.doc
•<br />
2.8.5.l IField Data<br />
2-13<br />
Field data' consist of data generated by the on-siteCSL and measurements taken in the field<br />
during a sampling event. For example. measurements taken in the field during a groundwater sampling<br />
event included water temperature. specific conductivity. DO. and pH. The CSL measured concentrations<br />
of 'FCE and its degradation products in soil and groundwater, measured gross alpha and beta radiation<br />
in soil and groundwater; and screened soil samples for PCBs using immunoassay analytical kits.<br />
'The field data underwent weekly reviews by ,the Data and.5ampleManagement 'Feams as a means<br />
of identifying data entry errors, .missing data~ and inconsistencies. The Data Manager developed<br />
numerous queries in ACCESS to provide checks of the PEMS database and identify problems. The nata<br />
Manager, . Sample Manager, Data Entry technician, and Lab Manager reviewed all queries. The field team<br />
manager (FTM) and the BJC LLC technical lead also performed weekly reviews. conducted primarily<br />
as a: planning tool (for contingency sampling). Based on these reviews. questions and problems were<br />
noted and submitted to the Data Manager for ·resolution and correction. The types of problems found<br />
included missing or incorrect sample depths, missing or incorrect data qualifiers, and mis-keyed data.<br />
An additional review was also perfonned. comparing data.againstex.pected conditions to assess whether<br />
the results "made sense" within the context of the investigation.<br />
2.8.5.2 Fixed-Base Data<br />
•<br />
The fixed-base data consist of data generated by the off-site laboratories contracted for .the<br />
project. These laboratories provided analyses of VOAs, SVOA. PCBs, metals, radioisotopes. and soil<br />
,properties; 'Fen ,percent of the fixed..;base data was submitted to a third:..party subcontractor (COM Federal<br />
Programs) for independent validation of the data quality. The validation included ~but was not limited<br />
to) review·of sample holding times, minimum detection limits, analytical blanks. matrix spikes, laboratory<br />
duplicates. surrogates. and instrument calibrations. When appropriate, a qualifier was added to the data<br />
The validation subcontractor submitted a report on each data package when the package was returned<br />
to the RI team. The results of the validation were .then included in the data set.<br />
2.8~5.3 Final Review<br />
After the last data package was received from the fixed-base laboratory and loaded into the<br />
database, a final review and assessment of all the data was completed. This effort included electronic<br />
verification, database queries targeting known problem areas, and manual assessment. Formanageability,<br />
the data set was divided by SWMU or area.<br />
The electronic verification was used to compare ,the data' set against various reference values,<br />
specifically holding timeexceedances. for all analyses and background exceedances for metals and<br />
radioisotopes in soils. Data records for all samples that exceeded holding times were flagged with a "T"<br />
in the verification field. Data records for all metals and radioisotopes in soils that exceeded established<br />
background levels for the site were flagged with an "}" in the verification field.<br />
•<br />
In conjunction with electronic verification, a set of data assessment queries was developed; These<br />
queries were designed to check the internal' consistency of the database and to identify all analytes<br />
detected. the concentration and distribution of the analytes detected within the volume of soil and;<br />
groundwater investigated, and the samples that might have been impacted by various problems that are<br />
inevitable during the course of a major investigation. The underlying data assessment question<br />
consistently asked was "Does this number make sense and what does it mean?"<br />
A TU983500005 Sec2_r.doc
2-14<br />
The first group of data reviewed was from the QC samples. These included equipment rinsate<br />
samples. trip blanks. refrigerator blanks. field blanks. a comparison of field duplicates. and i analysis of<br />
the potable water and 01, water used in drilling and decontamination. During the assessment of these<br />
samples. four problem areas were identified:<br />
•<br />
• Possible incomplete decontamination of sampling and/or analytical equipment<br />
• Possible cross-contamination from VOAs during sample storage<br />
o Possible impacts attributable to the potable water used during drilling<br />
o Possible impacts attributable to site conditions<br />
Additional queries were run to identify which <strong>environmental</strong> samples might have been affected<br />
by these problems.<br />
Some of the equipment rinsate samples had detections of analytes that indicated incomplete<br />
decontamination of the sampling equipment and/or possible cross-contamination in the laboratory at the<br />
time of analysis. Some of the contamination was attributable to low-level detects in the DI water blank;<br />
however. some rinsate samples had detects much greater than those found in the 01 system blank. These<br />
samples indicate possible contamination from the potable water during decontamination. The<br />
<strong>environmental</strong> samples collected the day after the rinsate sample was collected were identified with a<br />
collection date query. The samples that were analyzed on the same day as therinsate sample were<br />
identified with an analysis date query. Data records for these samples were then assigned the assessment<br />
flag "BH-NE." meaning that the chemical was detected in the associated equipment rinsate and that the<br />
result may be biased high due to incomplete decontamination or cross-contamination in the laboratory.<br />
Five-hundred-nine records in the database were assigned the "BH-NE" flag.<br />
Field blanks were collected throughout the project at each of the sites. Several field blanks had<br />
detects of analytesat concentrations above those found in the 01 water. These contaminants were<br />
attributed to impacts from site conditions. Samples associated with, these blanks were assigned a "BH<br />
FB" qualifier, indicating that these values were biased-high due to contaminants introduced at the site<br />
during sampling.<br />
•<br />
Holding time exceedances were a problem, particularly due to the DOT shipping issues that arose<br />
during the project and to the analytical methodfornitrate/nitrite,(holding time for this method was 2 days,<br />
which could not be met}. All holding timeexceedances were identified during the verification process.<br />
During the assessment process. the impact of those exceedances was evaluated. Analyses for VOAs and<br />
certain metals are particularly sensitive to holding times, whereas analyses for most SVOAs.metals. and<br />
radioisotopes are less sensitive. Both the analyses to be performed and the length of the holding time<br />
exceedance were evaluated to assess the potential impac~. Records for those samples judged to be<br />
significantly impacted were assigned an assessment flag of "BL-T," meaning that the result may be biased<br />
'low due to holding time exceedance. A total of 185 records in the database were assigned the "BL-T"<br />
flag.<br />
Samples collected from the 01 water system indicated low-level detects of some metals and<br />
SVOAs. Because this water was used as a final rinse in all of the decontamination procedures, samples<br />
with detects·ofthese metals and SVOAs were assigned a "BH-Dr'qualifier. indicating that these values<br />
were biased high due to possible contamination from the DI water. The "BH-DI" flag was assigned to<br />
282 records.<br />
In assessing other questionable results, laboratory-introduced contamination was identified .<br />
These contaminants consistof chemicals that are used in sample preparation or equipment cleaning and<br />
•<br />
ATlJ983500005 Sec:U.doc
•<br />
2-f5<br />
appear frequently in sample ,results. Records for these chemicals were assigned an assessment flag of<br />
"BH-LAB" or "BL-LAB," indicating that the values are due to laboratory contamination and the records<br />
are to be used for information only. A total of 37 records were assigned a "BH-LAB"qualifier, and 46<br />
were assigned a "BL.;LAB" flag.<br />
During the data assessment process, all! data received from the K-25 laboratory for volatile<br />
organiC analysis were flagged with a "J," or estimated quantity qualifier, due to a lack of available<br />
laboratoryQAlQC records.<br />
The "R -C" assessment flag was/used: to reject data that did no~ pass the review process. Rejected<br />
data included, for example, chemicals that have not been used on-site or results .that made no sense.e.<br />
g., if the dissolved concentration of a metal in groundwater exceeded the total concentration of the metal<br />
in the same sample. If the detected dissolved concentration was greater than 10%. the dissolved: metal<br />
result was considered questionable. Three-hundred-sixty-six records in the database were assigned the<br />
"R-C" flag. Only these data were excluded from use in the evaluation of contaminant nature and'extent<br />
or fate and transport.<br />
•<br />
An additional assessment flag, dealing with radioisotopes, was used in the WAG 27 RI. For<br />
radiological da~ "U-Rad" was used to indicate that the reported result is considered a non-detect.<br />
This flag was applied at the time the laboratory data were entered and is based on the following premise:<br />
if the result is so low that the instrument measurement error bar is greater than or equal to the reported<br />
result, the result should be considered a' non-detect. A total of 383 records in 'the database were assigned<br />
this flag .<br />
2.8.6 Field Quality Control Procedures<br />
Field QC Samples. EPA, DOE, the Commonwealth of Kentucky, and PGDP procedures require that<br />
field QC samples be collected to assess data quality. The QC samples collected and analyzed included:<br />
• equipment rinsates;<br />
• source blanks (water supply samples);<br />
• trip blanks;<br />
• field blanks; and<br />
• duplicate samples.<br />
Equipment Rinsates. Equipmentrinsates were collected at a frequency of I in 20 samples.<br />
Appendix H provides the data from the equipment rinsate samples. A total of 35 equipment rinsates were<br />
collected during the project.<br />
Water Supply Sample. Source blanks of the OJ water used for equipment decontamination and<br />
blanks were collected: at a frequency of one sample per water supply. One water supply sample was<br />
collected during the ,project.<br />
•<br />
Trip :Blanks. Trip blanks were collected at a frequency of one sample per cooler containing samples<br />
for YOA analysis. A total of 74 trip blanks were analyzed during the project. Appendix H provides the<br />
results of the trip .blank samples. Trip blank results from the K-25 lab were incorrectly reported in mglkg.<br />
The trip blank values will be recalculated for' the appropriate matrix and resubmitted as part of the 02<br />
WAG 27 document.<br />
A TU983500005 Sec2_r.doc
2-16<br />
Field Blanks. Field blanks were collected at a frequency of I in 20 samples. Appendix H provides<br />
,the data from the field blanks. A total of 35 field blanks were collected during the project.<br />
•<br />
Duplicate Samples. Split samples were collected as field duplicates and sent to the fixed-base<br />
laboratory for analysis. Duplicates were collected at a frequency of I per 20 samples. Twenty soil and<br />
20 water duplicate samples were collected during the project. Appendix H provides the results of the<br />
duplicate samples.<br />
2.9 CIVIL SURVEY<br />
An extensive civil surveying effort was.required to assure the safety of personnel working on the<br />
WAG 27 RI. For example, the exact location of the sampling point was necessary to avoid penetrating<br />
the vast network of underground utilities in WAG 27 areas. Each sampling location was surveyed and'<br />
an exhaustive excavation permit process was conducted~ On several occasions, the sampling point was<br />
relocated and then surveyed again. No underground utilities were penetrated during the WAG 27 RI and<br />
field activities. Upon completion of the activities associated with the sampling points, soil borings, and<br />
piezometers, a final survey of the location and, elevation was conducted.<br />
The surveying was conducted in accordance with the <strong>Paducah</strong> EMEF engineering specifications.<br />
The civil survey was performed by a registered and licensed surveyor of the Commonwealth of Kentucky .<br />
Site locations were surveyed on the Kentucky State Plane Coordinate System and the PGDP<br />
Plane Coordinate System. Benchmarks and reference points were supplied by the BJC LLC<br />
Civil' Engineering Department. Grid coordinates were measured to an accuracy of plus or minus 0.0 I ft<br />
and tied to the U.S. Geological Survey (USGS) National Geodetic Vertical Datum (NGVD)of 1929 or<br />
the North American Datum of 1983. Elevations were measured to a hundredth (0;01) of a foot. Surveying<br />
field activities were documented in field logbooks for archiving. The civil survey data are included in<br />
Appendix C.<br />
•<br />
2.10 SURFACE AND BOREHOLE GEOPHYSICA'L SURVEYS<br />
2.10.1 Surface Geophysical Surveys<br />
WAG 27 includes a network of underground utilities, and avoiding penetration of these utilities<br />
during the intrusive sampling activities was a primary ,concern from the beginning of the effort.<br />
Therefore, an extensive excavation permit process, which included a geophysical survey, was conducted<br />
at each sampling ,point prior to intrusive sampling. The geophysical surveys were conducted in those<br />
areas that previously unidentified utilities could exist and adversely affect drilling operations.<br />
Geophysical surveys were also conducted to confirm the location of utilities. These surveys were used<br />
in conjunction with utility drawings, field measurements, and interviews with employees with extensive<br />
site knowledge to help locate these utilities before invasive drilling activities were preformed.<br />
The geophysical investigation was designed to measure the conductive, magnetic, and dielectric<br />
properties of subsurface materials in the vicinity of the intrusive sampling and the nearby utility corridors.<br />
The geophysical investigation was conducted using a' Geonics G-858G Cesium Vapor •<br />
Magnetometer/Gradiometer, EM-31 electromagnetic conductivity meter, and GeoRadar 1000B Stepped-<br />
A TI1983500005 Sec2_r.doc
•<br />
2-17<br />
FM Ground Penetrating Radar System (GR-TOOOB).<br />
Typically, one or more of the geophysical instruments detected the location of an underground<br />
utility expected to 'be present. Each site was unique and no single instrument was adequate to confirm<br />
the presence or absence of underground utilities. Underground utilities, which are shown on the as-built<br />
drawings and were detected by the instruments, were marked on the ground with spray paint. At some<br />
locations, however, the geophysical data were inconclusive and the utilities could not be located with a<br />
high level of confidence. Examples of these sites include reinforced steel bar in concrete and<br />
underground utility lines constructed with materials such as transite, concrete, or PVc. In these instances,<br />
the problems were noted in the logbook and the underground utilities were located using the as-built<br />
drawings.<br />
Whenever necessary, sampling points were relocated based on a review of lhe pertinent<br />
information, such as the as-built drawings, the utility markings on the ground from the geophysical<br />
investigation, and site appurtenances (overhead power lines, buildings, roads, etc.), Some sampling points<br />
were relocated ,because sampling activities could not be conducted due to plant operation activities. In<br />
most cases whenever a sampling point was relocated, ,the permit process-including ,a geophysical<br />
survey-started,again at the relocated point. At some locations, however, an excavation permit existed<br />
and a geophysical survey was not required.<br />
•<br />
More than 130 boring locations were sampled during the WAG 27 RI, and no penetrations of<br />
underground utility lines occurred. Geophysical investigation activities at each sampling point were<br />
documented infield logbooks .<br />
2.10.2 Borehole GeophysicalSurveys<br />
Borehole geophysical logging of natural gamma count and neutron porosity was conducted inside<br />
the drill string at each RGAandi McNairy location and in selected monitoring wells. The logging was<br />
conducted in accordance with PGDP Procedure PTSA-301O-IAD, Geophysical Logging. The logs were<br />
used to further define the subsurface stratigraphy at WAG 27. Copies of thegeophysical i logs are<br />
included in Appendix D.<br />
2.11 HEALTH AND SAFETY MONITORING<br />
To protect the health and safety of personnel during ,field activities, full-time site safety<br />
professionals were assigned to observe, monitor, direct, and document each activity. In addition, a<br />
Radiation Protection Program (RPP) was implemented to assure adherence to PGDPand DOE<br />
regulations. All of the site safety professionals were trained and accredited as radiation control<br />
technicians, as required by the RPP, prior to the start of site monitoring activities.<br />
Two major categories 'of monitoring were performed, as discussed below. Monitoring included<br />
continuous observation of the work site for safety hazards, biological, hazards, and the parameters listed<br />
in Table 2.9 using real-time instruments.<br />
2~11.1 Work Area Monitoring<br />
Several of the drilling and sampling locations for the WAG 27RI were within the boundaries ot:<br />
A 111983500005 Sec2_r.doc
2-18<br />
known areas of surface radiation contamination; Before ,field activities began, an initial site radiation<br />
survey was ;performed covering a60~ x 60-ftarea around .the ,point of sampling or drilling. This area was<br />
scanned with the ESP-2 and Vic450P. The surveys were conducted in accordance with the CH2M HilL<br />
RPP screening procedures. Data were recorded on Form RP-30 1.1, "Special PurposelRoutine<br />
Radiological Sur:vey Results." The purpose of the survey was to assure ,that the members of the sampling<br />
crewaild the equipmentwereproperly,protected and to assure that surface contamination, if,present, was<br />
properly managed~<br />
•<br />
All radiation abnormalities were reported immediately to the EMEF Health Physics Department<br />
and! the project construction engineer.<br />
Once the site had been thoroughly scanned for radiation and proper actions had been taken to<br />
,protect workers from site hazards, equipment was moved in and work zones (with barriers). were<br />
established. These zones included an outer construction zone and an inneriexclusion zone. The exclusion<br />
zone was a strictly controlled area. Every person or item that passed into this zone was considered<br />
contaminated and could not be removed until fully scanned for radiation. This was accomplished by<br />
discrete measurements with the Ludlum 2224 and smear counting using ,the Ludlum 2929. Site safety<br />
'professionals were trained on proper operation of the equipment and guidelines used for releasing<br />
equipment and personnel from the zones in accordance with theCH2M HILL RPP.<br />
Gnce the ground surface was broken at a work site, air was continuously monitored with direct<br />
read instruments until field activities were completed. Tools and equipment in direct contact with soil<br />
were presumed to be contaminated until they were measured and, were therefore smeared lbefore they were<br />
cleared. If levels were above the release limits, the ,material was ibagged and properly tagged. The bagged<br />
material was then surveyed again to confirm that levels were ibelow the release limits. The material was<br />
then moved toa designated area until it could be properly decontaminated. Instrument readings were<br />
recorded in the field geologist logbook. Typically, readings were recorded from soil cuttings created<br />
during the drilling operations, air space monitoring at the drilling location, smears and direct<br />
measurements,and readings that met or exceeded the project action levels specified in the Health and<br />
Safety Plan (HASP).<br />
•<br />
Work area monitoring was also ,performed to prevent overexposure to temperature extremes.<br />
On-site ambient !temperature was measured and! discussed on a daily basis. Cold and heat stress<br />
monitoring of personnel was conducted in the work area by a site safety professional. This monitoring<br />
included: close scrutiny -of personnel behavior, obvious signs of overexertion, and heart rates of exposed<br />
personnel. Heart rate checks were performed ,periodically during each exposure period.<br />
Excessive noise was surveyed at each source of elevated noise. These included drill rigs, pressure<br />
washing equipment, generators,and other items equipped with combustion engines. Sound level<br />
monitoring data were recorded on a50und;Level Survey Form. Sound'level sUI:veys were performed with<br />
a' Quest Model 2700 sound level! meter at each source of elevated noise. Working conditions in the<br />
vicinity of this equipment were checked at ,regular intervals to confirm that the site was properly<br />
delineated with hearing conservation signs and to reassess the use of properPPE. Hearing protection was<br />
required at any levels equal to or above 85 decibels.<br />
2.11.2 Employee Biological Monitoring<br />
All personnel who were required to enter a zone of potential contamination were required to<br />
participate in the BJC LLC Biological~ Monitoring Program (BMP). As part of this program; personnel<br />
wore thermo-luminescent dosimeter (TLD) badges.to track possible radiation exposure; in addition;<br />
•<br />
ATU983500005 Sec21doc
2-19<br />
monthly urinalysis was. conducted to document radiological ion uptake. The 29 CFR 1910.120<br />
requirements were used for training and biological monitoring of WAG 27 field employees, including<br />
a physical' examination consisting of blood analysis. audiometric testing, respiratory testing, and<br />
cardiopulmonary testing.<br />
Upon arrival at the project site and before any participation in site work, employees were issued<br />
a 'l'LD by BJ€ Ll;C Health Physics Department personnel and each person provided a urine sample to<br />
establish a baseline. The TLDs were exchanged and analyzed on a quarterly basis. The internal dose<br />
evaluation was performed each month and at the end of project participation. Also, all project employees<br />
were required to submit to a drug screen before participation in field activities.<br />
2.12 'DECONTAMINATION PRACTICES<br />
All heavy equipment, drill rigs, and other large drilling-related equipment such as drin rods,<br />
casing, liners, and l bits were steam-cleaned on the C-752-C Decontamination Pad. Decontamination of<br />
drilling-related equipment was conducted in accordance with PGDP EMEF Procedure PTSA-5001-1AD,<br />
Decontamination of Drilling-Related Equipment.<br />
•<br />
The drilling equipment was thoroughly steam cleaned and rinsed, then allowed to air dry.<br />
After decontamination, the drill rods and flights were wrapped in plastic and placed on the drill rig prior<br />
to transport back to the site. 'fhe wastewater generated during the decontamination process was allowed<br />
to collect ina sump 'before being pumped into a 3,OOO-gal holding tank located at the decontamination<br />
(deco",) pad. The decon pad was operated in accordance with <strong>Paducah</strong> EMEF Procedure PTSA-5003,<br />
Operation of the C-752-C Decontamination Pad.<br />
The sampling equipment, including all stainless-steel field sampling equipment such as spatulas,<br />
spoons, knives, and bowls, was decontaminated in accordance with <strong>Paducah</strong> EMEF Procedure PTSA-<br />
5002-lAD, Decontamination of Field Equipment. The decontamination process occurred in Ithe following<br />
order:<br />
• steam cleaned,<br />
• ,rinsed with potable water,<br />
• washed and scrubbed with phosphate-free detergent and water,<br />
• rinsed with clean tap water,<br />
• rinsed with DI water,<br />
• double-rinsed with isopropanol,<br />
• rinsed with nitric acid (1:0%),<br />
o rinsed with DI water,<br />
o air-dried; and<br />
o wrapped in aluminum foil or plastic.<br />
2.13 WASTE HANDLING PRACTICES<br />
•<br />
The following <strong>Paducah</strong> EMEF waste management procedures were used during the RI:<br />
• CP4-ER~SAM4601, Drum and Special Container Staging and, Sampling<br />
A TU983500005 Sec21doc
2-20<br />
• CP4-ER-SAM4602, Manual Drum Opening, which was replaced with PTWM-5501-IAD, Opening •<br />
Containerized Waste<br />
• CP4-ER-WM2001, Handling of Investigation-Derived Waste, which was replaced with PMWM-<br />
1002-IAD, On-Site Handling and Disposal of Waste Materials<br />
A variety of potentially contaminated and non-contaminated wastes were generated during the<br />
RI activities. All wastes generated as a result of field-related investigative activities had the potential to<br />
contain contaminants related to past practices. These investigative techniques resulted in the generation<br />
of investigation-derived waste (IDW} that required proper containers, storage, and disposaL<br />
2.13.1 Soil Cuttings and Drilling Mud<br />
Shallow soil borings drilled via DPT generated subsurface soil cuttings, all of which were placed<br />
in appropriately labeled drums and managed according to applicable regulations and PGDP procedures.<br />
RGAlMcNairy borings drilled via dual wall reverse circulation generated a mixture of soil<br />
cuttings and drilling water. This mixture was collected in 1000-gal mobile tanks and transported to the<br />
C-752-C Building for separation. The mixture was separated into solids and liquids using one or more<br />
of the following methods: natural gravity settling of so lids, separation by the addition of various polymers<br />
to.aid flocculation, and physical separation via centrifuge. The solids (soils) were placed'in appropriately<br />
labeled drums and sufficient quantities of absorbent media were added to prevent future separation of<br />
liquids from the solids. The drums were managed according to applicable regulations and PGDP<br />
procedures. The liquids (water) were transferred to decontamination rinsate storage for proper disposal.<br />
Many of the borings were drilled on concrete pads where the surface of the concrete was<br />
contaminated with radioactivity. For these borings, the concrete was cored and the plug of concrete was<br />
placed into appropriately labeled drums and managed according to applicable regulations andPGDP<br />
procedures.<br />
•<br />
A total of 730 drums of soil were generated during the WAG 27 RI.<br />
2.13.2 Well Development, Drilling Water, Decontamination Rinsate, and Purge Water<br />
Water generated from monitoring well development, purging, and sampling was placed into<br />
1000-gal mobile tanks and evaluated against field screening data. If the water was found ,to be acceptable,<br />
it was transferred to the decontamination rinsate storage area for proper disposal.<br />
Decontaminationrinsate was generated from the cleaning of drilling and sampling equipment.<br />
Water from decontamination activities was collected in sumps 'located at the C-752-C Decontamination<br />
Pad. Some solids (soils) separated and were left in the sump for subsequent transfer to appropriately<br />
labeled drums. Water collected during other activities, such as well drilling, development, or purging,<br />
was mixed with the decontamination rinsate. The collected water was treated for total suspended solids,<br />
if necessary, using one or more of the following methods: natural gravity settling of solids, separation by<br />
the addition of various polymers to aid flocculation, and physical separation via centrifuge.<br />
Wastewater, mixed with solvents, generated from the decontamination of laboratory equipment<br />
was collected ,in 55-gal drums and temporarily stored at the CSL, sampled for characterization, and<br />
managed according to PGDP procedures.<br />
•<br />
ATIJ983500005 Sec:!_r.doc
•<br />
In general, water generated from this project, except water generated at the laboratory, was<br />
transferred to a dedicated stationary tank (approximately 3000-gal capacity). When ,the tank was near<br />
capacity, a water sample was collected and analyzed for PCBs. PCBs were not detected in most of the<br />
samples and this non PCB-bearing water was transferred to a large water,tank (approximately 20;OOO-gal<br />
capacity). Once this tank was near capacity, a set of water samples was collected and analyzed for the<br />
list of analytes required by the KPDES Outfall Permit. When the results were approved by the PGDP<br />
Waste Management Coordinator, the water was transported to the KPDES 001 Outfall for discharge.<br />
Water containing PCB detectable ,limits was transferred'to PGDP Waste Management for disposal.<br />
A total of 56,000 gallons of wastewater were generated and disposed of during the WAG 27 RI.<br />
2.13.3 Personal Protective Equipment and Dirty Plastic<br />
Modified Level D was the highest level of PPE worn, as required by the WAG 27 RI HASP.<br />
Before exiting an exclusion zone, personnel doffed and containerized all disposable iPPE. This PPE was<br />
considered the same waste .classification as the materials with which it had come into contact. Dirty<br />
iplastic also was generated during the activities. During mobilization from the sampling sites and during<br />
the decontamination process, plastic was collected and placed in labeled containers. The dirty plastic was<br />
also considered the same waste classification as the materials with which it had come into contact.<br />
•<br />
In accordance with field screening information and laboratory results, PPE and dirty plastic<br />
determined to be contaminated was placed into appropriately labeled drums and managed l according to<br />
applicable regulations and PGBP protocol. PPE and dirty plastic determined to be non-contaminated<br />
were placed into appropriately labeled bags and transferred into a roll-off container. Seven drums of<br />
contaminated PPE and 1 roll-off container of clean PPE were generated during the WAG 27 RI.<br />
2.i3~4<br />
CSL Wastes<br />
Used sample containers (glass and plastic), PPE, soil, and wastewater were generated at the CSL.<br />
The PPEand soil from ,the CSL were combined with PPE and soil generated during the drilling activities.<br />
Used glass and used plastic containers were separated and managed as contaminated material,.<br />
Wastewater generated at the CSL was collected and managed as RCRA waste. The wastewater was<br />
temporarily stored at a satellite accumulation area (SAA) set up at one of the CSLs.<br />
Three drums of used glass containers, 5 drums of ,used~ plastic containers, and 2 drums of RCRA<br />
wastewater were generated at the CSL during the WAG 27 RI.<br />
2.13.5 Non-contaminated IDW<br />
•<br />
PGDP has implemented waste management activities for the segregation of all clean trash (i.e.,<br />
trash that is not,chemicaUyor radiologically contaminated), such as office paper, aluminum cans, glass<br />
bottles not used to store potentially hazardous chemicals, aluminum foil, and food, items. During this RI,<br />
all clean trash was segregated according to PGDP guidelines and then collected and placed into a<br />
dumpster located at the C-755 area for subsequent delivery to an, off-site hmdfill as sanitary waste.<br />
Approval for off-site disposal of clean trash was granted by the Off~Site Waste Release (OSWR) Board<br />
prior to waste generation .<br />
2.13~6 IDW Forms<br />
Request for Disposal (RFD~ forms and Waste Item Container log sheets were completed as the<br />
A TlJ983500005 Sec2_r.doc
2-22<br />
waste was generated at the work site. PGDP supplied RFD fonns as needed. Completed fonns were<br />
deliveredto the PGDP EMEF Waste Disposal Coordinator for approval_ The Waste Item Container 'log<br />
sheets, which are used to ' document each addition of waste to a particular container, were completed for<br />
each applicable waste container that was removed from the work site.<br />
2.13.7 IDW Labeling<br />
lOW containers were ,carefully labeled or marked to assure proper management of the wastes as<br />
outlined, in PGDP EMEF 'Procedure CP4-ER-WM2001, Handling of Investigation-Derived Wastes.<br />
2.13.8 IDWStorage<br />
Generator Storage Areas (GSAs) and SAAs were established as necessary. The GSAs and SAAs<br />
were setup, inspected', and maintained in accordance withPGDP Procedure PMWM-I002.<br />
Once the waste was accepted by thePGDP EMEF Waste Disposal Coordinator, the drums were<br />
transported to the C-752-ABuilding and the C-746-H3 Environmental Restoration Waste Storage Pads.<br />
These areas were available for the storage of non-hazardous waste, with no storage time limitation.<br />
TheC-746-H3 storage pad was also available for the storage of hazardous waste for less than 90 days.<br />
2.13.9 Types of Containers<br />
Solid waste was containerized in 55-gar drums with ,a minimum rating of no~ 1 A21X 400lS or<br />
approved equals that were lined with a minimum 12;..mil-thick plastic liner and absorbent pad. Liquid<br />
lOW was transported in1000-galmobile tanks and was transferred into 'I000-gal portable tanks, 1'500-<br />
or 3000-gal stationary tanks, or the large 20,OOO-gal ,tanks located atC-752~C.<br />
.'<br />
2.13.10 IDW Characterization, Sampling,and Analysis<br />
Unless wastes had been previouslYicharacterized using process knowledge, wastes generated from<br />
sites designated' as potentially contaminated were sampled and analyzed to characterize and classify them<br />
for proper laboratory handling, record keeping, transfer, storage, and disposal. Waste analyses were<br />
perfonned using EPA-approved procedures as applicable. Analysis required: for hazardous waste<br />
classification was performed in accordance with EPA SW~846 (1986). Wastewater analysis was<br />
perfonned in accordance with Clean Water Act (CWM and/or Safe Drinking Water Act (SOW A)<br />
procedures.<br />
2.14 DOCUMENTATION<br />
Field documentation was maintained throughout the Rlin various types of documents and<br />
fonnats, including field logbooks, field change requests, and lithologic logs.<br />
Field team personnel used bound' field logbooks with sequentially numbered ipages to maintain<br />
field records and to document infonnation pertinent to field activities~ Information in the ,field logbooks<br />
obtained from site exploration, observation, and sampling activities was recorded bya designated field<br />
team member. Field documentation was in accordance with LMES guidance as detailed in the <strong>Paducah</strong><br />
EMEF Procedure ,PMSA-1201-IAD, Site and Field Logbooks. Logbooks were maintained by ,the<br />
following to document each day's field activities:<br />
•<br />
A TU983500005 Sec2_r.doc
•<br />
•<br />
2-23<br />
Field Task Manager<br />
• Site Safety Coordinator<br />
• Sample Coordinator<br />
• Data Coordinator<br />
• Waste Coordinator<br />
• QAlQC Manager<br />
• Field Geologists<br />
• Laboratory Manager<br />
• Close Support Radiological Laboratory<br />
• Close Support Gas Chromatography Laboratory<br />
•<br />
•<br />
A TU983500005 Sec2_r.doc
2-24<br />
•<br />
This page intentionally left blank.<br />
•<br />
ATIJ983500005 Sec2_r.doc<br />
98350000<br />
•
•<br />
•<br />
2-25<br />
Table 2.1. <strong>Paducah</strong> EMEF program ,procedures<br />
Procedure No.<br />
Procedure Title<br />
PMSA-I20 I-lAD<br />
PTSA-1203<br />
PTSA-420I<br />
PTSA-4202<br />
'PTSA-430I-lAD<br />
PTSA -4302-b\.D<br />
PTER-20IO<br />
PTSA-4305-IAD<br />
PTSA-4306-lAD<br />
PTSA-4308-IAD<br />
PTSA-450I<br />
PiSA-4502-IAD<br />
PTSA-4503-IAD<br />
PTSA-4506-IAD<br />
PTSA-4508<br />
PTWM-5500<br />
PTWM-5501-IAD<br />
PMWM-I002-IAD<br />
PMSA-2002<br />
PMSA-II ' 02<br />
PTSA-5001-IAD<br />
PTSA-5002~IAD<br />
Site and Field Logbooks<br />
lithologic Logging<br />
Surface Soil Sampling<br />
Subsurface Soil Sampling<br />
Water Levell Measurements (Wells)<br />
Monitoring Well Purging<br />
Groundwater Monitoring Sampling<br />
Filter Pack and Screen Selection for Wells and Piezometers<br />
Monitoring Well Installation<br />
Monitoring Well Development<br />
Field Measurement of Water Temperature<br />
Field Measurement: pH<br />
Field Measurement: Dissolved Oxygen<br />
Field Measurement: Specific Conductance<br />
Field Gas Chromatography<br />
Sampling Containerized Waste<br />
Opening Containerized' Waste<br />
On-Site Handling and Disposal of Waste Materials<br />
Sample Chain of Custody<br />
Sample Tracking. Laboratory Coordination and Sample Handling<br />
Guidance<br />
Decontamination of Drilling-Related Equipment<br />
Decontamination of Field Equipment<br />
Trenchl<br />
SIud2e<br />
SWMWOOI 5<br />
SWMU091<br />
SWMl'J 196 7<br />
C-720 1<br />
Table 2. 2 Number of sample ,types Iby SWMU or area<br />
Soil<br />
Groundwater<br />
Sediment Surface Subsurface RGA VCRS RGA McNairy<br />
7 195 27 ,87 17<br />
4 17 4<br />
2 ,13 78<br />
122 5 83 24<br />
•<br />
A TU983500005 Sec2-,r.doc
Sample ID<br />
OOH73WA050<br />
001l81WA055<br />
001181WA070<br />
001184WA140<br />
001178WA140<br />
001184WA120<br />
001182WA140<br />
n0002WA015<br />
nOOO3WAOl5<br />
nOOl2WA070<br />
noo l'3W A065<br />
n0022W AO 15<br />
n0024W AO 15<br />
n0029WA085<br />
Table 2.3<br />
2-26<br />
Samples with inadequate or no purging or collected by bailer<br />
Analytical<br />
Full Range<br />
VOAlradscreen<br />
AlklIons<br />
Rad<br />
VOAscreen only<br />
AlklIons<br />
VOAJradscreen<br />
Rad<br />
VOA·screenlradscreen<br />
AlklIons<br />
VOAlradscreen<br />
same as above<br />
VOAlradscreen<br />
VOAlradscreen<br />
Full range<br />
VOAscreen<br />
VOAlradscreen<br />
VOAlradscreen<br />
VOAlradscreen<br />
Type<br />
Grab Sample<br />
Grab Sample<br />
Grab Sample<br />
Bailer<br />
Grab Sample<br />
Bailer<br />
Bailer<br />
Bailer<br />
Bailer<br />
Grab Sample<br />
Bailer<br />
Bailer<br />
Bailer<br />
Grab Sample<br />
•<br />
'Notes:<br />
• Grab samples were collected using a pump<br />
• These samples were not submitted for metals analysis<br />
• Sample ID explanation is contained in Sect. 2.8.4<br />
o Full Range equals VOAs, Rad, Metals, and alkalinity/ions analyses<br />
•<br />
Table 2.4 Piezometer water level information<br />
PIEZOMETER WATER LEVEL DATA FGR WAG. 27 -6/}13/98<br />
PIEZOMETER TIME STATIC TOe WATER , MEASURE<br />
/BORING (Ff) ELEV. ,ELEV. POINT<br />
·PZ-I D20~0 12 1025 49.39 276.70 327.3'1 N-SIDE<br />
j<br />
:<br />
'PZ-2D20-013 1043 44.3 372.32 328.02<br />
..<br />
I<br />
1<br />
..<br />
I' 'PZ-3D20-015 1038 45;86 373.71 327.85 I<br />
I PZ-4D20-017 1035 46.63 374.52<br />
..<br />
327.89<br />
i<br />
I PZ-5D20-0 19 1020 45.22 373:96 328.74 "<br />
STICKUP TOTAL DEPTH<br />
I<br />
(IT)<br />
(IT)<br />
3.0 i 82.25<br />
FLUSH 81.57<br />
..<br />
i<br />
80.76<br />
..<br />
82.34<br />
..<br />
83.14<br />
•<br />
A TIJ983500005 Sec2..;r.doc
•<br />
•<br />
VOA<br />
VOA<br />
PCB<br />
Analvsis<br />
2-27<br />
Table 2.5 CSL analyses<br />
Prep. Method<br />
. Parameters (Matrix) Anah1icali . Method<br />
TCE and TCE degradation products<br />
TCE and TCE degradation products<br />
PCB<br />
iParameter Matrix Holding time<br />
VOA Water 14 days<br />
Solid<br />
14 days<br />
Gross alpha Water 6 months<br />
and gross beta,<br />
Solid 6 months<br />
Wipe samples Wipe 6 months<br />
(gross alpha Media<br />
and beta)<br />
Notes:<br />
Ilg/L = micrograms pediter<br />
mg/kg = milligrams per kilogram<br />
pC ilL = :picoCuries per :liter<br />
cpm = counts peNninute<br />
SW-846 5030A (water,)<br />
Direct Inject(hexane and<br />
soil gas)<br />
Immunoassav (soil)<br />
Modified l SW-846 8010<br />
Modified SW -84680 I 0<br />
SW -846 Method 4020<br />
Table 2.6 Analytical'methods and sample requirements forCSL screening. samples<br />
Detection<br />
Limit<br />
1 mglkg<br />
10 pCiIL alpha'<br />
20 pCiIL beta<br />
12 pC:i/g alpha<br />
22 pCi/g beta<br />
2-28<br />
Table 2.7 Analytical methods,preservation,and container 'type for all samples analyzed by<br />
the fixed-base laboratories<br />
Anal~sis Anal~tical Method €ontainer Tn~e Preservative<br />
Soil<br />
TCLmetals 60 lOA 8-oz wide mouth glass None<br />
7060<br />
7471<br />
7740<br />
Cyanide 90\0 8-oz widemouth glass. None<br />
PCBs 8080 4-oz widemouth glass 4°C<br />
Radiological EPA 908.1 16-ozwidemouthglass None<br />
EPA901.1<br />
HASL-300<br />
9}1O<br />
TCLSVOA 3550/8270 4-oz widemouth glass 4°C<br />
TCLVOA 8240 Acetate sleeve or 4°C<br />
2-oz widemouthglass<br />
Groundwater<br />
Major ion analysis EPAJIO.2 I-L plastic None<br />
EPA 300<br />
TCL metalsl uranium KPA. uranium (2) 1-LPlastic Nitric pH
•<br />
,<br />
2-29<br />
2.8 Average spike recovery and duplicate relative percent difference ~RPD) for the CSLs<br />
Parameter Water Soil<br />
Spike Recovery RPD Spike Recovery I<br />
,<br />
RPD<br />
VOA % % 0/0 ,. 0/0<br />
Vinyl chloride !1'02.4 m 84.1' I ID<br />
'10'1 -dichloroethene f06,1 m 104.0 ! ID<br />
,<br />
cis-I,2-dichloroethene 106.4 ID 101.1<br />
ID<br />
trans-I,2-dichloroethene 1\07.3 2:9 96.3<br />
i 6.7<br />
TCE W2.9 10:8 99.4 6.4<br />
RAD<br />
Gross alpha 107.1 27.5* NP 25.9<br />
Grosslbeta 106,9 14.1 NP 18.1<br />
ID=Insufficlent Data: No duphcateresults above ,the quantltatlOn lImit were reported' for these parameters.<br />
NP=Not Performed: Soilspikes for alpha and beta were not performed at the CSL due to health and safety<br />
,concerns.<br />
* A:lthough this average is somewhat higher than the benchmark of 20% RPD for water matrices, in 939'c of<br />
the cases the calculated counting errors overlapped, indicating equivalent results .<br />
•<br />
•<br />
A TIJ983500005 Sec:!...;r.doc
2-30<br />
Table 2.9 Health and safety parameters monitored' usingreal~time instruments<br />
Parameter<br />
Instrument<br />
Airborne Organics<br />
Organic Vapor Monitor-Photoionization Detector 11.8 eV<br />
•<br />
Organic Vapor Analyzer-Flame Ionization Detector<br />
Colorimetric ~ubes-Draeger Accuro 2000 Bellows Pump with<br />
Tubes for Benzene and Vinyl Chloride<br />
Particulate<br />
Combustible Gas Indicators<br />
(CGI) and Oxygen Content<br />
Radioacti vity<br />
Aerosol Monitor-MiniramPersonal Monitor PDM-3<br />
02ILEI!.. Meter-MSA Model 360<br />
Eberline Model ESP-2 with SPA-8 Scintillation Probe<br />
Ludlum Model 3 with 44-9 GM Pancake and 43-5 Scintillation<br />
Detector<br />
Ludlum Model 2224 Scaler Instrument with 43-89 Scintillation<br />
Detector<br />
Ludlum Model' 2221 Scaler Instrument with 2" NaI Detector'<br />
Ludlum Model 2929 Counter Instrument with 43-10-1 Detector<br />
•<br />
TLD<br />
Vic450P Dose Rate Meter<br />
Noise<br />
Sound Level Meter - Quest 2700 with Octave Band Analyzer<br />
•<br />
ATlJ983500005 Sec2_r.doc
•<br />
3. PHYSICAL CHARACTERISTICS OF<br />
WASTE AREA GROUPING 27<br />
The on-site physical characteristics of PGDP have been detailed in previous investigations by<br />
Clausen et al. (1992b), CH2M HILL (1992), CDM Federal Programs (1992), and EDGe (1989). Miller<br />
and Douthitt (1993), TCT -5t Louis (1991), EDGe (1989), and Wehran(1981~ have addressed the , off-site<br />
physical characteristics. For this report, previous investigations of the geology and hydrogeology were<br />
used to describe the regional,physical characteristics of western Kentucky and summarize the physical<br />
characteristic data compiled for the PGDP area during the WAG 27 RI.<br />
3.1 REGIONAL TOPOGRAPHY AND SURFACE WATER<br />
PODP lies in the Jackson Purchase Region of western Kentucky :between ,the Tennessee and<br />
MississippiRivers, bounded on the north by the Ohio River. The ' confluence of the Ohio and Mississippi<br />
Rivers is approximately 20 miles downstream (southwest) from the site. The confluence of the Ohio and<br />
Tennessee Rivers is approximately 15 miles upstream (east) from the site. The western Kentucky region<br />
has gently rolling terrain, between 330 and 500,ft above mean sea level (amsl). Tributaries of the Ohio,<br />
Tennessee, and Mississippi Rivers dissect the region.<br />
•<br />
The average pool elevation of the Ohio River is 290ft amsl, and the high water elevation is 342 ft<br />
amsl (TCT-St Louis 1991). Approximately WOsmall'lakes and ponds exist on DOE property (TCT-St.<br />
Louis 1991). Seven settling basins.and 17 gravel pits are also located within the boundary. A wetland<br />
area covering 1'65 acres exists immediately south of the confluence of Bayou Creek and Little Bayou<br />
Creek (TCT-St. Louis 1991).<br />
AU creeks that drain the site flow ,northward toward the Ohio River. Specific details of regional<br />
hydrology are presented in Sect3.7.<br />
Local elevations range from 290 ,ft amsl along the Ohio River to 450 ft amsl in the southwestern<br />
portion of PGDP near Bethel Church Road. Generally,. the topography in the 'PGDP area slopes toward'<br />
the Ohio River at an approximate gnulient of 27ft per mile (CH2M Hll..L 1992). Within the 960 acres<br />
of the plant boundaries, ground surface elevations vary from 360 ,to 390 ft amshPrimary land uses at<br />
PGDP include industry and wildlife management; secondary uses include agriculture and fishing.<br />
3.2 METEOROLOGY<br />
•<br />
Information presented herein regarding the climate at PGDP was derived from Results of the Site<br />
Investigation, Phase II (CH2MHnL 1992). The region in whichPGDP is located Ihas a humidcontinental<br />
climate characterized by extremes of both temperature and precipitation. Table3.1 presents<br />
a summary of the average monthly precipitation, temperature, potential evapotranspiration,estimated<br />
actual evapotranspiration, and infiltration and surface runoff for the region between 1969 and 1989,based<br />
on data generated at Barkley Field Airport, located southeast of PGDP. The 20-year average monthly<br />
precipitation is 4.19 in., varying·from an average of 2.99 in. in January to an average of 5.16 in. in April.<br />
From March through July and during November and
3-2<br />
generally wetter than average. iFrom August through October and l during January and February, the<br />
weather is generally drier thaIi,average. The 20'-year average monthly temperature is 57.1 OF, varying from<br />
29.9°F ,in January to 79.0°F in July.<br />
.'<br />
Estimated actual and potential evapotranspiration rates.are'equal i in all months except June,july,<br />
August, and September. For these 4 months, estimated actual evapotranspiration is a function of the<br />
available soil moisture and is less than potential:evapotranspiration~ Maximum potential and maximum<br />
estimated actual evapotranspiration rates occur in July. From June through October, precipitation either<br />
dissipates through evapotranspiration or replenishes the:depleted soil moisture. During this time, water<br />
from precipitation is generally not available for infiltration, groundwater recharge either does not occur<br />
or is very limited,and >little of the ,precipitationthat ·falls within the.stream drainage basins runs off and<br />
is available for stream flow.<br />
From November through May, evapotranspiration is less, and water is available for infiltration<br />
and runoff; Most groundwater recharge and stream flooding occur during this part of the year, and<br />
contaminant migration ill these two media would be. increased during this time. 'nle average annual<br />
amount of precipitation, available for infiltration and runoff in the PGOP area is estimated to be 21.04 in.<br />
Both regional, and PGOP groundwater investigations indicate that approximately 4.7 in. of rainfall' per<br />
year infiltrates into·the groundwater system.<br />
Information on wind direction and speed was obtained from Barkley Field Airport. Figure 3.}:<br />
illustrates the wind rose for the average annual wind speed and! direction. Tbeaverage prevailing wind<br />
has .aspeed of 9.8 mph and .blows from directions varying from south to southwest Generally, stronger<br />
winds are recorded when the winds are from the southwest..<br />
3.3 SOIL<br />
The general soil map for Ballard and. McCracken Counties indicates that three soil ,associations<br />
are present within the vicinity ofPGDP (USDA 1976): the Rosebloom-Wheeling .. Dubbs association, the<br />
Grenada-Calloway association, and the Calloway-Henry association. 'The ,predominant soil association<br />
in the vicinity of PGDP is the Calloway-Henry association, which consists of nearly level,somewhat<br />
poorly drained to poorly drained,medium-textured soils on upland positions. Several other soil groups<br />
also occur in the regionin limited areas, including the Grenada. Falaya-Collins, Waverly, Vicksburg, and<br />
Loring.<br />
The Henry and Calloway soil series are classified as fragiaqualfs andl fragiudalfs, respectively.<br />
The fragipan subsurface horizon within these soils is a dense silty or loamy layer, which may be. cemented<br />
by non-crystalline material. This diagnostic subsurface horizon greatly reduces the vertical movement<br />
of water in the soil and is typically responsible for causing seasonal' high water tables inthese soils. The<br />
lateral continuity and' integrity of this layer may have been reduced due to construction activities<br />
(CH2M HILL 1991). The soil over the majority of PGOP is the Henry silt loam with a transition to<br />
Calloway, Falaya-Collins, and Vicksburg away from the site.<br />
The soils in the vicinity ofPGOP tend to have'alow buffering capacity, with a pH ,ranging from<br />
4.5 to 5.5. Low pH values are often associated with bighcation exchange capacities, so these factors may<br />
alter the mobility of soil contaminants (particularly metals) (Birge et al. 1990). The cation exchange<br />
A11L\983500006SEC3_R..IK>C
•<br />
capacities measured during the recently completed WAG 6 RI range from 8.92 to 69.8 milliequivalents<br />
per liter (CH2M HILL 1998).<br />
Although the soil over most of ;PGDP may ,behave been Henry silt loam with a transition to<br />
Calloway, Falaya-Collins, and Vicksburg away from the site, many of the characteristics of the original<br />
soil have been lost due to industrial activity which has occurred over the past 45 years. Activities that<br />
have, disrupted the original' soil classifications include f.illing, mixing, and grading.<br />
3.4 POPULATION AND LAND USE<br />
The West Kentucky Wildlife Management Area (WKWMA)and sparsely!populated' agricultural<br />
lands surround PGOP. The closest communities to the plant are Heath, Grahamville, and Kevil, all' of<br />
which are located within 5 miles of OOEreservationboundaries. 'The closest municipalities are <strong>Paducah</strong>,<br />
Kentucky, located 15 miles east of the facility; Cape Girardeau, Missouri, which is approximately 40<br />
miles west of the plant; and the cities of Metropolis and Joppa, Dlinois, which are located across the Ohio<br />
River from PGOP.<br />
'.<br />
Historically, the economy of western Kentucky has been based on agriculture, although there has<br />
been increased industrial development in recent years. PGOP employs approximately 2500 people and!<br />
the TVA Shawnee Steam Plant employs 500 lpeople (Oakes et.al. 1987). Total population within a 50-<br />
mile radius. of PGOP is approximately 500~OOO; approximately 50,000 people live within 10 miles of the<br />
plant' The population ofMcCrackenC6unty is approximately 62,879 (Verbal communication, <strong>Paducah</strong><br />
Chamber of Commerce, Dec. 7, 1998).<br />
,In addition to the residential population surrounding'theplant, WKWMA draws thousands of<br />
visitors each year for recreational purposes., Visitors use,the area primarily for hunting and fishing; other<br />
activities include horseback riding, hiking, sanctioned field trials for hunting dogs, and bird watching.<br />
According to WKWMA management, an estimated 5000 anglers visit the area each year.<br />
3.5 ECOLOGY<br />
The following sections give a brief overview of the terrestrial and aquatic systems at PODP.<br />
A more detailed description, including an identification and discussion of sensitive habitats and<br />
threatened/endangered species, is contained in the Investigation of Sensitive Ecological Resources Inside<br />
the <strong>Paducah</strong> <strong>Gaseous</strong> Diffusion Plant (CDM 11'994) and Environmental Investigations at the <strong>Paducah</strong><br />
<strong>Gaseous</strong> Diffusion Plant and Surrounding Area, McCracken ,County, Kentucky [U. S. Army Corps of<br />
Engineers (COE) 1994].<br />
3.5.1 Terrestrial Systems<br />
The terrestrial component of thePGDP ecosystem includes the plants and animals that use the<br />
upland habitats forfood, reproduction, and protection. The communities range from an oak and hickory<br />
forest in areas that have been undisturbed to managed; fencerows and agricultural lands in the more<br />
developed areas. The main crops present in the POOP area include soybean, com, tobacco, and various<br />
grain crops such as millet<br />
Old field grasslands constitute approximately 2000 acres of the WKWMA. Much of this
3-4'<br />
herbaceous communityisdonlinatedi by members of the Compositae family and various grasses, Woody.<br />
species,.suchas . red maple, are also;occasionallypresent.. Some of this area includes remnant prairie,as<br />
indicated by the presenceofeastemgama and' Indian !grasses. 11Ie shrub community representsa.more<br />
diverse Ihabitat,. including both herbaceous and l woody species. Within WKWMA, approximately 800<br />
acres consists oherub-shrub habitat. Dominanttrees include:cheny, persimmon, sumac, young hickory,<br />
and three,species:of oak, as well as scatteredgrowtbs of sweetgum and'hackbeny; Forest and shrub .tracts<br />
alternate with fencerows and transitional edge habitats along'roadsandipower transmission~line'corridors.<br />
Elm, locust, oak, and maple, with,anunderstory:ohumac,lhoneysuckle; blackberry, poison ,ivy, and grape,<br />
dominate fencerow communities. Herbaceous growth in, these areas includes clov.er, ,plantain, and<br />
numerous 'grasses.<br />
Mice, rabbits, and' ,a variety of other small mammals frequent open herbaceous areas~<br />
Birds identified· in: the area'include red:..winged lblackbirds, quail,;sparrows, and predators such as hawks<br />
and owls. In .transitionall areas, includingfencerows, low shrub, andiyoung forests, a variety of wildlife<br />
is present, including opossum, vole,mole, raccoon, and deer. Birds typically found in the transitional<br />
areas include red-winged blackbirds, shrikes, mourning doves, quail, !turkeys, cardinals"and meadowlarks.<br />
Several groups ' Ofi coyotes also reside in areas aroundPGDP. In, addition to. the 'larger rnammals,mature<br />
forests contain,squirreis, songbirds, .and .great horned owls. Muskratand beaver are found in 'the aquatic<br />
·habitats ofthePGDP area. Many'species of watetfowlalso use these areas, including wood ,ducks, geese,<br />
herons, and various other migratory birds. Variousireptlles, amphibians, and !terrestrial! invertebrates (e;g.,<br />
insects and spiders) are. present in, all' areas. Domestic livestock is abundant in surrounding farmlands.<br />
3~5.2 Aquatic Systems<br />
The aquatic communities in and around' the PGDP area that could 'be impactedl by iplant<br />
,discharges includetwoperennial' streams, Bayou :Creekand i I!.ittle Bayou Creek; the North-South<br />
Diversion Ditch;' a marsh located at ,the confluence of Bayou Creek and l.ittle Bayou Creek; andlother<br />
smaller drainage areas~ The dominant taxa in the ,surface· water include several species of sunfish,<br />
,especially bluegill and l green sunfish, as well as ,bass and' catfish~ Bluegills,green 'and Ilongear sunfish,<br />
and stonerollers dominate shallow streams, characteristic :ofthe two area creeks.<br />
3.5.3Wedands and l 'Floodplains<br />
Wetlands were identifiediduring the 1994C0E<strong>environmental</strong> investigation of H,71 i 9 acres<br />
surroundingPGDP. In this investigation, 1083 separate wetland! areas were identitiedand grouped into<br />
11,6 vegetation cover types (COE 1994)~ Wetlands inside the lplantsecurity fence are confined' to Iportions<br />
of drainage ditches traversing the site (COM 1994). Functions and values of these areas as wetlands are<br />
low to moderate I (Jacobs 1995);these areas provide some groundwater recharge, floodwater retention,. and<br />
sediment/toxicant retention. While the opportunity for these functions and! values is 'high, the effectiveness<br />
is low dueto water exiting the area,quickly via the drainage system. Other functions and l values (e.g.,<br />
wildlife benefits,recreation)are very: low.<br />
AtPGDP, three ~bodies of water cause most area ,flooding:: !the Ohio Rfver,'Bayou 'Creek, and<br />
Little Bayou 'Creek. A floodplain analysis perfonned,by the COE U 994) indicated that much of the builtup<br />
portions of the plant. lie. outside, the rOO-and 500-year floodplains of these streams. 'In addition, this<br />
analysis indicated that ditches within the plant area'can, contain the ,expected 'IOO-and<br />
500"'year discharges. .<br />
A 11:.\983500006 SEc3:,,:,RDOC
•<br />
3.6 REGIONAL GEOLOGY<br />
3.6.1' Regional Geologic Setting.<br />
3-5<br />
PGDP is located in the Jackson·1Purchase Region of western Kenrucky, which represents the<br />
northern tip of the Mississippi Embayment portion of the Coastal Plain Province a
3-6<br />
.1<br />
sand, This is indicative of marine and.brackish-water sediments deposited in a sea that occupied'most of<br />
the Mississippi Embayment (Olive 1980). Eocene sediments consisting of interbedded .and interlensing<br />
sand, silt. and clay overlie the Porters Creek Clay in the southern portion of the DOE propeny.<br />
Abruptchange from fine-grained deposition' of the Porters Creek Clay to coarser-grained l sedimentation.<br />
during the Eocene probably resulted from regional: uplift.<br />
Post-Eocene erosion into the Paleocene Poners Creek Clay resulted in an imponant feature<br />
known as the Porters Creek Terrace. It Ues immediately south, southeast. and southwest ofPGDP and<br />
its slope extends northward toward the southem'boundary ofthe'PGDP fenced security area. Regionally,<br />
the Porters Creek Terrace ishydrogeologically imponant because it marks the southern extent of the<br />
Lower Continental Deposits ~CD) and therefore the southern extent of the RGA. It also serves as the<br />
aquitardbelowthe RGA where the RGA laps onto the terrace slope. ThePonersCreek Clay, Poners<br />
Creek Terrace,and Eocene Sands are not present in the WAG 27 area and thus were not encountered<br />
during the RI~<br />
Continental. Deposits. Pleistocene: Continental' Deposits.unconformably.overlie·the Cretaceous<br />
through Eocene strata ,throughout the area. Ancestral rivers bordered the Jackson Purchase Region in<br />
approximately the same position as the present Tennessee, Ohio, and Mississippi Rivers (Olive 1980).<br />
Increased flow in the ancestral Tennessee River, combined with large sediment loads, resulted in the<br />
formation of an alluvial' fan in the area,of the confluence of the Ohio. and Tennessee Rivers (Oli:ve 1980).<br />
The Continental Deposits resemble a large ,low-gradient alluvial fan ,that covered much of the region and<br />
eventually buried the.erosional topography.<br />
Erosion and reworking of alluvial fan deposits have resulted in the present thickness and<br />
distribution of the Continental Deposits. The thicker sequences of Continental Deposits represent valley<br />
fill' deposits and: can be informally divided into; a lower unit (gravel facies) and an upper unit (c1ay facies).<br />
The two distinct facies are as follows:<br />
•<br />
• Lower Continental Deposits (LCD). The:LCD are found .throughout:the plant area and to the north,<br />
but.pinch out to the south, southeast. and'southwestalong the slope of the ,Porters Creek Terrace. The<br />
LCD are . gravel facies ,consisting: of chert gravel: in a matrix of poorly soned sand and l silt that rest on<br />
an erosional surface representing the beginning of the valley fill sequence. The LCD were deposited'<br />
on an irregular east-west trending erosional surface exhibiting steps or terraces. Alluvial terraces·are<br />
former floodplains corresponding to different glacial events; The gravel deposit averages<br />
approximately 30:ft thick, but some thicker deposits (as much as 50 ft) exist in deeper scour channels.<br />
• Upper Continental Deposits (UCD). 1be '(:JCD is primarily a fine-grained, clastic facies varying in<br />
thickness from 15 to 55 ft that consists of clayey silt with lenses of sand·and occasionalgravel~The<br />
UCD represent sediments deposited in a fluvial and lacustrine environment (Finch 1967; Frye et al.<br />
1972). WidespreadJacustrine sedimentation occurred along:thepresent Ohio River and Tennessee<br />
River valleys when they became choked from draining glaciated areas. The sediment dammed<br />
valleys of tributaries, creating slackwater lakes that resulted in deposition of fine-grained sediments<br />
of the DCD; Depending on stages of glaciation, periods oflacustrine deposition were followed~ by<br />
periods of erosion. As aggradation of the fluvial system,continued, stream gradients in:the ancestral<br />
Tennessee River and tributaries lessened. Lower gradients favored a ,transition from a ibraided'<br />
environment to a meandering environment A very gravelly lower sequence becoming sandier<br />
upwards identifies the transition in the subsurface.<br />
•<br />
ATL\983500006 SEC3:..Jtooc
•<br />
3-7<br />
Surface SoillLoessIFUl. The surface deposits found in the vicinity of PGOP are Pleistocene ,to<br />
Recent in age and consist of loess and alluvium. Both units are composed of clayey silt or silty clay and<br />
range in color from yellowish-brown to brownish-gray or'tan, making field differentiation difficult.<br />
Thelpess(wind-blown~ deposits overlie the UCD throughout the PGOP area. Only the most<br />
recent !(Dlinoisan- and, Wisconsinan-aged) deposits ,are represented in the, sedimentary sequence.<br />
As, discussed: in :Sect 3.3, the ,predominant soil association in the vicinity of PGDP is the<br />
Calloway-Henry association (USDA 1976). The fragipan, subsurface horizon within this soil is a<br />
densifiedsilty or loamy layer, whlch may be cemented by amorphous material~ ,Excavation and<br />
construction activitiesatPGOP during the past 45 years have reduced the continuity of the fragipan layer<br />
and increased'vertical drainage throughout the plant area (CH2M HnL 1992).<br />
3.7 REGIONAL HYDROGEOLOGY<br />
3.7.1 RegionaliSurface Water<br />
•<br />
•<br />
Information presented herein regarding the surface-water setting at 'PGOP was derived from<br />
Results o/the Site Investigation, Phase 11 (CH2M HILL 1992). PGOPis,located in the western portion<br />
of the ,Ohio River basin. The plant is within the drainage 'areas of Bayou Creek and Little 'Bayou Creek<br />
and is situated on the divide ,between the two creeks (Fig. 3;4};<br />
Bayou Creek is a perennial stream with drainage area of approximately 18.6 square miles that<br />
flows generally northward from approximately 2.5 miles south of the plant site to the Ohio River and<br />
extends along the western boundary of the plant, Little, Bayou Creek, also a perennial stream, originates<br />
within the WKWMA, flowsinorthward to the Ohio River, and extends along the eastern boundary of the<br />
plant The approximate drainage area of little Bayou Creek is 8.5 square miles (CH2M Hn...L 1992). The<br />
confluence of the ,two creeks is approximately 3 miles north of the plant site, just upstream of the location<br />
at which the creeks discharge intMhe ' Ohio River. The drainage areas for both creeks, are generally rural;<br />
however, they receive surface drainage from numerous swales that drain residential and commercial<br />
properties, including the WKWMA, PGDP, and the TVA Shawnee Steam Plant A major portion of the<br />
flow in both creeks north, of PGDP is effluent water from the plant, discharged ,through KPOES-pennitted<br />
outfalls. Deer Lick, Snake Creek, and Slough Creek drain ,the northwestern portion of the PGOP<br />
boundary.<br />
Discharge flow, specific conductivity, and ,temperature measurements were recorded at 74 main<br />
channel sites and 7 tributary sites of Bayou Creek and Little Bayou Creek on August 15 and 16, 1989.<br />
Discharge for 'Bayou Creek ,during this time varied from 0;30 cubicfeetper second (fe/s) atthe farthest<br />
upstream site to 5.8fe/s at the .farthest downstream site. Tributary .inflow along ,Bayou Creek was<br />
measured tobe,5.7 !tIs. Discharge for Little Bayou Creek varied fromO.65ff/s atitbeJarthest upstream<br />
site to 1;8fi3/s,at,thefarthestdownstream,site. Total ,tributary inflow 'along Little Bayou Creek was,O.38<br />
fe/so Specific conductivity values, recorded in Bayou Creek ranged' from208 .10489 ,microSiemens per<br />
centimeter (J.1S/cm~ and: water temperature ranged between 20.0°C and' 32.6°C. Specific conductivity<br />
values recorded in Little Bayou Creek r:cutged between 2'11 and 272 J.1S/cm, and water temperaturemnged<br />
between 14S'C and 24.9°C. 'Both Bayou Creek and Little Bayou Creek appear to 'lose stream volume<br />
to shallow groundwater south ,of PGDP but gain stream volume from shallow groundwater north of the<br />
plant (CH2MHll..L 1992).
3-8<br />
The U.S. Geological'Survey (USGS) maintains gauging stations on Bayou Creek 4.1 and<br />
7.3 miles from the Ohio ,River and a station on Little Bayou Creek 2.2 miles upstream from its confluence<br />
with Bayou Creek. The meanimonthly discharge at Bayou Creek varies from 6.53 to 60:7 rels at ,the<br />
downstream station and 6;53 to' 60:7 fels at the upstream station. The mean monthly discharge on Little<br />
,Bayou Creek ranges from '0.89 ,to 33.5 ffls.<br />
•<br />
Man-made drainages receive stonnwater andeffiuentfromPGDP. The plant monitors 17 outtalls,.<br />
which have a combined average daily flow of approximately 4.9:million gallons per day (Mgd) '(Clausen<br />
etal.1992b). Drainage ditches bound parts ofSWMl!Js 001 and 09,1. Water flow in these ditches is<br />
intennittent based; on, seasonal rainfall~ The plant,ditches are generally considered! to be located in areas<br />
where the local groundwater table is below the bottoms of the ditch channels. Therefore, ,the ditches<br />
probably function ,as influent
•<br />
3-9<br />
The McNairy Fonnation,subcrops beneath the plant.at depths ranging from approximately70'to<br />
100 ft. Sand facies account for 40 to 50% of the total fonnation thickness of approximately 225 ft. In<br />
areas' where the RGA overlies the McNairy Flow System and where the RGA is indirect hydraulic<br />
connection with coarser-grained sediments of the McNairy Fonnation, the McNairy flowis coincident<br />
with that of theRGA.<br />
Davisetat (1973) reported values of ,hydraulic conductivity for the McNairy Flow System<br />
ranging from 1.4 x 10- 8 to,4.7 X 10. 2 centimeters ,per second (cm/s):Ouringthe WAG 6 RI~ values of<br />
hydraulic conductivity were measured from 8.2 x 10⁻⁸ toLl x 10- 3 cm/s (CH2MHILL 1998). Therange<br />
of 5~ orders iof magnitude difference is due to depositional1heterogeneity between! the sand and clay of the<br />
McNairy Fonnation.<br />
Pliocene Terrace Gravel and Eocene Sands. Pliocene-aged gravel deposits and Eocene-aged<br />
reworked sand and gravel overlie the Paleocene Porters Creek Clay·in the southern portion of ,PGDP.<br />
However, in the south and west portions of the plant site, which includes the WAG 27 area, the units do<br />
not exist and thus were not encountered during the RI.<br />
•<br />
RegionalGravel Aquifer. The RGAconsists of the gravel facies of the LCD. 'The RGA is the<br />
most prominent gravel facies beneath PGDP and is the primary local aquifer. The RGA consists of a<br />
Pleistocene . graveldeposit:overlyingan'erosional surface. . The RGA is found throughout the plant area<br />
and to the north, but pinches-out to the south, southeast, and southwest along the slope of the Porters<br />
Creek Terrace. Regionally;theRGA includes ,the Holocene-aged alluvium found adjacent to the Ohio<br />
River .<br />
TheRGA is,the dominant.aquifenvithin the local flow system. Figure 3.5 shows the hydraulic<br />
gradient within the flow system (Davis!et al~ 1973), Differences in penneability and aquifer thickness<br />
affect the hydraulic gradient, which is reflected in the spacing of the potentiometric contours on Fig. 3.5.<br />
Toward the southern part ofPGDP, the RGA terminates against the Porters Creek Terrace. 'The<br />
restriction results in a high gradient and probably causes groundwater discharge to adjoining streams. In<br />
the north-central portion of the plant site, the lower gradients are a result of the thickened Pleistocene<br />
sequence containing higher fractions of coarse sand and gravel. Northward, near the Ohio River, the<br />
hydraulic gradient increases as a result of either a thinner section of RGA or low-:penneability bottom<br />
sediments in ·the Ohio River.<br />
, Regional' groundwater flow within the RGA trends north-northeasttowardibase level represented<br />
by the Ohio River. The. hydraulic gr3dient varies spatially butis on:the order of Ii x 10-4 to 1 x 10- 3 ftlft<br />
(Clausenet al. 1992b). Clausen etal. (1992b) report hydrauliclconductivitiesfortheRGA ranging from<br />
10-4 to I cm/s. !Ouringthe WA66 RI, values of hydraulic conductivity were measuredttom '1.8 x 10-'<br />
to 9.4 cmis (CH2M HILL 1998). The range of8 orders of magnitude is due ,to depositional<br />
heterogeneities within the silt,. sand, and gravel of the RGA.<br />
Upper 'Continental Recharge System. The UCRS consists of the surface alluvium and UCD.<br />
The UCRS consistsiof,clayey silt with lenses of sand and occasional gravel. PGDP hydrogeologists have<br />
differentiated the UCRSint03 general horizons:<br />
•<br />
o Hydrologic Unit 1 (H1:JI) -an upper silt and clay interval,<br />
• HU2 - an intervening sand and gravel interval, and<br />
• HU3 - a lower silt and' clay interval.
3-10<br />
These horizons are highly subjective, but there are clear features· that standi out !throughout the<br />
plant area; "UCRS"generally refers to the sandi and gravel lithofacies of the HU2.The HB2appears<br />
relatively discontinuous in ,cross section ,but may be more connected in three dimensions. The HU2<br />
penneable units are only seasonally saturated and may be considered perched groundwater rather than<br />
a regional' aquifer. The UCRS ,groundwater flows downward! into the RGA, 'hence the teno "recharge<br />
system." 'Because it is defined as a reCharge system"the UCRS not oolyincludes themorepenneable units<br />
in the HU2, but also!the silty clay oftheHU3 that confine the uppenoostwater-satunited'units.<br />
'.<br />
Regionally, ,the VCRS thickness ranges from Oft to 50 ft. Ina studyby'Clausen et al. (11992a)<br />
UCRS 'hydraulic conductivity values ranged' from 1'0-8 to 1}Q~2 cmls. During the WAG 6 RI, values of<br />
hydraulic conductivity ranged from 3.2' to 1.7 x 10:8 "cmls '(CH2M'HIIL 1998). The ,range of 8 orders<br />
lof magnitude is due ,to depositional heterogeneities within the sand, gravel, silt, and clay 'ofthe UCRS.<br />
3.8 WAG 27 SURFACE FEAroRES; GEOLOGY, AND IWDROGEOLOGY<br />
1befocus,ofthe WAG 27. RI was the geologic strata ranging in age from CretaceouS'to HolOcene<br />
orrecent Borings advanced during WAG 27 ranged in depths ,from I' to 157 ft bgs, Figure,3~6 depicts<br />
WAG 27 RI' sample locations. Boring logs are located in, Appendix A.<br />
'Seventy-seven soil borings (00 l-rnn through, 001'-044;00 l-a5'l through 001-069; and 001-0711<br />
through 001-084) were drilled atSWMU'ool during the WAG 27 RI fieldworL Sevenofthese!borings<br />
are located :peripheral to! the SWM1:J 001 site ,boundaries: (OOI';()81) located to the east;, (001-075; 001-<br />
078; and' 00,1-082) ,located :inside.thesecurity fence tMhewest ofSWMU 1 boundaries; and (001-080; .'<br />
00 1-083;andl 001-084) 'located west of the security'fence and east of Bayou 'Creek, Total boring depths<br />
ranged ,from '10,ft ,to 157 ft bgs. Surface sediment was collected from 'seven lOCations (0014>45 ,through<br />
001-050; ,001'-070).<br />
At'SWMU 091, two borings were drilled into the upper McNairy Fonoation to depths ,of 138ft<br />
and: 148 ft!bgs. Founediment samples wereicollected from'site'perimeterditches. Fourteen shallow soil<br />
borings and one CPT were completed dUring ,the RI at SWMU 196. Most boring logs lpenetrated the<br />
subsurface to,either '10· or 20 ft. However; one CPT log (;196-0:12) that was conducted' to 35A' ft bgs was<br />
also used todetennine the geology in the ·subsurface atSWMU }'96.<br />
Twenty-ninesoillborings (720~00'1 through 720-024' and 720-026 through: 720-030) were<br />
compieted'iduring WAG 27 RI. With theexception,of:boring 720-028, all !borings' are ,located: within 300<br />
ftof ,the C-720 BUilding. Boring 720-028 is locatedl approximately 500 ft .east of ,the C-720 'Building.<br />
'Boring depths ranged from 28.2ft to 156 ft.<br />
Six existing monitoring wells were geophysically Ilogged,using gamma 'and neutron tools. Each<br />
of the:borings penetrating ,the RGA/McNairy were also logged: (Appendbt D).<br />
The geology at WAG. 27 has been characterized, based on infonoationfrom soil<br />
and characterization borings, monitoring wells, and information from ,previous studies.<br />
3.8.1W:AG 27 Surface Features<br />
The plant is drained by Bayou Creek, Little Bayou Creek,their !tributaries, and man-made<br />
drainage ditches .that flow into these ,two ,creeks. Most ·of the WAG 27 investigation area, including<br />
SWMUsOOl ,and 091 and the C-720 Complex, is drained iby. ditches .that discharge :toseveralKPDES<br />
I.·
•<br />
3-\'1<br />
outfalls and Bayou Creek west of the plant. Drainage ditches at SWMU 196 eventually drain into both<br />
Bayou Creek and the North-South Diversion Ditch.<br />
SWMU 001 (C-747-C Oil Landfarm~, a relatively flat, open, and grass covered' area, is located<br />
in the west-centralpart ofPGDP. The surface topography atSWMUOOl ranges from approximately 365<br />
to 375 ft amsl. WesNrending drainage ditches are present on the north and'south sides of SWMU 001,<br />
and a south trending drainage ditch is present on the west. Surface water atSWMUmM drains to one<br />
of these perimeter ditches, with· ultimate discharge to Bayou Creek, which is located approximately 300<br />
ft west oCthe unit.<br />
The ground surface at SWMU 091 is relatively flat and ranges from 371 ft amsl near the drop test<br />
pad to.367 ft amsl in the ditch to .the south. Most of the ground surface is covered with a gravel road base<br />
up to 4 feet thick. The,concrete and steel' pad used during the drop ·tests covers an area of about 10-ft x<br />
10-ft. Runoff from SWMU09!1 predominantly flows into the ditch immediately south of the drop test area<br />
and discharges via KPDES Outfall 15 to Bayou Creek, which is located approximately 1500 ft to the<br />
west.<br />
SWMU 196 is located in the north-central portion of the PGDP, on thenorth:sideofthe·C-746-A<br />
Building. 'The site is relatively flat, with ground elevations ranging from 368 ,to 371 ft amsl. lbe surface<br />
is covered' with gravel over a majority oCthe area. A north-south drainage ditch collects surface runoff<br />
from the western part of the SWMU.<br />
•<br />
'The C-720Complex is 'located in the southwestern part ofPGDP. The surface topography at this<br />
site ranges from approximately 371 to 376 ft. Drainage of the C-720 Complex is via the PGDP storm<br />
drain system. Most of the area surrounding 'the C-720 Building is paved with concrete or asphalt.<br />
3~8.2 WAG 27 Geology<br />
The units observed during WAG 27 sampling activities consisted of unconsolidated strata at<br />
depths above 1'57 ft bgs. neeper units such as the Paleozoic bedrock or "rubble zone" were not<br />
encountered during WAG 27. The sites investigated during WAG 27 are located north of where the<br />
Porters Creek Clay and the Eocene Sands subcrop. Figure 3.7 depicts the regional stratigraphy for the<br />
PGDP area. 'The scope of the WAG 27 R:I focused on the surface soiVloessifill, the Continental neposits,<br />
and the McNairy Formation. Generalized lithologic descriptions of each unit.are described below. Figure<br />
3.8 represents an area cross section developed from the information gathered during the WAG 27 RI.<br />
Cross sections for SWMUs 001 1 , 091, and the C-720 Complex are depicted in Fig. 3.9, 3.10, and 3.11,<br />
respectively. Two perpendicular geologic cross sections of the northwest portion of SWMU 196 are<br />
shown in Fig. 3.12 and 3~13, while across section of the northeast area ofSWMU 196 is depicted in Fig.<br />
3.14.<br />
The changes in subsurface lithologies were primarily determined based on borehole geophysical<br />
surveys (electric logs) supplemented by the geologist's boring logs.<br />
•<br />
McNairy Fonnation. The Upper Cretaceous McNairy Formation is the oldest unit investigated<br />
during the WAG 27 RI. TbeMcNairy Formation subcrops beneath the WAG 27 area at depths ranging<br />
from 90 to 11 2ft :bgs. The elevation of the top of;the McNairy Formation ranges between 259 ft amsl<br />
at SWMU 001 to 282.9 ft amslat the C-nOComplex .<br />
A1L\983500006 SEc3_R.DOC
3-12<br />
Twenty-one 'borings were advanced ItO 'characterize the upper 50-ftsection of the McNairy<br />
iFormation in the WAG 27 area: 1,1 borings at the£-720i Complex, 8at SWMU DOl, and. 2at SWMl:J'<br />
091. McNairy borings were advanced to ,identify the ,Levings Member of the McNairy ,Formation, which<br />
was :typically encountered 40 ito 50.ft below ,the,ContinentalDeposits~TheLevings Member consists of<br />
dry, stiff, light gray to gray ,micaceous silty clay in the WAG 27 area~ The Levings Member was not<br />
observed in all McNairy borings. These borings were terminated approximately 50 ft into the upper<br />
McNairy:ofwhere analytical: results were. below screening levels. 'The Levings Member was:encountered<br />
at depths of 145 ·ft bgsat theC-72() 'Building and: 152 ft'bgs.atSWMU 001.<br />
'.<br />
As previously ,noted, !the· elevation of the upper McNairy Formation gradually increases from<br />
SWMUOOl(boringOO1'-075) in a generally southeasterly direction toward the C-720' Complex.<br />
Elevations ,of the ,top of the McNairy were observed highest on the west side' of ,the C-720 Complex.<br />
:Local elevation differences aUhe top of 'the McNairy are probably due to differential erosion caused by<br />
streams ,that flowed:over this unconformable surface during ,Pleistocene glacial' episodes (Clausen 1992a~;<br />
The dominant lithology of the McNairy Fonnation in' the WAG 27 area is a dark gray to bluish:<br />
gray, micaceous, !often pyritic or lignitic clay with ,interbedded variegated silt and fine- to medium-grained<br />
sand. At SWMU" 001, occasional lenses offine~grainedsilty sand orgravel i were observed. In several!<br />
!borings in ithe. WAG 27 area, the: sand content in the McNairy increases with depth, At other lOCations,<br />
.a silty sand' facies of the McNairy was encountered:jmmediately lbelow the Continental neposits ..<br />
,:Lower Continental Deposits. Twenty-six borings'were advanced :to characterize:the Pleistocene<br />
LCD: :l3 borings ,at the C-720:Complex, 11 at SWMUOO1,and 2 at SWMU·091. The Pleistocene LCD<br />
,is a ,prominent fluvial gravel 'facies beneath ,PGDP. 'These coarser-grained sediments unconformably<br />
overlie the ,finer-grained Cretaceous McNairy Formation. As shown in the cross sections (Fig. 3.8' ,to<br />
3.1,1); the :baseofthe LCD is a' Pleistocene erosional, surface. The top ofithis erosional surface is ,higher<br />
!tothe'east of the £-720 Complex. The LCD is distinguished from the overlying UCD by grain size.<br />
.'<br />
fhedominant lithology of the 'LCD is iPOOrly sorted, brownish yellow~ yellowish 'brown,and'<br />
strong brown: chert gravel with occasional' sand and' silt at various intervals. Above the gravel' facies, a<br />
fine -to medium- grained !pale yellow to brownish yellow silty sand was ,present over most, of the WAG<br />
27.area This sandi unit is encountered, immediately abovethecoarse-grainedgravel l of the LCD at many<br />
locations in the WAG 27 area ,and, where present, is consideredl to:!he part of the LCD. This sand,<br />
encountered at a depth' of 45 bgs beneath SWMU. 001, is approximately 10 to 15 ft thick.and pinches 'out<br />
:toward '.thesoutheast The sand facies· was observed at 50 tOi60iftibeneathC~720 and varied l in thickness<br />
from,S to 15; ft. Immediately east and south of theC-720 Building, this sand unit thins and becomes<br />
,siltier. At SWMU 091,this'sandwas observed to be approximately H)! ft thick. Since the contact<br />
separating the BCD from .theLCD is gradational.at some locations, the greater thickiless iof,the ,sand may<br />
!be indicative of this gradational contact<br />
The elevation of the top 'of the gravel facies ranged from.316.5 ft amsl. atSWMVOOl to 293.5<br />
ft arnsl i south of the C-720 :BUilding. LeE> thickness varied] significantly among sites. in 'the WAG 27 area<br />
AtSWMU '001, the :LCD were observed to be between, 65 to 70, ftthick. At SWMU091,. the LCD was<br />
38 to,47 ft thick. The sand unit that directly overlies the LCD gravel is typically present in the 'C~ 720<br />
Complex,withthegreatest:thickness occurring north of the C-720 :Building; The LCD: thickness ranges<br />
from approximately 45ft north of the C-720 Building t030ft south of the building. Thinningof,theLCD<br />
,towards. the south, of the WAG 27 areais related I tOithe proximity of the Porters Creek Terrace .<br />
•<br />
AU\983500006 SEC3..,:R,DOC
•<br />
3-13<br />
lTpper Continental Deposits. The UCD consist primarily of finer-grained valley fill deposits<br />
that are differentiated from the underlying LCD by grain size; The UCD represent a fining-upward<br />
sequence of interbedded day, silt, sand, and' gravel. As shown in the cross sections (Fig. 3.8 to 3.14), the<br />
layers of clay, silt, sand, and gravel grade :laterallyinto adjacent units throughout the UCD. UCD underlie<br />
the loess and range in thickness from 30to:60 ft.<br />
Eighty-four borings were drilled into or through the DCD during the WAG 27 field work.<br />
During the drilling of soil borings, the initial unit encountered was sediments of the HUI. These<br />
sediments consist of silty clay to clayey silt and were present to a depth of 15 to 17.5 ftbgs. The HUI<br />
overlies the HU2inthe WAG 27 area TheHU2consist of poorly sorted, dark yellowish brown to yellow<br />
brown silty sand and gravels that are interbedded silt and clay. These coarser-grained sediments are<br />
prevalent between '10' and 40ft bgs and range in thickness ·from ,1 to 10ft. These units can be laterally<br />
continuous; however, this ,is not typical. At SWMU 001, discontinuous sand and' gravel units are more<br />
common at depths of 15 to 40 ft bgs. The first sand and gravel unit is approximately 5 ftthick and occurs<br />
at 20 ft bgs.The second is encountered approximately 30 to 35ft bgs. These two units, plus the<br />
intervening sandy clay, form the HU2 hydrogeologic unit at SWMU 001. The distinguishable lenses of<br />
sand and: gravel typically occur in the 25- to 40-ft bgs range at the C-720 Complex, ,but are·obserYed in<br />
several borings at 15 to 25ft bgs.<br />
•<br />
Clay and . silt percentages increase below the HV2, with minor occurrences of lenticular sand .and<br />
gravels. The silts and clays from 25 to 50 ft bgs are considered part of the HU3 confining layer, but<br />
occurrences ohand and gravel at these depths in some borings indicate that the HU2IHU3 contact is<br />
gradational. Where the HU3 confining unit is clearly defined, it consists of yellowish brown and grayish<br />
brown silty clay with minor sand content Generally, the HU2IHU3 contact is better defined at the'C-720<br />
Complex than at SWMU 00 I, where the sand and gravel content is less significant at levels below 30 ft<br />
bgs.<br />
Surface SoillLoessIFilI. Loess deposits overlie the UCD throughout the WAG 27 area Loess<br />
was present in all borings. from the surface to a depth of 15 to 20 ft, except in developed . areas outside of<br />
SWMU 001 where fill was observed toa depth up to 5. ft. The loess consists of predominantly clayey silt<br />
and silty clay, with occasional traces of fine sand and gravel. It is difficult to distinguish the loess from<br />
the lacustrine deposits of the UCD.<br />
Most of the fill observed in ,the WAG 27 area consists of sandy or clayey gravel and occurs to a<br />
maximum of 5 ft bgs, but typically only 0;5 to 1.0 ft bgs. Varying thickness (0.2 to 3ft)of sandy gravel<br />
and gravely sand fill are distributed along the northern and western perimeter of Building C-746-A<br />
(SWMU 196). Boring locations 196-003 and 196-012 lack this fill.<br />
3.8.3 WAG 27 Hydrogeology<br />
Hydrogeologically, the scope of the WAG 27 Rlfocused on the McNairy Flow System, RGA,<br />
and UCRS. Other regional aquifers in the WAG 27 area were not encountered during the RI.<br />
•<br />
McNairy Flow System. The dominant ilithology of the upper McNairy Formation in the WAG<br />
27 area is clay. Laboratory geotechnical analysis from .the WAG 6 RI indicates an average hydraulic<br />
conductivity of the McNairy Flow System of 2.9x10⁻⁴ crnls(CH2M HILL 1998). Comparison of the<br />
hydraulic conductivity measurements taken from nearby SWMUs at the PGDP (Fig. 3.15) shows that the<br />
clay lithology of'the McNairy is much less permeable than the coarser sediments of the RGA. McNairy<br />
Formation sands occur immediately below the RGA at several, locations east of the C-720 Building,
3-14<br />
promoting potential downward .flowofgroundwater. Since contaminant concentrations are negligible.<br />
in the McNairy at these locations and the sands [below Ithe RGA are of 'limited' extent,. substantial<br />
downward i flow of groundwater does not occur. Groundwater flow in the McNairy is considered<br />
coincident with ;the RGA, where McNairy sands immediately ,underlie the RGA.<br />
Regional Gravel Aquifer. 'The major .pathway of groundwater ,flow at WAG 27 'Complex is<br />
withintheRGA, whicbdominatesthe flow ,regime. The RGA is ,the primary regional aquifer 10 the<br />
investigation area In the WAG 6RI, values 'of hydraulic conductivity were measured from 1:.8dO~7 to,<br />
,more Ithan 50 cmls (CH2M HIl.L 1998)~ As illustrated in Fig. 3.15, ,the average hydraulic conductivity<br />
measured in the RGA is, greater than those of the overlying and underlying'sediments. The,range of eight<br />
orders of ' magnitude is due ito depositional 'heterogeneities within the sand andgravell of the RGA.<br />
In 'the WAG 27 investigation area, sand constitutes ,up 'to 30% of RGA lithology and appears in<br />
discontinuous. lenses at various intervalS~ The sands may impede groundwater flow and were observed<br />
.to be more ,prevalent at SWMUs'OOl and 091 than at the. C-720 Complex.<br />
The potentiometrksurface oftheRGAat SWMU 00,1' and 091 is shown OIl' Fig. 3.16 based Ion<br />
water levels collected in January 1998 I(Appendix IB). Piezometer data in ,the C-720 Complex suggest that<br />
the groundwater flow in the,RGj\ is Iprimarily to the norili:.:northwest, aided by an' elevation decrease of<br />
,the confining clay layer below 'the RGA in a northwest trend from.c· 720 to, SWMUO~}I1i. 'TheC-nO<br />
'hydraulic gradient is measured to average 1 ;Ox1 Oi 3 ftlft,according ,to the ,potentiometric Study during this<br />
Rlat the C-720 Complex (see Fig. 3 .17)~The mapping atthe:C· 720 Complex was based on four of five<br />
piezometer data points that were collected I during i.the,.RI. rOata from 'PZ~O(H' ,(720-012) were ,not used to<br />
,construct the map. as ithe water Ilevel in this welll was significantly lower than expected and contrary'to :.<br />
the well-defined gradient in lthe RGA at the ,PGDP; This. discrepancy may be due to placement of the<br />
'screen in this well' across a1tight silty sand zone, as opposed to the more porous gravels that;are'typically<br />
;screened in ,the RGA..'Fhe;potentiometric surfacehelow theSWMU 00land:SWMU091 area is flatter,<br />
withi ,hydraulic gradients of ilessthan 2:0xl0-4 ftlft.Flow is 'primarily towardtbe nonhwest,bm high<br />
conductivity intervals associated with ancestral fluvial' deposits in the RGA ;at SWMUs ,00,11 and. 091<br />
indicate a' westerly flow componentthat may contribute to the hydraulic gradients.<br />
The RGA is recharged by infiltration from the VCRS and ,underflow from 'the terrace gravels<br />
south of the WAG 27 area. Hydrograghs of RGA water levels show a'declinein water levels during the<br />
summer and fall months, due to decreased precipitation and subsequent infiltration and runoff during<br />
thesemonths, Watedevel data' are ,presented in: Appendix B.<br />
Upper Continental Recharge.system~"UCRS"generally'refers to the .sand ,and gravel of the<br />
002 and.the silty and sandy clay of the HU3 iaquitard~Groundwater flow in the UCRS in the WAG 27<br />
area is predominantlyvertical,and provides the majority ofRGA recharge. Strong vertical gradients:occur<br />
"between the VCRS and RGA based on ihydraulicihead difference of as ,much as .30 ft between MW -162<br />
and: MW;. t61, which are screened in the l;JCRSand' RGA, ,respectively. AlthQugh some Ihorizontal flow<br />
is .apparent from transmissive zones in the UCRS, downward vertical flow is . also demonstrated in head<br />
differences between ,the UCRSand RGA '~-203 and -204)~ A strong:southeastedy flow component<br />
,has also been,described using colloidal borescope measurements from MW-1'62 ~0E 1:996a), but,these<br />
data are of very lOCalized! nature and may not accurately represent the actuall groundwater flow direction<br />
in the VCRS.<br />
Horizontal flow in 'the UCRSmay [be more significant at ; the C-720 Complex, where the 003<br />
exhibits lesscoarse;.grained! sediments than, at SWMU 001and!S'WMU 091. One water sample was<br />
'.<br />
A1L\983S00006 SEC3_R.DOC
•<br />
3-15<br />
obtained from the UCRSat SWMU 001 and five water samples were obtained at the C-720 Complex.<br />
The water samples collected from 'the C-720 Complex were,obtained from between 3 and 33 ft bgs. A<br />
water main leak immediately east of boring 720-012 could have been the source of shallow water<br />
encountered in the UCRS south orC-720. The VCRS at all other locations did not contain sufficient<br />
water during drilling to allow a sampleto be collected and is essentially dry.<br />
A 3- to 5-ft-thick interval! of sandy gravel, the HU2, underlies the HUI clays atSWMU 091.<br />
When this layer is saturated, hydraulic conductivity values range from 3.7 x 10⁻⁶ to 3.97 x 10·s cm/sec<br />
and storase coe~cients range from 7.43 x 10-~ to 5.9 X 10~2. This sand! and gravel unit overlies the silty<br />
clay to clay HU3. Together, the units between 0 and 48 ft bgs (091-002) to 59 feet bgs (091-001)<br />
constitute the UCRS at SWMU 091. The lower clay unit serves as an aquitardl Perched groundwater has<br />
been measured to 6 ft bgs. Although the UCRS consists of numerous horizontally oriented sand and<br />
gravel lenses in the clayey silt matrix; the groundwater flow direction is primarily downward. Water<br />
levels collected from the UCRS (MW-160) measured 9.25 ft below top of casing in January 1998.<br />
•<br />
Clausen et al. (l996) demonstrate a correlation between Ohio River water levels and those<br />
measured in the UCRS and RGA. Head·differencesbetween the RGA andUCRS(approximately 30 ft<br />
at SWMU 091 indicate a primarily downward gradient from the UCRS to the RGA. Colloidal borescope<br />
measurements .taken in MW-160 during the WAG 6 Industrial Hydrogeologic Study ~DOE 1996a)<br />
suggest a horizontal ·flow component ranging from southwest to southeast at the time of the<br />
measurements. Water level measurements from these wells support these findings. Depth to Water in the<br />
two RGA wells (MW-158 and -159) were consistent at 49:88 and 50.11 ft below top of casing. The flow<br />
therefore appears to be predominantly downward with a small horizontal component. A detailed<br />
discussion of the 'hydrogeology at SWMU 091, in particular the sandy gravel generally between 18 and<br />
26 .ft bgs, ,is given by Clausen et al. (1996).<br />
Little is known about the site-specific hydrogeology of SWMU 196. Six Geoprobe soil samplers<br />
were penetrated to a depth of 15-ft bgs around a nearby underground storage tank. SWMU 139. The next<br />
closest soil borings are 400 ft westand 700ft northeast: the P4G12.andP4F8 borings from the Phase IV<br />
investigation, respectively. The closest monitoring wells are MW-257 and MW-261, which are RGA<br />
wells 500 ft west of the SWMU, and MW -173 and -174. which are RGA and, UCRS wells 700 ,ft north<br />
of the SWMU. In general. the hydrogeology should be similar to those of SWMUs 001 and 091. with<br />
VCRS sands and gravels approximately 30 ft bgsand RGA sands.and gravels approximately 55 ft bgs.<br />
The CPT point was completed to determine the presence of water in the UCRS. No water was<br />
encountered in this boring .<br />
•
•<br />
This pageintentionaUy left blank.<br />
•<br />
•
•<br />
:N<br />
•<br />
s<br />
WIND SI'EED (mph)<br />
&';0 11).15 15-20<br />
>20<br />
• ~<br />
~<br />
NOTE: CENTER OF DIAGRAM CORRESPONDS<br />
,TO WIND SPEEDS OF
•<br />
Approxlmate limits of<br />
the Coastal Plain<br />
Mississipl Embayment<br />
of the Coastal Plain<br />
WESTERN<br />
KENl\JCKY<br />
COALFIELD<br />
EASTERN<br />
KENTUCKY<br />
COALFIELD<br />
SPRINGS<br />
~ESSEE<br />
RIVER<br />
50 o<br />
Fig. 3.2.<br />
province map for PGDP.
•<br />
•<br />
i<br />
i<br />
1 SYSTEM! SERIES 1 FORMATION<br />
THICKNESS . DESCRIPTION HYDROGEOLOGIC<br />
IN FEET SYSTEMS<br />
I 1 i<br />
!<br />
i<br />
! !<br />
! I Br..-. or gray sand and silty I<br />
,I PIeistDceII8 1<br />
I<br />
AJJuvium<br />
etay oreta~ silt willi<br />
1<br />
I; I and~1 i<br />
streaks of sand<br />
1 0-40<br />
i<br />
I<br />
Upper Continental<br />
Recharge System<br />
(UCRS)<br />
sand ID gravel, Oflan m'--. 1<br />
-------------~------+-----------<br />
I<br />
I-----T", , ~<br />
, CuidltNWdal DeposIIs<br />
I !<br />
I Regional Gravel<br />
! i' I<br />
,<br />
I<br />
and clay.<br />
I<br />
1<br />
I I<br />
I<br />
I Red bnIwn, or MtiIB fine ID i<br />
I<br />
1<br />
__ grained sand. Beds of<br />
i I<br />
MtiIB ID clark gray clay are<br />
I<br />
I<br />
I I distrlbulad at random.<br />
~ I<br />
i<br />
i<br />
e-Sands<br />
Eocene<br />
1).100<br />
t (UndIfI)<br />
I<br />
I<br />
White ID gray sandy etay, etay I<br />
~<br />
I I congJomendB and boulders,<br />
acatIIIIred ctay lei-. and lenses<br />
I I<br />
I<br />
of __ reel sand.· Black ID<br />
I<br />
I<br />
1 clark gray IIgnilic etay, silt, or<br />
i I<br />
fine grained sand:<br />
I<br />
I<br />
I Dark gray, sIIgtdIylD ..,<br />
I mic:aceou& ctay. Pine grained I<br />
i<br />
eta~ sand, c:ommonIy giauGanitic 1<br />
I I<br />
Porters Creek 1).200 in.the upper part. Glauconitic<br />
I Pai80cefIe<br />
sand and etay<br />
I<br />
at the base.<br />
Clay<br />
A Gravel layer rrenace car-t") I<br />
i !<br />
I<br />
pnIII8IIt aIDp the etay tanace,<br />
i<br />
I<br />
2-8 reatthlck<br />
!<br />
i<br />
i<br />
i I<br />
I Graylsh.whilllllD dark micaceous I<br />
!<br />
I<br />
clay, oftIIn.sllty, InlBrbedded with<br />
i<br />
I<br />
IlghtgraylD~<br />
! !<br />
I<br />
1 ¥8t'Y fine ID medium grained<br />
I<br />
I<br />
!<br />
200-300<br />
I CIa,mnand I sand. The upper part is mostly<br />
I<br />
McNairy Formations<br />
i<br />
clay, the lower part Ia<br />
i<br />
predominantly micace0u8 fine<br />
I I sand.<br />
Cretaceou&<br />
I<br />
I I TlllcaloDsa<br />
I<br />
Whillll, -'I rounded or broken I<br />
I<br />
FormatIon<br />
? chert gravel with clay.<br />
i<br />
I<br />
i<br />
I I<br />
~<br />
I<br />
I<br />
I E I<br />
Br..-.or ~lDtan<br />
IPlelall108ll81 a.-<br />
ID gray unstratified silty etay<br />
I<br />
I<br />
!<br />
~<br />
I<br />
I<br />
I i<br />
Upper CordInenIaI.Depo8IIa 1<br />
I (etayFactas) Orange ID,.~<br />
. PleistIl 08118<br />
I<br />
I<br />
bnIwn ID bnIwn eta~sllt, __<br />
I<br />
CordInenIaI<br />
¥8t'Yflne sand, trace of fine I<br />
! I<br />
DepositB<br />
I<br />
3-121<br />
I<br />
, I<br />
(Gravel Facies) Reddiah-bnIMI<br />
1 Aquifer<br />
I 1 PI~ '1 silty and. sandy gravel, slit<br />
I MississippIan Dark gray limestone and<br />
I 5OI)t-<br />
MiaaissippIan<br />
I<br />
InI8ft)edded chert,<br />
~<br />
I<br />
C8rbCInates I<br />
1 I;<br />
i<br />
Some shale.<br />
McNairy<br />
Flow<br />
Sysliem<br />
i<br />
Adapted FRIm:<br />
Finch, W.L., 1987 Geologil;al Map of part of the Joppa Quadrangle,'McCracIaen County,Kentucky. U.s. Geological SurwlyGQ.852<br />
Olive, W.W., 1966 Geological Map of part of the Heath Quadrangle, McCracken and Ballard Counties, Kentucky. U:S. GeoIogiI;aI Survey.QQ.i81<br />
•<br />
~:<br />
i<br />
~--------------------------------------------------~<br />
Fig. 3.3. Utbostratigrapbic column of the Jackson Purchalle Region.
•<br />
LEGEND<br />
", - •• - _'ACIIWATeR<br />
_ .........- 1111 TIIACIUI<br />
--<br />
= IlGAD<br />
/<br />
,.<br />
I ,<br />
,/<br />
.<br />
,<br />
r- ..<br />
, i-<br />
, "<br />
!I : ,<br />
;1 ~" "-<br />
: \<br />
I "<br />
\<br />
\<br />
\ ,<br />
.<br />
\<br />
\<br />
,<br />
. ' . , ,<br />
.<br />
•<br />
,<br />
\<br />
o 1000:ZOOO 4000<br />
SCALE,II FEET<br />
Source: Clausen et aL 1992a<br />
Fig. 3,4. Surface water features in the vicinity of PGDP,
•<br />
LEGEND<br />
1'//
==-= - ---- )<br />
-- ~<br />
.....<br />
L---tt-SWMU196<br />
,<br />
!<br />
n<br />
Li<br />
~~~~~~~~--~--~<br />
======:::C:::) (<br />
~- (<br />
I<br />
I<br />
-<br />
I r<br />
l<br />
J<br />
r-- "<br />
~ Jl - )i 6'-1<br />
H; ~ ~ :rIO~ IL~5$Fr:1 ; c<br />
o<br />
, :lL, Jl Lr-') ~ 1---1h :ULJ W'-==H·<br />
0...",- -----,r--rh i _ Iii Y I<br />
II ~ it I 1 ,1 ,<br />
=<br />
h<br />
, I<br />
I<br />
u<br />
I I ,<br />
U U<br />
WAG 7J AREA--'<br />
u<br />
SWMU 091 .u u U<br />
v<br />
•<br />
-- It II I ...... -.<br />
.-<br />
I<br />
_.<br />
-.<br />
'" .:"_-.-l - -<br />
.- - -j<br />
IU II ..........<br />
-<br />
__ l l l ~ ' ""~<br />
... "<br />
• ..<br />
•<br />
•<br />
•<br />
•<br />
SWMU<br />
0<br />
001---fN -- ,-;;;..,.:-: "'""i11..t...";;:.r" - - -"<br />
IIII1l11<br />
Iff<br />
........... ye:=.-·-·",..·-· .-<br />
.-<br />
cm-w3.~ U;-~~ --.lL<br />
.<br />
I I<br />
-Q)MIJ,fr r- r-~<br />
IL I ~.. ! ~.=~~~ '-I \<br />
_ . I "::..<br />
-:- ....<br />
1·::,~ I r<br />
..<br />
__7<br />
........- ....... m'*<br />
•<br />
-<br />
-<br />
-- I.<br />
-<br />
-. I I,'----<br />
I<br />
.- --<br />
- 1<br />
_ _ J<br />
I<br />
-.<br />
.-<br />
~<br />
•<br />
.<br />
.<br />
.<br />
~ .<br />
.<br />
.<br />
--I.~------~.~------~.~<br />
SOUTH<br />
Approximate<br />
WAG 27<br />
Study Area<br />
NORTH<br />
. , - ~ . . . - - ~<br />
. . . . . . . . . . . . . . . . . . . . . . . . . . . . . . . . . . . . . .<br />
. . . . ~ . . . . . . . . . . . . . . . . . . - . . . . . . . . . . . . . . . . . . . . . .<br />
...... ......................................... . . ...........<br />
. . . . . . . . . . . . . . . . . . . . . . . . . . . . . . . . . . . . . . . . . . . . . . . . . . . . . . . - ....... .<br />
. . . . . . . . . . . . . . . . . . . . . . . . . . . . . . . . . . . . . . . . . . . . . . . . . . . . . .<br />
. . . . . . . . . . . . . . . . . . . . . . . . . . . . . . . . . ... . .. ............. . .... - ............... - ... .... .. .. ........ .<br />
• • • • • • • • .. • • • • • • • • • • • • • • • • • • .. • • .. • • •• •• •• • • •••••••••••••••••••••••••••••••••••••••••••••• .o ••••<br />
::::;:::::::;:;:::::;:::;:::::::: :::;:: :;::: ::: :p9ft~rs: ¢r~~::: ::::::: :::::::: :::::::::::::::::::::: :::::::::::: ::::::::::::::::::::::::::::::::::::::::::::::::::::::::::::::.:::<br />
::: :::::::::: :: :::::::::::::::::::::::::::::::: T~~~~ : ~~qp'~ ::::::::::::::::::::::::::: :::::<br />
. . . . . . . . . . . . . . . . . .<br />
::::::::::::::::::::::::::::::::::::::::::::::::::::::::::::::::::::::::::::::::::::::<br />
~<br />
. . . . . . . . . . . . . . . . . .. . . . ...... . . . . . . . . . . . . . . . . . . . . . . . . . . . . . . . . . . . . . . . . . . . . . . . . . . . . . . . . . .<br />
~ . . - . . . . . . . . . . . . . . .. . . . . . . . . . . . . . . . . . . . . . . . . . . . . . . . . . . . . .. . . . . . . . . . . . . .<br />
Rubble Zone<br />
Eocene Sands!<br />
wmm<br />
Porters Creek Clay ~<br />
Terrace Gravel<br />
Bedrock<br />
(Mississippian Carbonates) Regional Gravel Aquifer Loess f~"\V~.\~ r~~f'~· 1<br />
~ , , . ..<br />
f:i; I " l:::t<br />
!:;:;:;:;:;:;:;:;:)<br />
McNairy Formation I I Upper Continental Deposits I ~ I Ohio River Alluvium t:::::::::::::::::l<br />
Fig. 3.7. Regional stratigraphy for PGDP area.
'b<br />
,',. .~'" ' .. .•• W-""f>.? • ,'T .. ' .:" .i;> ' oo>~i;> ' " i;> , , '::::::: ;; ~itl": .j~l l!>'IO ,~ :'Vll 'ti"'i'G'P ' iP.i"
I-<br />
Ul 0<br />
~ Z <br />
O::::J~<br />
Ct:I:~~<br />
I- ~ I:i:<br />
::l-,~<br />
OW<br />
U><br />
VLL~~OO<br />
l~<br />
/ -<br />
«I<br />
i:::::::8<br />
q /<br />
0/<br />
0 ,<br />
ift<<br />
lL<br />
0<br />
W<br />
~8<br />
t;(...J<br />
...J...J (!)<br />
w« z (!)<br />
>u<br />
WCl) ~ z<br />
....J ..J> 0 ~<br />
W 0:::1: m 0<br />
0 wa.. CI) m<br />
Z<br />
~ ~ !:J<br />
c:::<br />
~@<br />
C3<br />
(!) u CI) (jj :::> a:<br />
« u<br />
• o as<br />
~<br />
0 c: 0<br />
0 Z Q':o<br />
;; as W ' d '<br />
0 C)<br />
Q ~()<br />
0.3<br />
W ' d "<br />
~ ~<br />
~<br />
......<br />
t>I • 0<br />
(!)<br />
Z<br />
...J<br />
0 ...J<br />
...J<br />
~ ~ ~<br />
U (!) 0::<br />
0 w<br />
...J z I-<br />
W ~ Z<br />
...J<br />
a.. ~ 0<br />
W<br />
z<br />
~<br />
0= « Z z<br />
0 w<br />
0<br />
CI)<br />
m ~ w<br />
I- 0::<br />
& z (!)<br />
w z u<br />
CI)<br />
« ~ i= ..J<br />
z 0<br />
0 W<br />
~ CI)<br />
CI)<br />
..J<br />
~ ~<br />
4t !5iI @ IIIIID<br />
CD<br />
CD<br />
~ en_<br />
_CD enG) ~-<br />
ftlCD<br />
"ELL. Cii.f<br />
0 lVNOIE>3H ~<br />
~------~~~~~~--------------------------~--------------~------------~--~~--~<br />
• •
a a a 0 0 a 0<br />
8 ~ g ~<br />
a<br />
-0 2 ~ ~ ~<br />
~ ~ ~ ~ ~ ~ Ct) Ct) C\I C\I C\I C\I C\I N C\I C\I<br />
W3.LSAS 3S~03H lVlN3NIlNOO l:I3ddn I M3::IInOV13AW91VNOIS3H I W3J.SAS MOl:l Al:IMA1<br />
~------------------------------------------------------------------------------------~ ~<br />
• •<br />
~<br />
~
•<br />
A<br />
NORTHWEST<br />
ELEVATION<br />
(FT/MSL)<br />
375<br />
365<br />
355<br />
345<br />
335<br />
325<br />
-<br />
en<br />
.....<br />
.....<br />
co<br />
9'"<br />
o~<br />
..... 9<br />
No.<br />
"'-<br />
/<br />
/-- GROUND SURFACE<br />
A'<br />
SOUTHEAST re<br />
ELEVATION "<br />
(FT/MSL) ~<br />
8 - - - - - ------------------~-------..,;.--------------;..------<br />
------------~----------<br />
~----------~-----------<br />
--------------~-------~~---<br />
-- -------------~--~-----------<br />
-----------------~~- - - -~~ -- -<br />
----------~----------~------<br />
------------~~----- --------<br />
-------------------- -------------- - ---- --- ------ -- - ----------------------~------------~-----..,.;-----------_--:.<br />
---- --- _ .... ----<br />
-------~-------------~-<br />
-----------~------------<br />
--- ------------------- -------------<br />
---~-~------------------------- - ---------------- --------~-------~-- ~---<br />
--------------------<br />
--------.--------------<br />
- . ~ - --. '- - - - -<br />
:, - ,,~ - .... - .,.. - - - - '- - - ---------- : __-__.- _- __- _- _- _- _- __",,>:::<br />
-.::.::.::..<br />
---- ::::. =::=-~.:":-:::'!'!===".=-=.'t~:-=.;-~:-::....::-=--=-::....-:-~-::,-;.-:-~. -- - ----- -------~ -:--- :.:..,;..;....-_- ...,-;;.~~ ------ ~-____ -l.-~--.'--,.--:i-;;..' --- ;.- . -<br />
-- .- - - - - - - - - - - - '- -... -,-<br />
-~---~--:-- ~ --<br />
'-:------~--- --~--..:-------.----<br />
~ --------------------------------------' ---- -:?---~--;::".--~<br />
-_-_-~-_-_-_-_-_-_-_-_-_-_-_-_-_-_-_-_<br />
----------~------ - - - - - - - - - ,... - - - .- - -- - - - ,.,. .- '""""c-=.,,--.--,--,-,~+~<br />
_-_-_-_-_-_-_-_-_-_-_ ~..:..-:-...:...~..:...~...:...-:-..:...-:-...:.... _0_._._._._._.- - - - "':- .... __ ...., - ..-1. - ~ - -- ~ - - ....,:-'=~F~-':l<br />
- ~~-~-~-~-~-~-~-J;;_.:-~-,;;;-~-=~=-=-=-=-~-~:-=_-=.-<br />
-----------~~~------~--<br />
__.:...._:_:...._:_~:...._:_:...._:_~:...._:_~_:_:...._:_:...._:_:...._:_~_:_:...._:_:....-::.::.- :::.-:::t==_=_=--:_"_::::--- _ __ -:- ______ ,--' ~ __ --' __ _ ,_<br />
- -.-:-~-:-..:.-:-~ .. -.-.-<br />
- -- - - - - - - - - - - --- -- :- - -_._ ._._-_._ -_._-_._-_. ... ---- - - - - - - - - - - -'--- -- - - - ..... - ~ ---------~-~-~----~---~--- " "- '-<br />
--------------------- ---------<br />
2 -3300:::-:::-:::-:::-:::-:::-:::-:::-:::-::-:::-:::-:::-:-:::--<br />
- ~ -~- ---- ----------~<br />
~----~~-~'"~'" ~,, ~'"-~. - - - -------------~------------<br />
-~--.,...--- ' ..,..---<br />
.,..... ,- ...... - - - -- - - - - - ....:.<br />
~~-~------ - ------<br />
-----------------<br />
---------------~------------------:---------------------- ---'<br />
---------------------------<br />
- - - - - - - - - - - - - - ~ - - - , - - - ""r - ~ - - - -<br />
----- -- ------------~----~---<br />
- _-_-_-_- _-_- _-_- _-'-..,._-___- _:-~-_- _-..;;;:<br />
-;..-;:..;-:;:..;:-:,..;;.,.,=,~~T=i1~'" ::-<br />
, 1_<br />
------ ------ ~----~---<br />
-------------~-------<br />
315<br />
305<br />
295<br />
285<br />
275<br />
265<br />
- - - - - - - - - - - - - --. - - - - ._._._-_._._-_._._._._._-_._---- ------<br />
255<br />
245<br />
235<br />
225<br />
- - - - - - - - - - - - - - - - - -~~===-;:==='"~;n:;:;:;:,:;;.:.:;:::;~~:;;:;;:~:;;;,-;;:.:: --;;,;;<br />
---- .-. ------ ------ .---------<br />
-:-:-:-:-:-::-:-:-:-:-:-:-:-:-:-:-:-:-~i'H+"'
•<br />
A<br />
NORTH<br />
MSl<br />
(FT/MSL)<br />
380<br />
A'<br />
SOUTH<br />
MSL<br />
(FTIMSL)<br />
380<br />
HoI.,8C11e<br />
• 196-{103<br />
196-016<br />
i!'I<br />
A" 196-{117<br />
SWMU 196<br />
375<br />
375<br />
370<br />
~--· E-WTRENDING 4" DIA.<br />
/~ CLAY DRAIN PIPE<br />
GROUND SURFACE<br />
00<br />
.....<br />
..... ~<br />
370<br />
Location<br />
LEGEND<br />
GRAVEL<br />
•<br />
~<br />
~<br />
(f) 365<br />
w<br />
~<br />
o<br />
~<br />
~360<br />
!Z<br />
w<br />
z<br />
§<br />
ffi 355<br />
8:<br />
._._._._-_._-_._._._._._._._._._-_._-_._-_._._._._-_._._._._--._-_. -----_.__.__ .__ +-- -_._._--"<br />
:l .-:.:-:-..:.. -:-.:::-":"-:-..:..-:-..:..-:-..:..-:-..:..-:-":"-:-.:-::-..:..-:-..:..<br />
-:-.::-:- -..:..-:-..:..-:-..:..-:-..:.. -:-.:..-:-..:..-:-..:..-:-..:.. -:-.:..-:-..:.. -:-..:..-:-..:.. -:-..:..-:-..:..-:-..:.. -:-..:.. -:-..:.. -:-..:..-:-.:::-..:..-:-..:..-:-..:..<br />
-:-..:..-:-..:.. -:-..:..-:-..:.. -:-..:.. -:-..:.. -:-.:::-..:..-:-..:..-:- . W ·;.,::.·:... · :..:; " '...:.... ' .:..:; ' .;..;.,. ...",. """' .-=. -~.<br />
.- .--_._-- -- -_._-_._----<br />
-,=. - -:-..:.. -:-..:..-:-..:..-:-..:..<br />
-----_._._--<br />
-:-..:.. -:-..:.. -:-..:..-:-..:..<br />
-_._.-._----._-_.-<br />
-:-..:..-:-..:..-:-..:..-:-..:..-:-..:..<br />
-:-..:..-:-..:.. -:-..:..-=-:-..:..<br />
---_._-------<br />
-:-..:..-:-..:..-:-..:.. -:-..:..-:-..:..<br />
.-._._-- ---- .-._._._-_._.- -_._-_._._--._---_._-_.-.- -- -_.-.- ._.--_._---- ---_._--.- ._._--._--<br />
365<br />
360<br />
355<br />
CLAY<br />
SAND<br />
SILT<br />
•<br />
UCRSBORING<br />
SEDIMENT SAMPLE LOCATION<br />
350<br />
-_._-_._---- -_._------ ---- -- -- ---------_ ._._---_._ ._ -- ---_._-_._._.--_._ -- -_ ._ ---_._- -- ._ . __ ._ ._._-- -_ ._--._--_.- ---- -_ ._ -- -- ---_ .--_._------------_ ._ -- -- -- -- -- ,-_._ -- .-<br />
o<br />
o<br />
Horizontal Scale<br />
in Feet<br />
•<br />
12-()4-96 WAG27-31.COR<br />
Fig. 3.12 North-south geologic cross section A-A' in northwest area of SWMU 196.<br />
Vertical Scale<br />
In Feet
~<br />
......<br />
w<br />
m<br />
Q)<br />
,.... en<br />
~<br />
CD<br />
,.... en<br />
(0<br />
CD<br />
0<br />
0<br />
co<br />
c=r<br />
(")<br />
a<br />
en<br />
en<br />
en<br />
CD<br />
U<br />
0'<br />
:::J<br />
»<br />
~<br />
:f<br />
:::J<br />
0<br />
;:4.<br />
::J<br />
=E<br />
CD<br />
,..... en<br />
Q)<br />
(j)<br />
Q)<br />
0<br />
-en<br />
~<br />
c<br />
......<br />
co<br />
(J)<br />
1.L!....L4.:...l...:.-L!....L..!...l...!....Wu..:...J..4l.!..L.!..L.!...l...!....L.W..!..l...!...l+l....!..L!...L!..L!..l...!..J.~FJ...!.Li..Li...LJJ:.::...I~.Iil:.L:::!I.:.I:.J..J~pu:J':.....L~~~i..:l.Lu....u.i...l.iJlJ...UjliL-~ __ --I i ~ ~ ~<br />
w<br />
w<br />
(]I<br />
w w w w w w w W~ 0 -I<br />
.t:>. .t:>. (]I (]I 0- 0- "-.J '-I Z<br />
o ~ 0 ~ 0 ~ 0 ~<br />
G><br />
::0<br />
o<br />
C<br />
z<br />
o<br />
CJ)<br />
C<br />
::0<br />
~<br />
o<br />
m<br />
m<br />
0 0<br />
!IIIjjI<br />
•<br />
~ ... ...<br />
r r-<br />
m 0<br />
....,> h~<br />
Ci) g ..g,<br />
I \UON " W<br />
m<br />
Z -0'<br />
6<br />
&i<br />
1<br />
0<br />
::l<br />
en c en en 0 G> c: .....<br />
m 0 »<br />
--' 00'<br />
g ::0 ~ Z -0<br />
~ ~<br />
b~<br />
s: en 0 0-<br />
~ ,<br />
m m m<br />
r-<br />
Z 0<br />
-I ::0 I<br />
(f)<br />
» Z<br />
G) 1<br />
s:<br />
"U<br />
r- ,<br />
m<br />
r-<br />
-0<br />
0 ~\ ....<br />
~ • l5i/i ~<br />
· 9<br />
5 \0.<br />
Z<br />
~<br />
1<br />
•<br />
~<br />
ACCESS RD.<br />
A<br />
WEST<br />
ElEVATION<br />
IFTJMSl)<br />
375<br />
NORTH-SOUTH RUNNING (SHORn<br />
4" DIA. CLAYDRAJN PIPE<br />
o<br />
A'<br />
EAST<br />
ELEVATION<br />
(FT/MSL)<br />
375<br />
SWMU 196<br />
.196-015<br />
196-013 N<br />
•<br />
196-011. . ,196-010<br />
196-009 ,/<br />
196.()14.- · _. - ' - - - -.196-008<br />
A []<br />
LEGEND<br />
GRAVEL<br />
365<br />
360<br />
CLAY<br />
SAND<br />
SILT<br />
•<br />
UCRSBORING<br />
355<br />
350<br />
350<br />
o<br />
o<br />
Horfzontal Scale<br />
in Feat<br />
Vertical Scale<br />
In Feat<br />
Fig. 3-14 East-west geologic cross section A-~ in northeast area of SVvMU 196.
146658.04.01 12198lk<br />
1~00E+02' ---,-,-------~---~--------tE-t-------------·------~--<br />
1:00E+01 -<br />
---··------·.--------~-~---·I,----·-----------<br />
1.00+00 -+-----t---------~.-.----.--..<br />
1,00E-01 - - --.. -.... -.. - .... ~- -----------~--.-.----<br />
1.00E-02 -<br />
-----I------------------.--~---------·----------<br />
en 1JOOE-03 - ------:1-----------8-------------=,---------<br />
~ +<br />
-~<br />
1;00E-04 -<br />
---·----I-~----------.~--------·I------<br />
t:00E-05 - ------~--,JI___-----------------·---·--II--- ---.-------~.------<br />
, !<br />
I<br />
1':00E-06 -<br />
-----·--JI---------Ilc--------------II-------------<br />
-<br />
1!.00E-07 - -----1---·--------·-------·---------- '--~--..-.----------.-----<br />
1'.00E-08 - -----"------------------··----1---··-.--... ---.--<br />
1.00E-09 - -------------------------,1;-, ---------<br />
UCRS :RGA Me Nairy<br />
(!16 samples) (26 samples) (9 samples)<br />
iLEGEND<br />
Hydrogeologic Interval<br />
+ IMaximum hydraulic,conductivity value tor interval<br />
,I Average hydraulic conductivity value for interval,<br />
.... IMinimumhydraulic conductivity value tor interval<br />
Fig. 3.15. Ranges of hydraulic conductivity ~K) from WAG 6 RI 'Iaboratory results.
MW188<br />
(324.CSI<br />
• UcRS BORING<br />
o RGA BORING<br />
$ McNAIRY BORING<br />
® EXISTING MONITORING WELL<br />
e HISTORICAL SOIL BORING LOCATION<br />
II! ~OIMENT SAM~~ I.OCATION<br />
NOTE: WATER LEVELS MEASURED IN JANUARY 1998.<br />
Fig. 3. pofentiomefric -map for ·SWMU 001 and SWMU 091.<br />
o 300<br />
I<br />
SCALE IN FEET
0720-026<br />
··········································0<br />
MW326®<br />
I<br />
UCRS BORING<br />
RGA BORING<br />
IMcNAIRY BOR ING<br />
EXISTING MONI,TORING WELL<br />
LEGEND<br />
o SU:JDGE SAMPLE<br />
STORM DRAIN<br />
e HISTROICAl SOIL BORING LOCATION<br />
720-012$<br />
(PZ-1l<br />
NOTE: WATER LEVELS MEASURED IN JUNE 1998.<br />
MW217®<br />
Fig. 3.17 AGApoter:ttiOmetriC map of tne C-720 Con1>Iex.<br />
o 120<br />
I<br />
SCALE IN FEET
.'<br />
Table 3.1. Monthly average· precipitation, temperature, potential evapotranspiration,<br />
estimated actual evapotrans(!iration, and infiltration andrunotT: 1969-1989<br />
Potential<br />
Precipitation Teniperature evapotranspiration<br />
Month ~in.) !O!) ~in.)<br />
Estimated actual<br />
. evapotranspiration<br />
.(10.)<br />
AFIRC1'<br />
(in;~<br />
January 2.99 29,9 .0.00 0.00 2.99<br />
February 3.84 36.5 0.11 '0.11 3.74<br />
March 4.68 47.6 1.00 1.00 3.67<br />
April 5.16 58.1i 2.29 2.29 2.87<br />
May 4.91 66.5 4.06 4.06 0,86<br />
June 4.14 75;2 5.60 5.38 0.00<br />
July 4.57 79:0 6.67 5.65 0:00<br />
August 3.43 77.2 5.92 4.10 0.00<br />
•<br />
September 3.67 70.3 3.90 3.62 0:00<br />
October 3.37 58.8 2.17 2.17 0.00<br />
November 4.90 47.5 0.79 0.79 2.50<br />
December 4.65 38.2 0.19 0.19 4.41<br />
Monthly 4.19 57.1 2.73 2.45 1.75<br />
Average<br />
Total 50.31 32.70 29.36 21.04<br />
" AFlRO = Available .for infiltration or surface runoff.<br />
Source: National:C1imatic DataCenter, Asheville, Nonh'Carolina(from CH2MHILL 1992) .<br />
•<br />
A<br />
TL\983500006 SEC3:..R.DOC
•<br />
4. NATURE AND EXTENT OF CONTAMINATION<br />
4.1 ,INTRODUCnON<br />
Environmental data from the four sites investigated during the WAG 27 RI field activities<br />
have been compiled, screened, and evaluated to assess the nature and extent of each site-related<br />
contaminant and to supplement previously collected data. Summary tables containing analytical<br />
reslilts for each of the four sites are included in this section. A complete report of analytical results<br />
for all samples collected during this investigation is provided in Appendix H. Appendix I contains<br />
selected analytical data collected during previous investigations of the sites that comprise WAG 27.<br />
Appendix G contains a complete list, by sample identification number, of all samples analyzed<br />
during the WAG 27 RI; it also provides information ,concerning which of the five analytical groups<br />
(VOAs, SVOAs, PCBs, metals, and/or radionuclides) were tested for in each sample.<br />
The extent of contamination discussed in this report is based on the .presence of site-related<br />
contaminants in surface or subsurface soils and groundwater. This section consists of three main<br />
parts following this introduction:<br />
•<br />
o<br />
o<br />
e<br />
A description of soil to 50 ft (typically the unsaturated zone, or approximately to the RGA) for<br />
each of the four sites;<br />
A description of contaminant impact on shallow UCRS groundwater; and<br />
A summary offindings for each site.<br />
The PGDP site remedial objective is to select and implement actions protective of human<br />
health and the environment {DOE 11998b~. The RI activities included investigations of the extent of<br />
potential groundwater contamination attributable to any of the four sites. Data collected from the<br />
WAG 27 RI also will be used asa basis for remedial: action decisions concerning the groundwater<br />
OU.<br />
4.1.1 Screening Process<br />
The data screening process used in this RI was critical for determining when analytes<br />
represented site-related contaminants as opposed to laboratory contaminants or constituents that<br />
occlir naturally in the soil or groundwater. Additionally, screening was used as a tool to focus the<br />
discussion of the nature and extent of .contamination on those constituents that are most likely to<br />
have a potential for impact to human health or the environment. The screening process is described<br />
in the following paragraphs. .<br />
•<br />
The results in the WAG 27 database were screened in a two-phase process. In the first<br />
phase, data collected during this RI were compared with historical data representative of naturally<br />
occurring conditions and concentrations in the surface soil, subsurface soil, and groundwater at the<br />
PGDP (i.e., background data). Background values for metals and radionuclides in groundwater were<br />
obtained from DOE (1994). These background' data are used for reference only in the WAG 27 Rl.<br />
Revised groundwater background data are currently being collected as part of the on-going<br />
groundwater OU study. Background values for metals and radionuclides in surface and subsurface<br />
ATl:1983500007 Sec4_r.doc 4-1
4-2<br />
soil were compiled from DOE (l997). Tables 4.1 and 4.2 contain the background data for the PGDP<br />
used to screen WAG 27 data. Because most organics such as VOAs, SVOAs, and PCBs are<br />
considered man-made, background for these compounds was set at zero. The analytical summary<br />
tables (Tables 4.4 to 4.31) contain aU VOAs, SVOAs, PCBs, metals, and radionuclide results that<br />
were detected at WAG 27 above background screening levels. Where an <strong>environmental</strong> sample<br />
result and a duplicate result were available for the same sample, only the higher of the two results<br />
has been included in these sUinmary tables.<br />
To further the discussion of significant site-related contaminants, all results that exceeded<br />
the background values underwent a second screening against risk-based concentrations referred to in<br />
this report as the Preliminary Remediation Goals (PRGs). Because the PGDPis likely to remain an<br />
industrial site (DOE 1998b), soil results were screened using industrial use scenario PRGs.<br />
However, since groundwater can migrate to off-site receptors, groundwater data were screened using<br />
the more conservative residential use sceilarioPRGs. Some constituents, e.g., calcium, magnesium,<br />
and sodium, do not have PRG values. In such cases,the PRG for the constituents was set at zero,<br />
Table 4.3 contains the calculated PRGs used to screen thePGDP WAG 27 data set.<br />
To emphasize those chemicals that were considered likely to have had an adverse impact on<br />
the site media, the discussion in this section is limited to analytes that exceed both screenings<br />
(background and PRG). Constituents that only slightly exceeded PGDP screening levels, were<br />
detected only in one sample, or were common mineral-forming elements are not discussed in detail.<br />
4.1.2 WAG·27 Soils<br />
To determine the nature and extent of contamination found within each of the four sites,<br />
samples of sediment and surface and subsurface soils were collected as needed. These samples were<br />
analyzed for suites of constituents in five groups: VOAs, SVOAs, PCBs, inorganics, and<br />
radionuclides.<br />
•<br />
Following a general introduction and description of the WAG 27 activities, the four WAG<br />
27 sites are individually characterized. The discussion ·of each site begins with an introduction that<br />
provides a summary of the area's history, including site conditions. In addition to size, topography,<br />
and man-made features, the 'location of the physical boundaries of the site, previous sampling<br />
events, and relevant historical data are summarized. An accompanying base map depicts soil sample<br />
locations, facility structures, transportation pathways (e.g., roads), utility lines and pipes, and<br />
topographic features {e.g., ditch locations}. The utility lines (stormwater, sanitary water, and sewer)<br />
and other pipes are extensive at some sites. nue to their potentially important role in contaminant<br />
transport, pertinent utility lines are depicted on the base maps.<br />
Descriptions of the known processes and possible releases from each site that may have<br />
contributed to contaminant impact follow the paragraphs that characterize the site's physical<br />
properties. An understanding of the potential releases is key to the rationale behind the sampling that<br />
was performed during the WAG 27 RI investigation. Following the section "Rationale forRI Field<br />
Sampling," the text focuses on describing analytical results of samples collected at each of four<br />
sites. The teXt in this section includes the following information:<br />
• Depth range from which samples were collected<br />
•<br />
ATU983500007 Sec4.r.doc
4-3<br />
• Number of locations within each site from which samples were collected<br />
• Number and nature of individual constituents of each chemical group that were encountered<br />
-Frequency of detection<br />
o<br />
Description of analytical results<br />
The "Summary of Findings" for each site provides a synopsis of the analytical results.<br />
including interpretations. The area: or areas of concern at each site. the constituents involved. and ,the<br />
probable source or sources are described.<br />
4.1.3 WAG 27 Groundwater<br />
•<br />
Two groundwater plumes of VOAs (notably TCE) and the radionuclide Tc-99 extend<br />
several miles off-site to the north of PGDP.In 1995. a groundwater study confirmed the C-400<br />
Building area as the primary source of the Northwest Plume contaminants (Gamer, Morti, and<br />
Smuin 1995). The C-400 area also has been shown to be a contributor of contaminants ,to ,the<br />
Northeast Plume. Potentiometric trends in the upper RGA and in well-flow measurements have<br />
confirmed a divel'gence of groundwater flow from under theC-400 area toward the north. as<br />
indicated' by the geometry of the plumes (DOE 1997).<br />
One of the objectives of the WAG 27R:I was to assess whether any additional VOA sources<br />
are currently contributing to the known northwest TeE plume or could contribute to the<br />
groundwater contamination in the near future. Another objective was to evaluate each site's<br />
potential, contribution to the elevated Tc-99 concentrations ,previously detected in the PGDP<br />
groundwater.<br />
To .achieve these objectives, water samples were collected from the VCRS, RGA. and~<br />
McNairy groundwater systems. In general, the water samples collected during the WAG 27 RI were<br />
analyzed for VOAs, metals, and radionuclides. Other selected parameters were measured to define<br />
the chemical, and physical properties of the groundwater as needed to support fate and transport<br />
analysis and an FS.<br />
4.1.3.1 Filtered vs. Unfiltered Groundwater Samples<br />
•<br />
Filtered and unfiltered grab water samples were analyzed for inorganic constituents (metals)<br />
during the WAG 27 RI. Comparison. of the data sets indicated' that the unfiltered samples often<br />
containa:s much as 100 times higher metals content than filtered samples. The grab water samples<br />
were collected from an open borehole that had undergone only minimal development and contained<br />
no sand pack. As a result, the samples often contain a high percentage of suspended solids. The<br />
high metals content in the unfiltered water samples is a product of these suspended metals.:bearing<br />
clays. Therefore, these unfiltered metals results are not representative of groundwater and are not<br />
included in ,the discussion concerning the nature .andextent ·of the WAG 27 groundwater<br />
contaminants. The complete data, set ~both filtered and unfiltered) is contained in Appendix H .<br />
An.i983500007 Sec4_r.doc
4.1.4 Historical Data Review<br />
4-4<br />
Limited historical data were available from ,two of the areas investigated during the WAG 27<br />
RI. Three previous studies were found to have included portions of SWMUs 001 and 091: the Phase<br />
I and II SI (CH2MHILL li991and 11992, respectively), the WAG 23 RI (DOE 1994), and: the<br />
LASANGA TM Technology demonstration. AU the historical data -that were determined to be<br />
applicable to the WAG 27 study.are listed. in Appendices F and G of the Integrated RifFS Work<br />
Plan/or WAG 27 (DOE 1998a).Ute analyticalrestilts forthese samplesiare included in Appendix ,y,<br />
•<br />
For soils, historical data, were available only for SWMUs ODland 091. At SWMU 001,<br />
surface soils had been investigated during ,the WAG 23 RI and, therefore, were not included within<br />
the. scope' of the WAG 27 RI' During February 1996, additional surface soil sampling and<br />
subsurface sampling to 5 ft bgs were performed at SWMU 001 as 'part of a focused sampling event<br />
at WAG 23 SWMUs. These samples were included in :the WAG 27 historical data set. During the<br />
Phase l and II SI, the subsurface soil at the SWMUOOil former Oil Landfarm was sampled on a' grid<br />
pattern .and ,a significant quantity of 'historicaldata. was generated during this sampling event. Five<br />
soil borings were also sampled at SWMU091 during the Phase I andU SI.<br />
During the development of the Nature :and:Extentof Contamination section of the WAG 27<br />
RI, the, results of the historical sampling were incorporated. As part ()f the process, the results of the<br />
historical sampling were screened' against the WAG 27 ,background values and PRGs. The screening<br />
results showed that a Ilimitednumber of detections exceeded .the screening values. Comparison of<br />
the screening ,results to 'the WAG 27 'RI database indicated that the 'historical data supported the<br />
current findings concerning the nature and extent ·of contamination as reported in Sect. 4.2.1 and<br />
4.2.2. Because the results for the historical' data have been previously summarized, these data ,are not •<br />
included in the summary 'analytical tables. presented in Sect. 4 ofthis report. The historical soil.data<br />
were, however, combined with the WAG 27 generated' data set to conduct the Baseline Risk<br />
Assessment (BRA) as outlined ,in V:ol. 4 of this report.<br />
AU of the historical groundwater results 'contained in the historical database were obtained<br />
.prior to 1996 (some as, early as 199
•<br />
4-5<br />
during the operation of the landfann, a layer of sand and gravel was placed beneath the soil .of the<br />
plots to improve drainage during times of heavy precipitation. Based on infonnation deri,ved from<br />
trench excavations conducted l during the WAG 27 RI and the review of .historical aerial<br />
photographs, the two disposal plots are believed to have been located in the northern portion of the<br />
SWMU.<br />
Use of the C-747-C Oil Landfann was discontinued in 1979. A minimal! cover «12<br />
inches)wasplaced over the two disposal plots following closure. The area is now mowed regtilarly<br />
as part ·of PGDP maintenance operations.<br />
4.2.1.2 Site History<br />
The C-747-C Oil landfarm was used from 1973 to 1979 for landfarming waste oils<br />
contaminated with TCE, 1',l,l-TCA, uranium, and PCBs. The waste oils were applied to the natural<br />
surface of two disposal "plots and mechanically mixed with the native soil to promote biodegradation<br />
of the contaminants. It is estimated that approximately 5000 gallons of waste oil were applied to the<br />
landfann during its period of operation, with oil being added to the plots at 3- to 4- month intervals.<br />
Although sources of the waste oils are not reported, it is assumed that they were derived from<br />
virtually all areas of the plant.<br />
4.2~1.3 Location and Results of Previous Investigation<br />
•<br />
•<br />
Results of previous sampling at SWMU OOt are summarized in Sect. 6.1.3 of the Integrated<br />
RIfFS Work Plan for WAG 27 at PGDP (DOE I 998a). Portions of SWMU 001 were characterized<br />
in two previous investigations. In the CERCLA Phase I and Il SIs (CH2M HILL 199;J and '1992),<br />
the immediate SWMU area was investigated. This study included a geophysical survey to locate the<br />
fonner landfann plots, 4 RGA soil borings, 10 shallow soil borings, and the installation of 4<br />
monitoring wells. The geophysical survey identified two buried metal anomalies. Soil borings<br />
drilled' during the investigation indicated PCBs, polycyclic aromatic hydrocarbons (PAHs), VOAs,<br />
and radionuclides in the soil. Perimeter ditches surrounding the SWMU were found to contain a<br />
contaminant suite similar to that ,identified in the soil borings. VOAs and radionuclides(specifically<br />
TCE and 1ic-99, respectively} were encountered in downgradient monitoring wells MW-I61 (RGA)<br />
and MW-162 (UCRS). SWMU001 sampling locations from the Phase I and n SIs are shown in<br />
Fig. 4.1.<br />
Subsequent to the SIs, groundwater samples taken at MW-'161, located near the northwest<br />
comer of the SWMU, have documented the apparent passage of two concentrations of TCE in the<br />
RGA.. The two concentration peaks were observed approximately 1 year apan and could have<br />
represented the passage ·of two separate contaminated water masses, or two isolated hot spots within<br />
the same water mass. Only a slight increase in TCE was noted in the nearby UCRS monitoring well<br />
MW-,162 during these sampling events. The most recent (October 1994) detection of TCE in MW-<br />
162 was a low concentration of 70' ugIL. No, other VOAs were reported in the sample collected<br />
from this monitoring well. Sodium; at concentrations only slightly above background, was the only<br />
metal reported above screening levels from the MW -162 water sample. This analysis was<br />
perfonned in February 1994. The most recently reported radionuclide analysis from MW -162, dated<br />
October 1'994, showed only Tc-99 (55 pCilL) above screening levels. A UCRS water' sample<br />
collected from a nearby monitoring well (MW-189) was found to contain rO.7 mgIL of iron, a<br />
characteristic of anoxic conditions, in 1993, and 36 pCiIL l'c-99 during 1994 sampling events.<br />
A TU983500007 Sec4_r.doc
4-6<br />
SWMUs where significant PCB contamination was identified during the Phase 'I and n SIs<br />
were assigned ,to WAG 23. At SWMU@@l surface soils were included in WAG 23, whereas<br />
subsurface soils and groundwater were assigned to WAG 27. In the WAG 23 Rl, the Phase I and n<br />
data were re-examined and the resultant WAG 23 RI Addendum was issued in September 1994<br />
(DOE 1994). In this addendum, surface soils at SWMU 001 were identified as a probable source of<br />
TCE, 11,1 ,I-TCA, PCBs, and uranium contamination. Other Ipossible contaminants included heavy<br />
metals, dioxins/furans, PAHs, and Tc-99. TCE, I,I,I-TCA, and Tc-99 were considered probable<br />
groundwater contaminants.<br />
•<br />
Ouring February 1996, focused soil sampling designed to delineate the full extent of PCB<br />
contamination and the soil volumes to be remediated was performed at the WAG 23 sites. As a part<br />
of this fieldwork, surface soil sampling was conducted at SWMU 001. SWMU 001 had no PCB<br />
concentrations greater than 25 ppm. The maximum reported concentration was 3.34 ppm for<br />
Aroclor 1248 at Grid 29 within the 0- to I-ft interval. One soil sample collected at Grid 17 from 5 ft<br />
bgs had a reported concentration of 2,400,000 uglkg for cis-l,2-dichloroethene. The locations of<br />
these additional sample points are shown in Fig. 4.2. Full results of the WAG 23 focused sampling<br />
were published in the WAG 23 FS (DOE 1996b).<br />
On September 11, 1997 DOE signed the Action Memorandum for WAG 23 and SWMU 001<br />
of WAG 27 describing a non-time-critical removal action. In January 1998 the non-time-critical<br />
removal action was executed for the SWMUs of WAG 23 and SWMU 00 1 of WAG 27.<br />
No action was taken for PCBs. at SWMU 001 where the average PCB concentration is<br />
approximately 0.2 ppm, Soils with a total dioxin concentration greater than or equal to 1.3 ppb were<br />
excavated at SWMU 001 (23 yd\ An analysis of the confirmatory sampling analytical results<br />
demonstrated that all of the samples had a total dioxin concentration less than the clean-up goal.<br />
•<br />
A No Further Action Proposed Remedial Action Plan for WAG 23 and SWMU 001 of<br />
WAG 27 was submitted November 6, 1998 to the regulatory agencies for review. The (DI) No<br />
Further Action Record of Decision (ROD) is expected in 1999.<br />
4.2.1.4 Rationale for RI Field Sampling<br />
Based on the review of available infonnation, three data gaps were identified at SWMU 001.<br />
Closing these gaps would allow for (1) development of a' more accurate representation of the levels<br />
of contamination in the ditches surrounding the unit, (2) determination of the origin of geophysical<br />
anomalies within .the former Oil Landfarm, and (3) determination of the extent of subsurface soil<br />
contamination at SWMUOOI and the potential impact associated with, the leaching of ,these<br />
contaminants to the UCRS and RGA groundwater.<br />
To gather information .to close the data gaps, field sampling was conducted on the two buried<br />
geophysical anomalies in sediments in the ditches surrounding the SWMU, soils helow the surface<br />
soil zone, and groundwater of the UCRS, the RGA, and the upper McNairy Formation. Activities<br />
included a magnetometer survey and eight test pits to investigate the buried' anomalies, sediment<br />
sampling in the ditches, and collection of soil and water samples from 73 borings to identify<br />
subsurface contamination. Figure 4.3 shows the SWMU 00 I sampling locations for the WAG 27<br />
IH. The results of these sampling activities are discussed in the following sections.<br />
•<br />
A TU983500007 Sec4J.doc
•<br />
4.2.1.5 Nature and Extent of Contamination<br />
4-7<br />
Trench .samples-Analytical Results. Two small magnetic anomalies were identified at<br />
SWMUOOil during ,the Phase I and II SIs (CH2M Hll...1.. 1991 and 1992). As part of the WAG 27 RI,<br />
a geophysical survey was conducted to better define the boundaries of these anomalies so that<br />
excavation test pits could be dug to determine if the anomalies contained material that might<br />
represent a source of contamination at SWMU 001. TN & Associates, Inc. and CDM Federal<br />
Programs performed this survey. A copy of their full report is provided in Appendix F.<br />
Geophysical surveys were conducted in three areas at SWMU 001 to ,define the anomaly<br />
boundaries, First, a. 'background survey was performed over a 50- by 20-ft area in the northwest<br />
comer of the SWMU. Surveys were then conducted in the vicinity of the western anomaly defined<br />
during the Phase I and n SIs (Grid A) and in the vicinity of the eastern anomaly (Grid B). Grid A<br />
covered an area 100 ftlong by 50 ft wide. Grid B was lOO ft long by 60 ft wide. Using an EM-61<br />
magnetometer; readings were obtained at 10-ft intervals throughout the grids. These grid readings<br />
were then augmented by continuous readings. to further define the perimeter of the anomalies. Two<br />
anomalous areas were identified inGrid A and five in Grid B. A series oEtest pits (2 at Grid A and<br />
6 at Grid B) were then excavated at the site to determine if they contained any material that might<br />
represent a source of contamination. Test pit locations are indicated in Fig 4.3. No large metallic<br />
objects such as drums were uncovered in any of the excavations at SWMU 001.<br />
•<br />
A large concrete drainpipe caused the anomaly in Grid A. The source and purpose of this pipe<br />
are unknown, but the ,pipe does not appear to have contributed to groundwater contamination .<br />
The magnetic anomalies at Grid B closely defined two roughly ,parallel landfarm trenches that<br />
were confirmed by observations of subsurface material during excavation of the test pits. Magnetic<br />
anomalies in Grid B were probably caused by small metal items (e.g., drum lids, drum bungs, metal<br />
shavings in waste oil) anellor residual metals from oils disposed of in the landfarm.<br />
A total offour surface soil samples and one duplicate were collected during trench excavation<br />
activities at Grid B. No samples were collected from excavations at Grid A. Sample locations are<br />
shown in the inset on Fig 4.3. Each sample was 'tested for VOAs, SVOAs, PCBs, inorganic<br />
constituents, and radionuclides. Results that exceeded applicable background levels arei\isted in<br />
Tables 4.4 through 4.7. A frequency of detection table (Table 4.10) presents summary information<br />
concerning the analytical results exceeding background values.<br />
Organics<br />
VOAs. VOAs were detected at concentrations above screening levels in sample 001-101<br />
and its duplicate. TCE was present in the two samples at concentrations of 510 ug/kgand 1200<br />
ug/kg, respectively. Vinyl chloride was detected in sample 001-10,1 at a concentration of 67 ug/kg<br />
and in the duplicate at 270 uglkg.<br />
SVOAs. No SVOAs were detected above screening levels for any of the five samples<br />
analyzed.<br />
•<br />
PCBs. One sample and its duplicate contained PCBs above screening levels. Total PCBs<br />
were present in sample 001-101 at a concentration of 17,100 uglkg. Individual PCB species were<br />
PCB-l 242, PCB-1260, and PCB-1268 at concentrations of 500 ug/kg, 11,000 uglkg, and 5600 uglkg,<br />
ATU983500007 Sec4...cr.doc
4-8<br />
respectively. PCB-1242 (500 uglkg), PCB~1268 (4200 uglkg) , and polychlorinated biphenyls (4700<br />
uglkg) were also detected in the duplicate sample from this location.<br />
•<br />
Inorganics<br />
Five soil samples from the trench excavations were submitted for metals analysis. None of<br />
the samples exhibited metal concentrations above screening levels.<br />
Radionuclides<br />
Five soil samples from the trench excavations were analyzed for radionuclides. No isotopes<br />
exhibited activities above screening levels.<br />
Sediments-Analytical Results. Perimeter ditches bound SWMU 001 to the north, west,<br />
and south. To evaluate the sediments contained in these ditches, seven sediment samples were<br />
analyzed for SVOAs, PCBs, inorganic constituents, and radionuclides. Six of the samples (00 1-045,<br />
001-046, 001-047, 00 ' 1-048, 001-049, and 001-050) were collected from a depth of 0 to 1 ft bgs.<br />
Sample 001-070 was collected from a depth of 1 to 1.75 ft bgs. Sediment sample locations are noted<br />
in Fig. 4.3. Results that exceeded applicable background levels are listed in Tables 4.4 through 4.7.<br />
A frequency of detection table (Table 4.10) presents summary information concerning the analytical<br />
results exceeding background values.<br />
Organics<br />
VOAs. None of the sediment samples were analyzed for VOAs.<br />
SVOAs. Seven sediment samples were submitted for analysis of SVOAs. No SVOAs were<br />
detected in any of the samples.<br />
•<br />
Inorganics<br />
PCBs. Each of the seven sediment samples was analyzed for PCBs. No PCBs were detected.<br />
SoH from all seven sediment locations was sampled for metals analysis. Only one sample,<br />
001-070. exhibited metals in excess of applicable background and PRG screening values. Four<br />
metals were detected in this sample: barium at 247 mglkg; beryllium at 0.8 mglkg; manganese at<br />
1990mglkg; and thallium at 1'.56 mglkg.<br />
Radionuclides<br />
Three isotopes were detected above screening levels in sediment sample 00 1-049.<br />
Laboratory analyses of sample 001-049 detected Np-237' (12.15 pCi/g), Pu -239/240 (26.82 pCilg),<br />
and Th-230 (187.9 pCilg). The remaining sediment samples did not contain radionuclides with<br />
activities exceeding screening levels.<br />
Subsurface Soils-Analytical Results. To investigate the subsurface soil within SWMU<br />
00 I, 1.98 soil samples (excluding splits) from 73 borings were collected to a depth of 50 ftbgs.<br />
Figure 4.3 is a map ofSWMU 001 showing the locations of the 73 borings sampled. Results that<br />
exceeded applicable background levels are listed in Tables 4.4 through 4.7. A frequency of<br />
•<br />
ATU983500007 Sec4_r.doc
•<br />
4-9<br />
detection .table (Table 4.10) presents summary information concerning the analytical results<br />
exceeding ,background values.<br />
Organics<br />
VOAs. Only two VOAs, TCE and vinyl chloride, were detected in the subsurface soil of<br />
SWMU 00 I at concentrations exceeding screening levels. All detections occurred in borings<br />
located in the immediate vicinity of the former landfannplots. Vinyl chloride was detected in 5<br />
samples, with the maximum detection of 4800uglkgoccurring ,in boring 001~053. All detections of<br />
vinyl chloride occurred in the upper 7 ft of the subsurface. TCE concentrations in excess of PRGs<br />
were detected in 43 samples. A map showing the distribution of TCE detections at SWMU 001 is<br />
provided in Fig. 4.4.<br />
The maximum reported TCE concentration at SWMU 001 was 439,000 uglkg. This result<br />
was obtained from a sample collected at 15 ft bgs from boring 001-065 in the north-central portion<br />
of SWMU 001 and was the only TCE detection to exceed 225,000 uglkg, the TCE concentration in<br />
soil' considered indicative of DNAPL. In February 1996, as part of WAG 23 sampling, soil<br />
containing 2,400,000 uglkg of the TeE breakdown product cis- t,2-dichloroethene was collected<br />
from 5 ft bgs at a location slightly east ofboring.OOl-065.<br />
As shown on the east-west cross section in Fig. 4.5, boring 001~065 exhibited elevatedTCE<br />
throughout its vertical; extent, with 25,000 uglkg TCE .present in soil at the end depth of 50 ft bgs.<br />
East of '00,1-065, boring 001-068 also showed elevated TeE concentrations to total depth, with a<br />
maximum concentration of 5500uglkg occurring at 30 ftbgs and 4300uglkg of TCE present at 50 ft<br />
bgs. Lateral east-west definition of TCE content in soil in excess of PRGs is ,provided by borings<br />
001-071 and 001-073, respectively.<br />
The north-south cross section in Fig. 4.6 also shows elevated 'FCE concentrations in the<br />
vicinity of 001-065 to total depth, with the lateral extent of 'FCE in soil delimited to the south by<br />
boring 001-074. As demonstrated by Iboring 001-069, TCE concentrations above PRGs in<br />
subsurface soil appear to be contained within SWMU boundaries to above approximately 25 ft bgs.<br />
However, elevated TCE concentrations in soil appear to extend north of the SWMU boundaries<br />
below this depth.<br />
Inorganics<br />
S:VOAs. No SVOAs were detected above screening levels.<br />
PCBs. No PCBs were detected above screening levels.<br />
One-hundred-thirty-eight soil samples were collected at SWMU00'! for analysis of 23<br />
metals each during the WAG 27 RI. These samples were collected from 64 borings between the<br />
depths of 5 and 50 ft bgs. and a total of 3174 metal analyses were run (138 analyses for each of 23<br />
metals). Only 157 analyses (5%) detected.metals at levels above background andlor PRGs.<br />
•<br />
Twelve of the 23 metals analyzed for were detected in the SWMU 001 subsurface at<br />
concentrations exceeding screening levels. Six of these-antimony, arsenic, beryllium, cadmium~<br />
manganese, and silver-were detected at concentrations that exceeded PGDP subsurface background<br />
values by a factor of two or more. Background data for PGDP are listed in Table 4.>1. AU elevated<br />
ATU983S00007 Sec4_r.doc
4-10<br />
detections of arsenic, cadmium, manganese, and silver were from samples collected between 5 and<br />
15 ft bgs, with the exception of one detection of cadmium (20 to 23 ftbgs in boring 001-071) and<br />
one manganese detection (48 to 50 ft bgs in 00'1'-074), Distribution of arsenic, cadmium.<br />
manganese, and silver is shown on Fig. 4.7. Most antimony detections were also from 5 to 15 ft bgs.<br />
with only two borings (001-068 andOO1-079) showing elevated concentrations at depths below 15<br />
ft. Distribution of antimony is shown in Fig. 4.8. Beryllium was detected at concentrations above<br />
screening levels at depths ranging from 5 to 50 ft bgs.<br />
•<br />
The remaining six detected metals exceeded PGDP subsurface background values by a<br />
factor of l'ess than two-aluminum, iron, lead, magnesium. sodium, and vanadium. Aluminum.<br />
sodium, and vanadium were detected at concentrations above screening levels at depths ranging<br />
from 5 to 50 ft bgs. Iron and lead were detected only in deeper samples (20 to 43 ft bgs and 35 to 38<br />
ft bgs, respectively> and magnesium detections were restricted to 7 to 10ft bgs. Magnesium<br />
distribution is shown in Fig. 4.8.<br />
Subsurface soil containing metals above screening values is not restricted to any particular<br />
section of SWMU 001, either horizontally or vertically, although the zone from 5 to 15 ft bgs<br />
contains elevated concentrations of several metals. This concentration of metals in the shallow<br />
subsurface is probably related to past landfarmingpractices at SWMU00:1. Detections of metals at<br />
values above screening levels are more random and isolated at depths below 15 ft bgs, with samples<br />
that did not contain elevated metal concentrations frequently collected from adjacent locations.<br />
These deeper concentrations cannot be directly related to any definite release from activities at<br />
SWMUool.<br />
Radionuc1ides<br />
No isotopes were detected above screening levels.<br />
•<br />
VCRS Groundwater-Analytical Results. During the WAG 27 RI, sufficient water was<br />
not typically encountered in the shallow subsurface strata to allow a grab water sample to be<br />
collected during the drilling of the soil borings at SWMU001. Only one UCRS grab water sample<br />
was collected for analysis from SWMU 001. fables 4.8 and 4.9 contain a complete list of all the<br />
organic compounds, metals, and radionuclides detected at concentrations above background levels<br />
in ,this sample. The frequency of detection and maximum, minimum, and average concentrations for<br />
each reported constituent are contained in Table 4.10.<br />
Organics<br />
YOAs. YOAs were the only organic constituents for which the UCRS water sample was<br />
analyzed. The UCRS water sample from 50 ft bgs at location 001-073 on the northwest side of the<br />
former Oil Landfarm 'had the 'highest TCE content (312 ugIL) of any UCRS water sample collected<br />
during the WAG 27 RI. Smaller amounts of TCE degradation products were also reported from the<br />
sample.<br />
Inorganics<br />
The concentrations of 15 metals exceeded screening levels in the sample collected from<br />
boring 00 I ~073. All of these exceedances were from an unfiltered grab water sample that was .•<br />
collected using a disposable teflon bailer. The sample was very muddy and' contained a very high<br />
A TU983500007 Sec4 _c.doc
•<br />
4-11<br />
level Of total suspended solids. The presence of a large amount of suspended clay material in the<br />
sample contributed to ,the reported elevated metals concentrations.<br />
Radionuclides<br />
Only one radionuclide, Tc-99, exceeded both the PGDP groundwater background and PRG<br />
screening levels. The activity of Tc-99 was 41.1 pCiIL in a grab water sample collected at 50 ft bgs<br />
in boring 001-073. Uranium (total) also was reported ata concentration above screening levels<br />
(0.04 mgIL) from this sample.<br />
4.2.,1.6 Summary or Findings<br />
•<br />
•<br />
Previous investigations conducted at SWMU 001 had identified PCBs, PAHs, volatile<br />
organics, and radionuclides in the subsurface soil and a similar suite of contaminants in sediment<br />
samples from the surrounding perimeter ditches. Volatile organics and radionuclides (TCE and Tc-<br />
99, respectively) were identified in groundwater. WAG 27 RI sampling at SWMU 00 I was<br />
designed to further investigate these media and the possible contaminant source: the former plots of<br />
the C-747-C Oil Landfarm, One area of significant soH contamination by organic constituents<br />
(TCE) was defined. In addition, subsurface soH from 5 to 1'5 ft ,bgs appears to have been impacted<br />
by metals released from previous landfanning activities. Because radionuclides are not found above<br />
screening levels in either the subsurface or trench samples collected at SWMU 001, the<br />
radionuclides detected in one sediment sample from the ditches surrounding SWMU 001 are<br />
believed to have originated from the nearby cylinder yards .<br />
RI results indicate ,that SWMU 001 subsurface soil and the UCRS groundwater have been<br />
impacted by the release of TCE from SWMU 00 I. TCE and several TCE degradation products were<br />
detected above screening levels in 43 samples and were found throughout the vadose zone at<br />
SWMU 001.. The maximum detected TCE concentration in subsurface soil was 439,000 uglkg, a<br />
concentration indicative of DNAPL. Vinyl chloride concentrations as high as 4800 uglkg have also<br />
been documented in association with the TCE-contaminated soil. All detections of VOAs in soil<br />
samples were associated with samples collected from borings or trenches located in ,the immediate<br />
vicinity of the two former landfann plots that operated from 1973 to 1979. The single UCRSgrab<br />
water sample collected during the WAG 27 R'l contained 312 ugIL of TCE, the .highest TCE content<br />
of any UCRS water sample collected during the WAG 27 RI. This water sample was collected from<br />
a boring located immediately northwest (down gradient) of the identified area of subsurface soil that<br />
contained the maximum TCE concentration. From the location of these contaminated samples. (soil<br />
and groundwater), it is apparent that leaching of TCE and associated contaminants contained in the<br />
former landfarm has resulted in contamination of the UCRS soil and groundwater.<br />
SWMU 001 subsurface soil from 5 to 15 ft bgs exhibits elevated concentrations of the<br />
metals arsenic, antimony, cadmium, magnesium, manganese, and. silver. Although metals are a<br />
normal constituent of all subsurface soils at PGDP, this localization of elevated metal concentrations<br />
indicates probable impact from past landfanning practices at the site. Detections of metals at values<br />
above screening levels are more random and isolated at depths 'below 1'5 ft bgs. These deeper<br />
detections cannot be directly related to any definite release from activities at SWMU 001 and there<br />
is no indication of metal contamination in groundwater due to a SWMU 00 I source .<br />
A revised: site conceptual model for the C-747-C Oil Landfarm at SWMU 001 is presented<br />
in Fig. 4.9. This model, based on the results of the WAG 27 RI', depicts subsurface stratigraphy at<br />
A 111:1983500007 Sec4_r.doc
4-12<br />
SWMU 001 and the area of TCE soil contamination defined in the vadose zone beneath the fonner<br />
landfarm plots. Contamination encountered in RGA groundwater beneath SWMV 001 and to the<br />
northwest (downgradient) of the SWMU bound~lfiesindicates that TCE is being leached from the<br />
overlying UCDsediments by the downward percolation of precipitation.<br />
•<br />
Although Tc-99 was not found in high concentrations in either the VCD soil or VCRS<br />
groundwater ,samples at SWMU 001. Tc-99 may have entered the RGA at SWMU e~H in the past<br />
due ,to leaching of vadose soil that contained higher concentrations, of the mobile radionuclide~<br />
Metals, detected in the subsurface soils of SWMU 001 during the WAG 27 IR:I were generally<br />
1<br />
concentrated in the upper 15 ft of soil and probably are not impacting the underlying groundwater.<br />
4.2.2UF 6 Cylinder Drop Test Area (SWMU 091)<br />
4~.2.l Location and Physical Description<br />
, SWMV 09.1 is located in the western portion of the fenced area of the PGDP.lt is situated<br />
between the south side of the C-745-B cylinder yard and Virginia Avenue. Figure 3.6 shows the<br />
location ofSWMU091 in reJation'to,the other SWMlislnvestigated in this RI.<br />
4'.2~2.2<br />
Site History<br />
PGDPconducted cylinder drop tests in late 1964 and early 1965 and in February 1979 to<br />
demonstrate the structural' integrity of steel cylinders used to store and transport UF,6.In the tests. a<br />
crane lifted the cylinders to a specified' height and dropped them on a concrete and s,teel pad to<br />
simulate worst-case transportation accidents.<br />
Drop tests were used to assess. the effect of low temperatures on cylinder integrity. In the<br />
firsttestperidd. a brine-ice bath was used to chill one cylinder prior to its drop test. The 1979 test<br />
used a TeE and dry..;ice bath to chill one of the steel cylinders. Leakage from an in-:groundpit. used<br />
to hold! the TCE refrigerant and cylinder. resulted in contamination of shallow soil and groundwater.<br />
•<br />
The volume of leaked TCE is unknown. The dimensions of theicylinde~ and.approximate<br />
dimensions of the pit suggest thata minimum of 572 gal of TCEailddry ice were required for the<br />
test. A. max imumof 430 gal of TCE has been estimated to have been released during the test.<br />
4.2.2.3 Location and Results of Previous 'Investigations<br />
Results of previous sampling for SWMU '09'Ii are summarized in the Integrated RflFS Work<br />
Plan/or WAG 27 at PGDP'(DOEI998a}. Soil and groundwater sampling took placeduringvarious<br />
investigations including the Phase I and II SIs and l the LASAGNA Technology demonstration. In<br />
general. many samples (more than,'25) have been collected from soil associated with SWMV 091.<br />
However. fewer groundwater samples. ,except those analyzed for TCE and Tc-99. haye been<br />
collected from this area, In groundwater samples, 24 inorganic, 8 radionuclides, and '11 VOAs were<br />
detected at least 'once. In soil samples, 23 inorganic, 6 radionuclides, 10 SVOAs" and 7 YOAs were<br />
detected at least once. Analytes detected iii both, groundwater and soil include several inorganic,<br />
radionuclides, and volatile organic analytes. Detections of SVOAs were restricted to soil.<br />
The cylinder drop, test area was one of the SWMVs investigated<br />
CERCLA 'Investigation~<br />
during the Phase I and IISIsperfonned,byCH~M,HILt.. Investigation of the immediate SWMV 09;1<br />
area included a geophysical, survey, construction of four soil borings, and installation of three<br />
monitoring wellS..<br />
ATU983500007 Sec4:..r.doc
•<br />
4-13<br />
The locations of these borings and wells are shown in Fig. 4.10. Surface geophysical l surveys.<br />
both terrain electromagnetic conducti¥ity and magnetometry, delineated an anomaly thought to be<br />
due to metal in the tank pit fill material!. Soil andl well borings defined the site stratigraphy and<br />
identified elevated volatile organic concentrations in the shallow soils (CH2M Hn..t. 1991 and<br />
1992).<br />
Analysis of groundwater from MW-160, a shallow well completed in a perched groundwater<br />
zone, indicated the presence of high dissol¥ed-phase TCE concentrations, (e.g., 164,000 ~g/L in<br />
March 1991)~ Only small quantities of TCE were present in the RGA at .SWMU 091.<br />
'Remediation Technology Demonstration and Implementation. Four rounds of shallow<br />
soil sampling and two surface geophysical surveys were conducted at SWMU 09'1 beginning in<br />
January 1993 (Clausen et al. 1996). The first geophysical survey, conducted inJanuary li993, had<br />
little success. In August 1993, a geophysical survey was completed using ground penetrating radar<br />
that was able to image. the top 20 ft of sediments and identify the shallow water surface and top of<br />
the targeted sand and gravel layer.<br />
•<br />
The first ,phase of soil sampling was performed in April and May of 1993. The remediation<br />
technology known as LASAGNA 1M was identified as one that might perform well in soils with low<br />
hydraulic conductivities. The second phase of sampling provided' pre-test characterization data. The<br />
third round followed a limited-scale field test of the technology to determine post-test contaminant<br />
levels. The fourth phase, completed in May 1996, was conducted prior to implementation of a more<br />
extensive field test.<br />
The bulk of the data collected in these investigations focused on the top 30 ft of sediments.<br />
Only six borings, part of the fourth phase, extended below 30 ft and none extended below 40 ft. The<br />
analytical data show TCE concentrations decreasing with depth; the highest concentrations occurred<br />
in the sandy gravel unit 20 to 25 ft bgs. This suggests that the TCE has not yet reached the RGA and<br />
that the TCE in MW -1'58 and MW -159 is due to an upgradient source. Clausen et aI. (1'996) suggest<br />
that chloride concentrations measured in these two wells support this interpretation. In the 1964 and<br />
1965 tests, chilled brine was used instead of TCE and· dry ice to chill a cylinder before testing.<br />
Chloride levels in MW -160 indicate some downward migration of brine. If the brine had migrated to<br />
,the RGA, chloride concentrations should be significantly Ihigher in MW-158 and MW-159 ,than<br />
those measured. Although this probably holds true for dissolved phase TCE, it may not be<br />
applicable to DNAPL migration.<br />
The promising technology demonstration involving a limited pilot study in 1995 (reducing<br />
TCE by 98.4% in 120 days in an area 15 ft by .JO ft and 15 ft deep) was followed by a full-scale pilot<br />
test commencing in August 1996, The area for the Phase II test was 21 ft by 30 ft and 45 ft deep.<br />
The results showed that the technology had potential for use in the low-permeability soils at the site,<br />
and thus a ROD was signed in August of 1998 for Remedial Action at SWMU 091 using ,the<br />
LASAGNA 1M Technology. This action will address TCE in the shallow « 45 ft bgs) soils to<br />
mitigate potential contamination of the RGA.<br />
4.2.2.4 Rationale for RI Field Sampling<br />
•<br />
On the basis of available data, the nature and extent of contamination at SWMU 091, and<br />
the potential for release of contaminants to the environment have been reasonably well<br />
characterized, especially with respect to TCE. Releases. to nearby surface water from surface soil<br />
runoff is unlikely, as the site is covered with gravel. Nonetheless, sediment in the ditches that<br />
convey surface runoff water away from the TCE-impacted' area had not been investigated. This data<br />
ATU983500007 Sec4_r.doc
4-14<br />
gap was one to be filled by WAG 27 activities. To confirm that TCEcontamination at the site had<br />
not been mobilized by remedial measures and to confirm that TeE had not migrated downward to<br />
further contaminate the RGA groundwater,. two deep soH borings were to be installed down gradient<br />
of SWMU091 during WAG 27 RI activities. Results of samples collected from the deep soil<br />
borings are presented in Sect. 4.2.5.3.<br />
To support future decisions on appropriate actions for this site 'beyond the remedial action<br />
currently being addressed' under the ROD, the sampling and analysis plan was developed to<br />
supplement existing data where they are inadequate. One such data gap was identified, i.e.,<br />
insufficient information on the potential impact of subsurface soils by contaminated surface-water<br />
runoff from SWMU 091. As a result, a total of four shallow subsurface soil samples were collected<br />
(0.3 to 1 ft bgs) from two ditches that convey surface water from the impacted area to the west.<br />
Results that exceeded applicable background levels are listed in Tables 4.11 and 4.12. A frequency<br />
of detection table (Table 4.13) presents summary information concerning the analytical results<br />
exceeding ·background levels.<br />
4.2.2.5 Nature and Extent of Contamination<br />
Surface Soils-Analytical Results. Analytical results from surface soil samples are as<br />
follows.<br />
Organics<br />
VOAs and SVOAs. The four surface soil samples .collected were not analyzed for VOAs or<br />
SVOAs.<br />
PCBs. None of the four surface soil samples collected from locations 091-003, 091-004,<br />
091-005,09 1 1-006 exhibited detectable amounts of PCBs.<br />
•<br />
Inorganics<br />
Although six metals were detected in the four samples analyzed, only three were reported at<br />
concentrations exceeding screening levels and PRGs: aluminum, cadmium, and sodium (Fig. 4.11).<br />
Aluminum; found at a concentration of 13,100 mglkg in the two samples 091-003 and 09 1 1-004, was<br />
only slightly above the background value of 13,000 mglkg. Likewise, sodium only slightly exceeded<br />
the PGOP background value of 320 mglkg in the one sample in which it was detected (091-005<br />
exhibited 348 mglkg). The two samples 091-005 and 091-006 contained 2.93 and 6.53 mglkg of<br />
cadmium, respectively. Cadmium has a PRG of 2.3 mglkg for ,the PGOP; therefore, the exceedances<br />
are low.<br />
Radionuclides<br />
Of the nine radionuclide isotopes detected in ,the four soil samples analyzed, only one was<br />
above background and PRO values. Sample 091-003 exhibited an activity of 10.7 pCi/g for Pu-<br />
239/240, which is slightly above the industrial soil PRG of 'lOpCi/g (Fig 4.12).<br />
VCRS-Analytical Results. No new UCRS groundwater data were collected during the<br />
WAG27Rl<br />
•<br />
ATU983500007 Sec4_r.doc
4-1'5<br />
4.2.2.6 Summary of Findings<br />
Figure 4.13 is a revised site conceptual model for SWMU 0911 based on the findings of ,the<br />
WAG 27 RI. Contamination related to surface runoff from the known impacted area of SWMU 091<br />
was not found. Four shallow subsurface (0.3 to 1 ft bgs) samples were collected from two east-westtrending<br />
ditches located south of the cylinder drop test site in order ,to assess the surface-water<br />
runoffimpact from SWMU 091 .and to assess migration of contaminants. The two samples collected·<br />
from the ditch closest to the concrete and steel pad (and to the presumed location of the TCEpit}<br />
exhibited only slightly elevated aluminum concentrations. One of these (091-003) also contained<br />
low levels of Pu 239/240. The samples collected downgradient of this sample (091-006 and 091-<br />
005) contained neither of these constituents above screening levels, suggesting that neither is<br />
migrating along the ditch.<br />
Cadmium and sodium were found in samples collected from the ditch ,located on the south<br />
side of the SWMU. Since neither of these metals was detected in samples closer to the impacted<br />
soils of SWMU 091, and because sites to the east of SWMU09l discharge a portion of their<br />
surface-water runoff to the ditch from which these samples were collected, an upgradient source is<br />
assumed to have contributed these constituents to the ditch.<br />
4.2.3 C~ 746·A Septic Systems (SWMU 196)<br />
•<br />
The characterization of SWMU 196 is presented in five subsections. The first presents a<br />
history of the SWMUincludingpraCtices and release descriptions, the second describes the location<br />
and results of previous sampling, and the third summarizes the rationale behind the RI sampling<br />
efforts. The fourth subsection provides results of the samples analyzed during ru activities. and the<br />
fifth summarizes and discusses the findings.<br />
During WAG 15 investigations, 28 soil samples from six locations around an underground<br />
storage tank .(UST) located just northwest of Building C-746-A were collected and analyzed.<br />
Because the UST is located within the limits of the C-746-A Septic System leachfield, the results at<br />
the UST investigation were examined as .part of the WAG 27 R1.<br />
4.2.3.1 Location and Physical Description<br />
SWMU 196 is located in the north-central portion of the PGDP, on the north side of the<br />
C-746-A Building (Fig 3.6). The SWMU consists of two underground, out-of-service septic systems.<br />
On the northeast comer, the system consists of a 960-gal septic tank .~rectangular: 40 in. wide by 84<br />
in. long and 66 in. deep) that feeds a 60-ft wide and 20-ft long leachfield. The leachfield consists of<br />
4-in. drain. tiles in shallow soil.<br />
•<br />
On the northwest corner, the system consists .of a 500-gal septic tank (circular: 5-ft diameter<br />
by 3.4 ft deep) 47 ft east ofa junction box that feeds two 4-in. vitreous clay pipes, 100 ft long<br />
extending south, and 130 ft long extending west, in shallow (lto 2 ft bgs ) soil ~Fig. 4.14).<br />
According to a field topographic survey of the drainage ditch on the west end of C-746-A, the 500-<br />
gal septic tank is separated from the clay pipes at a point approximately28 ft downgradient from the<br />
tank. Approximately 25 ft of clay pipe and the junction box were destroyed as a result of regrading<br />
the ditch.<br />
An abandoned UST, formerly used for fuel oil storage, is located~ust northwest of Building<br />
C-746-A. A pipeline extends from the UST to the building.<br />
ATU983500007 Sec4J.doc
4.2.3.2 Site History<br />
4-16<br />
C-746-A was used as a warehousedtiring plant construction. Subsequent operations<br />
consisted primarily of metal storage and smelting. From 1956 to 1985, an aluminum smelter was<br />
operated in the west end oflhe building, and from 1975 to ,1985, a nickel smelter was operated in the<br />
east end of !the building. Current operations include storage of hazardous and PCB waste. A 1993<br />
DOElUSEC facility transition report states that there is a potential for heavy metal and radiological<br />
contamination in the septic systems.<br />
The northeast septic system was in operation fromApril 1958 to February 1980. The system<br />
originally processed sanitary waste from a toilet, a urinal, a bathroom floor drain, and a bathroom<br />
sink. Modifications were made in August 1975, when a change house and break area were added as<br />
part of the nickel smelter: operation. The septic system then processed sanitary waste from a kitchen<br />
sink, a water cooler, two showers, a second urinal, and the change house floor drains, as well as the<br />
original toilet, urinal, bathroom floor drain, and bathroom sink. In 1980, the septic system was<br />
plugged and abandoned in place when C-746-A was tied into the C-615 sewage treatment plant<br />
system.<br />
The northwest septic system was in operation from November 1956 to February 1,980. The<br />
system processed sanitary waste from a toilet, two showers, a sink, and a water cooler: installed<br />
shortly after construction of the aluminum smelter operation. No floor drain system exists in this<br />
area. In 1980, the septic system was plugged and abandoned in place when C-746-A was tied into<br />
the C-615 sewage treatment plant system. In 1982, regrading of a drainage ditch on the west end of<br />
C-746-A resulted in the destruction of approximately 25 ft .of the vitreous clay pipe. Some sanitary<br />
waste that was in the 4-in. line upgradient (28 ft) at the time of abandonment in 1980 may have been<br />
released to the sediments of the drainage ditch as a result of the regrading and destruction; however,<br />
since the septic system was plugged during abandonment, this wasIiot a continuing release into the<br />
ditch.<br />
•<br />
•<br />
The UST(SWMU 139) northwest of Building C-746-A was investigated in 1996 during<br />
WAG 15 activities. No COCs were found to pose risk to human health and the environment.<br />
Additional sampling was conducted in 1998 as part of a continuing investigation of this UST.<br />
4.2.3.3 Location and Results of Previous Sampling<br />
SWMU 196 was first defined in 1993. Due to its recent addition, it was not one of the areas<br />
sampled during the CERCLA Phase I and n SIs. During WAG 15 activities, 28 soil samples<br />
collected from six DPT soil borings to a 15-ft depth were analyzed in SWMU 139 for TCE, PCBs,<br />
benzene, toluene,ethylbenzene, and xylenes (BTEX), PAHs, RCRA metals, and radiological (total<br />
uranium, gross alphalbeta) contamination. Five sample locations were around the UST, and one was<br />
along the pipeline from the UST to Building C-746-A. The UST is located northwest of the<br />
northwest septic system; WAG 27 soil.boring location 196-016, which was. drilled near the UST,<br />
had to be abandoned because the DPT had refusal at approximately 3 ftbgs.<br />
No BTEXcompounds were detected in any ofthe soil samples. Sporadic low-level detects<br />
of several diesel-range organic (DRO) constituents were reported in several borings on the northeast<br />
side of the UST. One P AH, :phenathrene, was detected in one soil sample. Metals and radioactivity<br />
were below quantitation limits or within PGDP background levels.<br />
The information from this study was insufficient to provide a complete characterization of<br />
contamination associated with the septic systems. The detailed analytical data on the USl' are<br />
•<br />
A TU983500007 Sec4_r.doc
•<br />
4-17<br />
presented in Final Reportfor WAG 15, C-200~A UST and C-710-B UST <strong>Paducah</strong> <strong>Gaseous</strong> Diffusion<br />
Plant <strong>Paducah</strong>. Kentucky (DOEIORJ07-1540'& Dl) (DOE 1996c~.<br />
The UST (SWMU139) is currently being re-investigated as aresult of the detection of BRO<br />
constituents in soil from location 196-002 during WAG 27 activities.<br />
4.2.3.4 Rationale for RI Field Sampling<br />
SWMU 196 was originallyinc1uded in WAG 27 to investigate the possibility of potential<br />
contaminant releases of TCE emanating frQm the C-746-A area. The release of TeE through the<br />
septic systems could be a contributing source of TCE to the VCRS and RGA. The discharge of TCE<br />
into the septic systems was ,considered highly unlikely but not impossible. A more likely release<br />
potential of TCE ,in the C-746-A area would have been through an unrecorded product spill or a<br />
waste discharge of TCE onto the ground in the warehouse area, although no specific releases have<br />
been documented at the SWMU.<br />
Given the nature of the activities and facilities at SWMU 196, several other types of<br />
contamination could exist. Metals, particularly aluminum and nickel, could have entered the septic<br />
systems through the showers, sinks, and the northeast change house floor drain. Some of these<br />
metals were contaminated' with uranium. Sanitary waste, potentially ,Jaden with radioactive heavy<br />
metals, would have been processed through the septic tanks and distributed into vitreous clay drain<br />
tile leachfield lines.<br />
•<br />
Because inorganics and uranium are relatively immobile in soils, the extent of<br />
contamination was not expected to exceed several feet beyond the subsurface lines. As a result. most<br />
of the samples were collected at locations adjacent .to the lines and from varying depths up to 20 ft<br />
bgs. Samples from the septic taJ1ks were collected to refine the list of potential COCs. In January<br />
and February 1998, residual liquid and sludge that were present in the two septic tanks were<br />
pumped out into drums and sampled. Three samples from the northwest tank (COM sample<br />
numbers 196-001, -003, and -005) and three samples from the northeast tank (COM sample<br />
numbers 196~002,-004, and-006) were analyzed for metals, PCBs, and radioactivity. A detailed<br />
description of these activities (sampling and abandonment of the septic tanks at SWMU 196) is<br />
presented in the Geophysical Survey and Excavation Report prepared by TNAlCDMin Appendix F.<br />
All 93 soil samples collected, including 4 duplicates, were analyzed for metals and<br />
radionuclide activity, and a select group of 39 samples, including two duplicates, was submitted for<br />
VOA analysis. The original borings were sampled for VOAanalysis. However, after these analyses<br />
returned as non-detects, VOAs were not included as potential COCs in subsequent sampling.<br />
•<br />
Northeast Septic System. The northeast septic system is entirely subsurface. Therefore,<br />
any potential COCs that would have been processed through this system would be in the subsurface<br />
soils beneath the vitreous clay drain tiles of the leachate system and the concrete septic tank.<br />
Samples from the tanks were collected to refine the list of potential COCs. Sampling of.surface and<br />
subsurface soil was conducted at a total of 7 locations surrounding the 4-in. vitreous clay drain tiles<br />
and adjacent to the tanks. Four sample locations were within a .few feet of these. leachate lines, and 3<br />
were approximately 20 ft away from the lines' ends. Subsurface soil samples were taken<br />
continuously at 2-ft intervals to a depth of 10 ft bgs at locations 196-008 through 196-011" and to 20<br />
ft bgs at locations 196-0:13 through 196-015 .<br />
Northwest Septic System. The northwest septic system had a greater potential for<br />
contaminant release because approximately 25 ft of vitreous clay drain tiles were destroyed during<br />
A'fLl983500007Sec4_r.doc
4-18<br />
excavation and regrading of a drainage ditch on the west end of C-746-A in 1982. 2 years after the<br />
septic system was plugged and abandoned" in place. In addition to potential COCs that may exist in<br />
the subsurface soils beneath the vitreous clay drain tiles of the leachate system and the concrete<br />
septic tank, there is a release potential from the discharge of sanitary wastes in the abandoned septic<br />
system upgrildient of the demolished portion of the line .. However, because the septic system was<br />
plugged and abandoned, ,the release .of material could occur only until equilibrium was restored with<br />
the septic tank. Another unlikely, yet potential area for contamination was identified as the drainage<br />
ditch surface sediments downgradient from.the broken vitreous clay line.<br />
•<br />
Surface and subsurface soil samples were collected at a total of eight points adjacent to the<br />
4-in. vitreous clay pipes (extending west and south) encompassing the leachfield. Subsurface soil<br />
samples were taken continuously at 2-ft intervals to a depth, of 8, 10, or 20 ft bgs(l96-oo 1 through<br />
004, 196-017, 196"-018}. Along the pipeline extending north-south, two sediment samples (196~OO6<br />
and 196-007) were collected. One of these was between the septic tank and the destroyed clay line<br />
to assess the potential impact of any remaining liquid in the abandoned tank.<br />
A cone penetrometer test (CPT) was conducted at location 196-012 adjacent to the leachate<br />
line extending to the west to determine the presence of UCRS groundwater. The position of the<br />
CPT point was changed from that proposed in the WAG 27 Work Plan due .to limitations in rig<br />
access; thus the test was conducted approximately 100 ft west of Building C-746-A. The CPT point<br />
was pushed to refusal, which was 35 ft bgs. No water was encountered, and PID screening indicated<br />
no VOAs present in the soil. Therefore, no samples were submitted for VOA analysis.<br />
4.2.3.5 Nature and Extent of Contamination<br />
Surface Soil, Sediment, Subsurface Soil, and' Sludge Samples-Analytical Results.<br />
SWMU 196 sample results that exceeded applicable background levels are listed in Tables 4.14<br />
through 4.16. A frequency of detection table (Table 4.17} presents summary infonnation concerning<br />
the analytical'results exceeding background values.<br />
•<br />
Organics<br />
VOAs. Eight surface and 31 subsurface soil samples from a total of 8 sample locations<br />
within SWMU 196 were analyzed for VOAs. No VOAs were detected in the soil between 0 and 10<br />
ft bgs at either area surrounding the septiC systems. PIDreadings from soil during the CPT test<br />
indicated no impact by VOAs.<br />
SVOAs and PCBs. None of the soil samples collected from SWMU 196 during the WAG<br />
27 RI were analyzed for SVOAs or PCBs. The results from the septic tank sludge exhibited PCB<br />
concentrations of only 100 to 300 J.lglkg in the northwest tank. SV0As were not analyzed for in the<br />
septic sludge sample.<br />
Inorganics<br />
Sludge from the northwest tank showed slightly elevated concentrations of four metals<br />
~barium, nickel, lead, and selenium}, and the northeast tank containedl three metals (barium, nickel,<br />
and lead), also at slightly elevated concentrations. Eighteen metals were detected above background<br />
and PRG values in the 93 soil samples analyzed from SWMU 196; however, many only slightly<br />
exceeded their respective screening values. The most frequent exception was antimony, which was<br />
found in three of eight locations (Fig. 4.15). The three samples associated with the northwest septic<br />
•<br />
ATU983500007 Sec4_r.doc
4-19<br />
system lines that contained elevated antimony at varying depths were 196-001, 196-002, and' 196-<br />
004, with maximum values of 61.5 mg/kg, 62.2 mg/kg, and 9;8 mg/kg. No antimony was detected in<br />
samples from five locations adjacent to the northwest septic system.<br />
Samples collected from five locations near the northeast septic system contained elevated<br />
antimony concentrations. These locations were 196-008 through 196-00,11' and 196-00. with<br />
maximum antimony values ranging from 0.76 to 1'21 mg/kg. Generally, the highest antimony value<br />
from each !location was observed in the surface sample and.a sharp decrease ·in concentrations, often<br />
to "non-detect" (NO) was discernible with increasing depth. One exception is location 196-<br />
002,which had fairly stable concentrations throughout the prof1le, including 58.9 mg/kg at to ftbgs,<br />
the soil boring's final depth.<br />
In addition to the high antimony concentrations (more than 300 times the PRG), a soil<br />
sample taken from 4 to 6 ft bgs at location 196~OB contained the highest concentration of seven<br />
other metals: beryllium, cadmium, lead, ,potassium, silver, sodium, and thallium (Fig. 4.1:6). The<br />
significant elevations included beryllium at 113 mg/kg, 164 times ,the PGOP background value:<br />
cadmium at 116 mg/kg, exceeding the PRG value by a factor of 50; and thallium at 114 mg/kg, or<br />
335 times :the background level.<br />
•<br />
Even though aluminum, calcium, magnesium, and sodium were frequently detected above<br />
their respective screening values, the concentrations were generally less than three times the<br />
background value. Nickel was found in only two samples (196-0'14 and 196-(15), with<br />
concentrations of 587 and 365 mg/kg, respectively (the PRG is 240 mg/kg). Figure 4.17 shows the<br />
distribution of aluminum and nickel detected above background and PRG screening levels.<br />
Radionuclides<br />
The activities of radionuclides in the sludge samples were below PGOP background levels.<br />
Also, no radioactivity above the screening :levels was detected in the 93 soil samples analyzed.<br />
4.2.3.6 Summary of Findings<br />
Figure 4.l8 is a revised site conceptual model for SWMU 196 based on the findings of the<br />
WAG 27 RI. Although several metals were found ,in surface and subsurface samples across the<br />
SWMU, neither VOAs nor radiological constituents were detected in any samples. Samples<br />
analyzed during the investigation ofJesidual sludge and liquids within the septic tanks exhibited low<br />
PCB concentrations (300 ug/kg .to NO), so no additional samples were tested for this constituent<br />
group from the surrounding soils. Although Building C-746-A housed aluminum and nickel smelter<br />
operations for many years, ,neither constituent was found in high concentrations along the various<br />
septic leaching lines or their outlets. The septic systems apparently processed primarily sanitary<br />
waste, for which they were designed. Some septic system specific observations (NE and NW) are<br />
described below.<br />
•<br />
NE Septic System. Surface and subsurface soil> sample location 196-0'13 near the east end<br />
of the 4-in. vitreous clay drain tiles of the northernmost leach lines exhibited several elevated metals<br />
concentrations, especially from 4 to 6 ft bgs. This location contained the :highest concentrations of<br />
antimony, beryllium, cadmium, and thallium among all the SWMU 196 locations. Samples collected<br />
from other ilocations near the east end of ,the leach lines also showed elevated antimony (196-008<br />
and 196-009), while ,the samples collected further away from these lines (196-014, J.96-UI5, and<br />
196-01'0) contained very low to no metals concentrations. This suggests that the lines are the source<br />
A TU983500007 Sec4:..r.doc
4-20<br />
of the metals, hut the extent of the impacted soil remains very limited, as the metals are not mobile<br />
in the unsaturated silty clay encountered from the surface to 20 ft bgs.<br />
•<br />
The fact that antimony concentrations decrease with depth suggests that the impact does not<br />
extend beyond the 10- to 20-ft depth. Although the eastern portion of the building was used for<br />
nickel smelting operations,only two samples exhibited nickel concentrations above screening<br />
values-and those exceedances were only slight. Four of the seven samples from this area contained<br />
minor concentrations of aluminum above the screening values.<br />
NW Septic System. Overall, this area showed little evidence of impact from potential<br />
COCs; however, three of the nine sample locations exhibited elevated antimony concentrations.<br />
Two ofthese (196-001 and 196-002) are located along the septic system lines close to the northwest<br />
comer of the C-746-A Building, and the other is adjacent to the line extending north-south<br />
approximately 80 ft south of the septic tank (196-004). Generally, the concentration of antimony in<br />
soil samples decreased with increasing depth.<br />
Despite the fact that aluminum smeiteroperations were conducted in the western portion of<br />
the C-746-A Building, only two sample locations (196-017 and 196-018) exhibited elevated values,<br />
and at both the exceedance was slight. The incident that caused 25 ft of vitreous clay drain tiles to<br />
be destroyed during excavation and regrading of a drainage ditch west of C-746-A does not appear<br />
to have had any ·influence on the subsurface, as suggested by the limited contamination found at<br />
location 196-004.<br />
4.2.4 . C-720 Complex<br />
4.2.4.1 Location and Physical Description<br />
The C-720 Building is located in the west-central area of PGDP (Fig 3.6) to the southwest<br />
of theC-400 Building. The C-720 Building consists of several repair and machine shops, as well as<br />
other support operations. The building was constructed in 1953 and encompasses 281,200 sq f1.<br />
Five SWMUs are associated with this building. SWMU 090 (an underground petroleum naphtha<br />
pipe) and SWMU 141 (an inactive TCE degreaser) have been designated as NFA in the PGDP SMP<br />
(DOE 1998b). SWMU 027 (acid neutralization tank) is currently being addressed under WAG 9,<br />
and SWMU 031 (compressor pit storage tank) ,is being addressed under WAG 5.<br />
•<br />
This investigation focused on the building drainage system exit points, SWMU 167 (White<br />
Room sump), and the Compressor: Shop .pit, which is located in the eastern portion of the C~720<br />
Building. The building drainage system discharges to the plant stonnwater system.<br />
Compressor Shop Pit. The Compressor Shoplpit is located in the east-central portion of<br />
the C-720 Building (Fig 4.19). The ,pitis 30 ft long by 60 ft wide by 15 ft deep, and the walls and<br />
floor are constructed of concrete that is 15 and 22 in. thick, respectively. The walls and floor of the<br />
pit, as well as the sump, have "ironite waterproofing." The floor is sloped toward, a central drain at<br />
a grade of 1.5 in. per ft. A sump, 4 ft wide by 4 ft long by 8 ft 4 in. deep, was installed in the<br />
northwest comer of the pit. The sump walls and floor are constructed of unjointed, reinforced<br />
concrete that is .t2 and 1'5 in. thick, respectively. Access to the sump is available ,through a 42-in.<br />
diameter manhole.<br />
A subsurface 4-in.-diameter open jointed drain, which is constructed of vitreous clay tile,<br />
surrounds the pit and is located at approximately the same elevation as the base of the pit footings<br />
A TU983500007 Sec4~r.doc
4-21<br />
(approximately 20 ft bgs). The open joints are spaced approximately 1/2-in. apart, and the upper<br />
,portion of the joints is. covered with tarpaper. The lower portion of the joints is open. allowing<br />
drainage into surrounding soils. According to a detail on the plan of underground plumbing for the<br />
C-720 Building, approximately 12 in. of gravel was packed around the drain prior to backfIlling.<br />
The drain is gravity-sloped downward from east to west, with the lowest elevation being the<br />
connection point between the drain and the sump noted above.<br />
Based on a review of the ,plumbing !plan, the vitreous clay drain that surrounds the pit<br />
extends outside the eastern exterior wall of the C-720 Building. A duplex sump pump was used to<br />
empty the sump. Figure 4.20 depicts the approximate location of the subterranean drain, as well as<br />
details of its construction.<br />
In April 1973, plans were approved to upgrade the floor drain in the Compressor Shop pit.<br />
A second sump, with interior dimensions of 2 ft wide by 2 ft long by 4 ft deep, was installed in the<br />
location of the floor drain. The walls and floor of the second sump were constructed with 6-in.<br />
thick, unjointed reinforced concrete, and the second sump was lined with 1I4-in.-thick 304 L<br />
stainless-steel, which was welded together to hold liquids. A 1750-revolutions-per-minute (rpm)<br />
stainless-steel self-priming pump drains the second sump. The pump discharges to a floor drain<br />
located immediately north of the pit area, which ultimately discharges to the building drainage<br />
system.<br />
In April 1974, plans were approved to instaH adegreaser, with dimensions of6.5 ft wide by<br />
6.5 ft long by 1'8 ft deep, in the southwest comer of the Compressor Shop pit. A 3oe-gal storage<br />
tank was installed at the base of the degreaser. TCE released from the degreaser discharged via<br />
aboveground piping to the C-720 Compressor Shop .pit water storage tank (SWMU 031 , WAG 5).<br />
'Jihe de greaser, referred to as SWMU 141, was active during the 1970s, and was "clean-closed"<br />
under RCRA in 1994 (Simmons Engineering 1994). SWMU 141 is designated as NFA in the PGDP<br />
SMP (DOE 1998b).<br />
SWMU 167. The White Room sump is located in the south-central portion of theC-nO<br />
Building (Fig 4.19). The sump has dimensions of 8 ft long by 6 ft wide by 8 ft deep and is<br />
constructed of concrete. The sump was constructed as a baffle. Influent to the sump was directed<br />
through limestone to neutralize any acids prior to discharging to the building drainage system. This<br />
sump was active from the mid,-1960s through the mid-I 970s as /part of the "clean room"operations,<br />
which manufactured electric circuit boards for Sandia National Laboratories. The sump is no longer<br />
in use and is covered with a metal plate.<br />
•<br />
Building Drainage System Exit Points. Eight major building drainage system exit points<br />
from the C-720 Building have been identified ~Fig 4.19) and all eight discharge to the plant<br />
stonnwater system. Approximately 150 floor drains are. located within the C: .. 720Building;<br />
however, many are currently plugged and a few are backed up. Although most of the floor drains<br />
discharge into the stormwater drainage system, floor drains located in the bathrooms discharge to<br />
the sanitary water system, and a few floor drains located in the instrument shop in the northeast<br />
portion of the C· 720 Building discharge to the acid neutralization pit. Stonn sewers are constructed<br />
of either reinforced concrete piping or vitreous clay piping. The stonnwater system at the PGDP<br />
discharges to on-site ditches, which direct runoff and site discharges to off-site streams, (Note: The<br />
Surface Water OU is addressed under WAGs 18 and 25.)<br />
A TU983500007 Sec4_r.doc
4~2.4.2 Site History<br />
4-22<br />
Compressor Shop Pit. Fluids drained from compressors in the shop were directed into the<br />
compressor trench, which is located to the west of the pit. One floor drain located ,in the compressor<br />
trench drains :by gravity from west to east ,into the Compressor Shop pit. The design of the .pitis<br />
such that if the sump pump located in the northwest portion of the pit fails and if liquid fills the<br />
sump to the height at which the subterranean drain discharges into the sump (3.5 ft above the bottom<br />
of the sump), the liquid will back up into the subterranean drain and (because of the construction of<br />
the drain system) will be released into the surrounding soil. There are no documented releases of<br />
this nature; therefore, no quantitative estimates are available. However, because of the building's<br />
age and the nature of the processes, the subterranean drain is considered ,to be a potential source ·of<br />
the existing TCE groundwater contamination in the vicinity of the C· 720 Building. This area is still<br />
in use on a minimal basis for compressor reworking.<br />
•<br />
Based on practices performed in this area, the analytes of interest associated with these<br />
processes include SVOAs (in the fluid discharged from the ,compressors), TCE and its degradation<br />
products (degreasing agents), and metals and radionuclides (both released during the degreasing<br />
process),<br />
SWMU 167. The White Room was used to build and' clean circuit boards. Waste solutions<br />
associated with printed circuit board operations were discharged to the sump, flushed through<br />
limestone to neutralize acids, and ultimately discharged to the building drainage system. Wastes<br />
associated with processes performed in this area include TCE, cyanide, gold, silver, tin, lead. and<br />
chromium. According to the SWMU Assessment Report (SAR) 167, the integrity of the sump has<br />
not been established and therefore the sump should be considered a possible pathway for release.<br />
The sump is no longer in use, and the sludge in the sump was sampled to determine whether any<br />
potential health hazard existed l if the sump were to remain unfilled. PCBs were detected in the<br />
sludge at concentrations ranging from 1.8 to 2.5 mglkg.<br />
•<br />
Building Drainage System Exit Points. A thorough blueprint review and a process history<br />
review of general activities .performed in the C-720 Building were conducted. The findings suggest<br />
that the backfill areas in the vicinity of the building drainage system exit points, as they connect to<br />
the storm sewer system, are potential release pathways of contaminants to the subsurface. Several<br />
maintenance and repair operations were performed in this building, and the major discharge location<br />
for wastewater from these processes was through the floor drains located throughout the building.<br />
Based on the construction of the drains, the connecting joints from the drainage system to the stonn<br />
sewer system appear to be the most likely source of a release. TCE, radionuclides, mineral spirits,<br />
and various other electrical cleaning fluids have reportedly been discharged through the stormwater<br />
or sanitary water drains within the C-720 Building. Mercury that was used as part of the C-720<br />
Building process was routed through an acid drain line to a building sump prior to discharge.<br />
Stormwater lines that had extended to the north of the C· 720 Building may have been<br />
relocated at the time of the construction of the C-720,.C addition (approved for construction in<br />
1971). Specifications of the construction and/or relocation activities with regard to the sewer lines<br />
are not available.<br />
•<br />
A TU983500007 Sec4_r.doc
•<br />
•<br />
4-23<br />
4.2.4.3 Location and Results oCPrevious Sampling<br />
The White Room sump (SWMU 167) was sampled during two separate events. During the<br />
first event (July 1,992), the sludge was analyzed for total cyanide to establish if any health threats in<br />
the c-no Building existed and to provide guidance for future sampling events. Cyanide compounds<br />
were not detected. The sump sludge was sampled a second time (December 1992) and was analyzed<br />
for RCRA corrosivity parameters, RCRA ignitablility parameters, RCRA reactivity parameters,<br />
TCLP metals, TCLP volatile organics, TCLP semivolatile organics, bulk metals, raw volatile<br />
organics including bulk TCE, bulk semi volatile organics, PCBs, and radionuclides. According to<br />
internal correspondence from D. F. Hutcheson, Jr. to D. M. Ulrich, dated May II, 1993, PCBs were<br />
detected at a concentration that ranged from 1.8 to 2.5 mg/L. The detected uranium activity was<br />
below the plant limit of 1}7 pCilg (D. F. Hutcheson, Jr. 1993), and no other radionuclides were<br />
detected. All other above-listed analyses resulted in concentrations below regulatory limits; the<br />
sludge was therefore determined to ,beRCRA nonhazardous.<br />
A monitoring well pair (MW-203 and MW-204) was installed to the northeast of theC-720<br />
Building during the CERCLA Phase lISI (Fig 4.21). These wells were installed to assess<br />
contamination associated with SWMVs 027 (acid neutralization tank) and 141 (an inactive TCE<br />
degreaser). MW-204 was drilled to a depth of 55 ft bgs and was screened in the VCRS.<br />
Contaminants detected in a groundwater sample from MW-204 included TCE, TCE degradation<br />
products, and metals. Zinc, vanadium,and beryllium were detected at concentrations above<br />
reference values during total metals analysis; however, dissolved ,phase metals were not detected<br />
above reference values (CH2M HILL 1992) .<br />
Reference values are defined in the Phase U report (CH2M HILL 1992) as "those that are<br />
representative of naturally occurring conditions or conditions resulting from other, non-plant-related<br />
activities, such as fallout." TCE concentrations detected in the RGA well (MW-203) were lower<br />
than those detected in MW-204. Total and dissolved meta:l concentrations were comparable to those<br />
detected, in MW-204. Technetium-99 activities were significantly higher in MW-204, the shallower<br />
well (843 to 950 pCiIL), than in the deeper RGA well (21 to 22 pCiIL). Plutonium-239 was detected<br />
in both wells at similar activities, 1;9 pCiIL in MW -203 and: 1.5 pCiIL in MW -204.<br />
Recent groundwater monitoring data for MW -203 and MW -204 were collected in August of<br />
1996 and December of 1:994, respectively. TeE was detected at concentrations of 33flg/L (MW-<br />
203) and 320 flg/L (MW":204).<br />
Soil boring P4H7 was located to the northeast of the c-no Building (Fig 4.1 i 9) and was<br />
installed in association with the Northeast Plume study in l i 994. A groundwater sample was<br />
collected at the top of the RGA and analyzed, for TCE using both a field GC and a fixed-base<br />
laboratory; TCE concentrations were 6329 flg/L and. 12,0O(i) Jlg/t., respectively. An additional!<br />
groundwater sample collected from the bottom of the RGA in boring P4H7 contained TCE at a<br />
concentration of 48 Jlg/L.<br />
•<br />
Monitoring wells MW":217 and MW-218, both of which are VCRS wells, are located to the<br />
south of the c-no Building. These wells were installed in association with an liST investigation<br />
that was performed in 1992. MW-217 was drilled to a depth of 53 ft bgs and MW-2:18 was drilled<br />
to a depth of 40 ftbgs; both were screened in the VCRS. TCE was detected in groundwater samples<br />
collected' during three sampling events from MW,.218 at concentrations of 230 Jlg/L (1992), 180<br />
Jlg/L (1992), and 59 .Jlg/L (1993).<br />
A TU983500007 Sec4_r.doc
4.2.4.4 Rationale for RI Field Sampling<br />
4-24<br />
The C-720 Complex was included in WAG 27 because it was recognized as a possible<br />
source of TCE contamination in the southwestern part of the plant during the Phase IV groundwater<br />
investigation. The following were compiled and evaluated to establish release potentials from<br />
possible contaminant source areas within the C-720 Building: findings from a review of available<br />
data pertaining to process descriptions, blueprint reviews, interviews with former employees, and<br />
analytical data from monitoring wells and a previously installed boring located near the C-720<br />
Building.<br />
•<br />
The release potential from contaminant sources in the Compressor Shop was determined to<br />
be high due to the design of the subterranean drain surrounding the pit. The drain was used as a<br />
discharge mechanism in the event that the sump pump located in the northwestern portion of the pit<br />
failed to operate. Based on the design of the drain lines, liquids that accumulated in the sump during<br />
pump failure would discharge to .the surrounding soil's via this line. Potential contaminants<br />
associated with the Compressor Shop included VOAs, primarily TCEand its degradation products,<br />
SVOAs, PCBs, metals, and radionuclides. Samples were collected from the sump and surrounding<br />
soils near the pit to characterize the nature and extent of contaminants in this area.<br />
Release potential from the White Room sump was considered low. Any analytes of concern<br />
that would have been .processed through the White Room sump would have been discharged to the<br />
building drainage system. Based on available data, the integrity of the sump itself has not been<br />
established; however, there is no evidence ofa release fromthe sump. As discussed earlier, analytes<br />
of concern from the White Room sump are primarily metals, VOAs, and radionuclides. Soilborings<br />
were completed in the area south of the C.720 Building where a release of contaminants from this<br />
sump would have been detected.<br />
•<br />
The contaminant release potential was considered moderately high in the backfill areas<br />
surrounding the major building drainage system exit points from the C-720 Building. No releases<br />
are known to have occurred from the drainage system. The drains are constructed of reinforced<br />
concrete piping and vitreous clay piping. The integrity of vitreous clay piping in general has<br />
historically been poor and is therefore suspect. The connecting joints from the building drainage<br />
system to the storm sewer system are considered the most likely release points, and were therefore a<br />
focus of the investigation.<br />
The drain system network connected to the exit points drains various shops within the C-720<br />
Building, including the Compressor Shop, machine shop, paint shop, instrument shop, and valve<br />
shop. Because of activities within these shops, potential contaminants discharged to the drainage<br />
system include VOAs, SVOAs, metals, PCBs, and radionuclides. Soil borings were l'ocated at the<br />
drainage system exit points to investigate potential releases to the drainage system.<br />
Another area was identified during the field investigation as having a moderately high<br />
release potential. Based on interviews with former employees, routine equipment cleaning and<br />
rinsing was performed in the area north of the east end of the C-720 Building. Solvents were used to<br />
clean parts, and the excess solvent was discharged on the ground. 'FCE, its degradation products,<br />
and metals are the primary analytes of concern in this area. Soil borings were completed in the area<br />
to determine :the release potential' in this area.<br />
•<br />
A TU983500007 Sec4 _r.doc
•<br />
4-25<br />
Deep borings, penetrating the McNairy Fonnation, were completed surrounding the C-720<br />
Building to investigate contaminants ,in the RGA and McNairy from possible source areas at this<br />
site.<br />
4.2.4.5 Nature and Extent of Contamination<br />
Subsurface Soils-Analytical Results. To detennine the nature and extent of<br />
contamination found within the C-nOComplex, samples of subsurface soils were collected. These<br />
samples were analyzed for suites ·of constituents in VOAs, SVOAs,PCBs, inorganics. and<br />
radionuclides. Most of the area, surrounding C-720 is covered with asphalt or concrete, so the<br />
collection of surface soil samples was unnecessary. Additionally, no potential sources that might<br />
impact surface soils were identified, in the initial contaminant source survey. Shallow (50-ft)<br />
borings were completed to investigate the drainage system exit points.<br />
A total of 1122 subsurface soil samples were collected from depths ranging from 5 to 50 ft at<br />
16 locations (Fig 4.21). Two ,of these borings were located to investigate other potential sources<br />
identified during ,the field investigation. Boring 720-030 was drilled to investigate anomalously<br />
high flame ionization detector (FID) readings encountered at boring 720-029, The analyses for<br />
these samples differed slightly from those of the other borings and included VOA, SVOA, and<br />
radiological isotopes.<br />
•<br />
•<br />
The results of all analyses that exceeded applicable background levels are presented in<br />
Tables 4.18 through 4.22. A frequency of detection table (Table 4.23) presents summary<br />
information concerning analytical results exceeding background values.<br />
Organics<br />
VOAs. Only eight VOAcompounds were detected' in the subsurface soil samples at the e-<br />
720 Complex. TCE and its degradation products were the most common compounds detected, but<br />
were present at very low frequencies. TCE was the most common VOA detected above screening<br />
levels.<br />
The maximum TCE concentration, 68,000 Ilg/kg, was detected at boring 720-002 Wig 4.22).<br />
Vinyl chloride at a concentration of 400 'Ilg/kg and trans-I ,2~dichloroethene at an estimated<br />
concentnition of 450,000 Ilg/kg also had maximum detections in this boring. VOAs were detected<br />
throughout the entire depth of this boring (Fig 4.23), which was tenninated at 25 ft bgs due to<br />
refusal. Vinyl chloride was also detected at a concentration of 400 Ilg/kg at a depth of 22 to 24 ft in<br />
boring 720-00 I.<br />
In addition to boring 720-002, TCE was also detected in four other borings located along the<br />
building drainage system: 720-004, 720-005, 720-007, and 720-008. At boring 720-004, TCE was<br />
reponed at 1300 J.lg/kg from 25 ftbgs. At boring 720-005, 'fCE was detected above screening levels<br />
from 10 to 30 ft bgs at concentrations ranging from 1600 to 17,000 Ilglkg. Detections at 720-007<br />
were 800 and 14,000 J.lg/kg at depths from 27 to 38 and 25 to 32 ft, respectively. Boring 720-008<br />
had detections of TeE (above screening levels) of 400 and 1600'J.lg/kg at depths of 26 and 32 ft,<br />
respectively, and 1 ,I-DeE of 200 Ilg/kg at 32 ft hgs .<br />
Appreciable concentrations of TCE also were found in samples from boring 720-027, which<br />
was drilled near a reported outside pans wash area in Which TeE was used to clean used parts.<br />
A TU983500007 Sec4_r,doc
4-26<br />
Concentrations from 500 to 8WO Ilglkg were detected at depths of 20 to 35 ft.<br />
SVOAs. Few SVOAs were detected in the subsurface soils at the C-720 Complex. The<br />
most significant concentrations were observed in boring 720-024. One contaminant, bis(2-<br />
ethylhexyl)phthalate (BEHP), was detected in this boring above the PRO of 880 Ilglkg at<br />
concentrations ranging from 890 to 1100 Ilg/kg (Fig. 4.24). Low concentrations of BEHP were<br />
detected at several other borings; however, each of these detects was well below the screening level.<br />
Notably, BEHP was detected in only one sample from boring 720-005 at a depth of 30 ft. This<br />
boring is located immediately north (upgradient) of 720-024 along the storm drain exit point from C-<br />
720. The absence of BEHP at significant concentrations in 720-005 suggests that the source of<br />
BEHPin 720-024 may not have been C-720.<br />
•<br />
BEHP is a common laboratory contaminant; however, it was detected in samples from the<br />
White Room sump and the Compressor Shop pit sump within the C-720 Building at high<br />
concentrations. Discussions with fonner employees indicate that the material was used in an' aerosol<br />
fonn to test HEPA filters and as vacuum pump oil. Di-n-octylphthalate, ani isomer of BEHP, was<br />
detected at five locations, but none above screening levels. One other SVOA contaminant, 4-chloro-<br />
3-methylphenol, was detected in sample 720006SAO 15 at a concentration of 40 Ilglkg at 1,5 to 18 ft.<br />
,PCBs. A total of 117 samples were screened for PCBs in the C-720 Complex subsurface<br />
soils. No samples had detectable concentrations of PCBs. Twelve samples were also shipped to a<br />
fixed-base laboratory for confinnation of the field screens. No PCBs were detected in these<br />
samples.<br />
Inorganics<br />
All of the borings sampled for metals ,in subsurface soils had one or more values above<br />
screening levels (background and PROs) (Fig. 4.25). The most common metals detected were<br />
beryllium, vanadium, sodium, and antimony at frequency of detects above screening levels of 20%,<br />
13%, 12%, and 10%, respectively. Other metals detected above .the screening levels included<br />
aluminum, arsenic, cadmium. iron, lead, magnesium, mercury, potassium, silver, and thallium. Each<br />
of these metals was detected at a frequency of less than 10%.<br />
Boring 720-024 had anomalous concentrations ·of metals in subsurface soil samples from a<br />
depth of 35 to 48 ft. Water was encountered in the boring at 33 ft. Soil samples with the highest<br />
metals concentrations were generally collected from below the water table, where geochemical<br />
conditions may have contributed to the precipitation of the metals. Many of the analytes detected in<br />
720-024 were not detected elsewhere. Concentrations of these metals greatly exceeded<br />
background-by as much as 400 times for some analytes. POOP background values are listed in<br />
Table 4.1. Cadmium, magnesium, potassium, and silver were detected above screening levels only<br />
in boring 720-024.<br />
Other than in boring 720-024, beryllium ,exceeded screening levels in 10 borings with a<br />
maximum concentration of '1.99 mglkg at a depth of 23 ft in boring 720-027. Antimony exceeded<br />
screening levels in 5 borings, reaching a maximum in boring 720-027 of 1.59 mglkg at a depth of 23<br />
ft. Vanadium was detected in 6 borings above the PRO and background screening levels. The<br />
highest concentration (63.3 mglkg) was also detected in boring 720:.027 at 23 ft bgs. Sodium was<br />
detected above the PRG and background at 3 locations, and every sample collected from boring 720-<br />
•<br />
ATU983500007 Sec4_r.doc
•<br />
4-27<br />
022 had! detects exceeding this Ie vet:. Arsenic. lead, and mercury were detected only once in<br />
subsurface soils above PRGs and background. Boring 720-027 had an arsenic concentration of 10<br />
mg/kg at adepth of 10 to l3 ft and a mercury concentration of 0.96 mglkg at a depth of 15 tol8 ft.<br />
Lead was detected at a concentration of 1'39 mglkg in boring 720-002 at a depth of 12 to 16 ft.<br />
Aluminum was detected slightly above background in boring 720-021 at a concentration of 12,100<br />
mglkg at a depth of23 ft.<br />
Radionuclides<br />
Thirty-eight samples were collected for radiological isotopic analysis. Forty-nine samples<br />
were collected for Tc-99 analysis. No isotopes were detected above screening levels in subsurface<br />
soils.<br />
•<br />
UCRSGroundwater-Analytical Results. Sufficient water was not typically encountered<br />
in the shallow subsurface strata to allow a water sample to be collected during the drilling of the soil<br />
borings. A total of only five grab water samples were collected for analyses from the C-720<br />
Complex. Samples were collected from borings 720-002. 720-003. 720-011:. 720-022, and 720-024.<br />
Table 4.22 presents a complete list of all the analytes and their respective concentrations or<br />
activities that were detected above background levels in the VCRS groundwater samples. ~he<br />
frequency of detection, mean concentration, and maximum concentration for each reported<br />
compound are presented in Table 4.23. All five of the VCRS water samples were collected in<br />
locations adjacent to the south and east sides of the C-720 Building. Coincidentally, a break in a<br />
water main located approximately 150 feet south of the building was being repaired during the RI.<br />
Therefore, the water recovered from the VCRS in this area may have been sourced from this broken<br />
water line.<br />
Organics<br />
VOAs were the only organic compounds for which the VCRS samples were analyzed. TCE<br />
was the only VOA to exceed screening 'levels in three of the five samples collected. The highest<br />
TCE content reported was 149 J,lg/L from a sample collected between 3 and 8 ft bgs on the south<br />
side of the C-720 Building at location 720-002 (Fig. 4.26). The sample was coll'ected in close<br />
proximity to a building drainage exit point. Other VOAs detected in the VCRS groundwater<br />
included I, I-dichloroethene and trans-I,I-dichloroethene. each of which was detected twice, and<br />
cis-l,2-dichloroethene and vinyl chloride, each of which was reported above screening levels in only<br />
one sample.<br />
Inorganics<br />
Due to the Ilow volume of water recovered' from the VCRS zone, none of the groundwater<br />
samples collected from the VCRS at the C-720Complex were analyzed for the presence of metals.<br />
Radionuclides<br />
•<br />
Four of the VCRS groundwater samples collected at the C-720 Complex were analyzed for<br />
radionuclides. No radionuclides were detected at concentrations above screening levels from any of<br />
the samples.<br />
A TIJ983500007 Sec4_r.doc
4-28<br />
CompJ:essor Shop Pit Sump-Analytical Results. One sample was collected from the<br />
sump within the northwest comer of the Compressor Shop pit. The sump was sampled to determine<br />
if an appreciable amount of sludge was present and if the sludge was hazardous or may be a source<br />
of contamination. Once the sump was opened, standing water was observed to a depth of<br />
approximately 2 to 3 ft below the floor of the pit (total of 4 ft). The water level was noted to be<br />
above the subterranean drain opening. Standing water was observed in the sump, so it is likely that<br />
the drain was clogged and no release from the sump was occurring at that time. The sample<br />
collected from the bottom of .the sump was a dark ooze with a high liquid content. Several<br />
contaminants, including metals, PCBs, radionuclides, SVOA, and VOAs, were present in the sludge<br />
CFig. 4.27). Metals included chromium, nickel, lead, and cadmium at concentrations of 724, 644,<br />
138, and 4.32 mg/kg, respectively. Radiological isotopes included U-234, U-235, and U-238, Tc-99,<br />
and Np-237 at concentrations of 6167, 348, 10;480, 27,520.6, and 267 pCilg, respectively.<br />
•<br />
The only SVOA detected was BEHP at a concentration of 170,000 J.lglkg. PCBs included<br />
Aroclor 1254 and 1260 at concentrations of 2700 and 700 Ilg/kg, respectively. Two volatile<br />
organics, liCE and I,I-DCE, were detected at concentrations of 420;000 and 2800 Ilg/kg,<br />
respectively. These concentrations were among the highest observed at the site.<br />
As a result of this investigation, the Compressor Shop Pit sump is being designated as a<br />
separate SWMU (SWMU 209) and will undergo additional assessment in the future.<br />
4.2.4.6 Summary of Findings<br />
Contaminants related to potential releases at the C-720 Complex included VOAs, SVOAs.<br />
metals, and radiological contaminants. All 15 borings sampled for metals had detections of some<br />
analytes above screening levels. Eight of the 16 borings sampled for VOAs had detections above<br />
screening levels; only two borings had detections exceeding the screening levels for SVOAs.<br />
•<br />
A revised site conceptual model for the C-720 Complex is presented in Fig. 4.28. This<br />
model is based on .the results of the WAG 27 RI and depicts the general stratigraphy at the C-720<br />
Complex, areas of soil and shallow groundwater contamination detected in the partially saturated<br />
zone oflhe UCRS, and the probable pathway of contaminant transport into the RGA. Contaminants.<br />
primarily TCE. detected in the RGA beneath the site are likely ,being leached from the overlying<br />
UCD sediments where past releases to the shallow subsurface occurred.<br />
Several sites were identified where significant releases may have occurred at the C-720<br />
Complex. First, an area south of the east end of the ,building displayed the highest VOA<br />
concentrations in the soil. The source of these contaminants may be the connection between the<br />
drain exit point and i the storm drain at location 720'-002. The depth of the storm drain was noted as<br />
5.3 ft bgs on plant utility drawings. Volatiles, primarily TeE, were found throughout the upper 50 ft<br />
of soil at this location. This drain exit collected water from more than 20 drains located in the<br />
machine shop, Compressor Shop. vacuum pump shop, and valve shop. In these ,operations. solvents<br />
were routinely used for cleaning parts and l machinery. Lead was the only other contaminant<br />
detected in this boring. Migration of TCE may have occurred along the stormwater line to ,the west,<br />
given the TeE detection in shallow groundwater at location 720-003 and the slope of the line in this<br />
direction. However, the extent of soil contamination appears to be well defined by the absence of<br />
VOAs in soil at boring 720-003 to the west and 720-022 to the south and with only one detect of<br />
vinyl chloride in boring 720-001 to the east.<br />
•<br />
A TU983S00007 Sec4_r.doc
•<br />
4-29<br />
Another release site may have occurred along the drainage exit point at location 720-005.<br />
TCE was detected in this boring throughout the entire depth drilled (30 ft bgs). The depth of the<br />
drain at this exit was noted as 7.8 ft on plant utility drawings. The networks of drains directed to<br />
this exit were primarily from general storage and the welding shop. 'The stonn drains east and west<br />
of this location slope toward this point and discharge water through a 36-in. line extending south<br />
from this drain exit. No other significant contaminants were observed at this location.<br />
An anomalous group of contaminants Was observed' in boring 720;..024. Based on the release<br />
potential at .the C-720 ,Building, the occurrence of SVOAs and metals in this boring is inexplicable.<br />
The BEHP concentrations in this. area may be attributable to activities in the C-720 Building due to<br />
these contaminants' presence in samples from the Compressor Shop pit and White Room sumps.<br />
However, a specific pathway was not discovered. The boring is located adjacent to a large stonn<br />
drain that collectsstonnwater from each of the drains along the south side of the C-720 Building. A<br />
release to one of these drains may have resulted in the transport of BEHP via the stonn drain to this<br />
location, although; the contaminant was not detected at significant concentrations in any other<br />
samples from the south, side of the C-720 Building. l1heanomalously high concentrations of metals<br />
detected' in deep subsurface soil samples at this location are probably precipitates from shallow<br />
groundwater. These metals were not detected in shallower soil samples, so their presence cannot be<br />
accounted for by a' surface release. Additionally, many of these metals were not detected elsewhere<br />
at the site.<br />
•<br />
On the northeast side of the C·720 Building at location 720-027, TCE and several metals<br />
were detected throughout the boring. The boring was installed to investigate ,the possibility that a<br />
release in this area contributed to high TeE concentrations found in borings P4 H7 (Northeast<br />
Plume study) and 720-01S. !It was common practice in the past to rinse and clean parts with TCE in<br />
this area .and to dispose of the solvent on the ground. The occurrence of TCE and metals in<br />
subsurface soil in this area suggests that this practice was followed, but an exact release point was<br />
not determined.<br />
Two other Ilocations (720-007 and 720-00S) had significant TCE concentrations in the<br />
subsurface; however, these concentrations were found only at depth in this area, suggesting that the<br />
detections are attributable to lateral ~and probably vertical) transport of the TCE through the UCRS<br />
from a nearby release. The low concentrations of TCE and TCE degradation products in the shallow<br />
groundwater south of the c-no Building are probably attributable to contaminants migrating into<br />
that area via water from a broken water main. The water probably became contaminated with TCE<br />
that was leached· from the contaminated soils along the building drain system on the south side of<br />
the C;.. 720 Building.<br />
4.2.5 RGA and McNairy Groundwater<br />
One of the objectives of the WAG 27 RI was to define the nature and extent of contaminants<br />
in the RGA and McNairy flow systems and to determine the presence, location, and magnitude of<br />
any DNAPL zones as defined in the PGDP SMP (DOE :199Sb). This phase of the investigation was<br />
focused on the RGA and upper 50 ft of the McNairy Fonnation above the Levings Member. The<br />
vertical extent of contamination within the McNairy was defined· by concentrations of primarily<br />
TCEbelow 5 ugIL in the groundwater.<br />
To achieve these objectives, grab water samples were collected from the RGA and the<br />
A TIJ983500007 Sec4_r.doc
4-30<br />
McNairy groundwater flow systems. In addition, historical analyticaI data from previously installed<br />
monitoring wells were reviewed and compared with recent data from the WAG 27 field effort to<br />
understand contaminant migration and distribution in the area. In general, the RGAand McNairy<br />
water samples were analyzed for VOAs, metals, and radionuclides. Other selected physical and<br />
chemical parameters were measured to support the development of remedial alternatives.<br />
•<br />
4.2.5.1 Location and Results of Previous Groundwater Investigations<br />
C-747-C Oil Landfann (SWMU 001'). SWMU 0.0.1 was investigated during the CERCLA<br />
Phase I and II SIs. During these studies, four monitoring wells were installed at SWMU 0.01.<br />
Subsequent groundwater sampling of one of these wells (MW-161) documented the apparent<br />
passage of two elevated concentrations of TCE in the RGA groundwater. The two peak<br />
concentrations were observed approximately I year apart and were believed to represent either two<br />
separate masses or two areas within the same water mass that contained high concentrations of TCE.<br />
The maximum 'FCE content was reported at 23,0.00 J,lg/Lin mid-1995. A more recent sample<br />
collected in mid-1996 showed only 750. J,lg/L TCE from the same well. A shallow UCRS well<br />
(MW-162), located in close proximity to the RGA well, registered only a slight increase in TCE<br />
level during the passing of the two TCE concentrations.<br />
Cylinder Drop Test Area (SWMU 091). SWMl!J 0.91 also was one of the SWMUs<br />
investigated during the Phase I and II SIs. During these investigations three monitoring wells were<br />
installed: MW-158 (basal RGA)~ MW-159 (upper RGA), and MW-16Q (UCRS). Analysis of<br />
groundwater from MW-1'6Q, which was completed in a perched groundwater zone in the UCRS.<br />
indicated the presence of DNAPL-suspect dissolved-phase TCEconcemrations estimated at 164.0.00<br />
J.lg/L in March 199L Only small quantities of TCE (below 10.0. ug/L) were present in the RGA at<br />
SWMUQ91 1 •<br />
•<br />
Based on the results of data gathered during the LASAGNA Technology demonstration<br />
(Clausen et al. 1996), TCE at SWMU 0.9'1 had not yet reached the RGA, and the TCE observed in.<br />
MW-158 and MW-159 was due to an upgradient source. Clausen etal. (1996) also suggest that low<br />
chloride concentrations measured in these two RGA wells support this interpretation. The chloride<br />
is believed to originate from tests conducted in 1964 and 1965 using a chilled brine to cool UF 6<br />
cylinders before testing. According to Clausen et aI., the higher chloride levels found in MW -160.<br />
indicate that some downward migration of brine had occurred. but that the ,chloride concentrations<br />
in the RGA were not so high as to suggest extensive migration into the RGA.<br />
C-720 Complex. Four groundwater monitoring wells had been previously installed near the<br />
C-72Q Building. MW -20.3 and MW -204 were installed near the northeast comer of the C-72Q<br />
Building during the CERCLA Phase II 51. MW-2O.3 was drilled to a total depth of 80. ft bgs and was<br />
screened in theRGA. MW-204 was drilled to a total depth of 55 ft bgs and was screened in the<br />
UCRS. These wells were installed to assess contamination associated with SWMU 0.27 ~acid<br />
neutralization tank) and SWMU 141 (an inactive TCE degreaser). MW-2n and MW-21i8 were<br />
drilled near the southeast comer of the C-72o' Building as part of a 1992 UST investigation. MW-<br />
217 and' MW -218 were drilled to total ,depths of 53 ft and40 ft, respectively, and both were screened<br />
in the UCRS.<br />
'FCE concentrations detected in the RGA well (MW -20.3) were found to be lower .than those<br />
•<br />
ATU983500007 Sec4J.doc
•<br />
4-31<br />
detected in MW -204 and total and dissolved metal concentrations were comparable ,to those detected<br />
in MW -204. The Phase n report did not specify a range of concentrations for these constituents.<br />
Technetium-99 activities were found to be significantly higher in MW -204 {843 ± 19 to 950 ± 20<br />
pCiIL) than in the deeper RGA well (21± 3 to 22 ± 4 pCiIL). Plutonium-239 was detected in both<br />
wells at similar activities, 1.9 ± 0.5 pCiIL in MW-203 and 1.5 ± 0.5 pCi/L in MW-204.<br />
The most recent groundwater monitoring data for MW-203 and MW-204 were collected in<br />
August of 1996 and December of 1994, respectively. TeE was detected at concentrations of 33<br />
J.lg/L{MW-203) and 320 J.lg/L (MW-204).<br />
Soil boring P4H7 was completed to the northeast of the C-720 Building as part ,of the<br />
Northeast Plume study in 1994. A groundwater sample was collected at the top of ,the RGA and<br />
analyzed for TCE using both a field GC and.a fixed-base laboratory; TCE concentrations were 6.329<br />
J.lg/L and 12;000 J.lg/L, respectively. An additional groundwater sample collected from the bottom<br />
of the RGAin boring P4H7contained TCE at a concentration of 48 J.lg/L.<br />
•<br />
WAG 1 and 7 RI. Four RGA monitoring wells (MW-325, -328. -329, and -330) installed<br />
during the WAG 1 .and 7 RIare located in close proximity to the WAG 27 study area. The most<br />
recent sampling events from the wells occurred ;in late 1996 and' ,late 1997. Analyses of these<br />
samples showed that TCE and metals are ,present at some locations within ,the RGA groundwater.<br />
MW-325. which was drilled downgradient of the C-720 Building. had the highest TCE content<br />
among the four wells. 1150 ugIL. MW-328 and MW-330hadi relatively low TCElevels: 5 ug/L and<br />
1 ug/L, respectively. TCE was not reported from MW-329. The most recent available metals data<br />
from the WAG Ii and 7 wells were collected during 1995. Each of the well samples contained one<br />
or more metals at a concentration above screening levels. Manganese was reported, from all wells at<br />
a concentrationhelow 5 mg/L. In addition to manganese. nickel was present in MW -328. barium in<br />
MW-330, and calcium and magnesium in MW-328. each above screening levels.<br />
4.2.5.2 Rationale for WAG 27 RI Groundwater Sampling<br />
RGA and McNairy groundwater sampling during the WAG 27 RI was designed to<br />
determine if leaks or leaching of contaminants from any of the WAG 27 SWMUshave contributed<br />
to previously discovered contamination within the RGA groundwater. The investigation was also<br />
designed to determine if the ,previously encountered contamination in the RGA represents a<br />
significant groundwater contaminant plume that exists south of ,the Northwest Plume and. if so, to<br />
help define the nature and extent of this ,plume. McNairy groundwater samples were collected' to aid<br />
in determining the role of the McNairy flow system in contaminant transport.<br />
4.2.5.3 Nature and Extent of Contamination<br />
Regional Gravel Aquifer-Analytical Results. Two-hundred:..twenty-five water samples<br />
were analyzed from 26 locations drilled into the RGA during the WAG 27 RI. WAG 27 RGA<br />
sampling Ilocations are shown in Fig. 3.6. The RGA groundwater samples were analyzed for the<br />
presence of VOAs, metals, and radionuclides.<br />
•<br />
Results that ,exceeded applicable background levels are listed in Tables 4.24 through 4.26 .<br />
A frequency of detection table (Table 4.27) presents summary information concerning the analytical<br />
results exceeding background values.<br />
A TU983500007 .Sec4_r.doc
Organics<br />
4-32<br />
Nine VOAs were detected in the RGA groundwater samples coHected during the WAG 27<br />
RI. Carbon tetrachloride and 2'-propanol(a chemical used in equipment decontamination) were each<br />
detected in only a single sample; carbon tetrachloride was found in a single sample and a<br />
corresponding duplicate sample. Chloroform and tetrachloroethene were each detected in only .two<br />
samples. TeE, which was present in 209 of the 225 samples analyzed, was the most common VOA<br />
detected. TCE degradation products were also frequently detected in the RGA groundwater<br />
samples.<br />
•<br />
Figure 4.29 is a contour map ·of the maximum TCE concentration reported from the RGA at<br />
each sampling location during the WAG 27 RI. Figure 4.30 is a northwest to southeast cross section<br />
showing. the vertical distribution of TCE in the groundwater in the area surrounding SWMU 'O~H and<br />
the C-720Complex. The highest concentrations of TCE in groundwater were generally reported<br />
between 76 and 97 ft bgs from the lower Ipart of the RGA.<br />
Two distinct areas of TCE contamination are indicated by the distribution of the TeE on the<br />
map and cross section. One is .associated with the C-720 Complex. In that area, a maximum TCE<br />
content of 1262 ugIL was found at 76 ft 'bgs at location 720-018 on ,the northeast side of ,the<br />
building. In the C-720 Complex, all of the highest detections of TCE were reported from samples<br />
collected immediately north of the building. The TCE content of the RGA groundwater upgradient<br />
(to the east-southeast) of the C-720 Building, as observed in samples collected from 720-010, 720-<br />
011, 720-012, 720-019, and 720-028, is significantly less than reported on the north side of the<br />
building, or from downgradient samples. These observations indicate that the TCE has been<br />
primarily introduced from a source that is located in or near the northeast comer of the C-720<br />
Building. Based on the available data, the axis of the TCE-contaminated groundwater appears to<br />
pass slightly west of location 720-026, which had a TCEcontent of 903 ugIL at 92 ft bgs.<br />
•<br />
A second area of elevated TCE in the RGA groundwater has been defined at SWMU 00'1.<br />
The axis of the plume in that area has been mapped as extending from ,the north-centralpart of<br />
SWMU 00 I to just west of SWMU 091 (Fig. 4.29). The highest detected TCE content within this<br />
plume is a relatively low 1578 ugIL from location 001'-082, which was sampled at 82 ft bgs. Based<br />
on historical data collected from MW-161 (an RGA well drilled during the Phase I and IT SIs), a<br />
significant increase in TCEcontent in the RGA occurred between 1993 and 1996: from a low of 600<br />
uglLin 1993 to a high of 23,000 ugIL in 1995, before decreasing to 750 ugIL in 1996. This well is<br />
located downgradient from the former Oil Landfarm and. the changes in the TCE content observed in<br />
the RGA have been interpreted as possibly indicative of a "slug" of TCE that has migrated to the<br />
northwest from SWMU 00 1. The current location of the maximum concentration of this TCE slug<br />
is speculative, but the high TCE reported in 001-082 probably is located on the fringe. The lateral<br />
extent of the plume is well defined by samples collected in side-gradient positions from locations<br />
001-75,001-083,001-084, and 001-085 on the west and two well samples collected at SWMU 091<br />
on the east. Several' samples, including one from OOI-077A, which had a low TCE content of 10<br />
ugIL, have been used to define the upgradient limit of the plume.<br />
The cross section in Fig. 4.30 shows that the TCE observed in the RGA groundwater<br />
originates from the vicinity of the former Oil Landfarm (SWMU 001). SWMU 001 as the source of<br />
the TCEis further confirmed by soil data collected during the WAG 27 RI. A TCE concentration of<br />
more than 400,000 uglkg was reported in a shallow soH sample collected from the former Oil<br />
Landfarm, immediately upgradient of MW -1M. Elevated TeE levels in the soil were also detected<br />
'.<br />
A TU983500007 Sec4_r.doc
•<br />
4-33<br />
in numerous samples collected down to a depth of 50 ft bgs, or just above the top of the RGA.<br />
Leaching of TCE from these soils is probablY the source ·of the observed historical slug and the TCE<br />
that has since been observed in the RGA groundwater in this area. However. if the TCE and Tc-99<br />
(see discussion below) are sourced from the same area. an upgradientrelease site is likely.<br />
TCE degradation products and other chlorinated solvents were detected less frequently than<br />
TCE and in smaller quantities. In the 225 samples analyzed, trans- I,2-dichloroethene was detected<br />
I<br />
in 108 samples at a maximum concentration of 25 ugIL;l, l-dichlorethene was detected in 68<br />
samples at a maximum of 54 ug/L; cis-l,2-dichloroethene was detected in 22 samples at a<br />
maximum ,of 31 ug/L; and vinyl chloride was detected in 18 samples at a maximum of 18 ugIL. As<br />
expected, the distributions of these TCE-related compounds are closely correlated with the areal<br />
extent of the TCE in the RGAgroundwater.<br />
Inorganics<br />
Eight metals were detected at concentrations above PRG screening levels from the 83 water<br />
samples collected from the RGA at WAG 27. Cobalt exceeded the PRG screening level in only a<br />
single sample. Sodium, magnesium. calcium. and iron. four essential nutrients and common soilforming<br />
minerals, and zinc were above PRG screening levels in less than 10% of the samples<br />
analyzed.<br />
•<br />
In every sample that contained elevated metals concentrations. manganese was detected at<br />
concentrations above screening levels. In many samples. manganese was the only metal to exceed<br />
screening levels. Six sample locations. all associated with SWMU 00 I. contained only manganese<br />
above screening levels. Interestingly . only samples from locations 001-076 and 001-080, collected<br />
upgradient and downgradient from SWMU 001, respectively. contained metals other than<br />
manganese. In both of these cases, the additional metals were calcium and magnesium, both of<br />
which were above screening levels in 'one sample from each location.<br />
Manganese, at concentrations above screening levels. appears to be widespread1in the RGA.<br />
High concentrations of manganese, however. are found both upgradient and downgradient from all<br />
four sites investigated under the WAG 27 R1. Upgradient concentrations of manganese as high as<br />
1.57 mgIL were detected l in 720-028. indicating that the metal is not being introduced to ,the<br />
groundwater from ,the WAG 27 sites.<br />
With the possible exception of SWMU 091. the distribution of manganese in ,the RGA does<br />
not suggest a source location associated with any of the WAG 27 sites. At SWMU 091, an RGA<br />
sample (091-001 ), which was collected from near the center of ,the drop test area, had a maximum<br />
manganese content of 6.88 mg/L (the duplicate sample had only 4.33 mgIL). This was the highest<br />
manganese detection from any WAG 27 RGA water sample. In a downgradient (and slightly sidegradient)<br />
sample, only 0.37 mg/L manganese was reported from the same stratigraphic interval.<br />
•<br />
Manganese concentrations as high as 0.560 mglLhave been reported from Quaternary<br />
alluvial groundwater in the <strong>Paducah</strong> area (Pree et al. 1957), and natural groundwater may contain as<br />
much as '1.0 mgIL manganese (Hem 1992). The relatively high manganese content observed in the<br />
RGAgroundwater at the PGDP may be related in part to. stratigaphyor to an unidentified source<br />
upgradient of the WAG 27 study area. SWMU 091 may contribute manganese to the RGA, but dUe<br />
to the widespread variability of manganese Within the RGA. a source at SWMU 09,1 has not been<br />
positively identified.<br />
A TU983500007 Sec4 _r;doc
Radionuclides<br />
4-34<br />
Technetium-99 was the most cOllll11only reportedradionuclide above screening levels. The<br />
maximum concentrations of Tc-99 from each sample location are shown in Fig. 4.31. The ,highest<br />
reported activity was 3709.6pCiIL from location ooil-182, which was downgradient of SWMU 001.<br />
Contouring of the data suggests that the Tc-99 maximum in the RGA is located almost due north of<br />
SWMU 001. The upgradient extent of the Tc-99 plume in the RGA in this area is defined by low<br />
concentrations of Tc-99 in samples from 00I-076,OO:I:-077A, and 001-078. Thedowngradient<br />
extent of the Tc-99-plume is not defined by the available data.<br />
•<br />
A second area of elevated Tc-99 in the RGA is present in the vicinity of the c-no Building.<br />
where the highest activities were detected on the north and northeast side of the building (Fig 4.31).<br />
Areas where the Tc-99 concentration is below screening levels have been detennined, and they<br />
define the extent of the contaminant plume on the west, south, and east sides of the building. The<br />
extent of the Tc-99 in the RGA to the northeast is based on low concentrations of Tc-99. less than<br />
100pCi/L, reported from ,an RGA water sample collected on the southwest side of the C-400<br />
Building in '1997 as part of the WAG 6 RI. In general, the distributions of Tc-99 at both SWMU<br />
001 and the C-720 Building resemble the RGA TCE plumes that have been delineated for the same<br />
areas. This similarity in trends suggests that the two contaminants have related origins and transport<br />
histories. The possibility that an upgradient source of the high Tc-99 observed at 720-029 or near<br />
SWMU 001 cannot, however, be eliminated.<br />
Cesium-137 was reported from one sample, and Pu-239/240 was detected above screening<br />
levels in three samples collected from two locations. The highest concentration of plutonium was<br />
3.79 pCi/L from a sample collected at location 720-010. However, the duplicate of this sample was<br />
non-detect for plutonium. Eight, detections of Th-230 were reported from the RGA groundwater<br />
samples. In four of these samples, Th-230 was non-detectin the associated duplicate sample. The<br />
maximum Th-230 activity was 37.58 pCiIL.<br />
•<br />
Uranium was detected in 28 unfiltered samples above the screening level. The most<br />
upgradient of all the samples (720-028) contained 0.02 mgIL uranium, which was higher than all but<br />
a few samples collected from the WAG 27 study area. The highest single concentration of uranium<br />
was 0.12 mgIL from a location (001-181) upgradient of SWMU 00.1 .<br />
1<br />
In filtered water samples, uranium was the only radionuclide detected above background.<br />
Uranium was not present at concentrations that exceeded PROs in any of the 55 unfiltered water<br />
samples tested.<br />
McNairy Flow System-Analytical Results. McNairy water samples were collected<br />
from 22 borings drilled during the WAG 27 RI. Fifty samples were collected and analyzed~ Fortyfive<br />
of the samples were analyzed at the on-site laboratory for TCE and its degradation products.<br />
Five of these samples were sent to a fixed-base laboratory and analyzed for a full suite of VOAs as<br />
part of the WAG 27 RI. Metals were analyzed for in 16 samples. Tables 4.28 to 4.30 contain a<br />
complete list of the constituents that were detected above background levels in the McNairy water<br />
samples, and Table 4.31 i presents a summary of the frequency of detections and range of detections<br />
for each of the reported analytes.<br />
•<br />
A TU983500007 Sec4_r.doc
•<br />
Organics<br />
4-35<br />
Except for a single occurrence of 2-:propanol, TCE and its degradation products were the<br />
only YOAs detected above screening levels from any of the McNairy water samples. The highest<br />
concentration of TCE was 115 ugIL at location 00 1-181. At every sampling location within WAG<br />
27, the TCE content in the McNairy was found to,decrease to less than 1 ugIL within 25 ft below the<br />
top of the formation (see Fig. 4.30). Clearly, 'FCEis not migrating vertically into the McNairy strata<br />
fromthe overlying RGAin significant quantities.<br />
Inorganics<br />
•<br />
Sixteen McNairy water samples were analyzed for dissolved metals, and six metals were<br />
detected above screening levels. Of these, barium, calcium, magnesium, and vanadium each<br />
exceeded screening levels in only one sample. All four detections were from the same sample,<br />
collected at 137 ft bgs at location 720~0'l'3 on ,the west side of the C-720 Building. Iron and<br />
manganese, the other two metals detected above screening levels in the McNairy, were also reported<br />
at high concentrations in this sample. Manganese, the most widespread of the metals detected in the<br />
RGA, was at its maximum in this sample. The absence of a similar suite of metals from the<br />
overlying sample of ' the McNairy groundwater makes the reported results from this sample suspect.<br />
Either the analysis is not valid or several' metals in high concentrations are migrating laterally at<br />
depth-a conclusion that does not appear reasonable based on previous work at the PGDP-or the<br />
high metal content is due to localized physiochemical or stratigraphic conditions within the<br />
McNairy .<br />
Iron was reported above screening levels from seven samples collected from fivdocations.<br />
Four of the locations are near the C-720 Building, and the fifth is in SWMU 001. An iron content<br />
above 5 mgIL in the McNairy was reported fromupgradient location 720:.029 at the C-720 Building.<br />
Except for the sample taken from 720-013, the other three McNairy water samples to exceed this<br />
level for iron content were from 720-0H at 120 and 140 ft bgs and 720-011 at 120 ft bgs. The<br />
sporatic occurrence of metals concentrations above screening levels is not attributed to the release of<br />
metals from the WAG 27 Rl sites.<br />
Radionuclides<br />
Uranium, Th-230, and Tc-99 were the only radiological constituents detected above<br />
screening levels in the McNairy water samples. Thorium was present only in samples collected<br />
from SWMU 091 in boring 091-002. The activity of thorium was found to increase from 1.53 to<br />
16.9 to 53.77 pCi/L in samples collected at 102, 127, and 137 ft bgs, respectively. Elevated<br />
activities of Tc-99 were reported from a single sample collected at the C-720 Complex. Uranium<br />
was reported above the screening level from 13 of the 20 samples analyzed for radionuclides; its<br />
maximum concentration was 0.17 mgIL.<br />
No radionuclides .exceeded both background and PRG screening levels for filtered water<br />
samples.<br />
•<br />
4.2.5.4 Summary of Findings<br />
TCE "background" in the RGA at thePGDP may be as high as 10 ugII:. in the WAG 27 area.<br />
YOAs, predominantly TCE and its. degradation products, found at concentrations as high as 1578<br />
ATU983500007 Sec4fdoc
'4-36<br />
1J,g/L in the RGA appear to originate from two SWMUsinvestigated as ;part of the WAG 27 RI. At<br />
one of these sources, SWMHOOl, a TCE plume in the RGA has been identified and extends from<br />
the site to ,the northwest. l1he fun downgradient extent of the plume has not been defined by the<br />
available data. Analyses of the soils and groundwater data collected at SWMU 001 indicate that the<br />
TCE contamination in the RGA could have been derived l from leaching of contaminated' soils that<br />
were :disposed ,of in theinac,tive roil landfarm. However, if the TCE and lic-99 (see below) found in<br />
the RGA are derived from the same source,an upgradient release site cannot be ruled out.<br />
•<br />
Radionuclide (Tc':99) trends at SWMU 001 are similar to TCE concentrations, indicating<br />
that Tc.:99 may also :have been sourced, from the landfarm and,that the migration paths of the TCEand<br />
Tc-99-contaminatedgroundwater are similar. Althqugh only low concentrations of Tc-99 were<br />
found inSWMV 001 vadose zone soil or VCRS groundwater, this mobile radionuclide may have<br />
been more abundant at the site in the !past. Another possibility is that the Tc-99 in the RGA near<br />
SWMUOO;l1 has been: sourced from one of the nearby cylinder storage yards.<br />
The second source of TCE contamination within the RGAhas been defined around theC-<br />
120 Complex. lIn that area, a maximum 'of 1262).1.gIL tCEwasdetected in theRGA. The source of<br />
the TCE would;appearto' be related! to past ,surface ,disposal o~ TCE near ,the northeast comer of It he<br />
C· 720 Building, with 'perhaps some :contribution ftoni ,leaks that have occurred along the building<br />
exit drain!lines on the southeast side,of the building.<br />
'<br />
T.c-99 activities in .lheRGA at the C-720 Complex indicate that this ,radionuclidealso was<br />
derived from a source ,that was located' on the northeast comer of the building, or from an upgradient<br />
location. An upgradient source of the Tc-:99 is suggested '<br />
1:Jy ,the high (525 pCiIL) Tc~99activity<br />
reported from location 720-029, Thedowngradient extent of groundwater impacted by VOAs and<br />
radionuclides at the C-720 Complex is not fully defined! by the available data. RGA groundwater<br />
c.ontaminated with VOAs andradionuclides does not appear .lobe migrating vertically into the<br />
underlying McNairyFormation.<br />
Several metals occur within the RGA at concentrations above screening levels. 1ihe<br />
distributions and concentrations ofthemetals,in the RGA and McNairy groundwater appear to be<br />
unrelated to any identifiable source area' within WAG 27.<br />
•<br />
A TU983500007 Sec4_r.doc
\ .....<br />
.... ......... .<br />
.... "'-<br />
146658.04.01 12198ik<br />
".<br />
,<br />
\~ :<br />
~ ........-.. --- ~<br />
".<br />
; ;<br />
! \<br />
! ;<br />
: \<br />
, I<br />
....<br />
.<br />
.. '<br />
SURF N.;E SOIL SAMPLE<br />
DOUBLE-~G ~LTROMETER<br />
AREA OF BURIED MET AI..<br />
(GEOPHYSICAl. SURVEY)<br />
_.- WMU BOUNDARY<br />
• • •• APPROXIMATE BOUNDARY OF<br />
~., I ___..:LA:;::.::ND:::F.::;:A::.;RM:::.:,.PL:::OTS::.:.:______<br />
~<br />
~i<br />
........<br />
o • • •<br />
Fig. 4.1. Sampling locations from Phases I and II Site Investigations: SWMU 001.
WAG 29 SWMu D~TION SAMPIJNG GRID<br />
S1nm DELINEATION &-FOOT SAMPLES<br />
. 00 .... _1.00<br />
II!! I 1<br />
11866<br />
• SAMPIJNG POINT FROM m ADDENDUM<br />
Fig.4.2 WAG 23 focused sampling grid at SWMU 001.
$OOH11l3<br />
001-101~,,,001'-1O2<br />
001-103--.1<br />
001,..104<br />
OOH~4$<br />
lirench Excavation Areal amd<br />
Associated Sample Stations at SWMU ()(}11<br />
$OOHX12<br />
OOHlIIO$<br />
$001-075<br />
001-009 OOH)()II ;01-069 001-007' 001-004 00~-003<br />
001-011. 00<br />
1-019 ~1-01O -001-051 0 . 0 0001-006 T!oI-006 0 .<br />
o 0 pOOHJ65 0001-057 0'OOH1611<br />
001-073 . 001-066 00.066 ~ 0001-0611 0001-071<br />
OOH155 0511<br />
001-0120 001-0~ 001-0): 1-016 000":Oi7 0001-0111<br />
. . 001-015&'1- 7 -001-060. .<br />
001-0310 :i~ ::::: 0'<br />
o 0001-063<br />
001-062<br />
OOHX29<br />
1-;"~001_~7 0 001-026 0001-005<br />
OOH128<br />
0001-032 0001"003 0001-034 0001-035 0001-
~1-104<br />
$001-075<br />
00.1-071<br />
eND<br />
.001-005<br />
NO<br />
001-004<br />
NO<br />
e<br />
001-076,\001-050<br />
001-~ j ~ _<br />
ND 001-076A 001 002<br />
Trench' Excavation Area and<br />
Associated Sample Stations at SWMU 001<br />
001-012.<br />
NO .<br />
.001-018<br />
ND<br />
8001''''019'<br />
NO<br />
e001-020<br />
NO<br />
8001,..021<br />
NO<br />
e001-027<br />
NO<br />
.001-026<br />
'ND<br />
e001-025<br />
NO<br />
e001-024<br />
NO<br />
eOO1''''023<br />
NO I!OO<br />
OOh032<br />
eNO<br />
I! 001-070<br />
001,..033<br />
eNO<br />
001-034<br />
eNO<br />
001-036<br />
eND<br />
001-037<br />
'. .<br />
001 ...:038<br />
NO<br />
NO<br />
001-077$ tel-077A<br />
8001-044<br />
NO<br />
.001-043<br />
NO<br />
e001-042<br />
NO<br />
.001-041<br />
NO<br />
.001-040<br />
N8<br />
.001-039<br />
NO<br />
I! 001-046<br />
I! 00 l-Q48<br />
1!001-047<br />
$001-078<br />
MWl88®<br />
®MWl89<br />
• UCRS BOR ING<br />
o RGA BORING<br />
$ McNAIRY BORING<br />
®. EXIS:rING MONITORING WELL<br />
~ SEDIMENT SAMPLE LOCA:rION<br />
~ TRENCH EXCAVATIONS<br />
LEGEND<br />
STORM DRAIN<br />
SANITARY SEWER<br />
@ ZONE OF TCEDE"(;ECTION<br />
NO<br />
'RESUL T NON-DETECT OR BELOW<br />
PRGFOR INOUSTR IAL SOILS<br />
460 TCE CONCENTRATION IN uglkg<br />
060<br />
I<br />
SCALE IN FEET<br />
Fig. 4.4 Distribution of TCEin UCRS soil at SWMU001.
A<br />
WEST<br />
DEPTH<br />
BELOW<br />
GROUND<br />
SURFACE<br />
0<br />
GROUND SURFACE<br />
&I) co ,...<br />
..-<br />
&I)<br />
:8<br />
,...<br />
..- .... .... .... ..... 9<br />
.... 9 ....<br />
9<br />
0 0 0 g g 0 0<br />
~ ~<br />
CO<br />
9 9 9<br />
"<br />
0 0 0 0 0<br />
ND NO ND<br />
10 ND 170 NO 10<br />
::?!<br />
LU<br />
t-<br />
~ ND 14, 40 ND<br />
UJ<br />
UJ<br />
(!) -~<br />
~ 20 15 800 ND 20<br />
0<br />
~<br />
~<br />
z -~<br />
LU<br />
ND 2600 ND<br />
t1'<br />
~ 30 NO 5500 ND 30<br />
t- Z<br />
0<br />
n:=<br />
NO 2700<br />
NO<br />
w<br />
a.<br />
a.<br />
:::> 40 NO 5000 ND 40<br />
'"<br />
A'<br />
EAST<br />
DEPTH<br />
BELOW<br />
GROUND<br />
SURFACE<br />
0<br />
Location<br />
LEGEND<br />
ND<br />
23,000<br />
•<br />
$<br />
®<br />
~<br />
• • • • • • III<br />
••<br />
• • • • • • Ii"!<br />
III<br />
RESULT NON-DETECTED<br />
TCE CONCENTRATIONS IN ug/kg<br />
UCRSBORING<br />
McNAIRY BORING<br />
EXISTING MONITORING WELL<br />
SEDIMENT SAMPLE LOCATION<br />
III<br />
8 NO 4200 ND<br />
50 ND NO 4300 ND 50<br />
o<br />
o<br />
Vertical Scale<br />
In Feet<br />
Fig. 4.5 East-west cross section A-I\ showing TCE distribution in UCRS soils at S\tVMU 001.
B GROUND SURFACE B'<br />
NORTH<br />
DEPTH<br />
BELOW 0) It> It> It><br />
('I)<br />
v<br />
GROUND<br />
~ ~<br />
SURFACE<br />
0 0 9 0 0 9 0 9<br />
I I<br />
,<br />
I I<br />
SOUTH<br />
DEPTH<br />
BELOW<br />
U) U) It> ..... It><br />
,...<br />
GROUND<br />
..... ..... ..... ..... .... ..... ..... ..... SURFACE<br />
0 0 0 0 0 0 0 0<br />
0 0 0 0 0 0 0 0<br />
0<br />
NO 60<br />
10 460 NO 26<br />
10<br />
~<br />
w 5,000<br />
I-<br />
~ NO NO<br />
w<br />
C><br />
a:<br />
• •<br />
~ 20 42 NO ND 20 • • • • ill<br />
(.) ill ill<br />
w<br />
0:: LEGEND<br />
~<br />
Z<br />
100 7000 NO<br />
NO<br />
Location<br />
RESULT NON-DETECT<br />
w<br />
Z<br />
§ 30 25,000 TeE CONCENTRATIONS IN uglkg<br />
i= 30 .,<br />
800 1700 NO<br />
z<br />
C::;'<br />
0<br />
liS<br />
UCRSBORING<br />
•<br />
(.)<br />
0:: 1200 NO NO
__<br />
f, ; ~;~'lS-r~II8tl~I: ~,ep=tn~l~ftlI".4..;.)flC-4-.1 :.<br />
nLlX~ll-![[1r~ilf\~~~~[]~~~+-U'+'-4_.JJ..lW~='''='''''''::::;' ~ti1uenUDeoth IfUll;OrtC. I fi.~. '~'10 ==~B:lt' '~_'",-<br />
\;,;or. BI' , , I~t' 'tl, :;( 0<br />
",.nm;,....... 17-10 1~.45 I...... ..... \ t .......... ~ ..... ~ 'I-: I .f<br />
.... , ' Ii "",,,:,(,,' 1- i :~tt<br />
LXI1-(I 'I[ c~;:;: ,.':::: \., ........ ························1 ····.·.·,·,.L."""", ... " ~ ''''' SiiVcl = 1-' ... 113~90 '<br />
~::~::~:~7-10~12.~82i-~~,~-----!--~:---="'~,<br />
~onstituentllDeoth lltJl cone. L "','-<br />
I Cadmium 17-10 17.83 I MW161® MWl6200 '",.,<br />
$001-075 001-049ii11 001-079 ~ ~<br />
NO<br />
001-011"<br />
• 001-009<br />
NO 88001' 051<br />
001-069<br />
N08<br />
'..<br />
I U{II-012 I<br />
L~ons1i1uen1IDeptn--rmrconc.<br />
I<br />
ICLdmium 17':10 T7--:8f 1<br />
JCI1-( 141<br />
,t :>81lthlftl I nc.<br />
'-l' 70<br />
~lIt'1rnll om 7-) ~ IA<br />
~Uf ... tituent D80th (ftJ cone.<br />
~;!aJ~ 7-10 IQ-41<br />
I ~ 7-1C: 13.13<br />
ND001-01O NO ,..<br />
iND 001-056001-'057 001-068<br />
~1-0668 JlNO _ND eND<br />
OOHl65. 001-0588 8<br />
NO 001-0138<br />
~<br />
001-0318<br />
ND<br />
.~.i~,'~~-----,---,-----,---....-,---~,------------,,-" .......-, _____ 00_1._-..... 0<br />
1<br />
-NO ~~n!::~',~~~~-~<br />
.<br />
NO 001-055 NO «lID I . 0.') I<br />
\\ \<br />
NO '. .~,!D<br />
, ND<br />
001-030 001-064 '<br />
ND<br />
00 Hl62-<br />
ND<br />
.00<br />
001-032 001-033<br />
eNO 8!NO 41'<br />
..... 7~0~~~·-----------1<br />
~----- \<br />
NO .<br />
/ --'1 001-042 •<br />
:1001-074 I 8001-044 \<br />
I \,,;on:nituent UY-8Oth 1'ltIIl;OrtC. 1<br />
NO<br />
148-50 1871 1 \<br />
001-048111<br />
8<br />
001'-0411<br />
NO<br />
8001-035<br />
NO<br />
,\<br />
001-040 •<br />
NO<br />
,... 1 _ '~~'~dWU""77':~~U<br />
I<br />
8001-026<br />
NO<br />
001-0~077A •<br />
001-0398<br />
NO<br />
111001-047<br />
I II'lStituenTIOI )tll Iftll CO<br />
-- J 12.3<br />
001-046111<br />
". ", ..<br />
ocrr-018 I \.<br />
l;onstituentTOiii:ffil Iftll cone. I<br />
.... -..... T7-10 13.32 I<br />
I<br />
MW ,11!J \!JMW162<br />
~<br />
1-~1~t="001-102<br />
001-103~<br />
,t<br />
001-104<br />
-~------------"""""''''':::::::::-'.e-""I Trench Excavation Area and<br />
001-076\001-050 ASSOCialed Sample SIaliOns al SWMU 001<br />
00 Hl04<br />
:ND<br />
8<br />
001-~ j '- ." ~-( 01 ; ~~~uent ; Deptn Iml cone. II<br />
NO 001-076A f£1-002 --j;===illl("i ..-i'i<br />
..... ~lbI7~-;1CO~;;12.;68;,~1<br />
~<br />
/" I lUeotn utll'Cone. /' 11 .....-"'" 17-10 12~84 I<br />
8001-021 01<br />
NO<br />
[X)1-0m<br />
\,,;onstituent, Je Itnlftl nc.<br />
r;:;c<br />
IC 5<br />
' ..-- I r- o<br />
7-<br />
-001-025<br />
NO<br />
001-038<br />
NO<br />
e001-024<br />
NO<br />
iill001-045<br />
\<br />
I( 11-0?3 ,I<br />
l",onstitueotllJei)tn Utili Cone, 1<br />
II ... t'fm:I.... ~~ 12.35 1<br />
TEN~~ESSE.E i\ \it: .<br />
~ rloo:::~~dm~um=:.:.:..--'I:.:.[D~eot:......t,_ (lf1I..uIl;~ornc,--;'..J1<br />
'" JDeoth lUll cone. I<br />
ICadmium 1,7-10 12.46 I<br />
$001-078<br />
/<br />
.;onsmuent leo tn Iftl n<br />
Xl<br />
Xl<br />
6C<br />
!K:<br />
1<br />
·1001-r[...<br />
I ",onsmuentl I D8Pffl I tt11 cone. I<br />
ICadmillm '7-10- 12,.74 1<br />
][)1-( 17<br />
r- 6.:'0<br />
:;aClmium r- .9<br />
r- ,11 iO<br />
: '<br />
MWl88®<br />
®MWl89<br />
001-(134<br />
Constituent LJeotr IItIlConc. "l<br />
' .. t1miI '"' 7-10 13.35 '1<br />
LEGEND<br />
\<br />
i\<br />
• UCRS BORING<br />
o RGABORING<br />
$ McNAIRY BORING<br />
® EXISTING, MONITORING WELL<br />
III SEDIMEN:r SAMPLE LOCATION<br />
c::::== TRENCH EXCAVATIONS<br />
NO<br />
871<br />
STORM DRAIN<br />
SANITARY SEWER<br />
RESULT NON-DETECTOR BELOW<br />
BACKGROUND/PRG VALUE FOR INDUSTRIAL SOIL<br />
INORGAN IC CONCEN1iRAT ION IN mg/kg<br />
o 60<br />
1--<br />
SCALE IN FEET<br />
Fig. 4.7 Dlstnbutlon of arsenic, cadmium, manganese, and sliver in tieRS soil at SWMtI 001.
Deeth<br />
! '[' I: I I: I I ! I! 1<br />
\.<br />
001-01.1<br />
cons,II,.-:>1 1'I:.IeDtn rm,CQllC"l<br />
A. 17-10' I.Ul I<br />
Deeth (ttl Cone~ I ueptr 1ft! (;one. 1 Constituent 1<br />
m: cone.<br />
urn ;:-:~__ ~.,:' urn ~=~ ~'1~ 1:_nQ'~')' ~i I F:~<br />
---.<br />
001··049111<br />
lIll-OIY<br />
uent 1 Deeth (ttllconc. I ~1-0120<br />
~<br />
-:~1~:D~~t~'7~1:;:~.,~~,g~:.gg B:'-t NO<br />
, Deeth Utll cone .1<br />
7-10 10.63 ,I<br />
[IJ1-014<br />
I ..... .-... .. un 7-10 12110 1<br />
OCll-[Rl<br />
",umnituent,IDepth fftllConc.:J<br />
• 7-10 1'fJ2 IT<br />
/ "'OO""01~"-"CD:!lIII~"O--'<br />
cons, II, .-:>1 IU8Ptn [m l-canc.l<br />
A. :7-10 1Q.Q.'f T<br />
v<br />
I<br />
o<br />
001-073<br />
NO<br />
1oo~-o7o<br />
0001-044<br />
NO<br />
001-0481l!<br />
\<br />
-\<br />
0,<br />
001-062<br />
ND<br />
®MW'lbl I!lMVI Ib~<br />
001-008<br />
ND\.<br />
001-051 It<br />
ND<br />
'<br />
60<br />
IND ;<br />
00,t"'007<br />
OND<br />
001-006<br />
OND<br />
001-056 001-057 ~<br />
001-0660 _NO oNO<br />
NO 001:...065<br />
NO 0 001-0588 0001:"'061 0001-071<br />
00.1-055 ND ~ n NO NO<br />
ND 00,1-016 001-017<br />
001-0158 001-067pND aND<br />
NO f£1-053~... 8-- OOHl6O<br />
001-0528 e::.:: 001-072 -059 ND<br />
NO a ND ND<br />
054<br />
8001-063<br />
r ,<br />
J<br />
001-042.<br />
NO<br />
• 001-043<br />
NO<br />
001-074 . 1-064<br />
e NO<br />
eOO~~7<br />
001-029 NO<br />
NO<br />
001-0190<br />
NO<br />
001-004<br />
ND<br />
•<br />
001-036 001-037 001-038<br />
eND ~D ~D<br />
001-077$ $001-077A<br />
001-0390<br />
ND<br />
1il'l001-047<br />
001-046 III<br />
00~-076\ 001:"'050<br />
001-003, j<br />
N0001-076A .<br />
001-020.<br />
NO<br />
001-021 1 0<br />
ND<br />
001-'101~{001-1O2<br />
001-103----v<br />
001-104<br />
Trench Excavation Area and<br />
Associated Sample Stations at SWMU 001<br />
-<br />
I11-lIJl<br />
001·0220<br />
'ND<br />
0001-025 8001-024 0001-023<br />
NO ND<br />
ND 1il'l001-045<br />
I<br />
(;Onstituen\ Depth (ttl I cone. I<br />
:6-.10 10.91 I<br />
001-002<br />
D01-( 118<br />
nt I Deotn Utll cone. I<br />
16-10 10.78 I<br />
I:\,;onstituent 1 Depth (ttJ I Cone. I<br />
urn 17-10 12310 I<br />
\ lIJl-I""M<br />
urn 7-10 ,12520 I<br />
\J ~.;~ccr~r1S~ll1l'~luen~t~I~[D~ee~th; ((ft'~I1:~ II~ conc~'L<br />
fCNNCSSEE AvE,<br />
I __ J<br />
~;-""'.---------I<br />
7<br />
1 I<br />
$001-078<br />
HI<br />
[)[Il-L rJ' /<br />
\,;~orns~l1Il~u~uen.:::-tl1l O"'=ep::Z:-th'" (I ftI':'riT'l111 c~one~;-I •. I<br />
flY 17-10 10.63 I<br />
MW188®<br />
001- 133<br />
I \,;or stituent 1 DeetnlltJl cone.,1<br />
7-l(}ll;51 1<br />
®MW189<br />
\<br />
:onstituent 1 ueotn IItJlConc. I,<br />
urn 7-10 12630 I'<br />
11-llo4<br />
uent 1 Deeth (t.t) I G.~<br />
!<br />
\<br />
\,;onstituent D1-C~<br />
1 Deoth Utll Cone. I \\<br />
um 7-10 124501<br />
• l:JCRS BORING<br />
o RGA BORING<br />
$ McNAIRY BORING<br />
® EXISTING MONITORING WELL<br />
III SEDIMENf SAMPLE LOCATION<br />
~ TRENOi EXCAVAJlONS<br />
.........""<br />
FIg. 4.8 DIstributIon of antimony and magnesium iin UCRS SOil at SWMU ()()1.<br />
o 60<br />
1- 1-<br />
SCALE IN FEET
- e-<br />
Northeast<br />
---e---,<br />
Gravel Area<br />
Northwest<br />
Grass<br />
Southeast<br />
360<br />
350<br />
340<br />
330 /<br />
320<br />
310<br />
300<br />
-<br />
~<br />
I- w<br />
~<br />
a:<br />
o<br />
I<br />
U)<br />
a:<br />
w<br />
o<br />
~<br />
t<br />
\. 0H201<br />
----1_ ...<br />
$<br />
®<br />
Ell<br />
0<br />
$ 09 H)() 1<br />
RELATIVELY<br />
)<br />
HIGH TOPO<br />
AReA<br />
0H078<br />
~ 09H)()S IlI09H)Q6 /.: •<br />
__-=-""_ ........... 0----= •. ~ • - .........-- ••• --....-- •••.---- .......... ~~<br />
___- ••• ___- .......... 0-=-_ •• • a::4<br />
ViRGINIA AVE.<br />
LEGEND<br />
McNAIRY BORING STORM DRAIN 7- ' a:<br />
.~,<br />
~ ~<br />
.-~-<br />
EXISTING MONITORING WELL<br />
SANITARY SEWER<br />
SEDIMENT SAMPLE LOCATION ~ CULVERT<br />
~~ ~<br />
HISTORICAL SOIL BORING LOCATION - ...- OITCH/PIPELINE<br />
Fig. 4.10 Sample locations from Phase I and II and WAG 27 RI activities at SWMU 091.<br />
0 60<br />
I<br />
SCALE IN FEET
w<br />
~<br />
cr<br />
....<br />
o<br />
U)<br />
cr<br />
~<br />
~<br />
t<br />
.~-.- .............. . " . _........" .......<br />
DRAINAGE ..... ,,/<br />
DITCH<br />
~W,<br />
MW158®<br />
0 HOO3 0 0H203<br />
~~=========~<br />
)<br />
0H202<br />
$091-001<br />
..... - ..................... _,..,<br />
0H078<br />
V!RG!N!A AVE.<br />
$ McNAIRY BORIN~<br />
® EXISTING MONITORING WELL<br />
iI SEDIMENT SAMPLE LOCATION<br />
o HISTORICAL SOIL BORING LOCATION<br />
STORM DRAIN<br />
SANITARY SEWER<br />
..-.. aJLVERT<br />
- ... - DITCHIPIPELINE<br />
348 CONCENTRATION IN mglkg<br />
NO RESULT NON-DETECT OR<br />
BELOW .. BACKGROUND/PRG<br />
FOR INDUSTRiAl SOIL<br />
o 60<br />
I<br />
SCALE I N FEET<br />
Fig. 4.11 Distribution of select metals at SWMU 091.
-:<br />
~ ...,<br />
w<br />
C)<br />
~<br />
a:<br />
0<br />
...,<br />
tn<br />
a:<br />
w<br />
0<br />
~<br />
~<br />
$<br />
A<br />
\<br />
\<br />
\<br />
0H201<br />
MW159<br />
MW158® ® ~<br />
... _ ~l:0~ .. ::::::.;:=::::=0=H=003===::::O:;: .•.... = ......:::<br />
091-004~ \<br />
NO<br />
0H202<br />
.......... ~~~ ..,_...._....<br />
"'." "" DRAINAGE<br />
DITCH<br />
$091-(x)1<br />
0H078<br />
III 091-005<br />
• .. .. .........N..Q ... -.~ • " . ~ ........ ~ ..... _.. ~ " ~ ~ ........... -... K<br />
,. K ..wG-"-'~"""<br />
ViRGINIA AVE.<br />
$<br />
®<br />
iii!!<br />
0<br />
McNAIRY BOR ING<br />
EXISTING MONITORING WELL<br />
SEDIMENT SAMPLE LOCATION<br />
I I<br />
HISTORICAl,. SOIL aORING LOCATION<br />
-1,.-<br />
LEGEND<br />
STORM DRAIN 10.7 CONCENTRAT ION IN pCi/g<br />
SANITARY SEWER NO RESULT NON-DeTect OR<br />
OJLVERT<br />
BELOW BAO
Elevation<br />
(ftamell<br />
370<br />
360<br />
350<br />
340<br />
330<br />
320<br />
310<br />
300<br />
290<br />
280<br />
270<br />
260<br />
250<br />
240<br />
West<br />
A<br />
Surface Runoff<br />
~<br />
East<br />
A<br />
Elevation<br />
(ftamsl)<br />
~-"'- 370<br />
360<br />
350<br />
340<br />
330<br />
320<br />
310<br />
300<br />
290<br />
280<br />
270<br />
260<br />
250<br />
240<br />
230<br />
220<br />
---------------------------------------------------------------------------<br />
230<br />
220<br />
LEGEND<br />
Gravel<br />
Clay<br />
Silt<br />
South Facing Section<br />
Not to Scale<br />
Sand<br />
A<br />
Former TCE Pit<br />
Concrete Pad<br />
D<br />
A<br />
Horizontal<br />
Not to Scale<br />
.. Contaminant Migration Pathway<br />
Groundwater Level<br />
t Precipitation Produces Infiltration<br />
~ Surface Water Runoff<br />
146658,()I,02 12J98 1k<br />
Fig. 4.13. SWMU 091 site conceptual model.
ACCESS RD,<br />
ACCESS<br />
EXPPSED CONCRETE PIPE EASEMENT<br />
.196-017<br />
i<br />
e196r015<br />
! 196-013 i<br />
....... ~-- -es4-01O<br />
196-003. - - - .... - ·-.19&-012<br />
'-4" VITREOUS<br />
CLAY PIPE<br />
e UCRS BORING<br />
~ SEDIMENT SAMPLE LOCATION<br />
--~-----<br />
STORM DRAIN<br />
- - - .-~-<br />
SANITARY SEWER<br />
~ . 5 z<br />
196-004<br />
Depth (tt) Cone.<br />
0-2 .9.80<br />
2-4 1.74<br />
4-6 '1.18<br />
6-8 0.90<br />
8-10 1.02<br />
196-001<br />
Depth (ft)Cone.<br />
0-2 61.50<br />
2-4 39.90<br />
196-015.<br />
NO<br />
196-014 •...<br />
NO<br />
~<br />
196-010<br />
Depth (tt) Cone.<br />
0-2 1.40<br />
2-4<br />
4 -6<br />
6-8<br />
8-10<br />
196-008<br />
Depth (tt) Cone.<br />
0-2 40.90<br />
2-4 NO<br />
4-6 6.26<br />
6-8 NO<br />
8-10 1.85<br />
1.54<br />
NO<br />
1. 12--1<br />
1.2 7 ---'<br />
• UCRS BORING<br />
.1iiI!I SEDIMENT SAMPLE LOCA:rION<br />
STORM DRAIN<br />
SANITARY SEWER<br />
61.5 CONCENTRA:rION IN mglkg<br />
Na RESUL T NON-DETECT OR BELOW<br />
BACKGROUNDt'PRG FOR INDUSTRIAL SOIL<br />
o 60<br />
I<br />
SCALE IN FEET<br />
Fig. 4.15 Distribution of antimony at SWMU 196.
ACCESS RD.<br />
ACCESS<br />
i<br />
196-01HI----l:--, __ ...• ~01O<br />
196-014. ...-~.196-00+<br />
! ,<br />
NOliE: 196-013 WAS SAMPLED EVERY 2ft FROM THE Sl:JRFACE TO 20ft bls.<br />
• UCRS BORING<br />
III SED IMENT SAMPLE LOCA:rION<br />
STORM DRAIN<br />
SANITARY SEWER<br />
12,1 CONCENTRA:rION 'IN mg/kg<br />
o 60<br />
I<br />
SCALE IN FEET<br />
Fig. 4.16 Dist~ibutionof all detected metals a,t 196-0,13.
...L. ......<br />
196-017<br />
Const. Depth (ft)<br />
A11.611irUn 2-4<br />
AJunirUn 4-6<br />
AJI:J'fIinum 8-10<br />
Cone.<br />
'13~800<br />
16.900<br />
'15.500<br />
• UCRS BORING<br />
liB seDIMENT SAMPLE LOCATION<br />
STORM DRAIN<br />
SANITARY seWER<br />
587 CONCENTRAtION IN mg/kg<br />
NO RESULT NON-DETECT OR BELOW<br />
BACKGROUNDIPRG VAll:lE FOR<br />
INDUSTRIAl SOIL<br />
Fig. 4.17 Distribution of aluminum and nickel detected at SWMU 196.<br />
o 60<br />
I<br />
SCALE IN FEET
South<br />
Elevation<br />
(ft amsl)<br />
370<br />
0 1~e<br />
East<br />
C-746-A Building<br />
Gravel<br />
Subsurface r<br />
004. /<br />
007 e 7<br />
/<br />
oo5 e/<br />
_-- L'.. /<br />
006 . __<br />
septic tank ' ~ h 1- eOofr' -<br />
e 017 _<br />
/<br />
...L_<br />
/<br />
360<br />
West<br />
Elevation<br />
(ft amsl)<br />
370<br />
350<br />
360<br />
LEGEND<br />
Gravel<br />
Clay<br />
Silt<br />
350<br />
Sand<br />
•<br />
Soil Boring<br />
Leach Fill Line<br />
Precipitation Produces<br />
Infiltration<br />
Horizontal<br />
Not to Scale<br />
............ Contaminant Migration<br />
'""""JIIIIII' Pathway<br />
146658.04 02 12198"<br />
Fig. 4.18. SWMU 196 site conceptual model.
,<br />
TENNE<br />
MW326®<br />
LEGEND<br />
® EXISTING MONlliORING WELL<br />
-0 STORM DRAINAGE SYSTEM<br />
- DRAINAGE SYSTEM EXlf .POINTS<br />
e HISTORICAL SOIL BORING LOCATION<br />
o 120<br />
I<br />
SCALE IN FEET<br />
I<br />
Fig. 4.19 Location of Compr:essor ShOp and major bl:Jildir:Jg exit drains at C-720 Building.
•<br />
.<br />
~.!<br />
:-;-:<br />
-:: .~:. .<br />
:~~ .. :<br />
.<br />
••••••••••••••• iH ••••••••••••••••••• r"l :<br />
-r :. I L _.._I-<br />
.' .<br />
.~.I-I --- LocatIOn of Sump : Eaatem.waD of e-nD building<br />
; : Compiesaor Room PIt .~. !'<br />
i--~. open. jDInad Iafd tile 8IUUIId pIand<br />
• • column fDoting<br />
..................'::•••....... D._ ........<br />
----·r··<br />
Jt<br />
..:<br />
.<br />
I~·----···:ft<br />
I I<br />
Plan View<br />
CanpresscrRoom;pt<br />
•<br />
Typical Section of<br />
Sub-Soil Drair:l<br />
1rZ' Joint<br />
SideVISW<br />
Typical Sub-Soil<br />
Drain Joint I<br />
•<br />
Fig. 4;10 Compressor Shop pit plan anddetaUs.
0720-026<br />
TENNESSEE<br />
0720-0116<br />
720-023-<br />
720-017$<br />
(PZ-4)<br />
MW326®<br />
/<br />
ILEGENp<br />
UCRS BORING 0 SLUDGE SAMPLE<br />
RGABORING<br />
STORM DRAIN<br />
1 $ McNAIRY BORING e HISifORICAL SOIL BORING LOCATION<br />
® EXISTING MONITORING WELL<br />
720-012$<br />
(PZ-1) MW217®<br />
Fig. 4 .• 21 Sample locatiOnS at C-720 Con1)Iex.<br />
0120<br />
I<br />
I<br />
SCALE IN FEET
0720-026<br />
A<br />
NORTH<br />
DEPTH<br />
BElOW<br />
GROUND<br />
stmFACE<br />
""<br />
~ ~<br />
GROUND SURFACE<br />
~<br />
~<br />
i<br />
~<br />
""<br />
~<br />
~<br />
A'<br />
SOUTH<br />
DEPTH<br />
BElOW<br />
GROUND<br />
SURFACE<br />
0<br />
~ I<br />
Hot 10 8c:IM<br />
5<br />
10<br />
NO ND NO<br />
15<br />
LEGEND<br />
ND<br />
RESULT NON-DETECT<br />
5000 NO NO 26<br />
20<br />
25,000<br />
•<br />
$<br />
TCE CONCENTRATIONS IN ug/kg<br />
UCRSBORING<br />
McNAIRY BORING<br />
NO NO NO<br />
25<br />
®<br />
EXISTING MONITORING WELL<br />
NO ND NO<br />
30<br />
35<br />
NO<br />
NO<br />
35<br />
40<br />
NO NO NO<br />
40<br />
45<br />
8 § §<br />
0<br />
§ NO<br />
.0 d ;!2' cd<br />
NO<br />
NO<br />
45<br />
50<br />
50<br />
o<br />
o<br />
Horizontal Scale<br />
in Feet<br />
Vertical Scale<br />
in Feet<br />
WAG27-36.CDR<br />
Fig. 4.23 North-south cross section A-~ showing TeE distribution in UCRS soils.
0720-026<br />
TENNESSEE<br />
0720-016<br />
720-023-<br />
NO<br />
MW326(ii)<br />
720-012$<br />
(PZ-1) MW217 IJII<br />
UCRS BORING<br />
iRGA BORING<br />
McNAIRY BORING<br />
EXISTING MONITORING WEll<br />
llEGEN[)<br />
------ STORM DRAIN e HISTORICAL SOil<br />
NO RESULT NON..;DETECT OR BELOW BORING lOCATION<br />
PRG FOR INDUSTRiAl SOilS<br />
980 SVOA CONCENfRA:rIONS IN ug/kg<br />
BEHP - bis(2-ethylhexyOphthal8te<br />
A-Chlor - 3-methyiphenOi<br />
Fig. 4.24 SVOAs detected ir:l subsurface soils at C-720 Complex.<br />
o 120<br />
I , I<br />
SCALE IN FEET
0720-026<br />
MW326C
0720-026<br />
TE<br />
0720-016<br />
720-023e<br />
NS<br />
720-017 (1)<br />
(PZ-4)<br />
720-018$<br />
,<br />
,MW326@<br />
I<br />
.. ··0<br />
r··O<br />
I<br />
l!JCRS 'BOR ING<br />
RGA BORING<br />
McNAIRY BOR ING<br />
EXlsnNG MONI,TORING WELL<br />
LEGEND<br />
STORM DRAIN<br />
NS NO SAMPLE<br />
46 VOA CONCENTRATIONS INugA.<br />
~ HISTORICAl SOIL iBORING LOCAiTlON<br />
1,1-DCE - 1,1~DiChIoroethenO<br />
c-1,2-DCE - Cis-1,2-DiChIoroethene·<br />
t-1,2-DCE - Trans-1,2-DlCtdoroethene<br />
TCE - lriChloroethen8<br />
VC - V"nyl Chloride<br />
[<br />
720-012<br />
(PZ-1l<br />
O---OF<br />
MW217@1ImI<br />
~ '0<br />
'~'.~<br />
~ z<br />
~!!<br />
NOTE: CONCENTAATIONS IN ugA.. ~<br />
o 120<br />
I<br />
SCALE IN FEET<br />
Fig. 4.26 VOAs detected inUCRSgroundwater at C-720 Complex.
720-017 $<br />
(PZ-4)<br />
720-018$<br />
o<br />
LEGEND<br />
• UCRS BOR ING<br />
o RGA BORING<br />
• McNAIRY BORING<br />
® EXISTING MONITORING WELL<br />
STORM DRAIN<br />
o SLUDGE SAMPLE<br />
6) HISTORICAL. SOIL<br />
BOR ING LOCATION<br />
720-012$<br />
(PZ-1l<br />
MW217®<br />
1,1-DCE - 1,1-DiChIoroethene Pb - Lead<br />
TCE - TriChloroethene<br />
Ni - NiCkel<br />
BEHP - bis(2-ethylhexyl)phthalate Np - Neptunium<br />
PCB - PolyChlorObiphenyl Tc - T echnitil.m<br />
Cd - Cadmium<br />
U - Uranium<br />
0'1<br />
~, d~ec~d ~<br />
ShOp pit sump sample at C-720 Complex,<br />
o 120<br />
I<br />
SCALE IN FEET
. 'Paved Area<br />
rth<br />
Grass~<br />
~<br />
Approximate<br />
Location of Parts<br />
Cleaning Ar&L:L===--,<br />
Elevation<br />
(ft amsl)<br />
375<br />
360<br />
West<br />
345<br />
East<br />
C-720 Building<br />
330<br />
- 315<br />
- 300<br />
360<br />
) ,<br />
-"<br />
d<br />
285<br />
270<br />
\<br />
\<br />
\<br />
\<br />
,<br />
:<br />
/<br />
/<br />
/<br />
;"<br />
/<br />
/.<br />
" ......<br />
...... -.<br />
--......<br />
" , ,<br />
·OO1-C181-<br />
(1413)<br />
LEGEND<br />
'UCRS BORING<br />
RGA BORING<br />
McNAIRY BORING<br />
® EXIS'IING MONITORING WELL<br />
TCE CONCENTRATION: IN ug/L<br />
o 250<br />
I<br />
I<br />
SCALE IN FEET<br />
Fig. 4.29 Maximum concentration of TCEdetected ir:l FiGA gr:oundwater above PRG at each sample location.
A<br />
NORTHWEST<br />
DEPTH<br />
BELOW<br />
GROUND<br />
stnFACE<br />
50<br />
OOH)83<br />
(613.7)<br />
I I I<br />
I I<br />
I I (<br />
I \ \<br />
\ \ \<br />
\ \<br />
OOH)84<br />
(2470.31<br />
(<br />
I<br />
I<br />
'\<br />
\<br />
-<br />
i\<br />
o<br />
L<br />
;-<br />
~.~<br />
[<br />
""'-<br />
I<br />
I<br />
I<br />
001-080<br />
(288.9)<br />
o<br />
i<br />
I<br />
°1<br />
1<br />
o<br />
00<br />
I<br />
I<br />
I~<br />
I ~ ,-~ *-, --4
•<br />
Table 4.1. Metals background values<br />
I<br />
SOIL WATER<br />
I<br />
Background Data (a}<br />
i<br />
Background Data tbl<br />
1<br />
i<br />
(m~lkg) (mg/L)<br />
i Analytical Compound<br />
I<br />
Near Surface Subsurface Groundwater<br />
: Aluminum I 13,000 12,000 22<br />
1 Antimony ! 0.21 0.21 O.H<br />
IA<br />
I. rsemc<br />
•<br />
12 7.9 0;01l<br />
Barium 200 170 0.29<br />
: Beryllium 0.67 0.69 0.0093<br />
, Cadmium 0.21 0.21 0;021<br />
'Calcium 200,000 6,100 44<br />
.Chromium<br />
,<br />
16 43 0.13<br />
1 Cobalt 14 13 0.096<br />
,<br />
Copper<br />
,<br />
,<br />
19 25 0.022<br />
I Iron<br />
28,000 28,000 5.1<br />
i<br />
'Lead 36 23 0.1<br />
Magnesium 7,700 2,'100 17<br />
Manganese 1',500 820 0.16<br />
I,<br />
Mercury 0.2 0.13 0.00038<br />
Nickel 21 22 0.062<br />
Potassium 1',300 950 6.2<br />
, Selenium 0.8 0.7 0.0093<br />
1 Silver 2.3 2.7 0.0041<br />
, Sodium 320 340 60<br />
iThallium 0.21 0.34 0.11<br />
Vanadium 38 37 0.,14<br />
; Zinc 65 60 0.027<br />
,<br />
,<br />
I<br />
•<br />
(.} Background Levels of Selected Radionuclides and Metals in Soils and Geologic Media atthe <strong>Paducah</strong> <strong>Gaseous</strong><br />
Diffusion Plant, <strong>Paducah</strong>, Kentucky (DOE,l997)<br />
(b} Baseline Risk Assessment and Technical Investigation, Report for the Northwest Dissolved Phase Plume, <strong>Paducah</strong><br />
<strong>Gaseous</strong> Diffusion Plant, <strong>Paducah</strong>, Kentucky (DOE,.1994)<br />
Page 1 on
Table 4.2. Radioactive isotopes background values<br />
~.<br />
SOIL ! WATER<br />
,<br />
Background Data (a)<br />
Background Data (bl<br />
I<br />
(pCile;)<br />
(pCiIL)<br />
Analytical Compound' Near Surface Subsurface Groundwater<br />
Americium-241 N/A leI N/A N/A<br />
Cesium-137 0.49 0.28 0<br />
Lead-210 N/A N/A N/A<br />
Neptunium.237 0.1 0 0<br />
Plutonium-238 0.073 0 0<br />
Plutonium-239 0~025 0 0<br />
Potassium-40 16 16 0<br />
Radium-226 1.5 1.5 0<br />
"<br />
, Technetium-99 2.5 2.8 0<br />
I<br />
, Thorium-228 1.6 1.6 0<br />
: Thorium-230 '1.5 1.4 1.4<br />
, Thorium-232 1.5 1.5 0<br />
Uranium-2J4 2.5 2.4 1.2<br />
Uranium-235 0.14 0.14 0.15<br />
Uranium-238 1.2<br />
I<br />
1.2<br />
,<br />
Ll<br />
,<br />
I<br />
•<br />
(0' Background Levels or Selected RadionucUdes and Metals in Soils and Geologic Media at the <strong>Paducah</strong> <strong>Gaseous</strong><br />
Diffusion Plant, <strong>Paducah</strong>, Kentucky (DOE, 1997)<br />
(b) 'Baseline Risk Assessment and Technical Investigation Report for the Northwest Dissolved Phase Plume,<strong>Paducah</strong><br />
'<strong>Gaseous</strong> ,Diffusion Plant, <strong>Paducah</strong>, Kentucky (DOE, 1994)<br />
(e)<br />
Not Available<br />
Page 1 of 1
•<br />
Table<br />
•<br />
4.3. Preliminary Remediation Goals (a)<br />
Analytical Compound Industrial Soil Soli Units<br />
Residential<br />
Groundwater<br />
Groundwater Units<br />
Metals<br />
Aluminum 4.6E+03 mglkg I.5E+OO mgIL<br />
Antimony 3;8E·OI mglkg 5.6E·04 mgIL<br />
Anenic 3~E·02 mglkg 3.5E·06 mgIL<br />
Asbestos 1.7E+D2 mglkg .- ...<br />
Barium 2.3E+02 mglkg I.OE·OI' mgIL<br />
Beryllium 3~IE·04 mglkg 1.0E·06 mgIL<br />
Analytical Compound<br />
Table 4.3. Preliminary Remediation Goals (a)<br />
,<br />
Industrial SoU<br />
SoU Units<br />
, :<br />
I Residential<br />
I<br />
Groundwater Units<br />
Groundwater<br />
Oraanic Compounds (cont.)<br />
2,4,5. Trichloropbenol : 1.l0E+06 oglkg 2.00E+Ol uWL<br />
2,4,6-Trichloropbenol : 2.80E+03 uglkg 4.00E·Ol uWL<br />
2,4-Dlcbloropbenol S.lOE+04<br />
I<br />
uglkg<br />
UOE+OO<br />
uWL<br />
2,4-DImethylpbenol 2.10E+OS uglkg 3.90E+OO uWL<br />
2,4-Dlnitropbenol 3.90E+04 ug/kg 3.00E+OO uWL<br />
l,4-Dlnitrotoluene 7.60E+Ol uglkg 7.70E·03 uWL<br />
2;6-Dlnitrotoluene 7.60E+Ol ug/kg 7.70E-03 uWL<br />
2·Butanone<br />
I<br />
2.10E+06 ugIkg 6.l0E+Ol uWL<br />
l·ChIoro-l,3·butadiene 3.00E+04' uglkg 4.60E"Ol uWL<br />
l·ChIoroethyl vinyl ether O.OOE+OO O.OOE+OO .- i<br />
1.ChIoronapbthalene 7.l0E+OS ug/kg 1.50E+Ol uWL I<br />
1.CbIorophenol 4.60E+04 uglkg 1.OOE+OO uWL I<br />
,<br />
2·Hexauone O.OOE+OO _.<br />
O.OOE+OO ...<br />
2.Methyl-4,6-dlnitrophenol O.OOE+OO . - O.OOE+OO ... I<br />
2.MethylDaphthalene O.OOE+OO<br />
- O.OOE+OO ...<br />
2.Methylphenol S.40E+OS uglkg 7.l0E+Ol oWL<br />
l·Nitrobenzenamine 4.l0E+02 ug/kg l.lOE·02 uWL<br />
2.Nitrophenol O.OOE+OO . - O.OOE+OO ...<br />
2·Propanol O.OOE+OO ... O.OOE+OO . ..<br />
3,3·DichlorobenzidlDe 7.00E+Ol ug/kg 1.10E·0l uWL<br />
3·Nitrobenzenamine O.OOE+OO ... O.OOE+OO . ..<br />
4·Bromophenyl:phenyl ether O;OOE+OO ... O.OOE+OO ...<br />
4-ChIoro-3.methylphenol O.OOE+OO ... O.OOE+OO ...<br />
;a.Chlorobenzenamine 4.40E+04 ug/kg S.60E+OO uWL<br />
4-ChIoropbenyl phenyl. ether O;OOE+OO ... O.OOE+OO . ..<br />
4.Methyl.2.pentanone 1.60E+OS ,<br />
uglkg S.10E+OO uWL<br />
4·Methylpbenol 6.90E+04 I uglkg 7.30E+OO uWL<br />
•<br />
4·Nitrobenzenamine O.OOE+OO ... O;OOE+OO ... : 4·Nitrophenol 1.30E+06 ug/kg 1.30E+Ol uWL<br />
i Acenaphtbene 4;20E+OS ug/kg 1.10E+Ol uWL<br />
I Acenaphtbylene O.OOE+OO _.<br />
O.OOE+OO ...<br />
,<br />
•<br />
Acetone S.50E+OS I uglkg 1.OOE+Ol uWL<br />
Acrolein<br />
8.70E+Ol<br />
ug/kg I 1.30E·03 oWL<br />
AcrylonitrUe I<br />
3;OOE+Ol ug/kg 3.40E·03 uWL<br />
Antbracene 4;90E+06 uglkg S;70E+Ol uWL<br />
Benz(a)anthracene 2.30E+Ol uglkg 1.30E·03 uWL<br />
Benzene 2.80E+02 uglkg 3.50E·02 uWL<br />
Benzenemethanol O.OOE+OO ... O.OOE+OO .-<br />
Benzidine ,<br />
:<br />
2.10E-Ol ug/kg i 2.30E·OS<br />
uWL<br />
Benzo(a)pyrene 2.50E+OO ug/kg 9.50E-05 uWL<br />
Benzo(b )nuoranthene l.90E+Ol ug/kg 9.30E·04 uWL<br />
Benzo(gbi)perylene O.OOE+OO ...<br />
,<br />
O.OOE+OO ...<br />
I<br />
Benzo(k)nuorantbene<br />
I 2.60E+02 ug/kg 1.70E·02 uWL<br />
Benzoic Add 7.40E+07 ug/kg 6.00E+03 uWL<br />
Bis(l-chloroethoxy )methane O.OOE+OO _.<br />
O.OOE+OO ...<br />
Bis(2-ch1oroethyl)'ether 2.30E+Ol ug/kg<br />
9.l0E·04<br />
i uWL<br />
Bis(2.etbylhexyl)phthalate 8.80E+02 ug/kg 3.10E.Ol: uWL<br />
Bromodichloromethane· 4.00E+Ol ug/kg 8.40E·Ol ugffi<br />
Bromoform 1.80E+03 ug/kg 2.l0E·Ol' ugffi<br />
Bromometbane 3.00E+03 ug/kg 2.90E·Ol ugffi<br />
Butyl benzylpbtbalate<br />
•<br />
2.70E+06 ug/kg 2.60E+02 ugIL<br />
Carbon disulfide 2.30E+OS ugikg 3.50E+Ol uWL<br />
Carbon tetrachloride 7.50E+Ol ultlk~ 1.50E·02 ur/L<br />
Page 2 of4
•<br />
Table<br />
•<br />
•<br />
Pentachlorophenol<br />
Analytical Compound<br />
4.3. Preliminary Remediation Goals (a)<br />
I<br />
IndustrialiSoU<br />
SoillUnits<br />
Residential<br />
Groundwater<br />
. Groundwater'Units<br />
Organic Compounds (cont.)<br />
Chlorobenzene<br />
I<br />
2;9OE+04 uglkg 1.30E+00 ugIL<br />
Chloroethane<br />
I<br />
1.50E+06 uglkg<br />
:<br />
3.10E+02 ugIL<br />
Chloroform 1.30&+02 ' ' ug/kg 1.50E·02 ugIL<br />
Chloromethane , 6;60E+02 uglkg 1.30E·Ol ugIL<br />
Chrysene , 1.6OE+03 ug/kg I.30E·Ol ugIL<br />
i ~ i ' I<br />
cis·l,2·Dichloroethene<br />
3;10E+04<br />
I<br />
uglkg 2.00E+00 ugIL<br />
cis.l.J.Dichioropropene 3;60&+01 ug/kg 7.20E·03 ugIL<br />
cis.l,4-Dichloro-2·butene 1.l0E+Ol ug/kg 1.30E·04<br />
I<br />
ugIL<br />
Dibenz(a,b)anthracene I 2;70E+OO uglkg 4.60E·05 I ugIL<br />
Dibenzofuran I' 4.40E+04<br />
:<br />
uglkg 1.60E+00 ugIL<br />
Dibromochloromethane 1.80E+02 uglkg 6.20E·02 !<br />
I<br />
,<br />
ugIL<br />
Dibromomethane 4;00E+04 ,<br />
I uglkg 2.ooE+00 , ugIL<br />
Dichlorodifluoromethane ' '<br />
9;ooE+04 uglkg 1.30E+Ol ugIL<br />
Diethyl phthalate 1.50E+07 I<br />
i uglkg 1.20E+03<br />
I<br />
ugIL<br />
Dimethyl phthalate 1.80E+08 uglkg 1.50E+04 ugIL<br />
! I<br />
Dimethylbenzene I 9.6OE+06 ug/kg 4.00E+02 I<br />
,<br />
ugIL<br />
Di·n·butyl phthalate ,<br />
2.10E+06 I ug/kg 1.30E+02<br />
,<br />
I ugIL<br />
I<br />
Di·n·octylphthalate<br />
3;9OE+05<br />
!<br />
uglkg 6.9OE.;01 , ugIL<br />
I<br />
O;ooE+OO<br />
O.OOE+OO<br />
Ethanol ; , ... ...<br />
Ethyl cyanide I O.ooE+OO - O.OOE+OO ...<br />
I<br />
,<br />
Ethyl methacrylate<br />
I<br />
I<br />
6.6OE+05<br />
I<br />
uglkg 1.80E+OI ugIL<br />
Ethylbenzene<br />
6.50E+05<br />
i<br />
uglkg<br />
I<br />
4.50E+Ol ugIL<br />
F1uoranthene , 2;80E+05 ,<br />
uglkg 2.30E+Ol<br />
I<br />
ugIL<br />
Fluorene 4.40E+05<br />
I<br />
uglkg 7.40E+OO<br />
I<br />
ugIL<br />
Hexachlorobenzene 1.9OE+Ol uglkg !<br />
1.9OE·OJ ugIL<br />
Hexachlorobutadiene· ,! 3:70E+02 ug/kg I<br />
I<br />
4.80E·02<br />
ugIL<br />
Hexachlorocyclopentadiene I 4;40E+03 uglkg 9.80E+00 i ugIL<br />
Hexachloroethane 2:10E+03 ug/kg<br />
: 3.30E·Ol ugIL<br />
Indeno(l,2.J-cd)pyrene<br />
,<br />
2.6OE+OI I ug/kg 6.30E·04 ugIL<br />
Iodomethane O;OOE+OO I<br />
_.<br />
O.ooE+OO ._.<br />
Isophorone 3.30E+04 uglkg 5.50E+OO ugIL<br />
m,p·Cresol 6:9OE+04 I ug/kg 7.30E+00<br />
i ugIL<br />
m,p·Xylene<br />
,<br />
1.70E+06<br />
ug/kg 4;60E+Ol ugIL<br />
Melbacrylonitrile<br />
I<br />
6.10E+02<br />
uglkg 3.60E-02 ugIL<br />
Melbyl methacrylate 2.6OE+06<br />
I<br />
uglkg 4.60E+Ol ugIL<br />
Methylene chloride 2.20E+03 uglkg 3.60E·OI ugIL<br />
Naphthalene 3.20E+04 uglkg 8.70E-02 ugIL<br />
Nitrobenzene 4;OOE+03 uglkg I.IOE-OI ugIL<br />
N~Nitroso-di~n.propylamine.<br />
i<br />
2.30E+OO<br />
uglkg 7.40E-04 ugIL<br />
N.Nitrosodiphenylamine 3.30E+03 i ug/kg 9.50E·Ol ugIL<br />
PCB·IOI6 4.20E+Ol ug/kg 5.30E·03 ugIL<br />
PCB·Illl 4.20E+Ol ug/kg 1.l0E-02 ugIL<br />
PCB·I232 4.20E+OI , ug/kg 1.30E-02 ugIL<br />
PCB·I242 4.20E+OI I<br />
ug/kg 1.20E-02 ugIL<br />
PCB· 1248 4i20E+Ol ug/kg 7.80E-03 ugIL<br />
PCB· 1254 4:20E+Ol ug/kg 8.00E-OJ ugIL<br />
PCB· 1260 :<br />
4:20E+OI uglkg 4AOE-03 ugIL<br />
PCB· 1262 O;OOE+oo ... O.OOE+OO .-.<br />
!<br />
PCB· 1268<br />
O.OOE+OO ... _..<br />
O.OOE+OO<br />
5;ooE+02 ug/kg 2.IOE·02 ugIL<br />
Phenanthrene O;OOE+OO<br />
-- O.OOE+OO _.-<br />
Phenol 1.10E+07 uglkg 9.00E+02 ugIL<br />
Polvbrominated biphenyl 6.30E+OO u£lke 5.90E·04 uWL<br />
Page 3 of4
'Fable 4.3. Preliminary Remediation Goals (a)<br />
! I<br />
, Industrial: Soil<br />
,<br />
Analytical Compound'<br />
, ,<br />
Soil'Units<br />
Residential<br />
Groundwater<br />
Groundwater I:Jnits<br />
I<br />
Ol'1!anic ComDounds(cont.)<br />
Polychlorinated bipbenyl ! 4~OE+OI ug/kg 8.00E·03 ugIL<br />
Pyrene 2.10E+OS ug/kg 1.80E+OI ugll.<br />
I<br />
Pyridine<br />
8.40E+03 ug/kg I.SOE+OO ugIL<br />
Styrene I.lOE+06<br />
,<br />
ug/kg 4.50E+OI ugIL<br />
Tetracbloroethene<br />
, 4.50E+02 ug/kg S.70E·02 ugIL<br />
,<br />
Toluene<br />
4~90E+OS uglkg 2.40E+OI ugIL<br />
Total Cresols 6.90E+04 uglkg 7;.30E+OO ugIL<br />
I<br />
trans·l,2·Dichloroethene S.30E+04 uglkg 4~OOE+OO ugIL<br />
•<br />
, trans.I,3-Dichloropropene 3.60E+OI uglkg 7.l0E·03 ugIL<br />
I<br />
trans·l,4-Dicbloro-2·bulene<br />
l.lOE+OI ug/kg 1.30E·04 ugIL<br />
Trichloroetbene<br />
3.10E+02 uglkg 1.40E·OI ugll.<br />
TrichloroDuoromethane i<br />
, 2.80E+OS uglkg 4~OE+OI ugll.<br />
I<br />
i Vinyl Acetate<br />
4.10E+OS uglkg 1.30E+OI ugll.<br />
I<br />
i Vinyl Chloride<br />
7.30E+OO uglkg 1.70E·03 ugIL<br />
,<br />
Radioactinisotopes<br />
Alpha activity O.OOE+OO ...<br />
,<br />
O.OOE+OO -<br />
Americium·241 8.IE+OO pCi/g l.2E·Ol pCiIL<br />
Beta activity O.OOE+OO .- O.OOE+OO ...<br />
Cesium·137 1.0E+02 pCi/g 1.2E+OO pCiIL<br />
Cobalt·60 2.lE·02 pCi/g 2.0E+OO pCiIL<br />
Neptunium·237 7.9E+OO pCi/g 1.3E-0l pCiIL<br />
Plutonium·2391240 1.OE+Ol pCi/g l.2E·0l I pCiIL<br />
I<br />
Radon·222 O.OOE+OO _.<br />
O.OOE+OO I<br />
.-<br />
Technetium·99 2.3E+03 pCi/g 2.8E+OI I pCiIL<br />
Thorium·230 8.3E+OI pCi/g l.OE+OO<br />
!<br />
pCiIL<br />
Uranium·2J4 7. l'E+O I pCi/g 8;7E·OI pCiIL<br />
Uranium-23S 8.2E-OI pCi/g i 8.5E-OI pCiIL<br />
Uranium-238 7.4E+OI pCi/g I 9;OE-0l I pCiIL<br />
,<br />
i<br />
•<br />
(a) Modified from Methods for Conducting Human, Health Risk Assessments and Risk Evaluations at the <strong>Paducah</strong><br />
<strong>Gaseous</strong> Diffusion Plant. DOElORl07·IS06&DI. August (DOE ,1996d)<br />
•<br />
Page 4 of4
• • •<br />
Table 4.4. \lOA compounds detected in VCRS soil at SWMU 001<br />
... . ..<br />
Salllple<br />
Analytical Interval (ft bgs) Results Lab Validation Data<br />
Sample Type** Group Sample ID Top /Bottom Analytical Compound (ug/kg) Qualifier Qualifier Assessment<br />
... ---- ._--<br />
Trench VOA OOliOISAOOI 0 0 Trichloroethene 510.000* JE ?<br />
0 0 Vinyl chloride 67.000* JX ?<br />
OOllOtSDOOt 0 0 Trichloroethene 1,200.000* JE ?<br />
0 0 Vinyl chloride 270.000* JE ?<br />
001 102SAOO I 0 0 Trichloroethene 11.000 ?<br />
001103SAOOt 0 0 Trichloroethene 15.000 JX ?<br />
Subsurface Soil 001U25AOIO 7 10 Trichloroethen.e 6.000 J ? BL-T J<br />
001l16SAOIO 7 10 Trichloroethene 100.000 J ?<br />
001l17SAOIO 7 10 Vinyl chloride 500.000* J ?<br />
00II52SA005 5 5 cis-I,2~Dichloroethene 1,200.000 J ? BL-T J<br />
5 5 trans-I,2-Dichloroethene 500.000 ?<br />
5 5 Trichloroethene 55.000 J ? BL-T J<br />
001l52SAOIO 7 10 cis-t,2-Dichloroethene 1,700.000 J ? BL-T J<br />
7 10 trans-I,2-Dichloroethene 800.000 ?<br />
7 10 Trichloroethene 170.000 J ? BL-T J<br />
001 153SA005 5 5 cis.I,2-Dichloroethene 2,400.000 J ? BL-T J<br />
---- -- -- --<br />
* Result exceeds PRG screening values Page I of9<br />
** Trench samples were taken at base of excavated trench approximately 3.5 ft bgs.<br />
Exposed trenches were backfilled after sampling.
Table 4.4. VOA compounds detected in VCRS soil at SWMU 001<br />
_ .. -- - --<br />
-- --<br />
Sample<br />
Analytical Interval (ft bRS) Results Lab Validation Data<br />
Sample Type** Group Sample ID Top IBottom Analytical Compound (uglkg) Qualifier Qualifier Assessment<br />
- -_.<br />
Subsurface Soil VOA 001153SA005 5 5 trans· 1 ,2. Dichloroethene 1,200.000 ?<br />
5 5 Trichloroethene 480.000* ? BL·T J<br />
5 5 Vinyl chloride 900.000* ?<br />
OOtt53SAOI0 7 10 cis~ 1 ,2· Dichloroethene 6,000.000 ? BL·T J<br />
7 10 trans· 1 ,2· Dichloroethene 4,300.000 ?<br />
7 10 Trichloroethene 2,100.000* ? BL·T J<br />
7 10 Vinyl chloride 4,800.000* J ? BL·T J<br />
001154SA005 5 5 Trichloroethene 60.000 J ? BL·T J<br />
5 5 Vinyl chloride 200.000* J ?<br />
001l54SAOI0 7 10 Trichloroethene 26.000 J ? 1,11,..1' J<br />
001l55SAOI0 7 10 cis· 1 ,2. Dichloroethene 550.000 J ? BL·T J<br />
7 10 trans·) ,2· Dichloroethene 100.000 J ?<br />
7 )0 Trichloroethene 460.000* ? BL·T J<br />
0011 56SA005 5 5 trans· I ,2· Dichloroethene 1,200.000 J ?<br />
5 5 Trichloroethene ~I,OOO.OOO * ?<br />
00tt56SAOIO 7 10 trans·1 ,2· Dichloroethene 6,500.000 ?<br />
* Result exceedsPRG Screening values Page 2 of9<br />
** Trench samples were taken at base of excavated trench approximately 3.5 ft bgs.<br />
Ji:xposed trenches were backfilled after s.ampling •<br />
• • •
• • •<br />
Table 4.4. VOA compounds detected in VCRS soil at SWMU 001<br />
---- . -<br />
.-<br />
Sample<br />
Analytical Interval (ft bg_s) Results Lab Validation Data<br />
Sample Type** Group Sample ID Top !Bottom Analytical Compound (ug/kg) Qualifier Qualifier Assessment<br />
. ----<br />
Subsurface Soil VOA 001156SAOI0 7 10 Trichloroethene 48,000.000 * ?<br />
001 157SA005 5 5 trans-l ,2-Dichloroethene 1,000.000 ?<br />
5 5 Trichloroethene 12,000.000 * ?<br />
001157SAOI0 6 10 trans-l ,2-Dichloroethene 13,000.000 ?<br />
6 10 Trichloroethene 79,000.000 * ?<br />
001157SDOI0 6 10 trans-} ,2-Dichloroethene 16,000.000 ?<br />
6 10 Trichloroethene 87,000.000* ?<br />
001158SA005 5 5 trans-l ,2-Dichloroethene 800.000 ?<br />
5 5 Trichloroethene 2,200.000* ?<br />
5 5 Vinyl chloride 400.000* J ?<br />
001158SAOIO 7 .0 trans-l,2-pjchloroethene 4,400.000 ?<br />
7 10 Trichloroethene 10,000.000 * ?<br />
001l59SAOI0 '7 10 trans-l ,2-Dichloroethene 1,100.000 ?<br />
7 10 Trichloroethene 100.000 J ?<br />
001160SA005 5 5 Trichloroethene 100.000 J ?<br />
001160SAOIO 7 10 trans-l,2-Dichloroetheile 100.000 J ?<br />
* Result exceeds PRG screening values Page 3 of9<br />
** Trench samples were taken at base of excavated trench approximately 3.5 fa bgs.<br />
Exposed trenches were backfilled after sampling.
Table 4.4. VOA compounds detected in VCRS soil at SWMV 001<br />
Sample<br />
Analytical Interval (ft bgs) Results Lab Validation Data<br />
Sample Type** Group Sample ID Top IBottom Analytical Compound (ug/kg) Qualifier Qualifier Assessment<br />
- -<br />
Subsurface Soil VOA 001160SAOI0 7 10 Trichloroethene 200.000 J ?<br />
001 161SA005 5 5 Trichloroethene 100.000 J ?<br />
001161SAOI0 7 10 Trichloroethene 200.000 J ?<br />
001165SA015 15 15 trans-I ,2-Dichloroethene 1,200.000 J ?<br />
15 15 Trichloroethene 439,000.000 * ?<br />
001 I 65SA020 19.75 20 I,I-Dichloroethane 4,300.000 ? BL-T J<br />
19.75 20 trans-I ,~-Dichloroethene 360.000 J ? BL-T J<br />
19.75 20 Trichloroethene 1,900.000* ? BL-T J<br />
001 165SA025 25 25 trans-l,2-Dichloroethene 300.000 J ?<br />
25 25 Trichloroethene 50,000.000 * ?<br />
001165SA030 30 30 trans-I ,2-Dichloroethene 300.000 J ?<br />
30 30 Trichloroethene 85,000.000 * ?<br />
001165SA035 35 35 trans-l ,2-Dichloroethene 600.000 J ?<br />
35 35 Trichloroethene 74,000.000 * ?<br />
00116SSA040 40 40 traIlS-I ,2-Dichloroethene 300.000 J ?<br />
40 40 Trichloroethene 45,000.000 * ?<br />
- - -<br />
* Result exceeds PRG screening values Page 4 of9<br />
** Trench samples were taken at base of excavated trench apprOximately 3.5 ft bgs.<br />
Exposed trenches were backfilled after sainpling •<br />
• • •
• • •<br />
Table 4.4. VOA compounds detected in VCRS soil at SWMU 001<br />
~- -~ ~ ._--<br />
----- --<br />
Sample<br />
Analytical Interval (ft b~s) Results Lab Validation Data<br />
Sample Type** Group Sample ID Top IBottom Analytical Compound (ug/kg) Qualifier Qualifier Assessment<br />
Subsurface Soil VOi\ 001165SA045 45 45 trans-I ,2-Dichloroethene 300.000 J ?<br />
45 45 Trichloroethene 66,000.000 * ?<br />
001 165SA050 50 50 Trichloroethene . 25,000.000 * ?<br />
001166SA005 5 5 Trichloroethene 5,000.000* ?<br />
001166SAOI0 10 10 trans-l ,2-Dichloroethene 100.000 J ?<br />
10 10 Trichloroethene 12,000.000 * ?<br />
001166SAOl5 15 15 Trichloroetheile 14,000.000 * ?<br />
001166SA020 20 20 trans-l ,2-DiChloroethel1e 800.000 J ?<br />
20 ZO Trichl4)roethel1e 2Z,000.000 * ?<br />
001166SA025 25 25 trans-l ,2-Dichloroethene 400.000 J ?<br />
25 25 Trichloroethene 23,000.000 * ?<br />
001166SA030 30 30 1,I-Dichloroethane 2,800.000 ? BL-T J<br />
30 30 Trichloroethene 18,000.000 * ?<br />
001166SA035 35 35 Trichloroethene 11,000.000 * ?<br />
001166SA040 40 40 Trichlotoethene<br />
- - - -<br />
300.000 J ?<br />
001168SAOI0 10 10 1,I-Dichloroethane 500.000 ? BL·T j<br />
* Result exceeds PRG screening values Page 5 of9<br />
** Trench samples were taken at base of excavated trench approximately 3.5 ft bgs.<br />
Exposed trenches were backfilled after sampling.
Table 4.4. VOA compounds detected in VCRS Soil at SWMV 001<br />
Sample<br />
Analytical Interval (ft b2S) Results Lab Validation Data<br />
Sample Type** Group Sample ID Top I Bottom Analytical Compound (ug/kg) Qualifier Qualifier Assessment<br />
Subsurface Soil VOA 001168SAOIO 10 10 Trichloroethene 170.000 J ? BI,.-T J<br />
001168SAOl5 15 15 Trichloroethene 40.000 J ?<br />
001168SA020 20 20 Trichloroethene 800.000* ?<br />
001168SA025 24 29 trans-) ,2-Dichloroethene 400.000 J ?<br />
24 29 Trichloroethene 26,000.000 * ?<br />
001168SA030 30 30 Trichloroethene 5,500.000* ?<br />
001 I 68SA035 35 35 Trichloroethene 2,700.000* ?<br />
001168SA040 40 40 Trichloroetbene 5,000.000* ?<br />
001 I 68SA045 45 45 Trichloroethene 4,200.000* ?<br />
001 I 68SA050 50 50 Trichloroethene 4,300.000* ?<br />
001168SD025 25 25 I,I-Dichloroethane 310.000 J ? BL-T J<br />
25 25 trans-I,2-Dichloroethene 1,100.000 J ? BL-T J<br />
25 25 Trichloroethene 26,000.000 * ? BL-TJ<br />
001169SA020 20 20 I,I-Dichloroethalle 120.000 J ? BL-T J<br />
20 20 Trichloroethene 42.000 J ? BL-T J<br />
001 I 69SA025 25 25 Trichloroethene 100.000 J ?<br />
--.<br />
* Result exceeds PRG screening values Page 60f9<br />
** Trench samples were taken at base of excavated trench approximately 3.5 ft bgs.<br />
Exposed trenches were backfilled after sampling.<br />
• • •
• • •<br />
Table 4.4. VOA compounds detected in VCRS soil at SWMU 001<br />
.-- -<br />
Sample<br />
Analytical Interval (ft b~s) Results Lab Validation Data<br />
Sample Type** Group Sample ID Top /Bottom Analytical Compound (u~g) Qualifier Qualifier Assessment<br />
--<br />
Subsurface Soil VOA OOl169SA030 30 30 trans-I ,2-Dichloroethene 30.000 J ?<br />
30 30 Trichloroethene 800.000* ?<br />
001169SA035 35 35 Trichloroethene 700.000* J ?<br />
001 169SA040 40 40 trans-l,2-Dichloroethene 800.000 J ?<br />
40 40 Trichloroethene 12,000.000 * ?<br />
001 169SA04S 4S 4S trans-l ,2-Dichloroethene 1,400.000 ?<br />
45 45 Trichloroethene 18,000.000 * ?<br />
001169SA050 50 50 trans-I ,2-Dichloroethene 800.000 J ?<br />
50 50 Trichloroethene 9,400.000* ?<br />
001 169SD035 35 35 1,I-Dichloroethane 1,000.000 ? BL-T J<br />
35 35 trans-l ,2-Dichloroethene 290.000 J ? BL-T J<br />
35 35 Trichloroethene 1,200.000* ? BL-T J<br />
001172SA015 15 IS trans-l ,2-Dichloroethene 1,500.000 ?<br />
15 15 Trichloroethene 900.000* J ?<br />
001l72SA020 20 20 trans-l ,2-Dichloroethene 20.000 J ?<br />
001l72SA025 25 25 trans-l,2-Dichloroethene 1,500.000 ?<br />
* Result exceeds PRG screening values Page 7 of9<br />
** Trench samples were taken at base of excavated trench approximately 3.5 ft bgs.<br />
Exposed trenches were backfilled after sampling.
Table 4.4. VOA compounds detected in UCRS soil at SWMU 001<br />
Sample<br />
Analytical Interval (ft bes) Results Lab Validation Oata<br />
Sample Type** Group Sample 10 Top IBoutim Analytical Compound (ug/kg) Qualifier Qualifier Assessment<br />
Subsurface Soil VOA 001172SA025 25 25 Trichloroethene 7,000.000* ?<br />
001172SA030 31 31 I,I-Oichloroethane 1,000.000 ? J<br />
31 31 Trichloroethene 1,700.000* ? J<br />
001 172SA050 50 50 trans-l,2-0ichloroethene 600.000 J ?<br />
50 50 Trichloroethene 400.000* J ?<br />
001l73SAOIO 10 10.25 Acetone 3.000 J ?<br />
001173SA020 20 20 I,I-Dichloroetbane 90.000 J ? J<br />
20 20 Acetone 7.000 J ?<br />
20 20 Trichloroethene 13.000 J ? J<br />
001173SA045 45 45.25 1,2-Dichloroethene 2.000 J ?<br />
45 45.25 Acetone 8.000 J ?<br />
45 45.25 cis-I ,2-Dichloroethene 2.000 J ?<br />
45 45.25 Trichloroethene 8.000 J ?<br />
001173S0020 20.25 20.5 1,1-Oichloroethane 600.000 ? J<br />
20.25 20.5 Acetone 5.000 J ?<br />
20.25 20.5 Trichloroethene 15.000 J ? J<br />
* Result exceeds PRG screening values Page 80f9<br />
** Trench samples were taken at base of excavated trench approximately 3.5 ft bgs.<br />
Exposed trenches were backfilled after sampling.<br />
• • •
• • •<br />
Table 4.4. VOA compounds detected in VCRS soil at SWMV 001<br />
-<br />
Sample<br />
Analytical<br />
Interval (ft bgs) Results Lab Validation Data<br />
Sample Type** Group Sample ID Top IBottom Analytical Compound (ug/kg) Qualifier Qualifier Assessment<br />
Subsurface Soil VOA 001l74SA030<br />
30<br />
30 1,1.))ichloroethane<br />
230.000<br />
J<br />
?<br />
BL·T J<br />
30<br />
30 Trichloroethene<br />
200.000<br />
J<br />
?<br />
BL·T J<br />
00 II 79SA020<br />
20<br />
20 Trichloroethene<br />
9.0f)0<br />
J<br />
?<br />
BI.,·T J<br />
Note: Trench samples noh'ontaining any detectable VOA compounds at SWMU 001 are:<br />
001104SAOOI<br />
Subsurface soil sampleli not containing any detectable VOA compounds at SWMU 001 are:<br />
001101SA002 00tl01SAOOS 001l01SAOI0 001l02SA005 00tlO2SAOI0 OOll03SAOOS OOtl03SAOI0 001l04SA005 001l04SAOIO<br />
OOllOSSAOOS 001l05SAOI0 001106SA005 OOtl06SAOI0 001l07SA005 001107SAOIO OOl108SA005 OOtl08SAOI0 001109SA005<br />
001109SAOI0 00tll0SA005 OOl110SAOI0 001111SA005 00tlllSAOI0 001l12SA005 001113SAOOS 001113SAOI0 001114SA005<br />
0011145A010 OOll1SSAOOS OOll1SSAOIO 001116SAOOS 001117SAOOS 001118SAOOS 001118SAOI0 001l19SAOOS 001l19SAOIO<br />
001120SAOOS 001120SAOI0 001121SAOOS 001121SAOI0 001122SAOOS 001122SAOIO 001123SAOOS 001123SAOIO 001123S0010<br />
001124SA005 001l24SAOI0 001l25SAOOS 00112SSAOI0 001126SAOOS 001126SAOIO 001127SAOOS 0011275AOIO 001128SA005<br />
001l28SAOI0 00 II 29SA005 001l29SAOI0 OOIl30SAOOS 001130SAOI0 001l31SAOOS 001131SAOI0 0011328AOOS 00tl32SAOIO<br />
001133SAOOS 001133SAOI0 OOl134SA005 001134SAOI0 001l35SAOOS OO113SSAOIO 001136SAOOS OOl136SAOI0 001137SA005<br />
001l37SAOIO 001l38SAOOS 001l38SAOIO 001l39SAOOS 001139SAOIO 001l40SAOOS 001140SAOI0 OOll41SAOOS 001l41SAOIO<br />
001142SAOOS 001142SAOI0 001143SAOOS 001l43SAOIO 001l43SDOIO OOll44SAOOS 00l144SAOIO 001162SAOOS 001l62SAOI0<br />
001l66SA04S 001l~SA050 001168SA005 001169SAOl5 OOIl71SA005 OOll71SAOIO 001171SAOl5 001l71SA020 001171SA025<br />
001l71SA030 001l715A035 001171SA040 001l71SA045 oolf11SA050 00117 ISD035 001l72SA035 001172SA040 001l72SA045<br />
OO1l73SA005 001173SA015 00 II 73SA025 001173SA030 001l73SA035 001l73SA040 OO1l73SA050 001l74SA015 001l74SA020<br />
001174SA025 001174SA035 001174SA040 001174SA045 001174SA050 001179SAOl5 OOl179SA025 001179SA030 001179SA035<br />
00 II 79SA040 00 II 79SA045 001l79SA050<br />
* Result exceeds PRG screening values Page 9 of9<br />
** Trench samples were taken at base of excavated trench approximately 3.5 ft bgs.<br />
Exposed trenches were backfilled after sampling.
Table 4.5. SVOA and PCB compounds detected in VCRS soil at SWMV 001<br />
Sample<br />
Analytical Interval (rt bgs) Results Lab Validation Oata<br />
Sample Type** Group Sample ID Top /Bottom Anal)'tic~1 Compound (ug/kg) Qualifier Qualifier Assessment<br />
--- --<br />
Trench SVOA OOIIOISAOOI 0 0 2,4-0imethylphenol 15,000.000 X ?<br />
0 0 Oi-n-butyl phthalate 9,000.000<br />
0 0 m,p-Cresol 8,600.000 X ?<br />
0 0 Phenol 23,000.000 X ?<br />
0 0 Total Cresols 8,600.000 JX ?<br />
00110150001 0 0 Phenol 2,900.000 ?<br />
PPCB OOllOISAOOl 0 0 PCB-I242 500.000* 0 ?<br />
0 0 PCB-t260 11,000.000 * D ?<br />
0 0 PCB-1268 5,600.000* 0 ?<br />
0 0 Polychlorinated biphenyl 17,100.000* 0 ?<br />
OOltOISOOOI 0 0 PCB-I242 500.000* 0 ?<br />
0 0 PCB-1268 4,200.000* D ?<br />
0 0 Polychlorinated biphenyl 4,700.000* 0 ?<br />
Subsurface Soil SVOA OOlt 14SAOtO 7 10 Bis(2-ethylhexyl)phthalate 64.000 J<br />
OOlt 18SAOI0 7 10 Bis(Z-ethylhexyl)phthalate 100.000 J =<br />
7 10 Oi-n-iJutyl phthalate 50.000 J =<br />
"<br />
?<br />
* Result exceed~ PRG screening values Page t of5<br />
** Trench samples were taken at base of excavated trench approximately 3.5 ft bgs.<br />
Exposed trenches were backfilled after sampling •<br />
• • •
• • •<br />
Table 4.5. SVOA and PCB compounds detected in VCRS soil at SWMU 001<br />
Sample<br />
Analytical Interval (ft b2S) Results Lab Validation Data<br />
Sainple Type** Group Sample ID Top /Bottom Analytical Compound ...(ug!kg) Qualifier Qualifier Assessment<br />
Subsurface Soil SVOA 001 I 19SAOIO 7 10 Bis(2-ethylhexyl)phthalate 100.000 J =<br />
7 10 Butyl benzyl phthalate 200.000 J =<br />
001 122SAOI0 7 10 Bis(2-ethylhexyl)phthalate 51.000 J U<br />
001131SAOIO 7 10 Bis(2-ethylhexyl)phthalate 80.000 J<br />
001l52SAOIO 7 10 Total Cresols 4,400.000 J ?<br />
001 16SSA020 20 22.5 Bis(2-ethylhexyl)phthalate 39.000 J ?<br />
001165SA045 44 47 Diethyl phthalate 60.000 J ?<br />
001l71SAOIS 15 18 Bis(2-ethylhexyl)phthalate 40.000 J ?<br />
001l71SA020 20 23 Bis(2-ethylhexyl)phthalate 50.000 J ?<br />
001 171SA035 35 40 Bis(2-ethylhexyl)phthalate 50.000 J ?<br />
001171SA040 40 43 Bis(2-ethylhexyl)phthalate 40.000 J ?<br />
001 171SD035 35 40 Bis(2-ethylhexyl)phthalate 40.000 J ?<br />
001172SA015 15 18 Bis(2-ethylhexyl)phthalate 80.000 J ?<br />
15 18 Di-n-butyl phthalate 50.000 J ?<br />
001172SA020 20 23 Bis(2-ethylhexyl)phthalate 46.000 J ?<br />
001l72SA02S 25 28 pis(2-ethylhexyl)phthalate 47.000 J ?<br />
* Result exceeds PRG screening values Page 20fS<br />
** Trench samples were taken at base of excavated trench approximately 3.5 ft bgs.<br />
Exposed trenches were backfilled after sampling.
Table 4.5. SVOA and PCB compounds detected in VCRS soil at SWMV 001<br />
- . - _._-<br />
Sample<br />
Analytical Interval (ft b~t Results Lab Validation Data<br />
Sample Type** GrouP. _ . ~ample ID Top I Bottom Analytical Compound (uglkg) Qualifier Qualifier Assessment<br />
-<br />
Subsurface Soil SVOA 001172SA050 48 50 2,4.Dimethylphenol 40.000 J ?<br />
48 50 4.Methylphenol 480.000 ?<br />
48 50 Phenol 1,900.000 ?<br />
001 1 79SA030 30 33 Bis(2-ethylhexyl)phthalate 61.000 J ?<br />
001179SA035 35 38 Bis(2-ethylhexyl)phthalate 35.000 J ?<br />
001 1 79SA045 45 48 Bis(2.ethylhexyl)phthalate 35.000 J ?<br />
* Result exceeds PRG screening values Page 30f5<br />
** Trench samples were taken at base of excavated trench approximately 3.5 ft bgs.<br />
Exposed trenches were backfilled after sampling .<br />
• • •
• •<br />
Table 4.5. SVOA and PCB compounds detected in VCRS soil at SWMV 001<br />
•<br />
--"-<br />
Sample<br />
Analytical Interval (ft b~s) Results Lab<br />
Sample Type** Group Sample ID 'fop I Bottom Analytical Compound (ug/kg) Qualifier<br />
Validation<br />
Qualifier<br />
Oata<br />
Assessment<br />
Note: Trench samples not containin~ any detectable SVOA compounds at SWMU 001 are:<br />
OOl102SAOOl 001103SAOOl OOll04SAOOl<br />
Trench samples not containin~ any detectable PPCB compounds at SWMU 001 are:<br />
001102SAOOl 001103SAOOl 001104SAOOl<br />
Sediment samples not coiltainiil~ any detectable SVOA compounds at SWMU 001 are:<br />
001l45SAOOl 001l46SAOOl 001l41SAOOl 001l48SAOOI 001l49SAOOl 001l50SAOOl<br />
001 170SAOOI<br />
Sediment samples not containin~ any detectable PPCB compounds at SWMU 001 are:<br />
OOl145SAOOI OOl146SAOOl 001147SAOOI 001148SAOOI 001149SAOOI OOl150SAOOI<br />
001 170SAOOI<br />
Subsurface soil samples not containin~ any detectable SVOA compounds at SWMU DOl are:<br />
OOIIOISAOIO OOlI02SAOIO 001103SAOI0 001104SAOIO 00lJ05SAOIO OOl106SAOlO<br />
OOlllOSAOIO OOll1lSAOlO 001112SAOIO 0011 J3SAOlO 001115SAOlO OOlll6SAOlO<br />
001 123SAOlO 001123S00l0 OOll24SAOlO 001125SAOlO 001126SAOlO 001 127SAOlO<br />
001132SAOIO 001133SAOIO OOll34SAOIO 001135SAOIO 001136SAOIO 001137SI\010<br />
00114lSAOlO 001142SAOIO 001143SAOlO 001l43S00l0 OOll44SAOlO 001153SAOlO<br />
001l57SAOlO 001157S00l0 001158SAO 10 001l59SAOlO 001160SAOlO 00116lSAOlO<br />
001165SA030 OOl165SA035 OOl165SA040 001 165SA050 OOll66SAOlO 001166SA015<br />
001 166SA035 001166SA040 oot 166SA045 001l66SA050 001168SAOlO 001168SA015<br />
001168SA035 001168SA040 001168SA045 001 I 68SA050 001 168S0025 OOll69SA015<br />
001169SA035 001169SA040 001169SA045 001l69SA050 001169S0035 001l71SAOlO<br />
00117lSA050 0011 725A030 001l72SA035 001172SA040 001l72SA045 001l73SAOlO<br />
001173SA030 001173SA035 001 173SA040 001 173SA045 001l73SA050 001173Soo20<br />
001 174SA030 001174SA 035 001174SA040 001 174SA045 001174SA050 001179SA015<br />
001l79SA050<br />
00lJ07SAOIO<br />
001117SAO 10<br />
001128SAOlO<br />
001138SAOIO<br />
()()1154SAOI0<br />
001l62SAOlO<br />
001166SA020<br />
001168SA020<br />
001169SA020<br />
00117lSA025<br />
001173SA015<br />
001174SA015<br />
001179SA020<br />
001108SAOIO<br />
001120SAOIO<br />
001129SAOI0<br />
001l39SAOI0<br />
001.155SAOlO<br />
001165SA015<br />
001166SA025<br />
001168SA025<br />
001 169SA025<br />
001171SA030<br />
001 173SA020<br />
00H74SA020<br />
OOl179SA025<br />
DOl J09SAOJO<br />
001121SAOIO<br />
001130SAOIO<br />
001140SAOIO<br />
00ll56SAOlO<br />
001l65SA025<br />
001l66SA030<br />
001168SA030<br />
001 I 69SA030<br />
OO117lSA045<br />
001l73SA025<br />
OOl174SA025<br />
00 1179SA040<br />
*<br />
**<br />
Result exceeds PRG screening values<br />
Trench samples were taken at base of excavated trench approximately 3.5 ft bgs.<br />
Exposed trenches were backfilled after sampling.<br />
Page 4 of5
Table 4.5. SVOA and PCB compounds detected in UCRS soil at SWMU 001<br />
~ ~ -<br />
Sample<br />
Analytical Interval (ft bgs) Results Lab Validation Data<br />
Sample Type** Group Sample ID ~ Top IBottom Analytical Compound (uglkg) Qualifier Qualifier Assessment<br />
Subsurface soil samples not containing any detectable PPCB compounds at SWMU 001 are:<br />
OOllOlSAOIO OOl102SAOIO 001l03SAOIO OOll04SAOIO 001105SAOIO OOll06SAOIO .001107SAOIO 001l08SAOIO 001109SAOIO<br />
001110SAOI0 OOllllSAOIO 001112SAOIO 001 113SAOIO 001114SAOIO 001115SAOIO 001116SAOI0 001117SAOIO· 001118S,..\010<br />
001119SAOIO 001120SAOIO 001121SAOIO 001122SAOIO OOll23SAOIO 001123SOO10 001124SAOIO 001125SAOIO 001 126SA010<br />
001127SAOlO 001128SAOIO 001129SAOIO 001130SAOIO 001131SAOIO 001132SAOIO 001133SAOIO 001134SAOIO OOl135SAOIO<br />
OOI136SAOI0 001 137SAOIO OOll38SAOIO 001139SAOIO 001l40SAOIO 001l41SAOI0 001l42SAOIO OOl143SAOIO 001143SDOIO<br />
OOll44SAOIO 001152SAOIO 001153SAOIO 001154SA010 001l55SA010 001156SAOJO 001157SAOIO 001157SDOIO 001158SA010<br />
001159SAOIO 001160SAOIO 001161SAOI0 001162SAOIO 001l65SA015 001165SA020 001l65SA025 001165SA030 001165SA035<br />
001 165SA040 001165SA04S 001 165SA050 OOll66SAOIO OOll66SAOlS 001 166SA020 OOll66SA025 001166SA030 001166SA03S<br />
001166SA040 001 166SA 045 001166SAOSO OOll68SAOIO OOl168SAOIS OOl168SA020 OO1168SA025 001168SA030 001168SA035<br />
001 168SA040 001 168SA045 001 168SA050 001168SD025 OO1169SA015 001169SA020 001169SA025 001 169SA030 001 169SA035<br />
001169SA040 001169SA045 001 169SA050 001l69SD035 001171SAOIO 001171SA015 001l71SA020 OO1l71SA025 001171SA030<br />
001171SA035 001l71SA040 001171SA045 001171SA050 001171SD03S 001172SA01S 001172SA020 00117ZSA025 OOll72SA030<br />
001172SA035 001172SA040 001172SA045 OO1l72SA050 001l73SAOIO 001173SA01S 001173SA020 001173SA02S 001173SA030<br />
001173SA035 001173SA040 001 173SA045 001 173SA050 001173SD020 001 174SAO 15 001174SA020 001174SA025 OO1l74SA030<br />
001174SA035 001174SA040 001174SA045 001174SA050<br />
* Result exceeds PRG screening values Page 5 of5<br />
** Trench samples were taken at base of excavated trench approximately 3.5 ft bgs.<br />
Exposed trenches were backfilled after sampling .<br />
• • •
• • •<br />
Table 4.6. Metals detected above BG in VCRS soil at SWMl1 001<br />
- --- - --<br />
Sample<br />
Analytical IntervaUft b~s) Results Lab Validation Data BG<br />
Sample Type** .. Group Samp_l~ ID Top /Bottom Analytical Compound (mg/kg) Qualifier Qualifier Assessment (mg/kg)<br />
---<br />
Trench METAL 001l01SAOOl 0 0 Mercury 0.310 ? 0.200<br />
001101SDOOI 0 0 Mercury 0.260 ? 0.200<br />
0 0 Nickel 116.000 W ? 21.000<br />
001104SAOOI 0 0 Chromiurn 17.100 ? 16.000<br />
Sediment 001147SAOOI 0 1 Nickel 23.400 ? 21.000<br />
001148SAOOI 0 1 Chromium 16.800 ? 16.000<br />
001l49SAOOI 0 1 Zinc 67.000 ? 65.000<br />
001170SAOOl 1 1.75 Barium 24tOOO* ? 200.000<br />
1 1.75 Beryllium 0.800* ? 0.670<br />
I 1.75 Cobalt 15.400 ? 14.000<br />
I 1.75 Manganese 1,990.000* ? 1,500.000<br />
1 1.75 Thallium 1.560* ? 0.210<br />
Subsurface Soil OOIIOISAOIO 6 10 Antimony 0.910* B == 0.210<br />
6 10 Sodium 364.000* = 340.000<br />
001102SAOI0 6 10 Antimony 0.780* B - 0.210<br />
6 10 Sodium 492.000* = 340.000<br />
* Result exceeds PRG screening values Page I of 16<br />
** Trench samples were taken at base of excavated trench approximately 3.5 ft bgs.<br />
Exposed trenches were backfilled after sampling.
--<br />
-<br />
Table 4.6. Metals detected above BG in UCRS soil at SWMU 001<br />
Sample<br />
Analytical Interval (ft bgs) Results Lab Validation Data BG<br />
Sample Type** Group Sample ID Top /Oottom Analytical Compound (mglkg) Qualifier Qualifier Assessment (mglkg)<br />
_. -_ .. _-<br />
Subsurface Soil METAL 001103SAOI0 6 10 Cadmium 1.650 = 0.210<br />
6 10 Sodium 480.000* B = 340.000<br />
001104SAOI0 7 10 Cadmium 2.190 = 0.210<br />
7 10 Sodium 556.000* = 340.000<br />
001105SAOI0 7 10 Cadmium 2.320* = 0.210<br />
7 10 Sodium 476.000* B = 340.000<br />
001106SAOI0 7 10 Cadmium 2.480* = 0.210<br />
7 10 Sodium 434.000* B = 340.000<br />
001l07SAOI0<br />
.,<br />
10 Cadm,itim 2.820* = 0.210<br />
001108SAOI0 7 10 Barililn 181.000 J 17().000<br />
7 10 Cadmium 2.830* = O.~IO<br />
7 10 Nickel 26.200 = 22.000<br />
7 10 Sodium 405.000* B = 340.000<br />
001109SAOI0 7 10 Antimony 1.320* = 0.210<br />
7 10 Magnesium 2,190.000* = 2,100.000<br />
7 10 Sodium 418.000* 340.000<br />
* Result exceeds PRGscreening values Page 2 of 16<br />
** Trench samples were taken at base of excavated trench approximately 3.5 ft bgs.<br />
Exposed trenches were backfilled after sampling .<br />
• • •
• • •<br />
Table 4.6. Metals detected above BG in VCRS soil at SWMU 001<br />
Sample<br />
I\nalytical Interval (ft bp) Results Lab Validation Data BG<br />
Sample Type** Group Sample ID Top IBottom Analytical Compound (mg/kg) Qualifier Qualifier Assessment (mg/kg)<br />
Subsurface Soil METAL 001110SAOI0<br />
- - - -<br />
7 10 Antimony 1.400* = 0.210<br />
7 10 Ma~lIesiuin 2,160.000* = ~,100.000<br />
7 10 Nicl
Table 4.6. Metals detected above BG in VCRS soil at SWMV 001<br />
~ ~<br />
Sample<br />
Analytical Interval (ft b2S) Results Lab Validation Data BG<br />
Sample Type** Group Sample ID Top I B-ottom Analytical Compound (mglkg) Qualifier Qualifier Assessment (mglkg)<br />
. --- -<br />
Subsurface Soil METAL 001116SAOIO 7 10 Cadmium 0.990 = 0.210<br />
..,<br />
10 Sodium 350.000* B = 340.000<br />
001117SAOI0 7 10 Cadmium 3.200* = 0.210<br />
7 10 Sodium 410.000* B = 340.000<br />
0011 18SAOIO 7 10 Cadmium 3.320* = 0.210<br />
7 10 Magnesium 2,310.000* = 2,100,000<br />
7 IO Sodium 570.000* = 340.000<br />
001119SAOI0 7 10 Arsenic 10.500* J 7.900<br />
7 10 Barium 197.000 J 170.000<br />
7 10 Cadmium 2.900* = 0.210<br />
7 10 Manganese 881.000* = 820.000<br />
7 10 Nickel 29.700 = Zl.OOO<br />
7 10 Sodium 534.000* = 340.000<br />
001120SAOI0 7 10 Cadmium 2.680* = 0.210<br />
7 10 Sodium 487.000* B = 340.000<br />
001121SAOI0 7 10 Cadmium 2.170<br />
== 0.210<br />
* Result exceeds PRG screenhlg values Page 4 of 16<br />
** Trench samples were taken at baSe of excavated trench approximately 3.5 ft bgs.<br />
Exposed trenches were backfilled after sampling •<br />
• • •
• • •<br />
Table 4.6. Metals detected above BG in VCRS soil at SWMU 001<br />
Sample<br />
Analytical Interval (ft bgs) Results Lab Validation Data BG<br />
Sample Type** Group Sample ID Top IBottom Analytical Compound (mg/kg) Qualifier Qualifier Assessment (mg/kg)<br />
Subsurface Soil M~TAL 001l21SAOI0 7 10 Sodium 446.000* B = 340.000<br />
001122SAOI0 7 10 Cadmium ~.840* = 0.210<br />
7 10 Sodium 493.000* B = 340.000<br />
001l23SAOI0 6 10 Cadmium 2.350* = 0.210<br />
6 10 Sodium 471.000* .- 340.000<br />
001123SDOIO 9.5 10 Cadmium 2.250 = 0.210<br />
9.5 10 Sodium 425.000· = 340.000<br />
001l24SAOI0 7 10 Cadmium 1.500 = 0.210<br />
7 10 Sodium 417.000* = 340.000<br />
001125SAOI0 7 10 Cadmium 2.230 = 0.210<br />
001126SAOI0 7 10 Cadmium 1.520 = 0.210<br />
001127SAOI0 7 10 Cadmium 2.660* .... 0.210<br />
001128SAOI0 7 10 Cadmium 2.460* = 0.210<br />
7 10 Magnesium 2,520.000· J 2,100.000<br />
001129SAOIO 7 10 CadD:tiuln 0.510 = 0.210<br />
7 10 Zinc 60.800 = 60.000<br />
• Result exceeds PRG screening values Page 5 of 16<br />
** Trench samples were taken at base of excavated trench approximately 3.5 ft bgs.<br />
Exposed trenches were backfilled after sampling.
Table 4.6. Metals detected above BG in VCRS soil at SWMU 001<br />
~ -<br />
Sample<br />
Analytical Interval (ft bgsl Results Lab Validation Data BG<br />
Sample Type** Group Sample ID Top jBottom Analytical Compound (mg/kg) Qualifier Qualifier Assessment (mg/kg)<br />
~ -<br />
Subsurface Soil METAL 001130SAOI0 7 10 Antimony 0.930* B = 0.210<br />
7 10 Beryllium 0.740* - 0.690<br />
001131SAOI0 7 10 Antimony 1.7~0* = 0.210<br />
001l32SAOI0 7 10 Antimony 0.630* B - 0.210<br />
001l33SAOI0 7 10 Antimony 1.510* = 0.210<br />
7 10 Sodium 388.000*<br />
==<br />
340.000<br />
001 134SAOIO 7 10 Beryllium 1.070* ..... 0.690<br />
7 10 Cadmium 3.350* - 0.210<br />
7 10 Magnesium 2,450.000* J 2,100.000<br />
001135SAOI0 7 10 Cadmiull1 2.210 = 0.210<br />
7 10 Sodium 372.000* = 340.000<br />
001136SAOI0 7 10 Cadmium 2.740* = 0.210<br />
7 10 Mercury 0.150 = 0.130<br />
001137SAOIO 7 10 Arsenic 16.700* J 7.900<br />
7 10 Barium 215.000 J 170.000<br />
7 10 Beryllium 0.930* = 0.690<br />
* Result exceeds PRG screening values Page 6 of 16<br />
** Trench samples were taken at base of excavated trench approximately 3.5 ft bgs.<br />
Exposed trenches were backfilled after sampling •<br />
• • •
60.000<br />
2,100.000<br />
• • •<br />
Table 4.6. Metals detected above BG in VCRS soil at SWMU 001<br />
~-<br />
-- ----,- --,,- -<br />
Sampie<br />
Analytical !!lterval (ft b~ Results Lab Validation Data BG<br />
Sample Type** _Group Sample 10 Top !Pottom Al1alytical Compound (mglkg) Qualifier Qualifier Asses~lnent (mg/kg)<br />
- -- ~<br />
Subsurface Soil METAL 001l37SAOIO 7 10 Cadmium ~.970* = 0.210<br />
7 10 Cobalt 13.300<br />
==<br />
13.000<br />
7 10 Manganese 2,160.000* J 820.000<br />
7 10 Nickel 24.000 = 22.000<br />
7 10 Sodium 350.000*<br />
== 340.000<br />
001138SAOI0<br />
.,<br />
10 Cad miu Rl 1.990 = 0.210<br />
001139SAOIO<br />
.,<br />
10 Cadmium 1.480 .....<br />
001140SAOI0 7 10 Beryllium 0.770* = 0.690<br />
7 10 Cadmium 0.220 = 0.210<br />
7 10 Magnesium 2,630.000* - 2,100.000<br />
7 10 Sodium 421.000* = 340.000<br />
0.210<br />
7 10 Zinc 108.000<br />
~<br />
00114JSAo-I0 7 10 Magnesium 2,140.000*<br />
~-<br />
7 10 Zil1c 75.800 - 60.000<br />
001142SAOI0 6.75 10 Zinc 118.000 .-.<br />
60.000<br />
001l43SAOI0 5 10 Aluminum 13,000.000 * U 12,000.000<br />
* Result exceeds PRG screening values Page 7 of 16<br />
** Trenclt .sal1lples were taken at base of excavated trench approximately 3.5 ft bgs.<br />
Exposed trenches were backfilled after sampling.
-<br />
Table 4.6. Metals detected above BG in VCRS soil at SWMV 001<br />
Sample<br />
Analytical InterVal (ft bg!l Results Lab Validation Data BG<br />
Sample Type** Group Sample ID Top I Bottom Analytical C(jmp(jund (mg/kg) Qualifier Qualifier Assessment (mg/kg)<br />
Subsurface Soil METAL 001143SAOI0 5 10 Arsenic 10.600* J 7.900<br />
5 10 Manganese 1,080.000* = 820.000<br />
001143S0010 5 10 Aluminum 14,300.000 * = 12,000.000<br />
5 10 Beryllium 0.760* = 0.690<br />
001l44SAOI0 7 10 Zinc 60.200 = 60.000<br />
001l52SAOI0 7 10 Cadmium 0.280 B ? 0.210<br />
7 10 Zinc 70.100 ? 60.000<br />
001l53SAOI0 7 10 Zinc 64.700 ? 60.000<br />
001155SAOI0 7 10 tinc 13.300 ? 60.000<br />
001156SAOI0 7 10 Zinc 63.600 ? 60.000<br />
001 157SAOIO 6 10 Zinc 165.000 ? 60.000<br />
001157S0010 6 10 Zinc 84.700 ? 60.000<br />
001160SAOI0<br />
.,<br />
10 Sodium 409.000* ? 340.000<br />
001l61SAOIO 7 10 Zinc 80.700 ? 60.000<br />
001 165SA020 20 22.5 Vanadium 39.200* ? 37.000<br />
001l65SA040 40 43 Cadmium 0.300 B ? 0.210<br />
* Result exceeds PRG screening values Page 8 of 16<br />
** Trench samples were taken at base of excavated trench approximately 3.5 ft bgs.<br />
Exposed trenches were backfilled after sampling .<br />
• • •
~ ~<br />
.<br />
• • •<br />
Table 4.6. Metals detected above BG in UCRS soil at SWMtJ 001<br />
Sample<br />
Analytical Interval (ft bgs) Results Lab Validation Data BG<br />
Sample Type** Group Sample ID Top IBottom Analytical Compound (m~~) QUalifier Qualifier Assessment (mglkg)<br />
Subsurface Soil METAL 0011658A045 44 47 Sodium 352.000* ? 340.000<br />
._ ..<br />
001165SA050 47 50 Berylliu~ 0.770* ? 0.690<br />
47 50 Sodium 363.000* ? 340.000<br />
47 50 Zinc 120.000 ? 60.000<br />
001166SAOI0 9 12 Sodium 354.000* ? 340.000<br />
001166SA015 15 18 Cadmium 0.270 B ? 0.210<br />
15 18 Sodium 383.000* ? 340.000<br />
IS 18 Zinc 123.000 ? 60.000<br />
001166SA020 18 21 Sodium 362.000* ? 340.000<br />
001i66SA025 24 27 Sodium 357.000* ? 340.000<br />
001 166SA030 30 33 Sodium 346.000* ? 340;000<br />
001166SA040 39 42 Sodium 364.000* ? 340.000<br />
0OII66SA045 44 47 Beryllium 1.050* ? 0.690<br />
001166SAoSO 47 50 Beryllium 1.450* ? 0.690<br />
47 50 Cobalt 23.700 ? 13.000<br />
47 50 Sodium 350.000* ? 340.000<br />
~~<br />
'"<br />
Result exceeds PRG screening values Page 9 of 16<br />
"'* Trench samples were taken at base of excavated trench approximately 3.5 ft hgs.<br />
~ Exposed trenches were backfilled after sampling.
Table 4.6. Metals detected above BG in UCRS soil at SWMU 001<br />
-- --<br />
-- .. _-<br />
Sample<br />
Analytical Interval (ft b2S) Results Lab Validation Data BG<br />
Sample Type** GrouL- Sample ID Top /Bottom Analytical Compound _ (mg/kg) Qualifier Qualifier Assessment (mg/kg)<br />
Subsurface Soil METAL 001 I 66SA050 47 50 Zinc 82.800 ? 60.000<br />
001168SAOIO 10 13 Zinc 78.900 ? 60.000<br />
001168SAOl5 15 18 Antimony 0.600* B ? 0.210<br />
15 18 Chromium 55.100 ? 43.000<br />
15 18 Zinc 61.600 ? 60.000<br />
001168SA020 20 23 Zinc 96.700 ? 60.000<br />
001168SA025 24 29 Zinc 86.000 ? 60.000<br />
001168SA030 30 33 Antimony 0.700* B ? 0.210<br />
30 33 Zinc 306.000 ? 60.000<br />
001 I 68SA035 35 38 Zinc 137.000 ? 60.000<br />
001168SA050 47 50 Zinc 123.000 ? 60.000<br />
001168SD025 24 29 Antimony 0.600* B ? 0 •.210<br />
24 29 Beryllium 1.130* ? 0.690<br />
24 29 Chromium 123.000 ? 43.000<br />
24 29 Vanadium 59.000* ? 37.000<br />
001169SA020 20 23 Beryllium 0.710* ? 0.690<br />
* Result exceeds PRG screening values Page 10 of 16<br />
** Trench samples were taken at base of excavated trench approximately 3.5 ft bgs.<br />
Exposed trenches were backfilled after sampling .<br />
• • •
•<br />
• •<br />
Table 4.6. Metals detected above BC; ill UCR.S~oil at SWMU 001<br />
Analytical<br />
Sample Type** GrouP Sample ID<br />
Sample<br />
,!!a~(ft bgs}<br />
.. Top Bottom An alytical Compound<br />
Subsurface Soil METAL 001169SA020 20 23 Vanadium<br />
Results<br />
(mg/kg)<br />
45.400*<br />
Lab<br />
Qualifier<br />
Validation<br />
Qualifier<br />
?<br />
Data<br />
Assessment<br />
~<br />
~I<br />
37.000<br />
001l69SA025 25 28 Cobalt<br />
19.800<br />
?<br />
13.000<br />
001171SAOI0 )0 13 Arsenic<br />
11.500 ...<br />
?<br />
7.900<br />
10 13 Beryllium<br />
0.750*<br />
?<br />
0.690<br />
)0 13 Manganese<br />
902.000*<br />
?<br />
820.000<br />
)0 13 Nickel<br />
27.000<br />
?<br />
22.000<br />
10 13 Silver<br />
73.900*<br />
?<br />
2.700<br />
10 13 Zinc<br />
85.300<br />
?<br />
60.000<br />
001l71SAOl5 15 18 Cadmium<br />
1.020<br />
?<br />
0.210<br />
001171SA020 20 23 Cadmium<br />
3.840*<br />
?<br />
0.210<br />
20 23 Sodium<br />
343.000*<br />
?<br />
340.000<br />
20 ~3 ~inc<br />
90.300<br />
?<br />
60.000<br />
001171SA025 25 28 Sodium<br />
413.000*<br />
?<br />
340.000<br />
001l71SA030 30 33 Beryllium<br />
0.740*<br />
?<br />
0.690<br />
30 33 Cadmium<br />
1.180<br />
?<br />
0.210<br />
001 171SA035 35 40 Beryllium<br />
0.720*<br />
?<br />
0.690<br />
* Result exceeds PRG screening values<br />
** Trench samples were taken at base of excavated trench approximately 3.5 ft hgs.<br />
Exposed trenches were backfilled after sampling.<br />
Page II of 16
.-<br />
Table 4.6. Metals detected above BG in UCRS soil at SWMU 001 -<br />
.. - -- - -<br />
Sample<br />
Analytical Interval (ft ti2S) Results Lab Validation Data BG<br />
Sample Type** __ G!Q~~<br />
Sample ID Top I Bottom Analytical Compound (mgtkg) Qualifier Qualifier Assessment (mglkg)<br />
._-<br />
Subsurface Soil METAL 001171SA035 35 40 Cadmium 0.730 ? 0.210<br />
35 40 Cobalt 29.900 ? 13.000<br />
001 171SA045 45 48 Cadmium 0.450 ? 0.210<br />
001l71SA050 48 50 Sodium 426.000* ? 340.000<br />
001171SD035 35 40 Beryllium 0.930* ? 0.690<br />
35 40 Cadmium 0.580 ? 1).210<br />
35 40 Chromium 43.500 ? 43.000<br />
35 40 Vanadium 64.300* ? 37.000<br />
001172SA015 IS 18 Cadmium 1.610 ? 0.210<br />
001l72SA040 40 43 Beryllium 0.940* ? 0.690<br />
40 43 Cadmium 0.220 ? 0.210<br />
001172SA050 48 50 Cadmium 0.760 ? 0.210<br />
001 173SAOI0 10 13 Beryllium 0.710* ? 0.690<br />
10 13 Sodium 489.000* ? 340.000<br />
001l73SAOl5 15 18 Sodium 415.000* ? 340.000<br />
001l73SA025 Z5 28 Aluminum 17,500.000* ? 12,000.000<br />
* Result exceeds PRG screening values Page 12 of 16<br />
** Trench samples were taken at base of excavated trench approximately 3.5 ft bgs.<br />
Exposed trenches were backfilled after. sampling .<br />
• • •
• • •<br />
Table 4.6. Metals detected above BG in VCRS soil at SWMU 001<br />
Sample<br />
Sample Type**<br />
Analytical Interval (ft b~s) Results Lab Validation Data BG<br />
Group Sample ID Top IBottom Analytical Compound (mg/kg) Qualifier Qualifier Assessment (mg/kg)<br />
Subsurface Soil METAL 001 173SA025 25 28 Beryllium 0.720* ? 0.690<br />
Z5· ~8 S9dium 494.000* ? 340.000<br />
001173SA030 30 33 Aluminum 12,700.000 * ? 12,000.000<br />
30 33 Sodium 431.000· ? 340.000<br />
001173SA035 35 38 AIl!mhtlim 14,600.000 * ? 12,000.000<br />
35 38 Beryllium 1.240* ? 0.690<br />
35 38 Irol1 28,800.000 ... ? 28,000.000<br />
35 38 Lead 29.700· ? 23.000<br />
35 38 Sodium 478.000· ? 340.000<br />
35 38 Vanadium 43.800· ? 37.000<br />
001173SA040 40 43 Sodium 369.000* ? 340.000<br />
001173SA045 45 48 Aluminum 12,800.000 * ? I~,OOO.OOO<br />
45 48 Beryllium 0.770* ? 0.690<br />
45 48 Sodium 352.000· ? 340.000<br />
001173SA050 48 50 Beryllium 0.700* ? 0.(i90<br />
48 50 Sodium 401.000* ? 340.000<br />
• Result exceeds PRG screening values Page 13 of 16<br />
•• Trench samples were taken at base of excavated trench approximately 3.5 ft bgs .<br />
Exposed trencheS were backfilied after sampling.
Table 4.6. Metals detected above BG in VCRS soil at SWMV 001<br />
-- -<br />
Sample<br />
Analytical Interval (ft bgs) Results Lab Validation Data BG<br />
Sample Type** GroulJ Sample ID Top I Bottom Analytical Compound (mglkg) Qualifier Qualifier Assessment ~mglkg)<br />
-- - --<br />
... - .. - --- - _..<br />
Subsurface Soil METAL 001173SD020 20 25 Beryllium 0.730* ? 0.690<br />
20 25 Sodium 452.000* ? 340.000<br />
20 25 Vanadium 42.100* ? 37.000<br />
001 174SAOl5 15 18 Sodium 401.000* ? 340.000<br />
IS 18 Vanadium 40.200* ? 37.000<br />
001 I 74SA020 20 23 Beryllium 0.900* ? 0.690<br />
20 23 Chromium 58.600 ? 43.000<br />
20 23 Iron 30,900.000 * ? 28,000.000<br />
20 23 Vanadium 68.100* ? 37.000<br />
001174SA025 25 28 Aluminum 14,100.000 * ? 12,000.000<br />
25 28 Sodium 499.000* ? 340.000<br />
001l74SA030 30 33 Aluminum 18,700.000 * ? 12,000.000<br />
30 33 Sodium 471.000* ? 340.000<br />
001l74SA035 35 38 Beryllium 0.780* ? 0.690<br />
35 38 Iron 28,200.000 * ? 28,000.000<br />
35 38 Vanadium 44.100* ? 37.000<br />
* Result exceeds PRG screening values Page 14 of 16<br />
** Trench samples were taken at base of excavated trench approximately 3.5 ft bgs.<br />
Exposed trenches were backfilled after sampling.<br />
• • •
• • •<br />
Table 4.6. Metals detected above BG in VCRS soil at SWMU 001<br />
~. -<br />
-<br />
Sample<br />
Analytical Interval (ft bgsl Results Lab Validatiol1 Data BG<br />
Sample Type** Group Sample ID Top I Bottom Analytical Compound (mg/kg) Qualifier QlIa~ifier Assessment (mg/kg)<br />
. --<br />
Subsurface Soil METAL 00 11 74SAOSO 48 50 Barium 180.000 ? 170.000<br />
_ .. -._-_. -<br />
48 50 Cobalt 14.800 ? 13.000<br />
48 50 Manganese 871.000* ? 820.000<br />
001179SAOl5 15 18 Antimony 0.550* B ? 0.210<br />
15 18 Cadmium 0.280 ? 0.210<br />
15 18 Chromium 56.Z00 ? 43.000<br />
15 18 Vanadium 53.300* ? 37.000<br />
001179SA020 20 23 Vanadium 46.600* ? 37.000<br />
001179SA025 25 28 Vanadium 40.100* ? 37.000<br />
001179SA035 35 38 Cadmium 0.260 ? 0,210<br />
35 38 Iron 35,500.000 * ? 28,000.000<br />
35 38 Vanadium 58.300* ? 37.000<br />
00 1179SA040 40 43 Antimony 0.530* B ? 0.210<br />
40 43 pefyllium 1.660* ? 0.690<br />
40 43 Cadmium 0.390 ? 0.210<br />
40 43 Iron 29,700.000 * ? 28,000.000<br />
* Result exceeds PRG screening values Page IS-of 16<br />
** Trench samples were taken at base of excavated trench approximately 3.S ft bgs.<br />
Exposed trenches were backfilled after sampling.
Table 4.6. Metals detected above BG in UCRS soil at SWMU 001<br />
_ .. .-<br />
- -<br />
Sample<br />
Analytical InterVal (ft b£s) Results Lab Validation Data BG<br />
Sample Type** Group Sample ID Top _ I Bottom Analytical Compound (mglkg) Qualifier Qualifier Assessment (mglkg)<br />
--<br />
Subsurface Soil METAL 001179SA045<br />
45<br />
48 Beryllium 0.730*<br />
?<br />
0.690<br />
OOl179SA050<br />
48<br />
50 Beryllium 0.780*<br />
Note: Trench samples not containin~ any detectable metals at concentrations above background at SWMU 001 are:<br />
001102SAOOI 001103SAOOI<br />
Sediment samples not containing any detectable metals at concentrations above background at SwMu 001 are:<br />
001145SAOOI 001146SAOOI 001150SAOOI<br />
?<br />
0.690<br />
Subsurface soil samples not containin~ any detectable metals at concentrations above back~round at SWMU 001 are:<br />
001154SA010 001l58SAOI0 00Jl59SA010 001l62SA010 001l65SA015 001165SA025 001l65SA030 OO1165SA035 001l66SA035<br />
001168SA040 001168SA045 OOl169SA01S 001169SA030 001169SA035 001169SA040 001169SA045 001169SA050 001169SD035<br />
001171SA040 001172SA020 001172SA025 001172SA030 001172SA035 001172SA045 001173SA020 001174SA040 001174SA045<br />
001 179SA030<br />
* Result exceeds PRG screening values Page 16 of 16<br />
** Trench samples were taken at base of excavated trench approximately 3.5 ft bgs.<br />
Exposed trenches were backfilled after sampling .<br />
• • •
• • •<br />
Table4.7. Radioactive isotopes detected above BG in VCRS soil at SWMV 001<br />
- .-.- .<br />
Sample<br />
Analytical Interval (ftb2S) Results Lab Validation Data BG<br />
Sample Type** Group SamplefD Top I Bottom Analytical ColripoUild (pCilg) Qualifier Qualifier Assessment (pCil~)_ .<br />
-<br />
Trench RADS OOIIOISAOOI 0 0 Americium-24 1 0.430 ? 0.000<br />
0 0 Neptunium-237 0.570 ? 0.100<br />
0 0 Technetium-99 10.000 ? 2.500<br />
0 0 Uranium 60.000 ? 0.000<br />
OOllOISDOOI 0 0 Neptul!ium .. ~31 0.410 ? 0.100<br />
0 0 Technetiurn-99 10.000 ? 2.500<br />
0 0 Uranium 80.000 ? 0.000<br />
001102SAOOI 0 0 Technetium-99 6.000 ? 2.500<br />
0 0 Uranium 7.400 ? 0.000<br />
001103SAOOl 0 0 Plutonium-239/240 0 .• 30 ? 0.000<br />
0 0 Uranium 60.000 ? 0.000<br />
001104SAOOl 0 0 Uranium 6.800 ? 0.000<br />
Sediment 001146SAOOl 0 Plutonium-239/240 0.070 ? 0.000<br />
0 1 Uranium 4.300 ? 0.000<br />
0 1 Uranium-238 2.400 ? 1.200<br />
001147SAOOI 0 Plutonium-239/240 0.070 ? 0.000<br />
* Result exceeds PRG screening values Page I of9<br />
** Trench samples were taken at base of excavated trench approximately 3.5 ft bgs.<br />
Exposed trenches were backfilled after sampling.
Table 4.7. Radioactive<br />
- -<br />
isotopes detected above BG in VCRS soil at SWMU<br />
"-. ----<br />
001<br />
Sample<br />
Analytical Interval (ft bgs) Results Lab Validation Data BG<br />
Sample Type** Group Sample ID Top I Bottom Analytical Compound (pCi/g) Qualifier Qualifier Assessment (pCi/g) _<br />
- - -<br />
Sedimel1t RADS 001147SAOOl 0 1 Technetium-99 3.700 ? 2.500<br />
0 1 Uranium 3.900 ? 0.000<br />
0 Uranium-238 2.300 ? 1.200<br />
001148SAOOl 0 1 Plutonium-239/240 0.210 ? 0.000<br />
0 I Uranium 4.100 ? 0.000<br />
0 I Uranium-238 2.300 ? 1.200<br />
001149SAOOl 0 1 Americium-24I 7.830 ? 0.000<br />
0 I Cesium-137 0.550 ? 0.490<br />
0 1 Neptunium~237 12.150* ? 0.100<br />
0 I Plutonium-239/240 26.820* ? 0.000<br />
0 I Technetium-99 24.300 ? 2.500<br />
0 I Thorium-230 187.900* ? 1.500<br />
0 Uranium 8.100 ? 0.000<br />
0 1 Uranium-234 3.500 ? 2.500<br />
0 1 Uranium-235 0.-180 ? 0.140<br />
0 1 U ral1ium. 238 4.400 ? 1.200<br />
* Result exceeds PRG screening values Page 20f9<br />
** Trench samples were taken at base of excavated trench approximately 3.5 ft bgs.<br />
Exposed trenches were backfilled after sampling •<br />
• • •
• • •<br />
Table 4.1. Radioactive isotopes detected above BG in VCRS soil at SWMV 001<br />
Sample<br />
Analytical Inte"al (ft bes) Results Lab Validation Data BG<br />
Sample Type** Group _~ampleIb Top jBottom Analytical Compound (pCilg) Qualifier Qualifier Assessment (pCilg)<br />
Sediment RADS 001 150SAOO I 0 I Americium-241 7.830 ? 0.000<br />
0 I Neptunium-231 0.110 ? 0.100<br />
0 I Plutonium-239/240 0.240 ? 0.000<br />
0 I Technetium-99 3.200 ? 2.500<br />
0 Thorium-230 2.610 ? 1.500<br />
0 Uranium 3.200 ? 0.000<br />
0 Uranium-238 2.100 ? 1.200<br />
001l70SAOOI 1.75 Cesium-137 0.510 ? 0.490<br />
I 1.75 Neptunium-237 0.170 ? 0.100<br />
1.75 Uranium 12.300 ? 0.000<br />
I 1.75 Uranium-234 6.840 ? 2.500<br />
I 1.75 Uranium-235 0.310 ? 0.140<br />
I 1.75 Uranium-238 5.200 ? 1.200<br />
Subsurface Soil 001l03SAOIO 6 10 Uranium 1.500 ? 0.000<br />
6 10 Uranium-238 1.300 ? 1.200<br />
001l05SAOI0 7 to Uranium 2.200 ? 0.000<br />
* Result exceeds PRG screening values Page 3 of9<br />
** Trench samples were taken at base of excavated trench approximately 3.5 ft bgs.<br />
Exposed trenches were backfilled after samplhlg.
Table 4.7. Radioactive Isotopes detected above BG in UCRS~oil at SWMtJ 001<br />
Sample<br />
Analytical<br />
Interval (ft b2S)<br />
Sample Type** Group . Sample ID Top fBoUom Analytical Compound<br />
Results<br />
(pCilg)<br />
Lab Validation Data<br />
Qualifier (}ualifier Assessment<br />
BG<br />
(pCilg)<br />
Subsurface Soil RADS 001106SA010<br />
10 Uranium<br />
1.800<br />
?<br />
0.000<br />
7<br />
10 Uranium-238<br />
1.300<br />
?<br />
1.200<br />
001107SA010<br />
7<br />
10 Uranium<br />
2.400<br />
?<br />
0.000<br />
001l09SA010<br />
7<br />
10 Uranium<br />
1.900<br />
?<br />
0.000<br />
0011l0SA010<br />
7<br />
10 Uranium<br />
1.600<br />
?<br />
0.000<br />
00111iSA010<br />
7<br />
10 Technetium-99<br />
4.500<br />
?<br />
2.800<br />
001112SA010<br />
7<br />
10 Uranium<br />
1.600<br />
?<br />
0.000<br />
0011 13SAOI 0<br />
7<br />
10 Uranium<br />
1.900<br />
?<br />
0.000<br />
001 1 14SA010<br />
7<br />
10 Uranium<br />
1.800<br />
?<br />
0.000<br />
001l15SAOIO<br />
7<br />
10 Uranium<br />
1.800<br />
?<br />
0.000<br />
001116SAOIO<br />
7<br />
10 Uranium<br />
2.100<br />
?<br />
0.000<br />
001111SAOIO<br />
001118SAOI0<br />
7<br />
.,<br />
10 Uranium<br />
10 Uranium<br />
3~200<br />
1.700<br />
?<br />
?<br />
0.000<br />
0.000<br />
001119SAOIO<br />
7<br />
10 Uranium<br />
2.400<br />
?<br />
0.000<br />
001122SA010<br />
7<br />
10 Uranium<br />
2.100<br />
?<br />
0.000<br />
001123SAOIO<br />
6<br />
10 Uranium<br />
2.000<br />
?<br />
0.000<br />
*<br />
Result exceeds PRG screening values<br />
** Trench samples were taken at base of excavated trench approximately 3.5 ft hgs.<br />
Exposed trenches were backfilled after sampling .<br />
Page 4 of9<br />
• •<br />
•
..<br />
• • •<br />
Table 4.7. Radioactive isotopes detected above BG in VCRS soil at SWMV 001<br />
- ~<br />
,-- -- -<br />
---<br />
.. _---<br />
Sample<br />
Analytical Interval (ft b£s) Results Lab Validation Data BG<br />
Sample Type** Group Saanple ID Top JBotto~ Analytical Compound (PC'i/g) Qualifier Qualifier Assessment (pCilg)<br />
Subsurface Soil RADS 001l23SAOIO 6 to Ural1ium-238 1.700 ? 1.200<br />
001123SDOIO 9.5 10 Ural1ium 2.100 ? 0.000<br />
9.5 10 Ural1iurl1-238 1.500 ? 1.200<br />
001l24SAOI0 7 10 Uranium 10700 ? 0.000<br />
001 12jSAOl 0 7 10 Uranium 1.700 ? 0.000<br />
001135SAOIO 7 10 Uranium 1.900 ? 0.000<br />
OOl137SAOIO 7 10 Americium-241 0.080 J 0.000<br />
7 10 Ural1ium 2.200 ? 0.000<br />
7 10 Uranium-238 1.300 ? 1.200<br />
001138SAOIO 7 10 Uranium 1.700 ? 0.000<br />
7 10 Uranium-238 1.300 ? 1.200<br />
001141SAOIO 7 10 Uranium 1.700 ? 0.000<br />
001142SAOIO 6.75 10 Uranium 1.700 ? 0.000<br />
001 143Si\010 5 10 Uranium 1.800 ? 0.000<br />
5 10 Uranium-238 1.300 ? 1.200<br />
001143SDOI0 5 10 PhJtonium-239/240 0.060 ? 0.000<br />
* Resuit exceeds PRG screening values Page 5 of9<br />
** Trench ~mpleS were taken at base of excavated trench approximately 3.5 ft bgs.<br />
Exposed trenches were backfilled after sampling.
Table 4.7. Radioactive isotopes detected above BG in VCRS soil at SWMU 001<br />
Sample<br />
Amilytical J!lterv~~t.bgSl Results Lab Validation Data BG<br />
Sample Type** Group SampleID Top' B()Uom Analytical Compound (pCilg) Qualifier Qualifier Assessment (pCilg)<br />
-..<br />
Subsurface Soil RADS 001143SDOI0 5 10 Technetium-99 8.600 ? 2.800<br />
001144SAOI0 7 10 Americium-241 0.100 ? 0.000<br />
7 10 Neptunium.237 0.200 ? 0.000<br />
7 10 Plutonium-239/240 2.720 ? 0.000<br />
7 10 Thorium-230 18.430 ? 1.400<br />
7 10 Uranium 2.600 ? 0.000<br />
7 10 Uranium-238 1.500 ? 1.200<br />
001152SAOI0 7 10 Uranium 2.900 U 0.000<br />
7 10 Uranium-238 1.600 ? 1.200<br />
001154SAOI0 7 10 Uranium 2.100 ? 0.000<br />
7 10 Uranium-238 1.400 ? 1.200<br />
001155SAOI0 7 10 Uranium 6.600 ? 0.000<br />
.,<br />
10 Uranium-234 3.500 ? 2.400<br />
7 10 Uranium-235 0.160 ? 0.140<br />
7 10 Uranium-238 3.000 ? 1.200<br />
001156SAOI0 7 10 Uranium 14.000 ? 0.000<br />
* Result exceeds PRG screening values Page 6 of9<br />
** Trench samples were taken at base of excavated trench approximately 3.5 ft bgs.<br />
Exposed trenches were backfilled after sampling .<br />
• • •
• • •<br />
Table 4.7. Radioactive isotopes detected above BG in UCRS soil at SWMU 001<br />
- . - .<br />
-<br />
Sample<br />
AluilytiCal Interval (ft b~l Results Lab Validation Data BG<br />
Sample Type** Group Sample ID Top I Bottom Analytical Compound .. (pCilg) Qualifier Qualifier Assessment (pCilg)<br />
...<br />
Subsurface Soil RA))S ()01156SA010 7 10 Uranium-234 7.200 ? 2.400<br />
..,<br />
10 Uranhirn-2:J5 0.340 ? 0.140<br />
7 10 Uranium-238 6.300 ? 1.200<br />
001157SAOI0 6 10 Uranium 3.600 ? 0.000<br />
6 10 Uranium-238 2.300 ? 1.200<br />
001157SDOI0 6 10 Urareillm 5.400 ? 0.000<br />
6 10 1. Jranium-238 3.500 ? 1.200<br />
001158SAOI0 7 10 Uranium 1.600 ? 0.000<br />
7 10 Uranium-234 3.200 ? 2.400<br />
7 10 Uranium-238 1.300 ? 1.200<br />
001159SAOI0 7 10 Uranium 1.500 ? 0.000<br />
001 160SAOIO 7 10 Uranium 2.500 ? 0.000<br />
7 10 Uranium-238 1.300 ? 1.200<br />
001161SAOI0 7 10 Uranium 2.100 ? 0.000<br />
7 10 Uranium-238 2.000 ? 1.200<br />
001162SAOI0 7 10 Uranium 3.100 ? 0.000<br />
* Result exceeds PRG screening values Page 7 of9<br />
** Trench samples were taken at base of excavated trel1ch approximately 3.5 ft bgs.<br />
Exposed trenches were backfilled after sampling.
Table 4.7. Radioactive isotopes detected above 8G in VCRS soil at SWMU 001<br />
Sample<br />
Analytical Interval (ft bgs) Results Lab Validation Data BG<br />
Sample Type** Group Sample ID Top !Bottom Analytical Compound (pCilg) Qualifier Qualifier Assessment (pCiI~)<br />
Subsurface Soil RADS 001162SAOIO 7 10 Uranium-238 1.800 ? 1.200<br />
001165SAOl5 14 17 Uranium 22.000 ? 0.000<br />
14 17 Uranium-234 12.600 ? 2.400<br />
14 17 Uranium-235 0.570 ? 0.140<br />
14 17 Uranium-238 9.000 ? 1.200<br />
001 165SA030 29 32 Uranium 19.400 ? 0.000<br />
29 32 UraraillD1-234 11.000 ? 2.400<br />
29 32 Uranium-235 0.500 ? 0.140<br />
29 32 Uranium-238 7.900 ? 1.200<br />
001168SA025 24 29 Uranium 3.200 ? 0.000<br />
24 29 U ranium-238 2.200 ? 1.200<br />
001168SD025 24 29 Pllltonium-239/240 0.070 ? 0.000<br />
* Result exceeds PRG screening values Page 8 of9<br />
** Trench samples were taken at base of excavated trench approximately 3.5 ft bgs.<br />
Exposed trenches were backfilled after sampling .<br />
• • •
• • •<br />
Table 4.7. Radioactive isotopes detected above BG in VCRS soil at SWMU 001<br />
.-- ---<br />
Sample<br />
Analytical Interval (ft ~g& Results Lab Validation Data BG<br />
Sample Type** Group Sample ID Top ),lJottom Analytical Compoul1d (pCilg) Qualifier Qualifier Assessment (pCilg)<br />
--<br />
Note: Trench samples not containing any detectable radioactive isotopes at concentrations above background at SWMU 001 are:<br />
None<br />
Sediment samples not containing any detectabl~ radioactive isotopes at concentratiol1s above background at SWMU 001 are:<br />
00114SSAOOl<br />
Subsurface soil samples not containin~ any detectable radioactive isotopes at concentrations above back~round at SWMU 001 are:<br />
OOllOlSAOIO OOl102SAOIO OOll04SAOIO 001108SAOIO 001120SAOIO 001121SAOIO 00l12SSAOIO 001126SAOI0 001 128SAOI0<br />
001 129SAOIO 001130SAOI0 001131SAOI0 001132SAOIO 001133SAOIO 001 134SAOIO 001136SA010 001139SA010 001 140SAOIO<br />
OOllS2SAOOS 001lS3SAOOS 001153SAOI0 0011S4SAOOS 0011S6SAOOS . 0011S7SAOOS 0011S8SAOOS 001160SA005 001161SAOOS<br />
OOl162SAOOS 00116SSA020 001165SA02S 001 165SA035 001 16SSA040 00116SSA04S 001 16SSAOSO 00ll66SAOOS 001166SAOI0<br />
001166SA015 001166SA020 001166SA02S 001166SA030 001166SA035 001 166SA040 001166SA04S 001 166SA050 001168S~005<br />
001168SAOIO 001168SA015 001 168SA020 0011688A030 001168SA035 001168SA040 00t168SA045 001 168SA050 001169SAOIS<br />
001 169SA020 001169SA025 001 169SA030 001 I 69SA035 001169SA040 001169SA045 001 169SA050 001 169SD035 001171SA005<br />
001171SA010 001171SAOIS 001171SA020 001 171SA025 001171SA030 001171SA035 001171SA040 001171SA045 00t171SA050<br />
001171SD035 001 I 72SAO 15 001172SA020 001 I 72SA025 001 172SA030 001 I 72SA035 001172SA040 001172SA045 001172SA050<br />
001173SA005 001173SAOIO 001 173SA015 001173SA020 001J73SA025 001J73SA030 001173SA035 001J73SA040 001l738A04S<br />
001 I 73SA050 001173S0020 001l74SA015 001l74SA020 001174SA02S 001174SA030 001174SA03S 001 174SA040 001174SA045<br />
001 174SA050 001175SA055 001 175SA075 001175SA095 001176SA055 001176SA07S OOJJ76SA095 001l77SA055 001177SA075<br />
001l77SA09S 001178SA055 001l78SA075 001l78SA095 001179SAOl5 001179SA020 001179SA025 001 179SA030 OOl179SA035<br />
001 I 79SA040 001179SA045 001179SA050 001J80SA055 001180SA07S 001180SA095 001181SA055 0011818A075 001181SA095<br />
0011825,1\055 001182SA075<br />
- - - -<br />
001 I 82SA095 001 I 83SA055 001183SA075 001 I 83SA095 001184SA055 001184SA075 001 184SA095<br />
* Result exceeds PRG screening values Page 90f9<br />
** Trench samples were taken at base of excavated trench approximately 3.5 ft bgs.<br />
Exposed trenches were backfilled after sampling.
Table 4.8. VOA compounds detected in VCRS groul1dwater at SWMU 001<br />
Sample Type<br />
Analytical<br />
Group<br />
Sample<br />
Interval (ft b2S)<br />
Sample ID Top 180ttoo1 Analytical Compound<br />
-<br />
Results<br />
(ug/L)<br />
Lab<br />
Qualifier<br />
Validation<br />
Qualifier<br />
Data<br />
Assessment<br />
Groundwater<br />
VOA<br />
001l73WA050 50 50 l,l-Dichloroethene<br />
50<br />
50<br />
50 trans-l,~-Dichloroethene<br />
50 Trichloroethene<br />
7.000*<br />
46.000*<br />
312.000*<br />
Note: VCRS groundwater samples not containing any detectable VOA compounds at SWMV 001 are:<br />
None<br />
J<br />
J<br />
?<br />
?<br />
?<br />
* Result exceeds PRG screening values<br />
Page I of 1<br />
• •<br />
•
• •<br />
Table 4.9. Radioactive isotopes detected above BG in VCRS groundwater at SWMU 001<br />
-- -- - --- -_.. .-<br />
- ----<br />
Sample<br />
Analytical InterVal (ft bits) Results*'" Lab Validation Data<br />
Sample Type Group Sample ID Top jBottom Analytical Compo~l!d (pCiIL) Qualifier Qualifier Assessment<br />
.. _"<br />
Groundwater RADS 001173WA050 50 50 Tech ... etium-99 41.100* ?<br />
50 SO Uranium 0.040* ?<br />
Note: VCRS groundwatersalilples not containing any detectable radioactive isotopes at concentrations above background at SWMU 001 are:<br />
None<br />
•<br />
BG**<br />
(pCiIL)<br />
0.000<br />
0.000<br />
* Result exceeds PRG screening values<br />
** Results and backgr(nlnd valu~ for Uranium given in mgIL<br />
Page I of 1
Table 4.10. Frequency of detection of organic compounds, metals, and radioactive isotopes exceeding BG<br />
in SWMV 001 trench, sediment, VCRS soil and VCRS groundwater samples<br />
Sample Type<br />
Trench<br />
Analytical Group<br />
VOA<br />
SVOA<br />
PCB<br />
Metals<br />
Radioactive<br />
isotopes<br />
Analytical Compound<br />
.<br />
Tnchloroethene<br />
Vinyl chloride<br />
Phenol<br />
2,4-Dimethylphenol<br />
Di-n-butyl phthalate<br />
m,p-Cresol<br />
Total Cresols<br />
PCB-I242<br />
PCB-I268<br />
Polychlorinated biphenyl<br />
PCB-1260<br />
Mercury<br />
Chromium<br />
Nickel<br />
Uranium<br />
Technetium-99<br />
Neptunium-237<br />
Americium-241<br />
Plutonium-239/240<br />
Number of<br />
Analyses (s)<br />
5<br />
5<br />
2<br />
I<br />
I<br />
5<br />
5<br />
2<br />
2<br />
5<br />
I<br />
5<br />
5<br />
5<br />
5<br />
5<br />
5<br />
5<br />
5<br />
Number of<br />
Detections<br />
above BG (D)<br />
4<br />
2<br />
2<br />
I<br />
I<br />
I<br />
I<br />
2<br />
2<br />
2<br />
I<br />
2<br />
I<br />
I<br />
5<br />
3<br />
2<br />
I<br />
I<br />
Number of<br />
Detections<br />
above BG &<br />
PRG<br />
Screening<br />
Values(s)<br />
2<br />
2<br />
o<br />
o<br />
o<br />
o<br />
o<br />
2<br />
2<br />
2<br />
1<br />
o<br />
o<br />
o<br />
o<br />
o<br />
o<br />
o<br />
o<br />
Maximum<br />
Result<br />
above BG (8)<br />
1,200.000<br />
270.000<br />
23,000.000<br />
15,000.000<br />
9,000.000<br />
8,600.000<br />
8,600.000<br />
500.000<br />
5,600.000<br />
17,100.000<br />
11,000.000<br />
0.310<br />
17.100<br />
116.000<br />
80.000<br />
10.000<br />
0.570<br />
0.430<br />
0.130<br />
Minimum<br />
Result<br />
above BG(s)<br />
11.000<br />
67.000<br />
2,900.000<br />
15,000.000<br />
9,000.000<br />
8,600.000<br />
8,600.000<br />
500.000<br />
4,200.000<br />
4,700.000<br />
11,000.000<br />
0.260<br />
17.100<br />
116.000<br />
6.800<br />
6.000<br />
0.410<br />
0.430<br />
0.130<br />
Average<br />
Result<br />
above BG (8)<br />
434.000<br />
168.500<br />
1~,950.000<br />
15,000.000<br />
9,000.000<br />
8,600.000<br />
8,600.000<br />
500.000<br />
4,900.000<br />
10,900.000<br />
11,000.000<br />
0.285<br />
17.100<br />
116.000<br />
4~Ji40<br />
8.667<br />
0.490<br />
0.430<br />
0.130<br />
Units<br />
ug/kg<br />
ug/kg<br />
ug/kg<br />
ug/kg<br />
ug/kg<br />
ug/kg<br />
ug/kg<br />
ug/kg<br />
ug/kg<br />
ug/kg<br />
ug/kg<br />
mglkg<br />
mg/kg<br />
mg/kg<br />
pCilg<br />
pCilg<br />
pCilg<br />
pCilg<br />
pCi/g<br />
Sediment<br />
Metals<br />
Barium<br />
Beryllium<br />
Chromium<br />
Cobalt<br />
Manganese<br />
Nickel<br />
7<br />
7<br />
7<br />
7<br />
7<br />
7<br />
1<br />
1<br />
1<br />
1<br />
1<br />
1<br />
1<br />
1<br />
o<br />
o<br />
1<br />
o<br />
247.000<br />
0.800<br />
16.800<br />
15.400<br />
1,990.000<br />
23.400<br />
247.000<br />
0.800<br />
16.800<br />
15.400<br />
1,990.000<br />
23.400<br />
247.000 mg/kg<br />
0.800 mg/kg<br />
16.800 mg/kg<br />
15.400 mg/kg<br />
1,990.000 mg/kg<br />
23.400 mg/kg<br />
• •<br />
(8) Number of analyses/detections include both envirol1mental samples and duplicate results<br />
Page I of 4<br />
•
• • •<br />
Table 4.10. Frequency of detection of organic compounds, metals, and radioactive isotopes exceeding BG<br />
in SWMU 001 trench, sediment, VCRS soil and UCRS groundwater samples<br />
Sample Type<br />
.<br />
Sediment<br />
(cont.)<br />
Analytical Group<br />
Metals (cont.)<br />
Radioactive<br />
isotopes<br />
._--- .<br />
Analytical Compound<br />
.<br />
Thalhum<br />
Zinc<br />
Uranium<br />
Uranium-238<br />
Plutonium-239/240<br />
Neptunium-237<br />
Techl1etium-99<br />
Americium-241<br />
Cesium-137<br />
Thorium-230<br />
Uranium-234<br />
Uraniul1l-235<br />
Number of<br />
Analyses (a)<br />
7<br />
7<br />
6<br />
6<br />
6<br />
6<br />
6<br />
6<br />
6<br />
6<br />
6<br />
6<br />
Number of<br />
Detections<br />
above BG (a)<br />
1<br />
1<br />
6<br />
6<br />
5<br />
3<br />
3<br />
2<br />
2<br />
2<br />
2<br />
2<br />
Number of<br />
Detections<br />
above BG &<br />
PRG<br />
Screening<br />
Values (a)<br />
1<br />
o<br />
o<br />
o<br />
1<br />
1<br />
o<br />
o<br />
1<br />
o<br />
o<br />
Maximum<br />
Result<br />
above BG (a)<br />
1.560<br />
67.000<br />
12.300<br />
5.200<br />
26.820<br />
12.150<br />
24.300<br />
7.830<br />
0.550<br />
187.900<br />
6.840<br />
0.310<br />
Minimum<br />
Result<br />
above BG(a)<br />
1.560<br />
67.000<br />
3.200<br />
2.100<br />
0.070<br />
0.110<br />
3.200<br />
7.830<br />
0.510<br />
2.610<br />
3.500<br />
0.180<br />
-<br />
Average<br />
Result<br />
above BG (a)<br />
1.560<br />
67.000<br />
5.983<br />
3.U7<br />
5.482<br />
4.143<br />
10.400<br />
7.830<br />
0.530<br />
95.255<br />
5.170<br />
0.245<br />
Units<br />
mg/kg<br />
mg/kg<br />
pCi/g<br />
pCi/g<br />
pCi/g<br />
pCi/g<br />
pCilg<br />
pCilg<br />
pCi/g<br />
pCi/g<br />
pCi/g<br />
pCi/g<br />
Subsurface<br />
soil<br />
VOA<br />
SVOA<br />
Trichloroethene<br />
trans-l,2-Dichloroethene<br />
1,I-Dichloroethane<br />
cis-I,2-Dichloroethene<br />
Vinyl chloride<br />
Acetone<br />
1,2-Dichloroethene<br />
Bis(2-ethylhexyl)phthalate<br />
Di-n-butyl phthalate<br />
2,4-Dimethylphenol<br />
4-Methylphenol<br />
Butyl benzyl phthalate<br />
Diethyl phthalate<br />
222<br />
222<br />
27<br />
222<br />
222<br />
4<br />
199<br />
138<br />
138<br />
138<br />
115<br />
138<br />
138<br />
72<br />
36<br />
10<br />
6<br />
6<br />
4<br />
1<br />
17<br />
2<br />
1<br />
1<br />
1<br />
1<br />
49<br />
o<br />
o<br />
o<br />
6<br />
o<br />
o<br />
o<br />
o<br />
o<br />
o<br />
o<br />
o<br />
439,000.000<br />
16,000.000<br />
4,300.000<br />
6,000.000<br />
4,800.000<br />
8.000<br />
2.000<br />
100.000<br />
50.000<br />
40.000<br />
480.000<br />
200.000<br />
60.000<br />
6.000<br />
20.000<br />
90.000<br />
2.000<br />
200.000<br />
3.000<br />
2.000<br />
35.000<br />
50.000<br />
40.000<br />
480.000<br />
200.000<br />
60.000<br />
18,520.194<br />
1,786.111<br />
1,095.000<br />
1,975.333<br />
1,250.000<br />
5.750<br />
2.000<br />
56.353<br />
50.000<br />
40.000<br />
480.000<br />
200.000<br />
60.000<br />
ug/kg<br />
ug/kg<br />
ug/kg<br />
ug/kg<br />
ug/kg<br />
ug/kg<br />
uglkg<br />
ug/kg<br />
ug/kg<br />
ug/kg<br />
ug/kg<br />
ug/kg<br />
ug/kg<br />
(a) Number of analyses/detections include both <strong>environmental</strong> samples and duplicate results<br />
Page 2 of4
Table 4.10. Frequency of detection of organic compounds, metals, and radioactive isotopes exceeding BG<br />
in SWMV 001 trench, sediment, VCRS soil and VCRS groundwater samples<br />
Sample Type Analytical Group Analytical Compound<br />
Number of<br />
Detections<br />
Number of<br />
Maximum Minimum Average<br />
Number of<br />
aboveBG &<br />
Detections<br />
Result Result Result<br />
Analyses (a)<br />
PRG<br />
above BG (a)<br />
above BG (a) above BG(a) above BG (a)<br />
Screening<br />
Units<br />
Values(s)<br />
Subsurface SVOA (cont.) Phenol 138 1 0 1,900.000 1,900.000 1,900.000 ugtkg<br />
soil (cont.) Total Cresols 23 1 0 4,400.000 4,400.000 4,400.000 uglkg<br />
Metals Sodium 138 50 50 570.000 343.000 421.520 mglkg<br />
Cadmium 138 46 19 3.840 0.220 1.828 mglkg<br />
Beryllium 138 26 26 1.660 0.700 0.89~ mglkg<br />
Zinc 138 24 0 306.000 60.200 100.646 mglkg<br />
Antimony 138 15 15 1.720 0.530 0.928 mglkg<br />
Vanadium 138 13 13 68.100 39.200 49.577 mglkg<br />
Aluminum t38 8 8 18,700.000 12,700.000 14,712.500 mglkg<br />
Magnesium 138 8 8 2,630.000 2,110.000 2,313.750 mglkg<br />
Arsenic 138 6 6 16.700 9.410 11.568 mglkg<br />
Barium 138 6 0 215.000 174.000 187.000 mglkg<br />
Chromium 138 5 0 123.000 43.500 67.280 mglkg<br />
Cobalt 138 5 0 29.900 13.300 20.300 mglkg<br />
Iron 138 5 5 35,500.000 28,200.000 30,620.000 mglkg<br />
Manganese 138 5 5 2,160.000 871.000 1,178.800 mglkg<br />
Nickel 138 5 0 29.700 24.000 26.740 mglkg<br />
Lead 138 1 1 29.700 29.700 29.700 mglkg<br />
Mercury 138 1 0 0.150 0.150 0.150 mglkg<br />
Silver 138 1 1 73.900 73.900 73.900 mglkg<br />
Radioactive Uranium 66 40 0 22.000 1.500 3.528 pCi/g<br />
isotopes Uranium-238 66 21 0 9.000 1.300 2.610 pCi/g<br />
Uranium-234 66 5 0 12.600 3.200 7.500 pCi/g<br />
Uranium-235 66 4 0 0.570 0.160 0.393 pCi/g<br />
Plutonium-239/240 66 3 0 2.720 0.060 0.950 pCi/g<br />
Americium-241 66 2 0 0.100 0.080 0.090 pCi/g<br />
• • •<br />
(S) Number of analyses/detections include both <strong>environmental</strong> samples and duplicate results<br />
Page.30f4
• • •<br />
Table 4.10. Frequency of detection of organic compounds, rnetals, and radioactive isotopes exceeding BG<br />
irl SWMV 001 trench, sediment, VCRS soil and VCRS groundwater samples<br />
Sample Type<br />
~ ~ -<br />
Subsurface<br />
soil (cont.)<br />
Analytical Group<br />
.<br />
Radioactive<br />
isotopes (cont.)<br />
Analytical Compound<br />
Technetaum-99<br />
Neptunium-237<br />
Thorium-230<br />
Number of<br />
Analyses (a)<br />
68<br />
66<br />
66<br />
Number of<br />
Detections<br />
above BG (a)<br />
2<br />
1<br />
1<br />
Number of<br />
Detections<br />
aboveBG &<br />
PRG<br />
Screening<br />
Values (a)<br />
o<br />
o<br />
o<br />
Maximum<br />
Result<br />
above DO (a)<br />
8.600<br />
0.200<br />
18.430<br />
Minimum<br />
Result<br />
above BG(a)<br />
4.500<br />
0.200<br />
18.430<br />
Average<br />
Result<br />
above BG (a)<br />
Units<br />
.<br />
6.550 . pCi/g<br />
0.200 pCi/g<br />
18.430 pCi/g<br />
Groundwater VOA<br />
Radioactive<br />
isotopes<br />
1,1-Dichloroethene<br />
trans-l,2-Dichloroethene<br />
Trichloroet_hene<br />
Technetium-99<br />
Ural1ium<br />
1<br />
1<br />
1<br />
1<br />
1<br />
1<br />
1<br />
1<br />
1<br />
1<br />
1<br />
1<br />
1<br />
1<br />
1<br />
7.000<br />
46.000<br />
312.000<br />
41.100<br />
0.040<br />
7.000<br />
46.000<br />
312.000<br />
41.100<br />
0.040<br />
7.000<br />
46.000<br />
312.000<br />
41.100<br />
0.040<br />
ugIL<br />
ugIL<br />
ugIL<br />
pCiIL<br />
mgIL<br />
(a) Number of analyses/detections include both <strong>environmental</strong> samples and duplicate results<br />
Page 4 of4
Table 4.11. Metals detected above BG in VCRS soil at SWMU 091<br />
Sample<br />
Analytical Interval (ft bes) ReSults Lab Validation Data BG<br />
Sample Type Group Sample ID Top !Bottom Analytical Compound (mglkg) Qualifier Qualifier Assessment (mglkg)<br />
Sediment METAL 091003SAOOI 0.3 1 Aluminum 13,100.000* ? 13,000.000<br />
091004SAOOI 0.3 1 Aluminum 13,100.000 * ? 13,000.000<br />
091005SAOOI 0.3 1 Cadmium 2.930* ? 0.210<br />
0.3 1 Sodium 348.000* ? 320.000<br />
0.3 1 Zinc 163.000 ? 65.000<br />
091006SAOOI 0.3 1 Cadmium 6.530* ? 0.210<br />
0.3 Chromium 16.800 ? 16.000<br />
0.3 Mercury 0.470 ? 0.200<br />
Note: Sediment samples not containing any detectable metals at concentrations above background at SWMU 091 are:<br />
None<br />
* Result exceeds PRG screening values Page 1 of J<br />
• • •
• • •<br />
Table 4.12. Radioactive isotopes detected above BG in VCRS soil at SWMtJ 091<br />
Sample<br />
Analytical InterVal (ft b2s) Results Lab Validation Data BG<br />
Sample Type Group Sample ID Top IBottom Analytical Compound (pCilg) Qualifier QuaUfier Assessment (pCilg)<br />
~<br />
Sediment RADS 091005SAOOI 0.3 1 Cesium-I37 1.730 ? 0.490<br />
0.3 1 Plutollium-239/Z40 0.150 ? 0.000<br />
0.3 1 Thorium-230 4.330 ? 1.500<br />
0.3 1 Uranium 8.100 ? 0.000<br />
0.3 1 Uranium-234 2.600 ? 2.500<br />
0.3 1 Uranium-235 0.IS0 ? 0.140<br />
0.3 1 Uranium-238 S.400 ? 1.200<br />
091006SAOOI 0.3 1 Americium-241 0.380 ? 0.000<br />
0.3 1 Cesium-137 SO.OOO ? 0.490<br />
0.3 1 Plutonium-239/240 10.700* ? 0.000<br />
0.3 1 Technetium~99 17.300 ? 2.500<br />
0.3 1 Thorium-230 7.800 ? 1.500<br />
0.3 Uranium 13.000 ? 0.000<br />
0.3 1 Uranium-234 6.S00 ? 2.500<br />
0.3 1 Uranium-235 0.310 ? 0.140<br />
0.3 1 Uranium-238 6.500 ? 1.200<br />
* Result exceeds PRG screenin2 values Page lof2
~ -<br />
~ ~<br />
~- .<br />
-~<br />
Table 4.12. Radioactive isotopes detected above BG in VCRS s()iI at SWMU 091<br />
~<br />
Sample<br />
Analytical<br />
Interval (ft bl!s) Results Lab Validation Data<br />
Sample Type Group Sample ID Top IBottom Analytical Compound (pCilg) Qualifier Qualifier Assessment<br />
~ -<br />
BG<br />
(pCilg)<br />
Note: Sediment samples not containing any detectable radioactive isotopes at concentrations above background at SWMU 091 are:<br />
091003SAOOI 091004SAOOI<br />
Subsurface soil samples Dot containing any detectable radioactive isotopes at concentrations above background at SWMU 091 are:<br />
091002SA095<br />
* R.esult exceeds PRG screenin2 values<br />
Page 20f2<br />
• •<br />
•
• • •<br />
Table 4.13. Frequency of detectiol1 of metals and radioactive isotopes exceeding BG in SWMU 091<br />
sediment samples<br />
Sample Type<br />
Sediment<br />
Analytical Group<br />
Metals<br />
Radioactive<br />
i~otopes<br />
Analytical Compound<br />
Alummum<br />
CadmilJm<br />
Cbromium<br />
Mercury<br />
Sodium<br />
Zinc<br />
Cesium-137<br />
Plutonhil1l-239/240<br />
Thorium-230<br />
Uraniul1l<br />
Uranium-234<br />
Uranium-235<br />
Uranium-238<br />
Americium-241<br />
Technetium-99<br />
Number of<br />
Analyses (a)<br />
~ - -<br />
4<br />
4<br />
4<br />
4<br />
4<br />
4<br />
2<br />
2<br />
2<br />
2<br />
2<br />
2<br />
2<br />
2<br />
2<br />
Number of<br />
J)etections<br />
above BG (a)<br />
2<br />
2<br />
1<br />
1<br />
1<br />
1<br />
2<br />
2<br />
2<br />
2<br />
2<br />
2<br />
2<br />
I<br />
1<br />
Number of<br />
Detections<br />
above BG&<br />
PRG<br />
Screening<br />
Values (a)<br />
.- _.. _...<br />
0<br />
0<br />
1<br />
0<br />
0<br />
1<br />
0<br />
0<br />
0<br />
0<br />
0<br />
0<br />
0<br />
Maximum<br />
Result<br />
above BG (a)<br />
13,100.000<br />
6.530<br />
16.800<br />
0.470<br />
348.000<br />
163.000<br />
50.000<br />
10.700<br />
7.800<br />
13.000<br />
6.500<br />
0.310<br />
6.500<br />
0.380<br />
17.300<br />
Minimum<br />
Result<br />
above BG(a)<br />
13,100.000<br />
2.930<br />
16.800<br />
0.470<br />
348.000<br />
163.000<br />
1.730<br />
0.150<br />
4.330<br />
8.100<br />
2.600<br />
0.150<br />
5.400<br />
0.380<br />
11.300<br />
Average<br />
Result<br />
above BG (a)<br />
Units<br />
13,100.000 mg/kg<br />
4.730 mg/kg<br />
16.800 mg/kg<br />
0.470 mglkg<br />
348.000 mglkg<br />
163.000 mg/kg<br />
25.865 pCi/g<br />
5.425 pCi/g<br />
6.065 pCi/g<br />
10.550 pCi/g<br />
4.550 pCi/g<br />
0.230 pCi/g<br />
5.950 pCi/g<br />
0.380 pCi/g<br />
17.300 pCi/g<br />
(a) Number of analyses/detections include both <strong>environmental</strong> samples and duplicate results<br />
Page I of I
Table 4.14. PCB compounds detected in UCRS soil at SWMU 196<br />
- ---<br />
Sample<br />
Analytical Interval (ft bg!! Results Lab Validation Data<br />
. ~~~ple Type Group Sample ID r-ToP-l&«~m Analytical Compound (ulJlkg) Qualifier Qualifier Assessment<br />
Sludge PPCB 196001SAOOI 0 0 Polychlorinated biphenyl 100.000* ?<br />
196001SDOOI 0 0 PCB-1260 200.000* ?<br />
0 0 Polychlorinated biphenyl 200.000* ?<br />
196003SAOOI 0 0 Polychlorinated biphenyl 300.000* ?<br />
Note: Sludge samples not containing any detectable PPCB compounds at SWMU 196 are:<br />
196002SAOOI 196004SAOOI 196005SAOOI 196006SAOOI<br />
* Result exceeds PRG screening values Page 1 of 1<br />
• • •
• • •<br />
------<br />
Table 4.15. Metals detected above BG in VCRS soil at SWMV 196<br />
Sample<br />
Analytical lmel"!~l Cft bRsl Results Lab Validation Data BG<br />
Sample Type . Group . __ Sa~ple 10 Top Bottom Analytical CoDlPound (mglkg) Qualifier Qualifier Assessment (mglkg)<br />
Sludge METAL 196001SAOOI 0 0 Cadmium 12.500* ? 0.210<br />
0 0 Lead 55.100* N ? 36.000<br />
0 0 Mercury 0.540 ? 0.200<br />
0 0 Nickel 78.100 W ? 21.000<br />
0 0 Selenium 4.820 N*W ? 0.800<br />
196001SDOOI 0 0 Cadmium 6.770* ? 0.210<br />
0 0 Lead 29.300* N ? 36.000<br />
0 0 MerCIU"Y 0.240 ? 0.200<br />
0 0 Nicke! 36.700 W ? 21.000<br />
0 0 Selenium 2.130 N*W ? 0.800<br />
196002SAOOI 0 0 Mercury 2.140* ? 0.200<br />
0 0 Nickel 326.000* W ? 21.000<br />
I 96003SAOOI 0 0 Mercury 0.790 ? 0.200<br />
0 0 Silver 21.000 ? 2.300<br />
19(j004SAOOI 0 0 Mercury 0.520 ? 0.200<br />
0 0 Nick_el 88.400 W ? 21.000<br />
19600SSAOOI 0 0 Cadmium 9.180* ? 0.210<br />
* Result exceeds PRG screening values Page I of 14
Table 4.15. Metals detected above BG in UCRS soil at SWMU 196<br />
- --. --- . - ----<br />
. - .<br />
Sample<br />
Analytical Interval (ft b~s) Results Lab Validation Data BG<br />
Sample Type GrouPe Sampie ID Top IBottom Analytical Compound (mglkg) Qualifier Qualifier Assessment (mg/kg)<br />
Sludge METAL 196005SAOOI 0 0 Lead 31.500* N ? 36.000<br />
0 0 Mercury 0.340 ? 0.200<br />
0 0 Nickel 68.200 W ? 21.000<br />
0 0 Selenium 2.350 NW* ? 0.800<br />
196006SAOOI 0 0 Mercury 0.970* ? 0.200<br />
0 0 Nickel 140.000 W ? 21.000<br />
Sllrface Soil 196001SA002 0 2 Antimony 61.500* = 0.210<br />
0 2 Cadmium 1.030 = 0.210<br />
0 2 Zinc 67.100 J 65.000<br />
196002SA002 0 2 Antimony 62.200* = 0.210<br />
0 ~ Cadmium 0.970 = 0.210<br />
0 2 Calcium 216,000.000* J 200,000.000<br />
0 2 Zinc 91.100 J 65.000<br />
I 96003SA002 I 2 Cadmium 1.480 ? 0.210<br />
1 2 Sodium 331.000* ? 320.000<br />
196004SA002 0 2 Antimony 9.800* = 0.210<br />
0 2 Cadmium 0.890 = 0.210<br />
* Result exceeds PRG screenin2 values Page 2 of 14<br />
• • •
• • •<br />
Table 4.15. Metals detected above BG in VCRS soil at SWMU 196<br />
-<br />
Sample<br />
Analytical J!ltervl!l ift bg~} Results Lab Validation Data BG<br />
Sample Type Group Sample Ii> Top Bottom Analytical Compound (mglkg) Qualifier Qualifier Assessment (mglk~)<br />
_.- -<br />
Surface Soil METAL 196004SA002 0 2 Chromium 32.800 = 16.000<br />
0 2 Copper ~5.200 = 19.000<br />
0 2 Zinc 97.900 J 65.000<br />
196008SA002 0 2 Antimony 40.900* - 0.210<br />
0 2 Cadmium 0.360 = 0.210<br />
0 2 Ma~nesium 9,010.000* 7,700.000<br />
I 96009SA002 0 2 Antimony 19.000* = 0.210<br />
0 2 Cadmium 0.300 = 0.210<br />
0 2 Zinc 69.100 = 65.000<br />
196010SA002 0 2 Antimony 1.400* = 0.210<br />
196011SA002 0 2 Antimony 0.760* B = 0.210<br />
196015SA002 0 2 Cadmium 0.220 ? 0.210<br />
0 2 Ma~nesium 10,000.000 * ? 7,700.()00<br />
0 2 Nickel 172.000 ? 21.000<br />
0 2 Sodium 388,000* ? 320.000<br />
196017SA002 0 2 Aluminum 13,800.0()0 * ? 13,000.000<br />
0 2 Cadmium 0.780 ? 0.210<br />
* Result exceeds PRG screenin2 values Page 3 of 14
Table 4.15. Metals detected above Be in VCRS soil at SWMU<br />
...<br />
196<br />
Sample<br />
Analytical !!!~n.'l {ft b~} Results Lab Validation Data BG<br />
Sample Type Group Sample II> Top Bottom Analytical Compound (mg/kg) Qualifier Qualifier ASseSs~ent (mg/kg)<br />
Surface Soil METAL 196017SA002 0 2 Chromium 17.000 ? 16.000<br />
0 2 Nickel 80.100 ? 21.000<br />
0 2 Potassium 1,650.000* ? 1,300.000<br />
0 2 Sodium 418.000* ? 320.000<br />
0 2 Zinc 119.000 ? 65.000<br />
Sediment 196006SAOOI 0 1 Antimony 0.370 = 0.210<br />
0 1 Cadmium 1.830 = 0.210<br />
0 1 Sodium 322.000* B = 320.000<br />
0 1 Zinc 148.000 J 65.000<br />
196007SAOOI 0 1 Antimony 0.290 = 0.210<br />
0 1 Cadmium 2.530* = 0.210<br />
0 1 Copper 20.900 19.000<br />
0 Nickel 73.600 = 21.000<br />
0 1 Sodium 423.000* B 320.000<br />
0 1 Zinc 222.000 J 65.000<br />
Subsurface Soil 196001SA004 2 4 Antimony 39.900* = 0.210<br />
2 4 Cadmium 1.000 = 0.210<br />
... Result exceeds PRG screening values Page 4 ofl4<br />
• • •
• • •<br />
Table 4.15. Metals detected above BG in VCRS soil at SWMV 196<br />
- .-~ -.- - - --<br />
Sample<br />
Analytical In~.(ft b2S) Results Lab Validation Data BG<br />
Sample Type Group Sample ID T()P ... Bottom Analytical Compound (mglkg) Qualifier Qualifier Asse~sment (mglkg)<br />
Subsurface Soil METAL 196001SA004 2 4 Calcium 66,000.000 * J 6, 1 (}O.OOO<br />
2 4 Magnesium Z,360.000* = 2,100.000<br />
196001SA008 6 8 Antimony 1.750* == 0.210<br />
196001SAOI0 8 10 Cadmium 0.720 -- 0.210<br />
196001SDOI0 8 10 Cadmium 0.300 0.210<br />
196002SA006 4 6 Antimony 55.000* = 0.Z10<br />
4 6 Cadmium 0.550 = 0.210<br />
4 6 Calcium 86,300.000 * J 6,100.000<br />
4 6 Magnesium 2,920.000* = 2,100.000<br />
196002SA008 6 8 Anthnony 58.400* = 0.210<br />
6 8 Cadmium 0.520 = 0.210<br />
6 8 Calcium 96,900.000 * J 6,100.000<br />
6 8 Magnesium 3,670.000* = ~,100.000<br />
196002SAOI0 8 10 Antimony 58.900* = 0.210<br />
8 10 Cadmium 0.420 = 0.210<br />
8 10 Calcium 97,300.000* J 6,100.000<br />
8 10 Magnesium 3,370.000* -- 2,100.000<br />
* Result exceeds PRG screening values Pag(! 5 of 14
Table 4.15. Metals detected above BG in VCRS soil at SWMU 196<br />
Sal11ple<br />
Analytical Interval (ft b~s) Results Lab Validation Data BG<br />
Sample Type<br />
Grou~ Sample ID Top]Bottom Analytical Compound (mg/kg) Qualifier 9ualifier Assessment (mg/kg)<br />
Subsurface Soil METAL 196003SA004 3 4 Arsenic 7.990* ? 7.900<br />
3 4 Beryllium 0.960* ? 0.690<br />
3 4 Cadmiu~ 1.670 ? 0.210<br />
3 4 Chromium 66.000 ? 43.000<br />
3 4 Iron 30,200.000 * ? 28,000.000<br />
3 4 Vanadium 62.500* ? 37.000<br />
J96004SA004 2 4 Antimony 1.740* = 0.210<br />
2 4 Nickel 54.400 = 22.000<br />
J96004SA006 4 6 Antimony 1.180* = 0.210<br />
4 6 Magnesium 2,160.000* = 2,100.000<br />
4 6 Zinc 86.800 J 60.000<br />
196004SA008 6 8 Antimony 0.900* B = 0.210<br />
196004SAOIO 8 to Antimony 1.020* = 0.210<br />
196008SA004 2 4 Manganese 1,370.000* = 820.000<br />
196008SA006 4 6 Antimony 6.260* = 0.210<br />
4 6 Calcium 11,800.000 * .... 6,100.000<br />
19600S8A008 6 8 Zinc 94.700 = 60.000<br />
* Result exceeds PRG screenin= values Page 6 of 14<br />
• • •
• • •<br />
Table 4.15. Metals detected - above BC in VCRS soil at SWMU 196<br />
. ~ ~<br />
Sample<br />
Analytical Interval (r!J!m Results tab Valiciation Data BG<br />
Sample Type Group Sample ID Top I BottoD:l Analytical Compound (mg/kg) Qualifier Qualifier Assessment (mW"g)<br />
---<br />
Subsurface Soil METAL 196008SAOIO 8 10 Antimony 1.850* = 0.210<br />
8 10 Nickel 27.500 = 22.000<br />
196008SD008 6 8 Aluminum 12,700.000 * = 12,000.000<br />
6 8 Barium 292.000* = 170.000<br />
6 8 Zinc 88.600 - 60.000<br />
1960095A004 2 4 Beryllium 0.710* = 0.690<br />
196009SA006 4 6 Zinc 94.800 = 60.000<br />
196010SA004 2 4 Antimony 1.540* = 0.210<br />
2 4 Beryllium 0.750* = 0.690<br />
2 4 Vanadium 37.300* = 37.000<br />
196010SA008 6 8 Antimony 1.120 * = 0.210<br />
196010SAOIO 8 10 Antimony 1.270* = 0.210<br />
8 10 Zinc 61.700 J 60.000<br />
1960JJSA004 2 4 Antimony 0.830* B = 0.210<br />
196011SA006 4 6 Aluminum 12,100.000 * j 12,000.000<br />
4 6 Antimony 1.300* 0.210<br />
4 6 Cobalt 19.800 = 13.000<br />
* Result exceeds PRG screening values Page 7 of 14
Table 4.15. Metals detected above BG in VCRS soil at SWMV 196<br />
Sample<br />
Analytical Interval (ft b2S) Results Lab Validation Data BG<br />
Sample Type Group Sample ID Top /Bottom Analytical Compound (mg/kg) Qualifier Qualifier Assessment (mglkg)<br />
Suhsurface Soil METAL 196011SA006 4 6 Magnesium 2,480.000* _. 2,100.000<br />
4 6 Manganese 1,980.000* J 820.000<br />
196011SA008 6 8 Antimony 1.310* = 0.210<br />
6 8 Cobalt 13.800 = 13.000<br />
196011SAOI0 tl 10 Antimony 1.440* = 0.210<br />
8 10 Beryllium 0.800* = 0.690<br />
8 10 Vanadium 43.800* = 37.000<br />
196013SA004 2 4 Cadmium 0.460 ? 0.210<br />
2 4 Calcium 11 ,900.000 * ? 6,100.000<br />
2 4 Magnesium 2,160.000* ? 2,100.000<br />
196013SA006 4 6 Alumitmln 15,000.000 * ? 12,000.000<br />
4 6 Antim()ny 121.000* ? 0.210<br />
4 6 Beryllium 113.000* ? 0.690<br />
4 6 Cadmium 116.000* ? 0.210<br />
4 6 Chromium 112.000 ? 43.000<br />
4 6 Cobalt 112.000 ? 13.000<br />
4 6 Copper 112.000 ? 25.000<br />
* Result exceeds PRG screening values Page 8 of 14<br />
• • •
• • •<br />
Table 4.15. Metals detected above BG in VCRS soil at SWMV 196<br />
Sample<br />
Analytical J!1~e~l- Cft b~ Results Lab Validation Data BG<br />
Sample Type Group Sample ID Top Botto ll1 ~nalxtical Compound (rng/kg) Qualifier Qllalifier Assessment (mglkg)<br />
Subsurface Soil METAL 196013SA006 4 6 Lead 116.000· ? 23.000<br />
4 6 Magnesium 5,660.000· ? 2,100.000<br />
4 6 Nickel 112.000 ? 22.000<br />
4 6 Potassium 6,430.000· ? 950.000<br />
4 6 Silver 65.400· ? 2.700<br />
4 6 Sodium 5,920.000· ? 340.000<br />
4 6 Thallium J14.000· ? 0.340<br />
4 6 Zinc 119.000 ? 60.000<br />
196013SAOI0 8 10 Aluminum 12,900.000 • ? 12,000.000<br />
196013SA018<br />
-- -- -" -<br />
16 18 NiCkel 24.700 ? 22.000<br />
196014SA004 2 4 Cadmium 0.300 ? O.~IO<br />
2 4 Calcium 30,600.000 • ? 6,100.000<br />
2 4 Magnesium 3,220.000· ? 2,100.000<br />
2 4 Nickel 587.000· ? 22.000<br />
2 4 Zinc 62.800 ? 60.000<br />
196014SA006 4 6 Calcium 223,000.000· ? 6,100.000<br />
4 6 Magnesium 3,400.000· ? 2,100.000<br />
• Result exceeds PRe; screening values Page 9 of 14
Table 4.15. Metals detected above BG in UCRS soil at SWMU 196<br />
--<br />
Sample<br />
Analytical Interval (ft b2S) Results Lab Validation Data BG<br />
Sample T~pe Grou~<br />
Sample ID Top iBoUom Analytical Compound (mg/kg) Qualifier Qualifier Assessment (mg/kg)<br />
Subsurface Soil METAL 196014SA006 4 6 Nickel 47.900 ? 22.000<br />
4 6 Selenium 2.130 ? 0.700<br />
4 6 Sodium 408.000* ? 340.000<br />
4 6 Zinc 1,650.000 ? 60.000<br />
196014SA008 6 8 Barium 178.000 ? 170.000<br />
6 8 Beryllium 0.800* ? 0.690<br />
6 8 Ma~l1esium 2,110.000* ? 2,100.000<br />
196014SAOI0 8 10 Cadmium 3.050* ? 0.210<br />
8 10 Calcium 42,000.000 * ? 6,100.000<br />
8 10 Selenium 3.930 ? 0.700<br />
8 10 Zinc 445.000 ? 60.000<br />
196014SA016 14 16 Sodium 373.000* ? 340.000<br />
196014SA018 16 18 Calcium 7,980,000* ? 6,100.000<br />
196015SA006 4 6 Aluminum 13,700.000 * ? 12,000.000<br />
4 6 Barium 389.000* ? 170.000<br />
4 6 Calcium 74,200.000 * ? 6,100.000<br />
4 6 Magnesium 2,390.000* ? 2,100.000<br />
* Result exceeds PRG screening values Page 10 of 14<br />
• • •
• • •<br />
Table 4.15. Metals detected above BG in VCRS soil at SWMV 196<br />
Sample<br />
Analytical Interval (ft bas) Results Lab Validation Data BG<br />
Sample Type Group Sample ID Top IBottom Analytical Compound (mglkg) Qualifier Qualifier Assessment (mglkg)<br />
Subsurface Soil METAL 196615SA666 4 6 Nickel 365.666* ? 22.666<br />
4 6 Potassium 2,196.666* ? 956.666<br />
4 6 Sodium 519.666* ? 346.666<br />
1966158A668 6 8 Beryllium 6.946* ? 6.696<br />
6 8 Iron 29,666.666 * ? 28,666.666<br />
196615SA616 8 16 Aluminum 17;966.666* ? 12,666.666<br />
8 16 Barium 189.000 ? 176.666<br />
8 16 Nickel 29.566 ? n.666<br />
8 16 Potassium 1,686.666* ? 956.666<br />
8 16 Zinc 156.666 ? 6.0.666<br />
196615SA614 12 14 Aluminum 13,966.666 * ? 12,666.666<br />
196615SA618 16 18 Aluminum 12,666.666 '" ? 12,666.66()<br />
16 18 Sodium 344.666* ? 346.666<br />
16 18 Zinc 96.366 ? 66.666<br />
196615S0664 2 4 Calciurn 6,296.666* ? 6,166.666<br />
196617SA664 2 4 Arsenic 8.746* ? 7.966<br />
2 4 Calcium 8,756.666* ? 6,166.666<br />
* Result exceeds PRG screening values Page 11 of 14
Table 4.15. Metals detected above BG in VCRS soil at SWMV 196<br />
-<br />
Sample<br />
Analytical Interval (ft b2s) Results Lab Validation Data BG<br />
Sample Type<br />
Grou~<br />
Sample ID Top lBottom Analytical Compound (mglkg) Qualifier .9ualifier Assessment (mglkg)<br />
Subsurface Soil METAL 1960 17SA006 4 6 Aluminum 16,900.000 * ? 12,000.000<br />
4 6 Calcium 20,000.000 * ? 6,100.000<br />
4 6 Magnesium 3,450.000* ? 2,100.000<br />
4 6 Potassium 1,400.000* ? 950.000<br />
4 6 Zinc 91.800 ? 60.000<br />
196017SAOtO 8 to Aluminum 15,500.000* ? 12,000.000<br />
8 10 Barium 172.000 ? 170.000<br />
8 10 Ma~nesium 2,520.000* ? 2,100.000<br />
8 10 Zinc 92.000 ? 60.000<br />
196017SA014 12 14 Calcium 7,260.000* ? 6,100.000<br />
196017SAOl8 16 18 Magnesium 2,220.000* ? 2,100.000<br />
1960178A020 18 20 Mercury 0.140 ? 0.130<br />
196018SA004 2 4 Aluminum 15,900.000 * ? 12,000.000<br />
Z 4 Magnesium 2,590.000* ? 2,100.000<br />
196018SA006 4 6 AlultJinum 16,500.000 * ? 12,000.000<br />
4 6 Calcium 10,700.000 * ? 6,100.000<br />
4 6 Ma2nesium 3,430.000* ? 2,100.000<br />
* Result exceeds PRG screening values Page 12 of 14<br />
• • •
-<br />
• • •<br />
Table 4.15. Metals detected above BG in VCRS soil at SWMU 196<br />
- - . -<br />
Sample<br />
Analytical Interval Cft bes) Results L~b Validation Data BG<br />
Sample Type Group Sample ID Top IBottom Analytical Compound (mglkg) Qualifier Qualifier AsseSsment (mg/kg)<br />
..<br />
Subsurface Soil METAL 19601SSA006 4 6 Potassium 1,090.000· ? 950.000<br />
4 6 Thallium 0.570· B ? 0.340<br />
19601SSAOOS 6 S Aluminum 14,SOO.000 • ? 12,000.000<br />
6 S Barium 190.000 ? 170.000<br />
6 S Ma2nesium 2,730.000· ? 2,100.000<br />
196018SAOI0 8 10 Aluminum 15,100.000 • ? 12,000.000<br />
S 10 Magnesium 2,160.000· ? 2,100.000<br />
19601SSA014 12 14 Aluminum 14,200.000 • ? 12,000.000<br />
12 14 Barium 194.000 ? 170.000<br />
12 14 Ma~nesiurn 2,180.000· ? 2,100.000<br />
12 14 Zinc 77.400 ? 60.000<br />
196018SA018 16 18 Aluminum 12,600.000· ? 12,000.000<br />
16 18 Cobalt 14.300 ? 13.000<br />
16 18 Ma2nesium 2,200.000* ? 2,100.000<br />
16 18 Man2anese 855.000* ? 820.000<br />
1960 18SD008 6 8 Aluminum 14,800.000 • ? 12,000.000<br />
6 8 Barium 187.000 ? 170.000<br />
• Result exceeds PRG screenhlR values Page 13 of 14
- -<br />
Table 4.15. Metals detected above BG in UCRS soil at SWMU 196<br />
Sample<br />
Analytical<br />
Interval (ft bes)<br />
Sample Type Group Sample ID Top - I Bottom Analytical Compound<br />
Results<br />
(mg/kg)<br />
Lab<br />
Qualifier<br />
Validation<br />
Qualifier<br />
Data<br />
Assessment<br />
BG<br />
bng/kg)<br />
Subsurface Soil METAL 196018SD008 6 8 Ma~nesium<br />
2,670.000*<br />
?<br />
:2,100.000<br />
6 8 Thallium<br />
0.560*<br />
B<br />
?<br />
0.340<br />
6 8 Zinc<br />
63.700<br />
Note: Siudee samples not containing any detectable metals at concentrations above background at SWMU 196 are:<br />
None<br />
?<br />
60.000<br />
Surface soil samples not containine any detectable metals at concentrations above background at SWMU 196 are:<br />
196013SA002 196014SA002 196018SA002<br />
Sediment samples not containing any detectable metals at concentrations above background at SWMU 196 are:<br />
None<br />
Subsurface soil samples not containinJt any detectable metals at concentrations above back~ro"-nd at SWMU 196 are:<br />
196003SA006 196003SA008 196009SA008 196009SAOI0 196010SA006 196013SA008 196013SA012 196013SA014 196013SA016<br />
196013SA020 196014SA012 196014SA014 196014SA020 196015SA004 196015SA012 196015SA016 196015SA020 196017SA008<br />
196017SAOt2 1960t7SA016 t96018SAOt2 t96018SA016 196018SA020<br />
* Result exceeds PRG screenin~ values Page 14 of 14<br />
• • •
• • •<br />
Table 4.16. Radioactive isotopes detected above BG in VCRS soil at SWMU 196<br />
- - - '<br />
-- _ .. - .----<br />
- -- -- -- ... -- -.. - --- -<br />
Sample<br />
Analytical Interval (ft b~t Results Lab Validation Data BG<br />
Sample Type Group Sample ID Top I Bottom Analytical Compound (pCilg) Qualifier Qualifier Assessment (pCilg)<br />
Sludge RADS 19600lSAOOI 0 0 Neptunium-237 0.~90 ? 0.100<br />
0 0 Technetium-99 30.000 ? 2.S00<br />
0 0 Uranium 10.000 ? 0.000<br />
196001SDOOI 0 0 Neptunium-237 0.290 ? 0.100<br />
0 0 Technetium-99 40.000 ? 2.S00<br />
0 0 Uranium 10.000 ? 0.000<br />
196002SAOOI 0 0 Neptunium-237 0.120 ? 0.100<br />
0 0 Technetium-99 20.000 ? 2.S00<br />
0 0 Uranium 7.400 ? 0.000<br />
196003SAOOI 0 0 Neptllnillm-237 0.070 ? 0.100<br />
0 0 Technetillm-99 10.000 ? 2.S00<br />
0 0 Uranilllll 3.S00 ? 0.000<br />
196004SAOOI 0 0 Pllltonillm-239/240 0.160 ? O.()OO<br />
0 0 Technetium-99 9.600 ? 2.S00<br />
0 0 Uranium 10.000 ? 0.000<br />
19600SSAoOl 0 0 Neptunium-237 0,140 ? 0.100<br />
0 0 Technetillm-99 40.000 ? 2.S00<br />
* Result exceeds PRGscreenJilg values Page 1 of S
-- .<br />
Table 4.16. Radioactive isotopes detected above BG in VCRS soil at SWMV 196<br />
. - - .<br />
Sample<br />
Analytical !1~ten:'~I~l Results Lab Validation Data BG<br />
Sample Type Group Sample ID Top Bottom Analytical Compound (pCilg) Qualifier Qualifier Assessment (pCilg)<br />
Slud~e RADS 196005SAOO 1 0 0 Uranium 10.000 ? 0.000<br />
196006SAOO 1 0 0 Plutonium-239/240 3.160 ? 0.000<br />
0 0 Uranium 10.000 ? 0.000<br />
0 0 Uranium-235 0.640 ? 0.140<br />
Surface Soil 196008SA002 0 2 Uranium 2.500 ? 0.000<br />
0 2 Uranium-238 1.300 ? 1.200<br />
Sediment 196006SAOO 1 0 1 Neptunium-237 0.680 ? 0.100<br />
0 Technetium-99 33.400 ? 2.500<br />
0 Uranium-238 3.100 ? 1.~00<br />
196007SAO() 1 () Technetium-99 12.300 ? 2.5()0<br />
0 1 Uranium 3.900 ? 0.000<br />
0 Uranium-238 2.300 ? 1.200<br />
Subsurface Soil 196001SAOIO 8 10 Americium-241 0.180 ? 0.000<br />
8 10 Uranium 2.800 ? 0.000<br />
8 10 Uranium-238 2.000 ? 1.200<br />
196001SDOI0 8 10 Uranium 2.600 ? 0.000<br />
8 10 Uranium-238 1.900 ? 1.200<br />
* Result exceeds PRG screening values Page 20f5<br />
• • •
• • •<br />
Table 4.16. Radioactive isotopes detected above BG in VCRS soil at SWMU 196<br />
-<br />
- -- -- ---<br />
Sample<br />
Analytical !nterv~rft~£S} Results Lab Validation Data BG<br />
Sample Type Group Sample ID Top Bottom Analytical Compound (pCilg) Qualifier Qualifier Assessment (pCilg)<br />
Subsurface Soil RADS 196002SA006 4 6 Uranium 5.000 ? 0.000<br />
4 6 Uranium-238 3.000 ? 1.200<br />
196004SA004 2 4 Nepttinium~237 0.060 ? 0.000<br />
2 4 Uranium 3.900 ? 0.000<br />
2 4 Uraniilln-~38 1.900 ? 1.200<br />
1 96004SA010 8 10 Uranium 1.600 ? 0.000<br />
196008SA004 2 4 1'11IIonillm-239/240 0.110 ? 0.000<br />
2 4 Uranium 3.100 ? 0.000<br />
2 4 Uranium-238 1.900 ? 1.200<br />
1 96008SA006 4 6 Technetium-99 5.000 ? 2.800<br />
4 6 Ura .. iulJ1 2.200 ? 0.000<br />
196008SA008 6 8 Uranium 2.500 ? 0.000<br />
196008SAOIO 8 10 Uranium 1.600 ? 0.000<br />
8 10 Uranium-238 1.400 ? 1.200<br />
196008SD008 6 8 Uranium 2.500 ? 0.000<br />
6 8 Uranium-238 1.700 ? 1.200<br />
1 96009SA008 6 8 Plutonium-239/240 0.070 ? 0.000<br />
* Result exceeds PRG screenina values Page 3 of5
Sample Type<br />
Subsurface Soil<br />
Table 4.i6. RJdioactive isotopes detected above BG - in VCRS - . soil at SWMU 196<br />
Analytical<br />
Grou~<br />
RADS<br />
I<br />
I<br />
Sample Iq<br />
I<br />
196009SAOI0<br />
I<br />
Sample<br />
Interval (ft b~s)<br />
Top .1 Bottom<br />
8 10<br />
Results Lab Validation Data<br />
Analytical Compound (pCilg) Qualifier Qualifier Assessment<br />
Plutonium-239/240 0.190 ?<br />
BG<br />
(pCilg)<br />
-<br />
0.000<br />
8 10<br />
Uranium 1.700 ?<br />
0.000<br />
196010SA004<br />
196010SAO~<br />
2 4<br />
4 6<br />
Uranium 2.000 ?<br />
Uranium 2.500 ?<br />
0.000<br />
0.000<br />
4 6<br />
Uranium"238 1.550 ?<br />
1.200<br />
196010SA008<br />
6 8<br />
Uranium 1.700 ?<br />
0.000<br />
1960llSAOOf<br />
2 4<br />
Uranium 1.800 ?<br />
0.000<br />
I<br />
196011SA006<br />
2 4<br />
4 6<br />
tlranium-238 1.500 ?<br />
Uranium 2.000 ?<br />
1.200<br />
0.000<br />
1<br />
4 6<br />
Uranium-238 1.400 ?<br />
1.200<br />
\<br />
196011SA008<br />
6 8<br />
Uranium 2.600 ?<br />
0.000<br />
6 8<br />
Uranium-~38 2.100 ?<br />
1.200<br />
196011SAOI0<br />
8 10<br />
Uranium 2.200 ?<br />
0.000<br />
* Result exceeds PRG screenin2 values<br />
Page 4 or5<br />
•<br />
•<br />
•
• • •<br />
.- .<br />
Table 4.16. Radioactive isotopes detected above BG in UCRSsoil at SWMU 196<br />
-<br />
Sample<br />
Analytical<br />
Interval (ft b2S) Results Lab Validation Data BG<br />
Sample Type Group Sample ID Top I Bottom Analytical Compound (pCil~) Qualifier Qualifier Assessment (pCilg)<br />
Note: SIud2e samples not containing any detectable radioactive isotopes atcol1centrations above background at SWMU 196 are:<br />
None<br />
Surface soil samples not containin2 any detectable radioactive isotopes at concentrations above back2round at SWMU 196 are:<br />
196001SA002 196002SA002 196003SA002 196004SA002 196009SA002 196010SA002 196011SA002 196013SA002 196014SA002<br />
196015SA002 196017SA002 19601SSA002<br />
Sediment samples not containing any detectable radioactive isotopes at concentrations above background at SWMU 196 are:<br />
1 96006SAOO1 196007SAOOI<br />
Subsurface soil samples not containin2 any detectable radioactive isotopes at concentrations above back2round at sWMtJ 196 are:<br />
196001SA004 196001SAOO8 196002SAOO8 196002SAOIO 19600JSAOO4 19600JSAOO6 I 96003SA008 196004SA006 196004SAOOS<br />
196009SA004 196009SA006 196010SAOI0 196013SA004 196013SAOO6 196013SAOOS 196013SAOI0 196013SA012 196013SA014<br />
196013SA016 196013SAOIS 196013SA020 196014SA004 196014SA006 196014SAOOS 196014SAOI0 196014SA012 196014SA014<br />
196014SA016 196014SAOIS 196014SA020 196015SA004 196015SA006 196015SAOOS 196015SAOI0 196015SA012 19601S8A014<br />
196015SA()16 196015SAOIS 196015SA020 196015SD004 196017SA004 196017SA006 196017SAOOS 196017SAOIO 1960178A012<br />
196017SA014 196017SA016 196017SAOIS 196017SA020 19601SSA004 19601SSA006 19601SSAOOS 19601SSAOI0 19601SSA012<br />
19601SSA014 19601S8A016 19601S8AOlS 19601SSA020 196018SD008<br />
* Result exceeds PRG screenin2 values Page 5 of5
Table 4.17. Frequency of detection of organic compounds, metals, and radioactive isotopes exceeding BG<br />
in SWMU 196 sludge, surface soil, sediment and UCRS soil samples<br />
Sample Type<br />
Sludge<br />
Surface<br />
soil<br />
Analytical Group<br />
PCB<br />
Metals<br />
Radioactive<br />
isotopes<br />
Metals<br />
Radioactive<br />
isotopes<br />
--<br />
Analytical Compound<br />
. .<br />
Polychlonnated biphenyl<br />
PCB-1260<br />
Mercury<br />
Nickel<br />
Cadmium<br />
Lead<br />
Selenium<br />
Silver<br />
Technetium-99<br />
Uranium<br />
Neptunium-237<br />
Plutonium-239/240<br />
Uranium-235<br />
Cadmium<br />
Antimony<br />
Zinc<br />
Sodium<br />
Chromium<br />
Magnesium<br />
Nickel<br />
Aluminum<br />
Calcium<br />
Copper<br />
Potassium<br />
Uranium<br />
Number of<br />
Analyses (a)<br />
7<br />
1<br />
7<br />
7<br />
7<br />
7<br />
7<br />
7<br />
7<br />
7<br />
7<br />
7<br />
1<br />
13<br />
13<br />
13<br />
13<br />
13<br />
13<br />
13<br />
13<br />
13<br />
13<br />
13<br />
5<br />
Number of<br />
Detections<br />
above BG (a)<br />
3<br />
1<br />
7<br />
6<br />
3<br />
3<br />
3<br />
1<br />
7<br />
7<br />
6<br />
2<br />
1<br />
8<br />
7<br />
5<br />
3<br />
2<br />
2<br />
2<br />
1<br />
1<br />
I<br />
I<br />
I<br />
Number of<br />
Detections<br />
above BG &<br />
PRG<br />
Screening<br />
Values (a)<br />
3<br />
1<br />
2<br />
1<br />
3<br />
3<br />
o<br />
o<br />
o<br />
o<br />
o<br />
o<br />
o<br />
o<br />
7<br />
o<br />
3<br />
o<br />
2<br />
o<br />
1<br />
I<br />
o<br />
1<br />
o<br />
Maximum<br />
Result<br />
above BG (a)<br />
300.000<br />
200.000<br />
2.140<br />
326.000<br />
12.500<br />
55.100<br />
4.820<br />
21.000<br />
40.000<br />
10.000<br />
0.290<br />
3.160<br />
0.640<br />
1.480<br />
62.~00<br />
119.000<br />
418.000<br />
32.800<br />
10,000.000<br />
172.000<br />
13,800.000<br />
216,000.000<br />
25.200<br />
1,650.000<br />
2.500<br />
_.<br />
Minimum<br />
Result<br />
above BG(a)<br />
100.000<br />
200.000<br />
0.240<br />
36.700<br />
6.770<br />
29.300<br />
2~130<br />
21.000<br />
9.600<br />
3.500<br />
0.070<br />
0.160<br />
0.640<br />
0.220<br />
0.760<br />
67.100<br />
331.000<br />
17.000<br />
9,010.000<br />
80.100<br />
13,800.000<br />
216,000.000<br />
25.200<br />
1,650.000<br />
2.500<br />
Average<br />
Result<br />
aboveBG (e)<br />
200.000<br />
200.000<br />
0.791<br />
U2.900<br />
9.483<br />
38.633<br />
3.100<br />
21.000<br />
24.229<br />
8.700<br />
0.170<br />
1.660<br />
0.640<br />
0.754<br />
27.937<br />
88.960<br />
379.000<br />
24.900<br />
9,505.000<br />
126.050<br />
13,800.000<br />
216,000.000<br />
25.200<br />
1,650.000<br />
2.500<br />
Units<br />
uglkg<br />
uglkg<br />
mglkg<br />
mglkg<br />
mglkg<br />
mglkg<br />
mg/kg<br />
mglkg<br />
pCi/g<br />
pCi/g<br />
pCi/g<br />
pCilg<br />
pCilg<br />
mglkg<br />
mglkg<br />
mglkg<br />
mglkg<br />
mglkg<br />
mglkg<br />
mglkg<br />
mglkg<br />
mglkg<br />
mglkg<br />
mglkg<br />
pCi/g<br />
• •<br />
(a) Number of analyses/detections include both <strong>environmental</strong> samples and duplicate resulls<br />
Page I of 3<br />
•
• • •<br />
Table 4.17. Frequency of detection of organic compounds, metals, and radioactive isotopes exceeding BG<br />
in SWMV 196 sludge, surface soil, sediment and VCRS soil samples<br />
Sample Type<br />
Surface<br />
soil (cont.)<br />
Sediment<br />
Analytical Group<br />
.<br />
Radioactive<br />
isotopes (cont.)<br />
Metals<br />
Radioactive<br />
isotopes<br />
Analytical Compound<br />
Uranium-238<br />
Antimony<br />
Cadmium<br />
Nickel<br />
Sodium<br />
Zinc<br />
Copper<br />
Technetium-99<br />
Uranium<br />
Uranium-23S<br />
Neptunium-237<br />
Plutoniutn-2391240<br />
Number of<br />
Analyses (a)<br />
Number of<br />
Detections<br />
above JIG (a)<br />
5 1<br />
2 2<br />
2 2<br />
2 2<br />
2 2<br />
2 2<br />
2 1<br />
2 2<br />
2 2<br />
2 2<br />
2 I<br />
2 1<br />
Number of<br />
Detections<br />
aboveBG &<br />
PRG<br />
Screening<br />
Values(al<br />
o<br />
0<br />
1<br />
0<br />
2<br />
0<br />
0<br />
0<br />
0<br />
0<br />
0<br />
0<br />
Maximum Minimum Average<br />
Result Result Result Units<br />
above BG (a) above BG(al above BG(al<br />
_ .. _--<br />
1.300 1.300<br />
.<br />
1.300 pCi/g<br />
0.370 0.290 0.330 mglkg<br />
2.530 1.830 2.180 mg/kg<br />
73.600 31.700 52.650 mg/kg<br />
423.000 322.000 372.500 mg/kg<br />
222.000 14S.000 IS5.000 rilg/kg<br />
20.900 20.900 20.900 mg/kg<br />
33.400 12.300 22.S50 pCi/g<br />
5.000 3.900 4.450 pCi/g<br />
3.100 2.300 2.700 pCi/g<br />
0.6S0 0.680 0.6S0 pCi/g<br />
0.370 0.370 0.370 pCi/g<br />
Subsurface<br />
soil<br />
Metals<br />
Magnesium<br />
Antimony<br />
Aluminum<br />
Calcium<br />
Zinc<br />
Cadmium<br />
Barium<br />
Nickel<br />
Beryllium<br />
Potassium<br />
Sodium<br />
Cobalt<br />
78 22<br />
78 19<br />
78 17<br />
78 16<br />
78 15<br />
78 11<br />
78 8<br />
78 8<br />
78 7<br />
78 5<br />
78 5<br />
78 4<br />
22<br />
19<br />
17<br />
16<br />
0<br />
2<br />
2<br />
2<br />
7<br />
5<br />
5<br />
0<br />
5,660.000 2,110.000 2,820.455 mg/kg<br />
121.000 0.830 IS.774 mg/kg<br />
17,900.000 12,100.000 14,535.294 mg/kg<br />
223,000.000 6,290.000 50,061.250 mg/kg<br />
1,650.000 61.700 218.307 mg/kg<br />
116.000 0.300 11.363 mg/kg<br />
389.000 172.000 223.875 mg/kg<br />
587.000 24.700 156.000 mg/kg<br />
113.000 0.710 16.851 mg/kg<br />
6,430.000 1,080.000 2,438.000 mg/kg<br />
5,920.000 344.000 1,512.800 mg/kg<br />
112.000 13.800 39.975 mg/kg<br />
(8) Number of analyses/detectio~ include both <strong>environmental</strong> samples and duplicate results<br />
Page 20f3
Table 4.17. Frequency of detection of organic compounds, metals, and radioactive isotopes exceeding BG<br />
in SWMtJ 196 sludge, surface soil, sediment and UCRS soil samples<br />
Sample Type<br />
-<br />
Subsurface<br />
soil (conL)<br />
Analytical Group<br />
-<br />
Metals (cont.)<br />
Radioactive<br />
isotopes<br />
Analytical Compound<br />
Manganese<br />
Thallium<br />
Vanadium<br />
Arsenic<br />
Chromium<br />
Iron<br />
Selenium<br />
Copper<br />
Lead<br />
Mercury<br />
Silver<br />
Uranium<br />
Uranium-238<br />
Plutonium-239/240<br />
Americium-241<br />
Neptunium-237<br />
Technetium-99<br />
Number of<br />
Analyses (a)<br />
78<br />
78<br />
78<br />
78<br />
78<br />
78<br />
78<br />
78<br />
78<br />
78<br />
78<br />
25<br />
25<br />
25<br />
25<br />
25<br />
25<br />
Number of<br />
Detections<br />
above BG (a)<br />
3<br />
3<br />
3<br />
2<br />
2<br />
2<br />
2<br />
I<br />
1<br />
1<br />
I<br />
18<br />
11<br />
3<br />
I<br />
J<br />
Number of<br />
Detections<br />
above BG &<br />
PRG<br />
Screening<br />
Values (a)<br />
3<br />
3<br />
3<br />
2<br />
o<br />
2<br />
o<br />
o<br />
1<br />
o<br />
I<br />
o<br />
o<br />
o<br />
o<br />
o<br />
o<br />
Maximum<br />
Result<br />
above BG (a)<br />
1,980.000<br />
114.000<br />
62.500<br />
8.740<br />
112.000<br />
30,200.000<br />
3.930<br />
112.000<br />
116.000<br />
0.140<br />
65.400<br />
5.000<br />
3.000<br />
0.190<br />
0.180<br />
0.060<br />
5.000<br />
Minimum<br />
Result<br />
above BG(a)<br />
855.000<br />
0.560<br />
37.300<br />
7.990<br />
66.000<br />
29,600.000<br />
2.130<br />
112.000<br />
116.000<br />
0.140<br />
65.400<br />
1.600<br />
1.400<br />
0.070<br />
0.180<br />
0.060<br />
5.000<br />
-.<br />
Average<br />
Result<br />
aboveBG (a)<br />
1,401.667<br />
38.377<br />
47.867<br />
8.365<br />
89.000<br />
29,900.000<br />
3.030<br />
112.000<br />
116.000<br />
0.140<br />
65.400<br />
2.461<br />
1.850<br />
0.123<br />
0.180<br />
0.060<br />
5.000<br />
Uilits<br />
mg/kg<br />
mg/kg<br />
mglkg<br />
mg/kg<br />
mg/kg<br />
mg/kg<br />
mg/kg<br />
mg/kg<br />
mglkg<br />
mglkg'<br />
mg/kg<br />
pCi/g<br />
pCi/g<br />
pCi/g<br />
pCi/g<br />
P Cit .. -g<br />
pCi/g<br />
• •<br />
(a) Number of analyses/detections include both <strong>environmental</strong> samples and duplicate results<br />
•<br />
Page 3 of3
• • •<br />
Table 4.18. VOA compounds detected in VCRS soil at C-720 Complex<br />
- -- .. -""<br />
-- --<br />
Sample<br />
Analytical Interval (ft b2S) Results Lab Validation Data<br />
Sample Type Group Sample JD Top IBottom Analytical Compound (ug/kg) Qualifier Qualifier Assessment<br />
Sludge VOA 720025SAOOI 1 1 l,l-Dichloroethene 2,800.000* ?<br />
1 Trichloroethene 420,000.000 * EX ?<br />
Subsurface Soil 720001SA020 22 23.5 Vinyl chloride 400.000* J ?<br />
720002SAOO5 5 5.5 cis-l ,2-Dichloroethene 3,200.000 j ? BL-T J<br />
5 5.5 Trichloroethene 37.000 J ? BL-T J<br />
5 5.5 Vinyl chloride 400.000* J ?<br />
720002SAOIO 10 10 Trichloroethene 17,000.000 * ?<br />
10 10 Vinyl chloride 200.000* J ?<br />
720002SA015 15 15.5 cis-I ,2-Dichloroethene 750.000 J ? 81..-1' J<br />
15 15.5 trans-l ,2-Dichloroethene 450,000.000 * P ? 8L-t j<br />
IS 15.5 Trichloroethene 19,000.000* ?<br />
720002SA020 20 20.5 trichloroethene 68,000.000 * ?<br />
720002SA025 25 25.5 Trichloroethene 32,000.000 ... ?<br />
720003SA020 19 19.5 Trichloroethene 39.000 J ? BL-T J<br />
720004SA020 20 20 Tricltloroethene ~OO.OOO J ?<br />
720004SA025 25 25 1,1-Dichioroethane 70.000 J ? 01..-1' J<br />
25 25 Trichloroethene 1,300.000* ? BL-T J<br />
* Result exceeds PRG screening values Page I of4
Table 4.18. VOA compounds detected in VCRS soil at C-720 Complex<br />
Sample<br />
Analytical cfu~ervl!~l~l Results Lab Validation Data<br />
Sample Type Group Sample ID __ 1'0p Bottom Analytical Compound (uglkg) Qualifier Qualifier Assessment<br />
Subsurface Soil VOA 720004SD020 20 20 trichloroethene 300.000 J ?<br />
720005SA010 9.75 10 Acetone 4.000 BJ ?<br />
10 10 Trichloroethene 2,700.000* ?<br />
720005SA015 15 15 Trichloroethene 7,800.000* ?<br />
720005SA020 19.75 20 Acetone 7.000 BJ ?<br />
20 20 Trichlotoethene 17,000.000 * ?<br />
7200058A025 25 25 Trichloroethene 1,600.000* ?<br />
720005SA030 30 30 Trichloroethene 6,300.000* ?<br />
720005SD025 25 25 Trichloroethene 1,600.000* ?<br />
720006SA005 5 5.25 Acetone 4.000 J ?<br />
720006SAOI0 10 10.25 Acetone 10.000 ?<br />
720006SA020 ZO 20.25 Acetone 4.000 J ?<br />
720006SA045 45 45.25 2·Butanone 5.000 J ?<br />
45 45.25 Acetone 30.000 ?<br />
720007SA005 5 8 Acetone 6.000 BJ ?<br />
720007SA020 20 23 Acetone 6.000 BJ ?<br />
720007SA025 27.5 28 Trichloroethene 2,200.000* ?<br />
* Result exceeds PRG screening values Page 2 of4<br />
• • •
• • •<br />
Table 4.18. VOA compounds detected in UCRS soil at C-720 Complex<br />
- - ---<br />
Sample<br />
Sample Type<br />
Analytical !~~~Y~l(ft ~g~) Results Lab Validation Data<br />
Group Sample ID Top Bottom Analytical Compound (uglkg) Qualifier Qualifier Assessment<br />
Subsurface Soil VOA 720007SA030 32.5 33 Trichloroethene 14,000.000 * ?<br />
720007SA035 37.5 38 Trichloroethene 800.000* ?<br />
720008SA020 20 20.5 Trichloroethene 10.000 J ?<br />
720008SA025 25 25.5 Trichloroethene 400.000* J ?<br />
720008SA030 31.5 32 I,I-Dichloroethene 200.000· J ?<br />
31.5 32 Trichloroethene 1,600.000· ?<br />
720008S0020 20 20.5 Trichloroethelle 50.000 J ?<br />
720020SA020 20 20 trichloroethene 26.000 j ? J<br />
720022SA025 25 25 Trichloroethene 8.000 J ? BL-T J<br />
720027SA020 20 20 I,I-Oichloroethane 950.000 ? J<br />
20 20 Trichloroethene 5,000.000* ? J<br />
720027SA025 25 25 Trichloroethene 500.000· J ?<br />
720027SA030 30 30 Trichloroethene 8,100.000· ?<br />
720027SA035 35 35 Trichloroethene 1,800.000· ? J<br />
720027SA040 40 40 Trichloroethene 300.000 J ?<br />
720027S0035 35 35 Trichloroethene 1,800.000* ?<br />
• Result exceeds PRG screelling values<br />
Page 3 of4
~.<br />
~<br />
~ .<br />
Table 4.18. \lOA compounds detected in VCRS soil at C-720 Complex<br />
Sample<br />
Analytical Interval (ft b2S) Results Lab Validation Data<br />
Sample Type Group Sample In To., I Bottom Analytical Compound (uglkg) Qualifier Qualifier Assessment<br />
Note: Sludge samples not containing any detectable VOA compounds at C-720 Complex are:<br />
None<br />
Subsurface soil samples not containing any detectable VOA compounds at C-720 Complex are:<br />
720001SA015 720001SA025 720001SA035 720001SA040 720001SA045 720003SA005 720003SA015 720003SA025 7~0003SA030<br />
720003SA035 720003SA040 720003SA045 720004SAOIO 720004SAO 15 720004SA030 720004SA035 720004SA040 720004SA045<br />
720004SA050 720006SA015 720006SA025 720006SA030 720006SA035 720006SA040 720006SA050 720006SD030 720007SAOIO<br />
720007SA015 720007SA040 720007SA045 720008SAOIO 720008SA015 720009SA005 720009SA015 720009SA020 720009SA025<br />
720009SA030 720009SA040 720009SA045 720016SA055 720020SA015 7200205A025 720020SA030 720020SA035 720020SA040<br />
720020SA045 720020SD040 720021SA015 720021SA020 720021SA025 720021SA030 720021SA035 720021SA040 720021SA045<br />
720022SAOO5 720022SAOIO 720022SA015 720022SA020 720022SA030 720022SA035 720022SA040 720022SA045 720022SAOSO<br />
720023SA015 720023SA020 720023SA025 720023SA030 720024SA015 720024SA020 720024SA025 720024SA030 720024SA035<br />
720024SA040 720024SA045 720024SA050 720()24SD025 720027SAOOS 720027SAOIO 720027SAOIS 720027SA04S 720030SAOOS<br />
720030SAOIO 720030SA015 720030SA020 720030SA025 720030SA030<br />
* Result exceeds PRG screening values Page 4 of4<br />
• • •
• • •<br />
Table 4.19. SVOA and PCB compQunds detected in VCRS soil at C-720 Complex<br />
Sample<br />
Analytical Interval (ft b~s) Results Lab Validation Data<br />
Sample Type Group Sample ID . Top I Bottom Analytical Compound (ug/kg) Qualifier Qualifier Assessment<br />
Sludge SVOA 720025SAOOI I I Bis(2-ethylhexyl)phthalate 170,000.000 * ?<br />
PPCB I I PCB-12S4 2,700.000* D ?<br />
I I PCB~1260 700.000* D ?<br />
1 1 Polychlorinated biphenyl 3,4QO.000* () ?<br />
Subsurface Soil SVOA 720005SA030 28 31 Bis(2-ethylhexyl)phthalate 7.9.000 J ?<br />
720006SAOI0 10 13 Bis(2-ethylhexyl)phthalate 60.000 J ?<br />
720006SA015 15 18 4-Chloro-3-methylphenol 40.000* J ?<br />
720006SA030 30 35 Bis(2-ethylhexyl)phthalate 50.000 J ?<br />
720006SA035 35 38 Dis(2-ethylhexyl)phthalate 40.000 J ?<br />
720007SA005 5 8 Bis(2-ethylhexyl)phthalate 80.000 J ?<br />
720001sA020 20 23 Bis(2-ethylhexyl)phthaiate 120.000 J ?<br />
720020SA035 35 38 Ris(2-ethylhexyl)phthalate 34.000 J ?<br />
720020SA040 40 45 Bis(2-ethylhexyl)phthalate 34.000 J ?<br />
720023SA015 15 18 Bis(2-ethylhexyl}phthalate 38.000 J ?<br />
720023SA025 25 28 Bis(2-ethylhexyl)phthalate 47.000 J ?<br />
720023SA030 30 33 Bis(2-ethylhexyl)phthalate 39.000 J ?<br />
720024SA015 15 18 Bis
Table 4.19. SVOA and PCB compounds detected in tJCRSsoil at C-720 Complex<br />
Sample<br />
Analytical InterVal (ft bes) Results Lab Validation Data<br />
Sample Type Group Sample ID Top IBottom Analytical Compound (ug/kg) QuaUfier Qualifier Assessment<br />
--<br />
Subsurface Soil SVOA 720024SAOI5 15 18 Di-n-octylphthalate 51.000 J ?<br />
720024SA020 20 23 Bis(2-ethylhexyl)phthalate 620.000 ?<br />
720024SA025 25 30 Bis(2-ethylhexyl)phthalate 820.000 ?<br />
25 30 Di-n-octylphthalate 78.000 J ?<br />
720024SA030 30 33 Bis(2-ethylhexyl)phthalate 790.000 ?<br />
30 33 Di-n-octylphthalate 34.000 J ?<br />
720024SA035 35 38 Bis(2-ethylhexyl)phthalate 1,100.000 * ?<br />
3S 38 Di-n-octylphthalate 35.000 J ?<br />
720024SA040 40 43 Bis(2-ethylhexyl)phthalate 310.000 J ?<br />
720024SA045 45 48 Bis(2-ethylhexyl)phthalate 950.000* ?<br />
720024SA050 48 50 Bis(2-ethylhexyl)phthal~te 900.000* ?<br />
720024SD025 25 30 IJis(2-ethylhexyl)phthalate 890.000* ?<br />
25 30 Di-n-octylphthalate 40.000 J ?<br />
720027SA025 26 28 Bis(2-ethylhexyl)phthalate 35.000 J ?<br />
* Result exceeds PRG screening values Page 20f4<br />
• • •
• • •<br />
Table 4.19. SVOA and PCB compounds detected in VCRS soil at C-720 Complex<br />
. ---<br />
Sample<br />
Analytical Interval (ft b~ Results Lab Validation Oata<br />
Santple Type GrouJ! Sample ID Top jBottom Analytical Compound (uglkg) Qualifier Qualifier Assessment<br />
Note: SIud2e samples not containing any detectable SVOA compounds at C·720 Complex are:<br />
None<br />
SIud2e samples not containing any detectable PPCB compounds at C-720 Complex are:<br />
None<br />
Subsurface soil samples not containin2 any detectable SVOA compounds at C-720 Complex are:<br />
720001SA015 720001SA020 720001SA025 720001SA035 720001SA040 720001SA045 720002SA005 720002SA015 720002SA020<br />
720002SA025 720003SAOO5 720003SA015 720003SA020 720003SA025 720003SA030 720003SA035 720003SA 040 720003SA045<br />
720004SAOIO 720004SA015 720004SA020 720004SA025 720004SA030 720004SA035 720004SA040 720004SA045 720004SA050<br />
720004S0020 720005SA010 720005SAOIS 72000SSA020 720005SA025 720005SD025 720006SAOO5 720006SA020 720006SA025<br />
720006SA040 720006SA045 720006SA050 720006S0030 720007SAOIO 720007SA015 720007SA025 720007SA030 720007SA035<br />
720007SA040 720007SA045 720008SA010 720008SA015 720008SA020 720008SA025 720008SA030 720008S0020 720009SA005<br />
720009SA015 720009SA020 720009SA025 720009SA030 720009SA040 720009SA045 720020SA015 720020SA020 720020SA025<br />
720020SA030 720020SA045 720020S0040 720021SA015 720021SA020 720021SA025 720021SA030 720021SA035 720021SA040<br />
720021SA045 720022SA005 720022SA010 720022SA015 720022SA020 720022SA025 720022SA030 720022SA035 720022SA040<br />
720022SA045 720022SA050 720023SA020 720027SAOOS 720027SAOIO 720027SA015 720027SA020 720030SA005 720030SAOIO<br />
720030SA015 720030SAO~0 720030SA025 720030SA030<br />
~. ~<br />
* Result exceeds PRG screenin2 values Page 3 of4
Table 4.19. SVOA and PCB compounds detected in VCRS soil at C-7Z0 Complex<br />
Sample<br />
Analytical Interval (ft bgs) Results Lab Validation Oata<br />
Sample Type Group Sample tD Top IBottom Analytical Compound (ug/kgL Qualifier Qualifier Assessment<br />
Subsurface soil samples not containin~ any detectable PPCB compounds at C-720 Complex are:<br />
720001SA015 720001SA020 720001SA025 720001SA035 720001SA040 720001SA045 720002SAOOS 720002SA015 720002SA020<br />
720002SA025 720003SA005 720003SA015 720003SA020 720003SA025 720003SA030 720003SA035 720003SA040 720003SA045<br />
720004SAOIO 720004SA015 720004SA020 720004SA02S 720004SA030 720004SA035 720004SA040 720004SA045 720004SAOSO<br />
720004S0020 720005SAOIO 720005SA015 720005SA020 720005SA025 720005SA030 720005S0025 720006SA005 720006SAOIO<br />
720006SA015 720006SA020 720006SA025 720006SA030 720006SA035 720006SA040 720006SA045 720006SA050 720006S0030<br />
720007SA005 720007SAOIO 720007SA015 720007SA020 720007SA025 720007SA030 720007SA03S 720007SA040 720007SA045<br />
720008SAOIO 720008SA015 720008SA020 720008SA025 720008SA030 720008S0020 720009SA005 720009SA015 720009SA020<br />
720009SA025 720009SA030 720009SA040 720009SA045 720020SA015 720020SA020 720020SA025 720020SA030 7200Z0SA035<br />
720020SA040 720020SA04S 720020S0040 720021SA015 720021SA020 720021SA025 720021SA030 720021SA035 720021SA040<br />
720021SA045 720022SA005 720022SAOIO 720022SA015 720022SA020 720022SA025 720022SA030 720022SA035 720022SA040<br />
720022SA045 720022SA050 720023SA015 720023SA020 720023SA025 720023SA030 720024SA015 720024SA020 720024SA025<br />
720024SA030 720024SA035 720024SA040 720024SA045 nOO24SAOSO 720024SD025<br />
* Result exceeds PRG screertin2 values Page 4 of4<br />
• • •
• •<br />
T a bl e 4020 0 M eas tId e t ec t e d a b ove BG m 0 VCRS so. 01 a t C -120 C omplex I<br />
-_.- - -<br />
-<br />
-<br />
.-<br />
--<br />
Sample<br />
AnalytiCal interval Cft b~t Results Lab Validation<br />
Sample Type Group Sample ID T~illottom Analytical Compound (mglkg) Qualifier Qualifier<br />
--<br />
Sludge METAL 720025SAOOl 1 1 Cadmium 4.320* ?<br />
1 1 Chromium 724.000* N ?<br />
1 1 Lead 138.000* N ?<br />
1 1 Mercury 0.640 N ?<br />
1 1 Nickel 644.000* N ?<br />
Subsurface Soil 720001SA015 14 15.5 Cadmium 0.240 B ?<br />
720001SA040 38 42 Antimony 0.610* B ?<br />
720002SA015 12 16 Lead 139.000* ?<br />
720003SAOIS 14 18 Antimony 0.520* B ?<br />
720003SA030 30 33 Beryllium 0.750* ?<br />
720003SA045 45 48 peryllililn 0.910* ?<br />
720004SA020 17 22 Beryllium 0.790* ?<br />
17 22 Chromhlin 45.300 ?<br />
17 22 Vanadiulll 59.200* ?<br />
720004SA035 32 35 Beryllium 0.780* ?<br />
32 35 Vanadium 39.600* ?<br />
720004SD020 17 22 Vanadium 42.100* ?<br />
Data<br />
Ass~sment<br />
•<br />
--:-1<br />
~<br />
0.210<br />
16.000<br />
36.000<br />
0.200<br />
21.000<br />
0.210<br />
0.210<br />
Z3.000<br />
0.210<br />
0.690<br />
0.690<br />
0.690<br />
43.000<br />
37.000<br />
0.690<br />
37.000<br />
37.000<br />
* Result exceeds PRG screening values<br />
Page lof8
Table 4.20. Metals detected above BG in VCRS soil at C·720<br />
..<br />
Complex<br />
Sample<br />
Analytical Interval (ft bgs) Results Lab Validation Data BC;<br />
Sample Type Group Sample ID Top IBo!tom Analytical Compound (mg/kg) Qualifier Qualifier Assessment (mglkg)<br />
Subsurface Soil METAL 720005SD025 20 25 Vanadium 38.200* ? 37.000<br />
720006SA015 15 18 Cobalt 18.600 ? 13.000<br />
15 18 Sodium 343.000* ? 340.000<br />
7~0006SA020 20 23 Selenium 0.730 ? 0.700<br />
720006SA025 25 28 Beryllium 1.180* ? 0.690<br />
25 28 Cadmium 0.480 ? 0.210<br />
720006SA040 40 43 Beryllium 0.810* ? 0.690<br />
720007SA005 5 8 Barium 225.000 ? 170.000<br />
5 8 Beryllium 0.750* ? 0.690<br />
720007SA020 20 23 Beryllium 1.040 * ? 0.690<br />
20 23 Vanadium 48.800* ? 37.000<br />
720007SA025 25 28 Beryllium 0.920* ? 0.690<br />
25 28 Iron 33,700.000 * ? 28,000.000<br />
25 28 Vanadium 55,200* ? 37.000<br />
720008SA025 25 28 Beryllium 1.090* ? 0.690<br />
25 28 Vanadium 42.700* ? 37.000<br />
720008SA030 30 33 Beryllium 0.740* ? 0.690<br />
* Result exceeds PRG screening values Page 20f8<br />
• • •
. "-':- .:.:~ "","-" _ .<br />
~ -<br />
• • •<br />
Table 4.20. Metals detected above BG in UCRS soil at C-720 Complex<br />
,-, - ~<br />
Sample<br />
Analytical Interval (ft bes) Results Lab Validation Data BG<br />
Sample Type Group Sample ID Top I Bottom Analytical Compound (mg/kg) Qualifier Qualifier Assessment (mg/kg)<br />
Subsurface Soil METAL 720008SA030 30 33 Zinc 87.600 ? 60.000<br />
720009SA005 5 9 Antimony 0.530* B ? 0.210<br />
720009SA020 20 23 Beryllium 0.770* ? 0.690<br />
720009SA045 45 48 Zinc 61.500 ? 60.000<br />
720020SA020 20 23 Antimony 0.550* B ? 0.210<br />
20 23 Beryllium 1.400* ? 0.690<br />
20 23 Chromium 45.800 ? 43.000<br />
20 Z3 Iron 36,900.000 * ? 28,000.000<br />
20 Z3 Vanadium 50.400* ? 37.000<br />
720020sb040 40 45 Zinc 78.400 ? 60.000<br />
720021SAOl5 IS IS Chromiurn 71.800 ? 43.000<br />
720021SA020 20 23 Aluminum 12,100.000* ? 12,000.000<br />
720022SA005 5 8 Sodium 486.000* ? 340.000<br />
720022SAOI0 10 13 Cobalt 14.000 ? 13.000<br />
10 13 Sodiurn 470.000* ? 340.000<br />
720022SAOIS IS 18 Sodium 481.000* ? 340.000<br />
720022SA020 20 23 Beryllium 0.710* ? 0.690<br />
'-._-<br />
* Result exceeds PRG screening values Page 30f8
Table 4.20. Metals detected above BG in VCRS soil at C-720 Complex<br />
-<br />
Sample<br />
Analytical InterVal (ft bgs) Results Lab Validation Data BG<br />
Sample Type Group Sample ID Top /Bottom Analytical Compound (mg/kg) Qualifier Qualifier Assessment (mg/kg)<br />
-<br />
Subsurface Soil METAL 720022SA020 20 23 Sodium 351.000* ? 340.000<br />
720022SA035 35 38 Sodium 343.000* ? 340.000<br />
720022SA040 40 43 Beryllium 0.770* ? 0.690<br />
40 43 Sodium 362.000* ? 340.000<br />
720022SA045 45 48 Sodium 356.000* ? 340.000<br />
720022SA050 48 50 Sodium 351.000* ? 340.000<br />
720023SA015 15 18 Beryllium 0.710* ? 0.690<br />
720024SA035 35 38 Antimony 86.200* ? 0.210<br />
35 38 Beryllium 107.000* ? 0.690<br />
35 38 Cadmium 102.000* ? 0.210<br />
35 38 Chromillm 109.000 ? 43.000<br />
35 38 Cobalt 103.000 ? 13.000<br />
35 38 Copper 106.000 ? 25.000<br />
35 38 Magnesium 5,550.000* ? 2,100.000<br />
35 38 Nickel 105.000 ? 22.000<br />
35 38 Potassium 6,390.000* ? 950.000<br />
3S 38 Silver 94.800* ? 2.700<br />
* Result exceeds PRG screening values Page 4 of8<br />
• • •
• • •<br />
T a bl e 4 020 0 M eas tid e t ec t e d a b ove BG" In VCRS SOl 01 a t C -720 C omplex I<br />
---<br />
Sample<br />
Analytical Interval (ft bgs) Results Lab Validation Data BG<br />
Sample Type Group Sample ID Top )Bottom Analytical Compound (mglkg) Qualifier Qualifier Assessment (mg/kg)<br />
--<br />
Subsurface Soil METAL 720024S1\035 35 38 Sodium 5,490.000* ? 340.000<br />
35 38 Thallium 94.400* ? 0.340<br />
35 38 Vanadium IlttoOO* ? 37.000<br />
720024SA040 40 43 Antimony 79.500* ? 0.210<br />
40 43 Beryllium 106.000* ? 0.690<br />
40 43 Cadmium 101.000 * ? 0.210<br />
40 43 Chromium 117.000 ? 43.000<br />
40 43 Cobalt 103.000 ? 13.000<br />
40 43 Copper 105.000 ? 25.000<br />
40 43 Magnesium 5,530.000 * ? Z,JOO.OOO<br />
40 43 Nickel 108.000 ? 22.000<br />
40 43 Potassium 6,420.000* ? 950.000<br />
40 43 Silver 89.100* ? 2.700<br />
40 43 Sodium 5,440.000* ? 340.000<br />
40 43 Thallium 93.500* ? 0.340<br />
40 43 Vanadium 128.000* ? 37.000<br />
720024SA045 45 48 Antimony 87.200* ? 0.210<br />
* Result exceeds PRG screenin~ values "age 5 of 8
I.<br />
Table 4.20. Metals detected above BG in VCRS soil at C-720 Complex<br />
- .-<br />
- -<br />
Sample<br />
Analytical Interval (ft bgs) Results Lab Validation Data BG<br />
Sample Type GroufJ Sample ID Top lBottom Analytical Comllound (mg/kg) Qualifier Qualifier Assessment (mg/kg)<br />
Subsurface Soil METAL 720024SA045 45 48 Beryllium 97.900* ? 0.690<br />
45 48 Cadmium 95.900* ? 0.210<br />
45 48 Chromium 103.000 ? 43.000<br />
45 48 Cobalt 95.100 ? 13.000<br />
45 48 Copper 96.400 ? 25.000<br />
45 48 Magnesium 5,200.000* ? 2,100.000<br />
45 48 Nickel 97.800 ? 22.000<br />
45 48 Potassium 6,120.000* ? 950.000<br />
45 48 Silver 68.000* ? 2.700<br />
45 48 Sodium 5,200.000* ? 340.000<br />
45 48 Thallium 89.900* ? 0.340<br />
45 48 Vanadium 112.000* ? 37.000<br />
720024SA050 48 50 Antimony 87.000* ? 0.210<br />
48 50 Beryllium 97.900* ? 0.690<br />
48 50 Cadmium 95.600* ? 0.210<br />
48 50 Chromium 103.000 ? 43.000<br />
48 50 Cobalt 95.300 ? 13.000<br />
* Result exceeds PRG screening values Page 60f8<br />
• • •
• • •<br />
Table4.20. Metals detected aboveBG in VCRS soil at C ... 720 Complex<br />
Sample<br />
Analytical Interval (ft b~s) Results Lab Validation Data BG<br />
Sample Type Group Sample ID -. ~op •• '1 BoUom Analytical Compound (mg/kg) Qualifier Qualifier Assessment (mg/kg)<br />
Subsurface Soil METAL 720024SA050 48 50 Copper 96.300 ? 25.000<br />
-- -- .<br />
48 50 Magnesium 5,200.000* ? 2,100.000<br />
48 50 Nickel 97.000 ? ~~.OOO<br />
48 50 Potassium 6,120.000* ? 950.000<br />
48 50 Silver 68.000* ? ~.700<br />
48 50 Sodium 5,220.000* ? 340.000<br />
48 50 Thallium 89.200* ? 0.340<br />
48 50 Vanadium 113.000* ? 37.000<br />
720027SAOIO 10 13 Antimony 0.530* B ? 0.210<br />
10 13 Arsenic 10.000* ? 7.900<br />
720027SA015 15 18 Mercury 0.960* ? 0.130<br />
15 18 Thallium 0.600* B ? 0.340<br />
15 18 Zinc 91.900 ? 60.000<br />
720027SA020 20 23 Antimony 1.590* ? 0.210<br />
20 23 Beryllium 1.990 * ? 0.690<br />
20 23 Chromium 52.200 ? 43.000<br />
20 23 Iron 30,200.000 * ? 28,000.000<br />
* Result exceeds PRG screening values Page 7 of8
Table 4.20. Metals detected above BG in VCRS soil at C-720 Complex<br />
" -<br />
Sample<br />
Analytical Interval (ft bgs) Results Lab Validation Ditta BG<br />
SampieType Group Sample ID Top !Bottom Analytical Compound (mg/kg) Qualifier Qualifier Assessment (mg/kg)<br />
. __ ..<br />
Subsurface Soil METAL 720027SA020 20 23 Silver 2.740 ? 2.700<br />
20 23 Vanadium 6~.300* ? 37.000<br />
20 23 Zinc 124.000 ? 60.000<br />
720027SA025 26 28 Antimony 0.810* B ? 0.210<br />
26 28 Beryllium 0.940* ? 0.690<br />
26 28 Chromium 47.300 ? 43.000<br />
26 28 Vanadium 43.700* ? 37.000<br />
Note: Sludge samples not containing any detectable metals at concentrations above background at C-720 Complex are:<br />
None<br />
Subsurface soil samples not containing any detectable metals at concentrations above background at C"720 Complex are:<br />
720001SA020 720001SA025 72000JSA035 720001SA04S 720002SAOOS 720002SA020 720002SA025 720003SA005 720003SA020<br />
720003SA025 720003SA035 120003SA040 720004SAOIO 720004SA015 720004SA025 720004SA030 720004SA040 720004SA045<br />
720004SA050 720005SAOIO 7~0005SA015 720005SA020 72000SSA02S 72000SSA030 720006SA005 720006SAOIO 720006SA030<br />
720006SA035 720006SA045 720006SA050 720006S0030 720007SAOIO 720007SA015 720007SA030 720007SA035 720007SA040<br />
720007SA045 720008SAOIO 720008SAOIS 720008SA020 720008S0020 720009SA015 720009SA025 720009SA030 720009SA040<br />
720020SA015 720020SA025 7~0020SA030 720020SA03S 720020SA040 720020SA04S 720021SA025 720021SA030 720021SA035<br />
720021SA040 720021SA045 720022SA025 720022SA030 720023SA020 720023SA02S 720023SA030 720024SAOI5 7200~4SA020<br />
720024SA025 720024SA030 720024SD025 720027SA005<br />
* Result exceeds PRG screening vaiues Page 8 or8<br />
• •
• • •<br />
Table 4.21. Radioactive isotopes detected above BG in VCRS soil at C .. 720 Complex<br />
-- -"- -- -<br />
.- .--<br />
Sample<br />
Analytical Interval (ft b2S) Results Lab Validation Data BG<br />
Sample Type __ Group SampleID top I Bottom<br />
61 Analytical Compound (pCi/g) Qualifier Qualifier Assessment (pCi/g)<br />
Sludge RADS 72002SSAOOI 1 1 Neptunium-237 267.000* ? 0.100<br />
1 1 Technetium-99 27,520.600* ? 2.500<br />
1 1 Thorium-230 5.170 ? 1.500<br />
1 1 Uranium 16,997.000 * ? 0.000<br />
1 1 Uranium-234 6,,67.000* ? 2.500<br />
1 1 U raniul11-235 348.000* ? 0.140<br />
1 1 Uranium-238 10,480.000 * ? 1.200<br />
Subsurface Soil 72000lSA035 34 38 Uranium 1.600 ? 0.000<br />
72000lSA040 38 42 Uranium 2.400 ? 0.000<br />
720001SA045 42 46 Uranium 1.900 ? 0.000<br />
720003SA035 35 38 Uranium 1.600 ? 0.000<br />
720003SA040 40 43 Uranium 1.700 ? 0.000<br />
720004SD020 17 22 Plutonium-239/240 0.140 ? 0.000<br />
720009SA005 5 9 Uranium 1.600 ? 0.000<br />
720024SA025 25 30 Uraniuin ~.200 ? 0.000<br />
720027SA035 35 39 Uranium 2.700 ? 0.000<br />
35 39 Uranium-238 1.500 ? 1.200<br />
* Result exceeds PRG screening values Page I or~
Table 4.21. Radioactive isotopes detected above BGin VCRS soil at C-720 Complex<br />
Sample<br />
Analytical Interval (ft b2S) Results Lab Validation Oata BG<br />
Sample Type Group Sample ID Top IBottom Analytical Compound (pCilg) Qualifier Qualifier Assessment (pCilg)<br />
Subsurface Soil RAOS 720027S0035 35 39 Uranium 3.000 ? 0.000<br />
35 39 Uranium-238 1.400 ? 1.200<br />
720030SA005 4 5 Uranium 2.100 ? 0.000<br />
720030SA015 13 15 Uranium 1.800 ? 0.000<br />
720030SA020 19 20 Uranium 1.700 ? 0.000<br />
720030SA025 23 25 Technetium-99 23.400 ? 2.800<br />
720030SA030 28 30 Uranium 1.700 ? 0.000<br />
Note: Slud~e samples not containing any detectable radioactive isotopes at concentrations above background at C-720 Complex are:<br />
None<br />
Subsurface soil samples not containin~ any detectable radioactive isotopes at concentrations above background at C-720 Complex are:<br />
720001SA015 72000lSA020 72000lSA025 720002SAOO5 720002SA015 720002SA020 720002SA025 720003SA005 720003SA015<br />
720003SA025 720003SA030 720003SA045 720004SAOIO 720004SA015 720004SA020 720004SA025 720004SA030 720004SA035<br />
720004SA040 7~0004SA045 720004SA050 720005SAOIO 720005SA015 720005SA020 720005SA025 720005SA030 720005S0025<br />
720006SA005 720006SAOIO 720006SA015 720006SA020 720006SA025 720006SA030 720006SA035 720006SA040 720006SA045<br />
720006SA050 720006S0030 720007SA005 720007SAOIO 720007SA015 720007SA020 720007SA025 720007SA030 720007SA035<br />
720007SA040 720007SA045 720008SAOIO 720008SA015 720008SA020 720008SA025 720008SA030 720008S0020 720009SAO IS<br />
720009SA020 720009SA025 720009SA030 720009SA040 720009SA045 720016SA055 720020SA015 720020SA020 720020SA025<br />
720020SA030 720020SA035 720020SA040 720020SA045 720020S0040 720021SA015 720021SA020 720021SA025 720021SA030<br />
720021SA035 720021SA040 720021SA045 720022SA005 720022SAOIO 720022SA015 720022SA020 720022SA025 720022SA030<br />
720022SA03S 720022SA040 720022SA045 720022SA050 720023SA015 720023SA020 720023SA025 720023SA030 720024SA015<br />
720024SA020 720024SA030 720024SA035 720024SA040 720024SA045 720024SAOSO 720024S0025 720027SAOOS 720027SAOIO<br />
720027SA015 720027SA020 720027SA025 720027SA030 720027SA040 720027SA045 720030SAOIO 720003SA020<br />
* Result exceeds PRG screenin~ values Page 20f2<br />
• • •
• • •<br />
Table 4.22. VOA compounds detected in VCRS groundwater at C-720 Complex<br />
Sample<br />
Analytical R~sults<br />
r1~ter~~;sl<br />
Lab Validation Data<br />
Sample Type Group Sample ID Top Bottom Analytical Compound (uWL) Qualifier. . Qualifier . Assessl11ent<br />
. "-"-.-.-<br />
--<br />
Groundwater VOA 720002WA015 3 8 l,l-Dichloroethene 46.000* J ?<br />
3 8 cis-l,2-Dichloroethene 49.000* J ?<br />
3 8 trans-) ,2-Dichloroethene 64.000* J ?<br />
3 8 Trichloroethene 149.000* ?<br />
3 8 Vinyl chloride 46.000* J ?<br />
720003W AOl5 30 30 trans-l,2-Dichloroethene 4.300* J ?<br />
30 30 Trichloroethene 46.000* J ?<br />
720011WA035 36 36 l,l-Dichloroethene 2.000* J ?<br />
36 36 trans-l,2-Dichloroethene 1.200 J ?<br />
36 36 Trichloroethene 9.200* ?<br />
720022W AOl5 50 50 Trichloroethene 1.600* J ?<br />
720024W AOl5 33 33 Trichloroethene 0.200* J ?<br />
Note: UCRS groundwater samples not containing amy detectable VOA cornpounds at C-720 Complex are:<br />
None<br />
* Result exceeds PRG screening values Page 1 of 1
Table 4.23. Frequency of detection of organic compounds, metals, and radioactive isotopes exceeding BG<br />
in C .. 720 Complex sludge, VCRS soil and VCRS groundwater samples<br />
Sample Type Analytical Group Analytical Compound<br />
Number of<br />
Analyses (a)<br />
Number of<br />
Detections<br />
above BG (a)<br />
Number of<br />
Detections<br />
aboveBG &<br />
PRG<br />
Screening<br />
Maximum Minimum Average<br />
Result Result Result<br />
above BG (a) above BG(s) above BG (a)<br />
--<br />
Values(s)<br />
Sludge VOA 1,I-Dichloroethene 1 1 1 2,800.000 2,800.000 2,800.000<br />
Trichloroethene 1 1 1 420,000.000 420,000.000 420,000.000<br />
SVOA Bis(2-ethylhexyl)phthalate 1 1 1 170,000.000 170,000.000 170,000.000<br />
PPCB PCB-1254 1 1 1 2,700.000 2,700.000 2,700.000<br />
PCB-I260 I I 1 700.000 700.000 700.000<br />
Polychlorinated biphenyl I I 1 3,400.000 3,400.000 3,400.000<br />
Metals Cadmium I I I 4.320 4.320 4.320<br />
Chromium 1 I I 724.000 724.000 724.000<br />
Lead I I I 138.000 138.000 138.000<br />
Mercury I I 0 0.640 0.640 0.640<br />
Nickel I I I 644.000 644.000 644.000<br />
Radioactive Neptunium-237 I I I 267.000 267.000 267.000<br />
isotopes Technetium-99 I I I '1.7,520.600 27,520.600 27,520.600<br />
Thoritnn-230 1 1 0 5.170 5.170 5.170<br />
Uranium 1 1 1 16,997.000 16,997.000 16,997.000<br />
Uranium-234 1 I I 6,167.000 6,167.000 6,167.000<br />
Uranium-235 I I I 348.000 348.000 348.000<br />
Uranium-138 1 1 10,480.000 10,480.000 10,480.000<br />
Subsurface VOA Trichloroethene 148 37 25 68,000.000 1.000 6,338.000<br />
soil Acetone 8 8 0 30.000 4.000 8.875<br />
Vinyl chloride 148 3 3 400.000 200.000 333.333<br />
1,I-Dichloroethane 19 2 0 950.000 70.000 510.000<br />
cis-l,2-Dichloroethene 142 2 0 3,200.000 750.000 1,975.000<br />
trans-I,2-Dichloroethene 142 2 1 450,000.000 400.000 225,200.000<br />
1,I-Dichloroethene 137 1 1 200.000 200.000 200.000<br />
Units<br />
ug/kg<br />
ug/kg<br />
ug/kg<br />
ug/kg<br />
ug/kg<br />
ug/kg<br />
mg/kg<br />
mg/kg<br />
mg/kg<br />
mglkg<br />
mglkg<br />
pCi/g<br />
pCi/g<br />
pCi/g<br />
pCi/g<br />
pCi/g<br />
pCi/g<br />
pCi/g<br />
ug/kg<br />
ug/kg<br />
ug/kg<br />
ug/kg<br />
uglkg<br />
ug/kg<br />
ug/kg<br />
• •<br />
(a) Number of analyses/detections include both <strong>environmental</strong> samples and duplicate results Page I of 3
• • •<br />
Table 4.23. Frequency of detection of organic compounds, metals, and radioactive isotopes exceeding BG<br />
in C-720 Complex sludge, VCRS soil and VCRS groundwater samples<br />
Sample Type Analytical Group Analytical Compound<br />
Numberof<br />
Detections<br />
Number of<br />
Maximum Minimum Average<br />
Number of<br />
above BG &<br />
Detections<br />
Result Result Result<br />
Analyses (s)<br />
PRG<br />
above BG (s)<br />
. above BG (s) above BG(s) above BG (s)<br />
Screening<br />
Units<br />
Vahies(S)<br />
Subsurface VOA (cont.) 2-Butanone 14 1 0 5.000 5.000 5.000 ug/kg<br />
soil (cont.) SVOA Bis(2-ethylhexyl)phthalate 110 21 5 1,100.000 34.000 381.714 ug/kg<br />
Di-n-octylphthalate 110 5 0 78.000 34.000 47.600 ug/kg<br />
4-Chloro-3-methylphenol 110 1 1 40.000 40.000 40.000 ug/kg<br />
Metals Beryllium 110 22 22 107.000 0.710 19.357 mglkg<br />
Vanadium 110 14 14 128.000 38.200 68.157 mglkg<br />
Sodium 110 13 13 5,490.000 343.000 1,914.846 mglkg<br />
Antimony 110 11 11 87.200 0.520 31.367 mglkg<br />
Chromium 110 9 0 117.000 45.300 77.156 mglkg<br />
Cadmium 110 6 4 102.000 0.240 65.870 mglkg<br />
Cobalt 110 6 0 103.000 14.000 71.500 mglkg<br />
Silver 110 5 4 94.800 2.740 64.528 mg/kg<br />
Thallium 110 5 5 94.400 0.600 73.520 mglkg<br />
Zinc 110 5 0 124.000 61.500 88.680 mglkg<br />
Copper 110 4 0 106.000 96.300 100.925 mglkg<br />
Magnesium 110 4 4 5,550.000 5,200.000 5,370.000 mg/kg<br />
Nickel 110 4 0 108.000 97.000 101.950 mg/kg<br />
Potassium 110 4 4 6,420.000 6,120.000 6,262.500 mglkg<br />
Iron 110 3 3 36,900.000 30,200.000 33,600.000 mg/kg<br />
Aluminum 110 1 1 12,100.000 12,100.000 12,100.000 mg/kg<br />
Arsenic 110 1 1 10.000 10.000 10.000 mg/kg<br />
Barium 110 1 0 225.000 225.000 225.000 mglkg<br />
Lead 110 1 1 139.000 139.000 139.000 mglkg<br />
Mercury 110 1 1 0.960 0.960 0.960 mglkg<br />
Selenium 110 1 0 0.730 0.730 0.730 mglkg<br />
Radioactive Uranium 38 13 0 3.000 1.600 2.000 pCi/g<br />
isotopes<br />
- .<br />
(ul Number of al1alysesldetections include both <strong>environmental</strong> samples and duplicate results Page 2 of 3
Table 4.23. Frequency of detection of organic compounds, metals, and radioactive isotopes exceeding BG<br />
in C-720 Complex sludge, VCRS soil and VCRS groundwater samples<br />
Sample Type Analytical Group Analytical Compound<br />
Number of<br />
Analyses (s)<br />
Number of<br />
Detections<br />
above BG (s)<br />
Number of<br />
Detections<br />
above BG &<br />
PRe;<br />
Screening<br />
Maximum Minimum Average<br />
Result Result Result<br />
above BG (a) above BG(a) above BG(S)<br />
Values (a)<br />
Subsurface Radioactive UraDlum-238 38 2 0 1.500 1.400 1.450<br />
soil (cont.) isotopes (cont.) Plutonium-239/240 38 1 0 0.140 0.140 0.140<br />
Technetium-99 49 1 0 23.400 23.400 23.400<br />
Groundwater VOA Trichloroethene 5 5 5 149.000 0.200 41.200<br />
trans-I,2-Dichloroethene 5 3 2 64.000 1.200 23.167<br />
1,l-Dichloroethene 5 2 2 46.000 2.000 Z4.000<br />
cis-1 ,2-Dichloroethene 5 1 1 49.000 49.000 49.000<br />
Vinyl chloride 5 1 1 46.000 46.000 46.000<br />
-<br />
Units<br />
pCi/g<br />
pCi/g<br />
pCi/g<br />
ugIL<br />
ugIL<br />
ugIL<br />
ugIL<br />
ug/L<br />
(S) Number<br />
•<br />
of analyses/detections include both <strong>environmental</strong> samples and duplicate results<br />
Page 3 of3
• •<br />
Table 4.24. VOA compounds detected in RGA groundwater<br />
~<br />
•<br />
Sample<br />
Analytical Interval (ft bgs) Results Lab<br />
Sample Type Group Sample ID Top [Bottom. Analytical Compound (ugIL) Qualifier<br />
.-- -<br />
Groundwater VOA 001175WA060 62 62 Trichloroethene 0.600* J<br />
001l75WA065 67 67 cis-I ,2-Dichloroethene 1.600 J<br />
67 67 trans-I ,2-Dichloroethene 0.500 J<br />
67 67 Trichloroethene 45.000*<br />
001l75WA070<br />
- -" - 71. 72 1,1-Dichloroethene 0.400* J<br />
72 72 trans-) ,2-Dichloroethene 2.100 J<br />
72 72 Trichloroethene 77.000*<br />
001175WA075 77 77 trans-I ,2-Dichloroethene 0.400 J<br />
77 77 Trichloroethene 29.000*<br />
001175WA080 82 82 trans-I ,2-Dichloroethene 2.500 J<br />
82 82 Trichloroethene 110.000*<br />
001l75WA085 87 87 trans. 1 ,2- Dichloroeth~ile 0.200 J<br />
87 87 Trichloroethene 28.000*<br />
001 175W A090 92 92 trans-) ,2-Dichloroethene 0.600 J<br />
92 92 Trichloroetheile 7.700*<br />
001l75WA095 97 97 trans-I ,2-Dichloroethene 0.3()0 J<br />
97 9; Trichloroethene 4.000*<br />
Va(idatjoil<br />
Qualifier<br />
?<br />
?<br />
?<br />
?<br />
?<br />
?<br />
?<br />
?<br />
?<br />
?<br />
?<br />
?<br />
?<br />
?<br />
?<br />
?<br />
?<br />
Qat a<br />
Assess ment<br />
* Result exceeds PRG screening values<br />
Page lof24
Table 4.24. VOA compounds detected in RGA groundwater<br />
Sample<br />
Analytical Interval (ft b~ Results Lab Validation Data<br />
Sample Type .. Group Sample ID Top /Bottom Analytical Compound (ug/L) Qualifier Qualifier Assessment<br />
-- ~ .-<br />
Groundwater VOA 001175WAIOO 102 102 trans-I,2-Dichloroethene 0.600 J ?<br />
102 102 Trichloroethene 6.500* ?<br />
001175WAI05 107 107 Trichloroethene 1.400* J ?<br />
001l75WAllO U2 112 Trichloroethene 0.200* J ?<br />
001175WP075 77 77 trans-I,2-Dichloroethene 0.400 J ?<br />
77 77 Trichloroethene 26.000* ?<br />
001l76WA060 62 62 1,1-Dichloroethene 0.700* J ?<br />
62 62 Trichloroethene 0.200* J ?<br />
001176WA065 67 67 Trichloroethene 0.100 J ?<br />
00 1176WA070 72 72 Trichloroethene 0.200* J ?<br />
00 1176WA075 77 77 Trichloroethene 0.600* J ?<br />
001 1 76WA080 82 82 Trichloroethene 56.000* ?<br />
001 176WA085 87 87 1,l-Dichloroethene 0.500* J ?<br />
87 87 Trichloroethene 57.000* ?<br />
001 I 76WA090 92 92 Trichloroethene 66.000* ?<br />
00 1176WA095 97 97 Chloroform 3.200* J ?<br />
97 97 Trichloroethene 1.400* J ?<br />
* Result exceeds PRGscreenin2 values Page 2 of 24<br />
• • •
• • •<br />
Table 4.24. VOA compounds detected in RGA groundwater<br />
-<br />
"._- -<br />
Sample<br />
Analytical !!!!erval (ft b2S) Results Lab Validation Data<br />
Sample Type Group Sample ID Top !Bottom Analytical Compound (uWL) Qualifier Qualifier Assessment<br />
Groundwater VOA 001 176Wb080 82 82 Trichlotoetbene 53.000* ?<br />
001177WA065 67 67 Trichloroetbene 2.100* J ?<br />
001l77WA070 7i 72 Trichloroethene 0.090 J ? BH-NE<br />
001l77WA075 77 77 Trichloroethene 0.600* J ? BH-NE<br />
001177WA080 82 82 1, 1 ~Dichloroethene 0.080* J ?<br />
82 82 Trichloroethene 2.800* J ?<br />
001177WAOS5 87 87 I,I-Dichloroethene O.OSO* J ?<br />
87 87 Trichloroethene 6.100* ?<br />
001177WA090 92 92 trans-I ,2-Dichloroetbene 0.900 J ?<br />
92 92 Trichloroethene 6.900* ?<br />
001l77W A095 97 97 I,I-Dichloroethene 0.100* J ?<br />
97 97 trans-1 ,2-Dichloroethene O.SOO J ?<br />
97 97 Trichlo roethene 10.000* ?<br />
001l77WAI00 102 102 trans-l ,2-Dichloroethene 0.600 J ?<br />
102 102 Trichloroethene 8.800* ?<br />
001l77WD080 82 82 Trichloroethene 3.500* J ?<br />
001177VVD085 87 87 1,I-Dichloroetbene 0.100* J ?<br />
* Result exceeds PRG screening vaJlJes Page 3 of 24
Table 4.24. VOA compounds detected in RGA groundwater<br />
- -<br />
.. Sample<br />
Analytical Interval (ft b~ Results Lab Validation Data<br />
Sample Type Group Sample ID T~~TBottOin Analytical Compound (ug/L) Qualifier Qualifier Assessment<br />
- -<br />
Groundwater VOA 001177WD085 87 87 trans-l,2-Dichloroethene 0.100 J ? BH-NE<br />
87 87 Trichloroethene 6.000* ?<br />
001178WA060 62 62 Trichloroethene 0.500* J ?<br />
001178WA065 67 67 Trichloroethene 0.500* J ?<br />
001178WA070 72 72 Trichloroethene 4.400* ?<br />
001178W A075 77 77 trans-l,2-Dichloroethene 0.200 J ?<br />
77 77 Trichloroethene 5.200* ?<br />
OOl178WA080 82 82 trans-. ,2-Dichloroethene ().400 J ?<br />
82 82 Trichloroethene 9.200* ?<br />
001J78WA085 87 87 trans-l ,2-Dichloroelhene 0.500 J ?<br />
87 87 Trichloroethene 9.200* ?<br />
001178WA090 92 92 trans-l ,2-Dichloroethene 0.400 J ?<br />
92 92 Trichloroethene 12.000* ?<br />
001178WA095 97 97 trans-l,2-Dichlotoethene 0.400 J ?<br />
97 97 Trichloroethene 13.000* ?<br />
001l73WAI00 102 102 trans-l ,2-Dichloroethene 0.080 J ?<br />
102 102 Trichloroethene 1.200 * J ?<br />
* Result excei!ds PRG sCl"eenin2 values Page 4 of 24<br />
• • •
• • •<br />
Table 4.24. VOA compounds detected in RGA groundwater<br />
Sample<br />
Analytical Inter~l(ft b~l Results Lab Validation Data<br />
Sample Type Group Sample ID Top Bottom Analytical Compound (ug/L) Qualifier Qualifier Assessment<br />
Groundwater VOA 001178W))090 92 92 trans-I,2-Dicbloroetbene 0.400 J ?<br />
9~ 92 TriCbloroetbene 15.000* ?<br />
001180WA060 62 62 Trichloroetbene 0.050 J ? BH-NE<br />
001180lVA065 67 67 cis-J ,~-Dicilloroetbene 0.060 J ?<br />
67 67 trans-I ,2-Dicbloroethene 0.050 J ?<br />
67 67 Trichloroethene 0.080 J ? BH-NE<br />
OOl180WA070 72 72 cis-I ,2-Dichloroethene 0.040 J ?<br />
72 72 Trichloroethene 0.200* J ? BlJ-NE<br />
001180WA075 77 77 trans-) ,2-Dichloroethene 0.100 J ?<br />
77 77 Trichloroethene 8.600* ?<br />
001l80WA080 82 82 I, )-Dichloroethene 0.500* J ?<br />
82 82 cis-) ,2· Dichlotoethene 0.300 J ?<br />
82 82 trans-I ,2-Dichloroethene 1.000 j ?<br />
82 82 Trichloroethene 29.000* ?<br />
001l80WA085 87 87 I, I-Dichloroethene 0.500* J ?<br />
87 87 trans-I,2-Dichloroethene 1.000 J ?<br />
87 87 Trichloroethene 75.000* ?<br />
* Result exceeds PRG screenin~ values Page 5 of 24
Table 4.24. VOA compounds detected in RGA groundwater<br />
Sample<br />
Analytical Interval (ft bes) Results Lab Validation Data<br />
Sample Type Group Sample ID Top IBottom Analytical Compound (ugIL) Qualifier Qualifier Assessment<br />
-<br />
Groundwater VOA 001180W A090 92 92 trans-I ,2-Dichloroethene 0.100 J ?<br />
92 92 Trichloroethene 8.300* ?<br />
00lt80WA095 97 97 trans-I ,2-Dichloroetheile 0.080 J ?<br />
97 97 Trichloroethene 1.600* J ?<br />
001l80WAI00 102 102 trans-I ,2-Dichloroethene 0.050 J ?<br />
102 102 Trichloroethene 0.800* J ?<br />
00 1180WD070 72 72 Trichloroethene 0.200* J ? BH-NE<br />
OO1l81WA070 72 72 I,I-Oichloroethene 0.080* J ?<br />
n 72 trans-t,2-Dichloroethene 0.300 J ?<br />
72 72 Trichloroethene 11.000* ?<br />
001l81WA075 77 77 trans-I ,2-Dichloroethene 2.100 J ?<br />
77 77 Trichloroethene 63.000* ?<br />
001l81WA080 82 82 cis-I ,2-Dichloroethene 2.000 J ?<br />
82 82 trans-I,2-Dichloroethene 1.600 J ?<br />
82 82 Trichloroethene 80.000* ?<br />
oOtt81WA085 87 87 trans-} ,2-Dichloroethene t.300 J ?<br />
87 87 Trichloroethene 93.000* ?<br />
* Result exceeds PRG screening values Page 6 of 24<br />
• •
• • •<br />
Table 4.24. VOA compounds detected in RGA groundwater<br />
---<br />
Sample<br />
Analytical Jnterval (ft bg& Results Lab Validation Data<br />
Sample Type Group_ Sample ID Top /Bottom Analytical Compound (ug/L) Qualifier Qualifier AsseSsment<br />
Groundwater VOA 001l81WA090 92 92 Trichioroethene 143.000* ?<br />
001l81WA095 97 97 I,I-Dichloroethene 0.700* J ?<br />
97 97 Trichloroethene 86.000* ?<br />
001l81WAIOO 102 102 Trichloroethene 45.000* ?<br />
001l81WP080 82 82 cis-I ,2-Dichloroethene 1.900 J ?<br />
82 82 trans-I ,2~Dichloroethene 1.600 J ?<br />
82 82 Trichloroethene 81.000* ?<br />
001l82WA070 72 72 Trichloroethene 3.600* J ?<br />
001l82WA075 77 77 Trichloroethene 419.000* ?<br />
001 1 82WA080 82 8Z trans-I,2-Dichloroethene 5.200* J ?<br />
82 82 Trichloroethene 520.000* ?<br />
001182WA085 87 87 trans-I ,2-Dichloroethene 23.000* J ?<br />
87 87 rrichloroethene 1,578.000* ?<br />
OOI18~WA()90 92 92 1,1-Dichloroethene 5;300* ?<br />
92 92 tis-I,2-Dichloroethene 4.500* J ?<br />
92 92 Trithloroethene 555.000* ?<br />
001182WA095 97 97 1,1-Dichloroetheile 0.500* J ?<br />
* Result exceeds PRG screenin~values Page 7 of 24
Table 4.24. VOA compounds detected in RGA groundwater<br />
Sample<br />
Analytical Interval (ft b~s) Results Lab Validation Data<br />
Sample Type<br />
Grou~ Sample_1D Top /Bottom Analytical Compound (ug/L) Qualifier Qualifier Assessment<br />
--<br />
Groundwater VOA 001182WA095 97 97 trans-l,Z-Dichloroethene 0.900 J ?<br />
97 97 Trichloroethene 61.000* ?<br />
001182WD070 72 72 Trichloroethene 3.600* J ?<br />
001183W A070 72 72 trans-l ,2-Dichloroethene 0.100 J ?<br />
72 72 Trichloroethene 10.000* ?<br />
001183WA075 77 77 Trichloroethene 12.000* ?<br />
001183W,A080 82 82 Trichloroethene 5.100* ?<br />
00l183W A085 87 87 Trichloroethene 9.000* ?<br />
001 183WA090 92 92 Trichloroethene 7.100* ?<br />
001 183WA095 97 97 trans-) ,2-Dichloroethene 0.100 J ?<br />
97 97 Trichloroethene 6.500* ?<br />
001183WD075 77 77 Trichloroethene 12.000* ?<br />
001184WA055 57 57 Trichloroethene 0.200* J ?<br />
00118.4W A070 72 72 Trichloroethene 0.900* J ?<br />
001184W A075 77 77 Trichloroethene 24.000* ?<br />
00 1184W A080 82 82 cis-) ,2-Dichloroethene 2.300* J ?<br />
82 82 Trichloroethene 220.000* ?<br />
* Result exceeds PRG screening values Page 8 of 24<br />
• •
• • •<br />
Table 4.24. VOA compounds detected in RGA groundwater<br />
- -<br />
.. _-<br />
Sample<br />
Analytical rInterVal (ft bas) Results Lab Validation Data<br />
Sample Type Grou., Sample ID Top --I Bottom Analytical Compound (ug/L) Qualifier Qualifier Assessment<br />
--<br />
Groundwater VOA 001184WA085 87 87 1,I-Dichloroethene 2.200* J ?<br />
87 87 cis-l ,2-Dichloroethene 2.600* J ?<br />
87 87 Trichloroethene 240.000* ?<br />
00tl84WA090 92 92 Trichloroethene 220.000* ?<br />
001 184WA095 97 97 Trichloroethene U9.000* ?<br />
001184WAIOO 102 102 Trichloroethene 75.000* ?<br />
001 184W0080 82 82 cis-) ,2-Dichloroethene 2.200* J ?<br />
8~ 82 Trichloroethene 230.000* ?<br />
091001WA065 65 66 Trichloroethene 6.500* ?<br />
091001WA070 70 71 1,1-Dichloroethene 0.100* J ?<br />
70 71 trans-l ,2-Dichloroethene 0.400 J ?<br />
70 71 Trichloroetltene 12.000* ?<br />
091001WA075 75 76 trans-l,2-0ichloroethene 0.400 J ?<br />
75 76 Trichloroethene 10.000* ?<br />
0910()IWA080 80 81 1,I-Dichloroetbene 2.300* J ?<br />
80 81 trans-I ,2-Dichloroethene 1.500 J ?<br />
80 81 Trichloroethene 73.000* ?<br />
* Result exceeds PRG screening values Page 9 of 24
Table 4.24. VOA compounds detected in RGA groundwater<br />
Sample<br />
Analytical Interval (ft be;s) ResultS Lab Validation Data<br />
Sample Type GroulJ Sample ID Top IBottom Analytical Compound (ugIL) Qualifier Qualifier Assessment<br />
Groundwater VOA 091001 W A085 85 86 I,I-Dichloroethene 22.000* ?<br />
85 86 trans-I ,2-Dichloroethene 1.100 J ?<br />
85 86 Trichloroethene 51.000* ?<br />
85 86 Vinyl chloride 1.700* J ?<br />
09100lWA090 90 91 I,I-Dichloroethene 30.000* ?<br />
90 91 cis-I ,2-Dichloroethene 12.500* J ?<br />
90 91 trans-I,2-Dichloroethene 0.300 J ?<br />
90 91 Trichloroethene 23.000* ?<br />
90 91 Vinyl chloride 0.500* J ?<br />
09100lWA095 95 96 I,I-Dichloroethene 44.000* ?<br />
95 96 trans-I,2-Dichloroethene 1.500 J ?<br />
95 96 Trichloroethene 30.000* ?<br />
95 96 Vinyl chloride 0.800* J ?<br />
09100lWAIOO 100 101 1,1-Dichloroethene 9.400* ?<br />
100 101 trans-I ,2-I>ichloroethene 2.300 J ?<br />
100 101 Trichloroethene 12.000* ?<br />
100 101 Vinyl chloride 0.100* j ?<br />
* Result exceeds PRG screenin2 values Page 10 of 24<br />
• •
• • •<br />
~ ~.<br />
Table 4.24. VOA compounds detected in RGA groundwater<br />
.--- .- ---<br />
Sample<br />
Sample Type<br />
Analytical Interval (ft ~g& Results Lab Validation Data<br />
Group Sample ID Top IBottom Analytical Compound (ugIL) Qualifier Qualifier Assessment<br />
Groundwater VOA 09100lWA 105 106 107 1,1-Dichloroetbene 6.100* J ?<br />
106 107 ttans-I,2-Dichloroethene 5.700* J ?<br />
106 107 Trichloroethene 38.000* ?<br />
09100lWD085 85 86 I,I-Dichloroethene 18.000* J ?<br />
85 86 trans-I ,2-Dichloroethene 1.000 J ?<br />
85 86 Trichloroethene 43.000* ?<br />
85 86 Vinyl chloride 1.400* J ?<br />
091002W A065 63.5 64.5 Trichloroethene 2.700* J ?<br />
09 I 002WA070 68.5 69.5 I,I-Dichloroethene 0.040* J ?<br />
68.5 69.5 trans-I ,2-Dichloroethene 0.080 J ?<br />
68.5 69.5 Trichloroethene 3.700* J ?<br />
09 I 002WA075 73.5 74.5 1,1-Dichloroethene 0.300* J ?<br />
73.5 74.5 trans-I ,2-Dic~loroethene 0.500 J ?<br />
73.5 74.5 Trichloroethene 17.000* ?<br />
09100~W A085 83.5 84.5 1,1-f)ichloroethene 0.800* J ?<br />
83.5 84.5 trans-1,2-Dichloroethene 6.100* J ?<br />
83.5 84.5 Trichloroethene 112.000* ?<br />
* Result exceeds PRG screeninJt values Page II of 24
Table 4.24. VOA compounds detected in RGA groundwater<br />
-<br />
-<br />
Sample<br />
Analytical Interval (ft bt!:s) Results Lab Validation Data<br />
Sample Type Group Sample ID Top IBottom Analytical Compound (ug/L) Qualifier Qualifier Assessment<br />
Groundwater VOA 09 1 002WA090 88.5 89.5 trans-I ,2-Dichloroethene 0.060 J ?<br />
88.5 89.5 Trichloroethene 1.700* J ?<br />
091002WA095 93.5 94.5 trans-I,2-Dichloroethene 0.100 J ?<br />
93.5 94.5 Trichloroethene 6.000* ?<br />
091002WD085 83.5 84.5 1,1-Dichloroethene 1.100* J ?<br />
83.5 84.5 trans-I,2-Dichloroethene 5.800* J ?<br />
83.5 84.5 Trichloroethene 95.000* ?<br />
720010WA055 56 56 1,1-Dichloroethene 1.700* J ?<br />
56 56 trans-l,2-Dichloroethene 6.300* J ?<br />
56 56 Trichloroethene 73.000* ?<br />
720010WA065 66 66 trans-l ,2-Dichloroethene 0.060 j ?<br />
66 66 Trichloroethene 1.600* J ?<br />
66 66 Vinyl chloride 0.100* J ?<br />
720010WA070 71 71 1,I-Dichloroethene 0.080* J ?<br />
71 71 trans-I ,2-Dichloroethene 0.500 J ?<br />
71 71 Trichloroethene 5.800* ?<br />
71 71 Vinyl chloride 0.100* J ?<br />
* Result exceeds PRG screening values Page 12 of 24<br />
• • •
• • •<br />
Table 4.24. VOA compounds detected in RGA groundwater<br />
-- - -<br />
Sample<br />
Analytical Interval (ft be:s) ReSults Lab Validation Data<br />
Sample Type Group Sample ID Top IB()ttom . Analr!ic.aI Coml1oUl1d (ugIL) Qualifier Qualifier Assessment<br />
---- ----<br />
Groundwater VOA 720010WA075 76 76 I, I-Dichloroethene 0.100* J ?<br />
76 76 trans-I ,2-Dic.hlol"oetilene 1.500 j ?<br />
76 76 Ttichloroethe~e 52.000* ?<br />
76 76 Vinyl chloride 0.100* J ?<br />
72001OWA080 81 81 I, I-Dichloroethene 0.200* J ?<br />
81 81 trans-I ,2-Dichloroethene 3.700 J ?<br />
81 81 Trichloroethene 5~700* ?<br />
81 81 Vinyl chloride 0.100* J ?<br />
720010WA085 86 86 trans-I ,2-Dichloroethene 0.400 J ?<br />
86 86 Trichloroethene 17.000* ?<br />
7200 I OWA090 91 91 trichloroethene 16.000* ?<br />
720010WP065 66 66 trans-I ,2-Dichloroethene 0.070 J ?<br />
66 66 Trichloroethene 1.900* J ?<br />
66 66 Vinyl chloride 0.100* J ?<br />
720011 W A060 51.5 51.5 I,I-Dic.hloroethene 0.200* J ?<br />
57.5 57.5 cis-I ,2-Dichloroethene 29.000* ?<br />
57.5 57~5 trans-I,2-Dichloroethene 25.000* ?<br />
* Result exceeds PRG screenine; values Page 13 of 24
~ ~ ~<br />
~<br />
~ ~<br />
Table 4.24. VOA compounds detected in RGAgroundwater<br />
Sample<br />
Analytical tiltervaf
~ -<br />
• • •<br />
Table 4.24. VOA compounds detected in RGA groulldwater<br />
Sample<br />
.---<br />
-- - -- _.<br />
Analytical Interval (ft b2S) Results Lab Validation Data<br />
~ ~<br />
Sample Type Group Sal1lpleID Top !Bottom Analytical Compound (~g/L) Qualifier Qualifier Assessment<br />
Groundwater VOA 720012WA080 8~ 83 Trichloroethene 2.100* J ?<br />
720012WA085 87 88 trans-I,2, Dichloroethene 0.700 J ?<br />
~<br />
87 88 Trichloroetherae 11.000* ?<br />
nOO13WA070 72 72 trans-l,2-Dichloroethene 2.000 J ?<br />
72 72 Trichloroethene 7.700* ?<br />
7200l3W A075 77 77 trans-I,2-Dichloroethene 2.600 j ?<br />
77 77 TriclJloroethene 9.600* ?<br />
77 77 Vinyl chl()ride 0.100* J ?<br />
720013W A080 82 82 cis-I ,2-Dit:hloroethene 12.000* ?<br />
82 82 trans-I,24)ichloroetherie 9.300* J ?<br />
82 82 Trichloroethene 51.000* ?<br />
720013W A085 87 87 trans-I,2-Dichloroethene 6.400* J ?<br />
87 87 Trichloroethene 32.000* ?<br />
720013WA090 92 92 trans-I,2-Dichloroethene 10.000* J ?<br />
92 9,2 Trichloroethene 57.000* ?<br />
720014W A010 68 68 trans-1,2-J)ichl()roethene 0.080 J ?<br />
68 68 Trichloroethene 0.700* J ?<br />
* Result exceeds PRG screenin~ values Page 15 of 24
Table 4.24. VOA compounds detected in RGA groundwater<br />
Sample<br />
Analytical Interval (ft b2S) Results Lab Validation Data<br />
Sample Type Grou., Sample tD Top /Bottom Analytical Compound (ug/L) Qualifier Qualifier Assessment<br />
--<br />
Groundwater VOA 720014WA070 68 68 Vinyl chloride 0.070* J ?<br />
720014WA075 73 73 Trichloroethene 6.500* ?<br />
73 73 Vinyl chloride 0.060* J ?<br />
7200 14WA080 78 78 trans-l,2-Dichloroethene 3.200 J ?<br />
78 78 Trichloroethelle 14.000* ?<br />
78 78 Vinyl chloride 0.090* J ?<br />
7200 14WA085 83 83 trans-l,2-Dichloroethene 2.500 J ?<br />
83 83 Trichloroethene 6.500* ?<br />
83 83 Vinyl chloride 0.100* J ?<br />
720014WA090 88 88 cis" 1,2-Dichloroethene 4.500* J ?<br />
88 88 trans-l,2-Dichloroethene 3.600 J ?<br />
88 88 Trichloroethene 11.000* ?<br />
720014\\'D070 68 68 trans-l ,2-Dichloroethene 0.100 J ?<br />
68 68 Trichlotoethene 0.800* J ?<br />
68 68 Vinyl chloride 0.070* J ?<br />
720015W A065 66 67 Trichloroethene 3.300* J ?<br />
720015W A070 72 73 1,I-Dichloroethene 0.100* J ?<br />
* R,eSult exceeds PRG screeninR values Page 16 of 24<br />
• • •
• • •<br />
Table 4.24. VOA compounds detected in RGA groundwater<br />
-.<br />
Sample<br />
AnalytiCal Interval (ft bes) Results Lab Validation Data<br />
Sample Type Group Sample ID Top /Bottom Analytical Compound (ugIL) Qualifier Qualifier Assessment<br />
. . . .<br />
Groundwater VOA 7200ISW.'\070 72 73 trans-I ,2-Dichloroethene 0.300 J ?<br />
72 73 Trichloroethene 21.000* ?<br />
72001SWA07S 77 78 1,I-Dichloroethene 1.300* J ?<br />
77 78 trans-I,2-Dichloroethene 2.100 J ?<br />
77 78 Trichloroethene 97.000* ?<br />
72001SWA080 82 83 1,1-Dichloroethene 3.500* J ?<br />
82 83 trans-I,2-Dichloroethene 5.700* J ?<br />
82 83 Trichloroethene 249.000* ?<br />
720015WA085 87 88 1,1-Dichloroethene 4.200* J ?<br />
87 88 cis-I ,2-Dichloroethene 20.000* J ?<br />
87 88 Trichloroethene 254.000* ?<br />
720015W A090 92 93 1,I-Dichloroethene 9.000* J ?<br />
92 93 trans-1,2-Dichloroethene 7.500* J ?<br />
92 93 Trichloroethene 496.000* ?<br />
7~0016W A065 65 65 Trichlotoethene 8.400* ?<br />
720016W A070 70 70 1,1-Dichloroethene 0.070* J ?<br />
70 70 trans-I,2-Dichloroethene 0.600 J ?<br />
* Result exceeds PRG screening values Page 17 of 24
Table 4.24. VOA compounds detected in RGA groUndwater<br />
Sample<br />
Analytical Inte"al (ft bes) Results Lab Validation Data<br />
Sample Type Group SampleID Top jBottom Analytical Compound (ugIL) Qualifier Qualifier Assessment<br />
-<br />
Grollndwater VOA 720016W A070 70 70 Trichloroethene 10.000* ?<br />
720016W A075 75 75 1, I-Dichloroethene 0.300* J ?<br />
75 75 trans-l,~-Dichloroethene 4.200* J ?<br />
75 75 Trichloroethene 25.000* ?<br />
720016W A080 80 80 I,I-Dichlotoethene 2.000* J ?<br />
80 80 trans-I ,2-Dichloroethene 6.600* J ?<br />
80 80 Trichloroethene 86.000* ?<br />
720016WA085 85 85 I,I-Dichloroethene 10.000* J ?<br />
85 85 trans-l,2-Ilichloroethene 12.000* J ?<br />
85 85 Trichloroethene 395.000* ?<br />
720016WA090 90 90 I, I-Dichloroethene 19.000* J ?<br />
90 90 trans-I,2-Dichloroethene 11.000* j ?<br />
90 90 Trichloroethene . 810.000* ?<br />
720016WA095 95 95 1, I-Dichloroethene 4.400* J ?<br />
95 95 trans-l,2-Dichloroethene 3.800 J ?<br />
95 95 Trichloroethene 293.000* ?<br />
720016WD080 80 80 1,I-Dichloroethene 1.600* J ?<br />
* Result exceeds PRG screenin~ values Page 18 or24<br />
• •
• • •<br />
Table 4.24. VOA compounds detected in RGA groundwater<br />
.. . -- - --- .- -- ..<br />
Sample<br />
Analytical Interval (ft bgs) Results Lab Validation Data<br />
Sample Type Group Sample ID Top I Bottolll Analytical Compolmd (ug/L) Qualifier Qualifier Assessment<br />
Groundwater VOA 720016WD080 80 80 trans-I ,2-Dichloroethene 6.300* J ?<br />
80 80 Trichloroethene 82.000* ?<br />
720017W A060 61 61 trans-I ,2-Dichloroethene 0.200 J ?<br />
61 61 Tricbloroethene 0.100 J ?<br />
7200l,WA065 66 66 trans-I ,2-Dicbloroetbene 0.100 J ?<br />
nOOl7WA070 71 71 I, H:>ichloroethene 3.80() * J ?<br />
71 71 cis-I,2-Dichloroethene 23.000* ?<br />
71 71 trans-I ,2-Dichloroethene 23.000* ?<br />
71 71 Trichloroethene 46.000* ?<br />
720017WA075 76 76 I, I-Dichloroethene 2.800* J ?<br />
76 76 trans-I ,2-Dichloroethene 22.000* J ?<br />
76 76 Trichloroetbene 95;000* ?<br />
720017WA080 81 81 I, I-Dicbloroetbene 4.400* J ?<br />
81 81 trans-I ,2-Dicbloroetbene 9.900* J ?<br />
81 81 Trichloroethene 272.000* ?<br />
720017WA085 86 86 I,I-Dicbloroetbene 4.200* J ?<br />
86 86 trans-I ,2-Dicbloroethene 4.700* J ?<br />
* Result exceeds PRG screening values Page 19 of 24
Table 4.24. VOA compounds detected in RGA groul1dwater<br />
-- ._ ..<br />
Sample<br />
Analytical Interval (ft bes) Itesults Lab Validation Data<br />
Sample Type Group Sample ID Top /Bottom Analytical Compound (ug/L) Qualifier Qualifier Assessment<br />
----<br />
Groundwater VOA 720017WA085 86 86 Trichloroethene 342.000* ?<br />
7~0017WA090 91 91 I,I-Dichloroethene 6.100* J ?<br />
91 91 Trichloroethene 861.000* ?<br />
720017W A095 96 96 I,I-Dichloroethene 10.000* J ?<br />
96 96 Trichloroethene 1,013.000 * ?<br />
7200 I 8WA065 66 66 1,1-Dichloroethene 31.000* J ?<br />
66 66 Trichloroethene 1,197.000* ?<br />
720018W A070 71 71 Trichloroethene 1,170.000 * ?<br />
nOOl8WA075 76 76 1,1-Dichlo roethene 19.000* J ?<br />
76 76 Trichloroethene 1,262.000* ?<br />
720018WA080 81 81 1,I-Dichloroethene ~8.000* J ?<br />
81 81 Trichloroethene 1,118.000* ?<br />
720018WA085 86 86 I,I-Dichloroethene 52.800* J ?<br />
86 86 Trichloroethene 1,013.000* ?<br />
7200 18WA090 91 91 1,1 -Dichloroethene 48.000* J ?<br />
91 91 cis-I ,2-Dichloroethene 31.000* J ?<br />
91 91 Trichloroethene ~89.000* ?<br />
* Result exceeds PRG screeninR values Page 20 of24<br />
• •
• • •<br />
Table 4.24. VOA compounds detected in RGA groundwater<br />
-<br />
Sample<br />
Analytical Interval (ft b~t Results Lab Validation Data<br />
8ampieType Group Sample ID Top jBottom Analytical Compound (ugIL) Qualifier Qualifier Assessment<br />
-<br />
Groundwater VOA 720018WD085 86 86 1,I-Dithloroethefie 54.000* J ?<br />
86 86 Trichloroethene 1,045.000* ?<br />
720019WA075 77 78 trans-} ,Z-Dichloroethene 2.400 J ?<br />
77 78 Trichloroethelle 75.000* ?<br />
720019WA080 82 83 trans-I ,2-Dichloroethene 3.400 J ?<br />
82 83 Trichloroethene 102.000* ?<br />
720019WA085 87 88 trans-I ,2~ Dichloroethene 3.500 J ?<br />
87 88 Trichloroethene 103.000* ?<br />
720019WA090 92 93 cis-1 ,2-Dichloroethene 4.700* J ?<br />
92 93 trans-1 ,2-Dichloroethene 2.900 J ?<br />
92 93 Trichloroethene 92.000* ?<br />
720026W A()70 71 71 Trichloroethene 100.000* ?<br />
720026W A080 82 82 I,I-Dichloroethene 12.000* ?<br />
82 82 2-Propallol 540.000* ?<br />
82 82 Carbon tetrachloride 4.200* J ?<br />
82 82 Chloroform 2.100* J ?<br />
82 82 cis-I,2-Dichloroethene 7.900* ?<br />
* Result exceeds PRG screening values Page 21 of 24
Table 4.24. VOA compollnds detected in RGA groundwater<br />
--<br />
Sample<br />
Analytical Interval (ft bRS} Results Lab Validation Data<br />
Sample Type Group Sample ID Top . I Bottom Analytical Compound (ug/L) Qualifier Qualifier Assessment<br />
Groundwater VOA 720026W A080 82 82 trans-I,2-Dichloroethene 2.600 j ?<br />
82 82 Trichloroethene 500.000* ?<br />
720026W A085 87 87 1,1-Dichlor()etbene 9.200* J ?<br />
87 87 Trichloroethene 767.000* ?<br />
87 87 Vinyl chloride 17.000* J ?<br />
720026W A090 92 92 I,I-Dichloroethene 15.000* J ?<br />
92 92 Trichloroethene 903.000* ?<br />
720026WD08S 87 87 l,l-Dichloroethene 31.000* ?<br />
87 87 Carbon tetrachloride 12.000* ?<br />
87 87 Chloroform 2.900* J ?<br />
87 87 cis-) ,2-Dichloroethene 11.000* ?<br />
87 87 Tetrachloroethene 4.000* J ?<br />
87 87 Trichloroethene 860.000* ?<br />
720028W A080 81 81 trans-l ,2-Dichloroethene 0.400 J ?<br />
81 81 Trichloroethene 24.000* ?<br />
720028W A085 86 86 trans-I ,2-Dichloroethene 2.700 j ?<br />
86 86 Trichloroetbene 34.000* ?<br />
* Result exceeds PRG screenin-= values Page 22 of 24<br />
• •
• • •<br />
Table 4.24. VOA compounds detected in RCA groundwater<br />
.- - - ... -<br />
Sample<br />
Analytical Interval(ft bgs) Results Lab Validation Data<br />
Sample Type Group SamplelD Top /Rottom Analytical Compound (ug/L) Qualifier Qualifier Assessment<br />
. -<br />
. -<br />
Groundwater VOA 720028W A090 91 91 cis-l,2-Dichloroethene 5.000· J ?<br />
91 91 trans-l ,2-Dichloroethene 2.600 J ?<br />
91 91 Trichloroethene 78.000· ?<br />
720028W A095 96 96 trans-l ,2~ Dichloroethene 3.000 J ?<br />
96 96 Trichloroethene 71.000· ?<br />
720028WD090 91 91 cis-1 ,2-Dichloroethene 5.000· ?<br />
91 91 trans-I ,2-Dichloroethene 3.000 J ?<br />
91 91 Trichloroethene 18.000· ?<br />
720029W A060 61 61 Trichloroethene 0.050 J ? RH-NE<br />
720029\\' A065 66 66 Trichloroethene 0.060 J ?<br />
720029W A080 81 81 1,I-DiChloroethene 5.800· J ?<br />
8, 81 Tetrachloroethene 2.000· J ?<br />
81 81 trans-1 ,2-Dichloroethene 0.100 J ?<br />
81 81 Trichloroethene 39.000· ?<br />
720029W A085 86 86 l,l-Dichloroethene 1.500· J ?<br />
86 86 trans-l,2-Dichloroethene 0.200 J ?<br />
86 86 Trichloroethene 24.000· ?<br />
• Result exceeds PRG screenina values Page 23 of 24
Table 4.24. VOA compounds detected in RGA groundwater<br />
----<br />
-- - -<br />
Sample<br />
Analytical Interval (ft b2s) Results Lab Validation Data<br />
Sample Type Group Sample ID Top IBottom Analytical Compound (ug/L) Qualifier Qualifier Assessinent<br />
--.-<br />
Groundwater VOA 720029W 1\090 91 91 1,I-Dichloroethene 1.900* J ?<br />
91 91 trans-l,2-Dichloroethene 0.300 J ?<br />
91 91 Trichloroethene 33.000* ?<br />
720029W 1\095 96 96 1,1-Dichloroethene ~.200* J ?<br />
96 96 trans-l,2-Dichloroethene 0.400 J ?<br />
96 96 Trichloroelhene 34.000* ?<br />
720029WD065 66 66 Trichloroethene 0.060 J ?<br />
720029WD095 96 96 l,l-Dlchloroethene 1.700* j ?<br />
96 96 trans-l,2-Dichloroethene 0.300 J ?<br />
96 96 Trichloroethene 27.000* ?<br />
Note: RGA2roundwater samples not containin2 allY detectableVOA compounds are:<br />
001l81WA055 001l81WA060 001l81WA065 001l84WA060 001l84WA065 720013WA065 720028WA070<br />
* Result exceeds PRG screenin2 values Page 24 of 24<br />
• • •
• • •<br />
Table 4.25. Metals detected above BC in RCA groundwater<br />
Sample<br />
Allalytical !~ter~~t~l Results Lab Validation Data BG<br />
Sample Type Group Sample ID Top Bottom Analytical Compound (mg/L) Qualifier Qualifier Assessment (mg/L)<br />
-_._- ------ .. _. .. .. . ... .. ... ...<br />
Groundwater METAL-D 001175WA065 67 67 Manganese 1.37000* ? 0.16000<br />
001l76WA060 62 62 Calcium 49.20000* ? 44.00000<br />
62 62 Magl1esium 19.10000* ? 17.00000<br />
62 62 Manganese 0.30000* ? 0.16000<br />
001176WA065 67 67 Manganese 0.40000* ? 0.16000<br />
001176WA070 72 72 Sodium 70.60000* ? 60.00000<br />
00 1176WA075 77 77 Manganese 1.51000* ? 0.16000<br />
00IJ76WA080 82 82 Mallgallese 0.38000* ? 0.16000<br />
001176WD080 82 82 Mangallese 0.32000* ? 0.16000<br />
00H77WA065 67 67 Manganese 0.Z6000* ? 0.16000<br />
OOII77W i\090 9~ 9Z Mallgal1ese ~.07000* ? 0.16000<br />
001117WA 095 97 97 Manganese 0.23000* ? 0.16000<br />
001177WAIOO 102 102 Manganese 0.50000* ? 0.16000<br />
001177WD080 82 82 Manganese 1.18000* ? 0.16000<br />
001 180WA060 62 62 Calcium 89.30000* ? 44.00000<br />
62 62 Magnesium 37.80000* ? 17.00000<br />
62 62 Mangal1ese 0.95000* ? 0.160()()<br />
* Result exceeds PRG screening values Page 10f7
Table 4.25. Metals detected above BG in RGA groundwater<br />
-<br />
- -<br />
Sample<br />
Analytical Interval (ft b2S) Results Lab Validation Data BG<br />
Sample Typ~ Group Sample ID Top IBottom Analytical Compound (mgIL). Qualifier Qualifier Assessment (mg/L)<br />
Groundwater<br />
METAV .. D 001180WA065 67 67 Manganese 1.84000* ? 0.16000<br />
001l81WA080 82 82 Manganese 0.55000* ? 0.16000<br />
001l81WA085 87 87 Manganese 0.54000* ? 0.16000<br />
001181 WD080 82 82 Manganese 0.57000* ? 0.16000<br />
00 II 82WA070 72 72 Manganese 0.66000* ? 0.16000<br />
00 II 82WD070 72 72 Manganese 0.65000* ? 0.16000<br />
001 183WA070 72 72 Manganese 1.12000* ? 0.16000<br />
001l83WA075 77 77 Manganese 1.87000* ? 0.16000<br />
001l83WA080 8~ 82 Manganese 0.78000* ? 0.16000<br />
001183W A085 87 87 Manganese 0.2~000* ? 0.16000<br />
001183W A090 92 92 Manganese 0.30000* ? 0.16000<br />
001183W A095 97 97 Manganese 0.53000* ? 0.16000<br />
001 183WD075 77 77 Manganese 1.25000* ? 0.16000<br />
001l84WA055 57 57 Manganese 1.19000* ? 0.16000<br />
OOIl84W A060 62 62 Manganese 0.84000* ? 0.16000<br />
001 184WA 065 67 67 Manganese 0.93000* ? 0.16000<br />
001184WA070 n. 72 Manganese 0.9Z000* ? 0.16000<br />
* Result exceeds PRG screening values Page 20f7<br />
• • •
• • •<br />
Table 4.25. Metals detected above BG in RGA groundwater<br />
~<br />
Sample<br />
Analytical Interval (ft b2S) Results Lab Validation Data BG<br />
Sample Type Group Sample ID Top JBottom Analytical Compound (mgIL) Qualifier Qualifier Assessment (mgIL)<br />
Groulldwater METAL-D 001184W A075 77 77 Manganese 1.13000* ? 0.16000<br />
001l84W A080 82 82 Manganese 1.17000* ? 0.16000<br />
001184W A085 87 87 Manganese 0.37000* ? 0.16000<br />
001184WD080 82 82 Manganese 1.08000* ? 0.16000<br />
091001WA08S 85 86 Manganese 4.33000* ? 0.16000<br />
091001 Wb085 85 86 Barium 0.71000* ? 0.29000<br />
85 86 Iron 11.80000* ? 5.10000<br />
85 86 Manganese 6.88000* ? 0.16000<br />
091002W A085 83.5 84.5 Manganese 0.37000* ? 0.16000<br />
091002WD085 83.5 84.5 Manganese 0.38000* ? 0.16000<br />
720011WA060 57.5 57.5 Manganese 0.55000* ? BH-LAB 0.16000<br />
51.5 57.5 Sodium 161.00000* ? 60.00000<br />
720011 W A080 77.5 77.5 Manganese 0.29000* ? BH-LAB 0.16000<br />
720011 W A08S 8~.5 82.5 Manganese 0.67000* ? BH-LAB 0.16000<br />
82.5 82.5 :linc 0.08000 ? BH-LAB 0.02700<br />
720011W A090 87.5 87.5 Iron 11.60000* ? 5.10000<br />
87.5 87.5 Zinc 0.03000 ? 0.02700<br />
* Result exceeds PRG screening values Page 30f7
~~ -<br />
Table 4.25. Metals detected above BG in RGA groundwater<br />
-----<br />
Sample<br />
Analytical Interval (ft be!;) Results Lab Validation Data BG<br />
Sample Type Groul! Sample ID Top iBottom Analytical Compound (mgIL) Qualifier Qualifier Assessment (mgIL)<br />
_._--- --<br />
Groundwater METAL-D 7200 11 WA 100 97.5 97.5 Iron 15.70000* ? 5.10000<br />
97.5 97.5 Manganese 1.21000* ? 0.16000<br />
97.5 97.5 Zinc 0.05000 ? 0.02700<br />
720013WA070 72 72 Manganese 1.28000· ? 0.16000<br />
720013W A07S 77 77 Barium 0.74000· ? 0.29000<br />
77 77 Cobalt 0.14000· ? 0.09600<br />
71 77 Manganese 4.05000* ? 0.16000<br />
720013W;\.080 82 82 Iron 6.86000· ? 5.10000<br />
82 82 Manganese 1.12000· ? 0.16000<br />
720013WA08S 87 87 Barium 0.33000* ? 0.29000<br />
87 87 Manganese 3.32000· ? 0.16000<br />
720013W A090 92 92 Iron 5.83000* ? 5.10000<br />
92 92 Manganese 2.04000* ? 0.16000<br />
720017WA075 76 76 Barium 0.38000* ? 0.29000<br />
76 76 Iron 8.95000· ? 5.10000<br />
76 76 Manganese 1.31000· ? 0.16000<br />
76 76 Zinc 0.89000* ? 0.02700<br />
* Result exceeds PRG screening values Page 4 of7<br />
• • •
• • •<br />
Table 4.25. Metals detected above BG in RGA groundwater<br />
_. - . - -- - -<br />
--'"-<br />
Sample<br />
Analytical Interval (ft bgs) Results Lab Validation Data BG<br />
Sample Type Group Sample to Top I Bottom Analytical Compound (mg/L) Qualifier Qualifier Assessment (mg/L)<br />
Groundwater METAL~D 720017WA080 81 81 Manganese 0.29000* ? 0.16000<br />
720017W A085 86 86 Manganese 0.25000* ? 0.16000<br />
7200 17W A090 91 .91 Iron 5.13000* ? 5.10000<br />
91 91 Manganese 0.40000* ? 0.16000<br />
91 91 Zinc 0.91000* ? 0.02700<br />
720017W A095 96 96 Manganese 2.29000* ? 0.16000<br />
720019W A075 77 78 Iron 10.50000* ? 5.10000<br />
77 78 Manganese 1.38000* ? 0.16000<br />
77 78 Zinc 0.05000 ? 0.02700<br />
7200 19WA080 82 83 Manganese 0.25000* ? 0.16000<br />
720019WA085 87 88 Manganese 0.34000* ? 0.16000<br />
720019WA090 92 93 Manganese 1.02000* ? 0.16000<br />
92 93 Zinc 0.04000 ? 0.02700<br />
720026W A080 82 82 Barium 0.30000* ? 0.29000<br />
82 82 Manganese 0.82000* ? 0.16000<br />
720026W A085 87 87 Barium 0.40000* ? 0.29000<br />
87 87 Manganese 1.54000* ? 0.16000<br />
* Result exceeds PRG screening values Page 5 of7
Table 4.25. Metals detected above BG in RGA groundwater<br />
- -<br />
~<br />
--<br />
Sample<br />
Analytical Interval (ft b2S) Results Lab Validation Data BG<br />
Sample Type Group Sample ID Top IBottom Analytical Compound (mg/L) Qualifier Qualifier Assessment (mg/L)<br />
Groundwater M ETA L-D 720026WD085 87 87 Barium 0.40000* ? 0.29000<br />
87 87 Manganese 1.56000* ? 0.16000<br />
720028W A080 81 81 Barium 0.30000* ? ().29000<br />
SI SI Manganese 0.IS000* ? 0.16000<br />
72002SW AOS5 86 86 Barium 0.45000* ? 0.29000<br />
S6 86 Manganese 1.57000* ? 0.16000<br />
72002SWA090 91 91 Barium 0.36000* ? 0.29000<br />
91 91 Manganese 1.09000* ? 0.16000<br />
720028W A095 96 96 BariuiD O.JIOOO* ? 0.29000<br />
96 96 Manganese 0.90000* ? 0.16000<br />
720028WD090 91 91 Barium 0.36000* ? 0.29000<br />
91 91 Manganese 1.12000* ? 0.16000<br />
720029W A060 61 61 Barium 0.47000* ? 0.29000<br />
61 61 Calcium 47.80000* ? 44.00000<br />
61 61 Magnesium 22.80000* ? 17.00000<br />
720029W A065 66 66 Barium 0.58000* ? 0.29000<br />
66 66 Calcium 51.20000* ? 44.00000<br />
* Result exceeds PRG screening values Page 60r7<br />
• • •
• • •<br />
Table 4.25. Metals detected above BG in RGA groundwater<br />
Sample<br />
Analytical Interval (ft b2S) Results Lab Validation Data BG<br />
Sample Type Group Sample ID Top IBottom Analytical Compound (mg/L) Qualifier Qualifier Assessment (mg/L)<br />
-- - _.<br />
Groundwater METAL-D 720029WA065 66 66 Manganese 0.17000* ? 0.16000<br />
720029WA090 91 91 Man~anese 0.48000* ? 0.16000<br />
720029W A09S 96 96 Man~anese 0.53000* ? 0.16000<br />
720029WD065 66 66 Barium 0.54000* ? 0.29000<br />
66 66 Calcium 48.10000* ? 44.00000<br />
66 .66 Magnesium 21.80000* ? 17.00000<br />
720029W0095 96 96 Manganese 0.53000* '? 0.16000<br />
Note: RGA groundwater samples not containing any detectable metals at concentrations above background are:<br />
001177WA085 001l77WD085 001l81WA075 001184WA090 720011WA075 720011WA095 720017WA070 720018WA085 720018WD085<br />
720026W A090 120028\vA070 720029WA080<br />
* Result exceeds PRG screening values Page 7 of7
T a bl e 426 . R dO to<br />
° °<br />
a _~oac Ive ISO t opes d e t ec t e d a b ove BGO 10 RGA grouo d wa t er<br />
Sample<br />
Analytical Interval (ft bes) Results** Lab Validation Data BG**<br />
Sample TYfle Group Sample ID Top iBottom Analytical Compound (pCiIL) Qualifier_ Qualifier Assessment (pCiIL)<br />
---<br />
Groundwater RADS 00117SWA060 62 62 Technetium-99 2,420.000· ? 0.000<br />
62 62 Uranium 0.008* ? 0.000<br />
00117SWA07S 77 77 Uranium 0.001 ? 0.000<br />
001l7SWA08S 87 87 Uranium 0.001 ? 0.000<br />
00117SWA09S 97 97 Uranium 0.004 ? 0.000<br />
001l7SWAllO 112 112 Uranium 0.001 ? 0.000<br />
001l7SWD07S 77 77 Uranium 0.001 ? 0.000<br />
001l76WA06S 67 67 Technetium-99 33.300* ? 0.000<br />
67 67 Uranium 0.002 ? 0.000<br />
001l76WA080 82 82 Uranium 0.001 ? 0.000<br />
00 11 76WA08S 87 87 Uranium 0.002 ? 0.000<br />
00 11 76WD080 82 82 Uranium 0.006* ? 0.000<br />
001177WA065 67 67 Techndium-99 18.000 ? 0.000<br />
67 67 Uranium 0.030* X ? 0.000<br />
001l77WA080 82 82 Uranium 0.001 ? 0.000<br />
00 11 77WA08S 87 87 Uranium 0.001 ? 0.000<br />
001l77W A090 92 92 Uranium 0.002 ? 0.000<br />
* Result exceeds PRG screening values Page 1 of 14<br />
** Results and background values for Uraniu~ given ill mg!L<br />
• • •
• • •<br />
Table 4 ~26o RadlOact,ve Isotopes d etected aboveB GO _. In RGA<br />
-<br />
._ groun. d wa.ter<br />
Sample<br />
Analytical Interval (ft b~s) Results** Lab Validation Data BG**<br />
Sample .Type .. Group Sample ID Top /Bottom Analytical. Compound (pCiIL~ Qu~litier Qualifier Assessment
Table 4.26. Radioactive isotopes detected above BG in RGA groundwater<br />
- -- -<br />
_. .-<br />
Sample<br />
Analytical Interval (ft b~s) Results** Lab Validation Data BG**<br />
Sample Type Group Sample ID_ Top JBottom Al1alytical Compound (pCiIL) Qualifier Qualifier Assessment (pCiIL)<br />
Groundwater RADS 001181WA060 62 62 Uranium 0.006* ? 0.000<br />
001181WA065 67 67 Ural1ium 0.001 ? 0.000<br />
001181WA080 82 82 Uranium 0.002 ? 0.000<br />
001181 WD080 82 82 Uranium 0.001 ? 0.000<br />
001182W A070 72 72 Uranium 0.001 ? 0.000<br />
001182WA075 77 77 Technetium-99 597.200* ? 0.000<br />
77 77 Uranium 0.001 ? 0.000<br />
001182W A080 82 82 Technetium-99 3,709.600* ? 0.000<br />
82 82 Uranium 0.001 ? 0.000<br />
001182WA085 87 87 Technetium.99 1,029.600* ? 0.000<br />
87 87 Uranium 0.002 ? 0.000<br />
001182\vA090 92 92 Technetium-99 225.500* ? 0.000<br />
92 92 Uranium 0.001 ? 0.000<br />
001182WD070 72 72 Technetium-99 30.000* ? 0.000<br />
72 72 Uranium 0.001 ? 0.000<br />
001183WA070 72 72 Technetium-" 494.500* ? 0.000<br />
71- 72 Uranium 0.002 ? 0.000<br />
* Result exceeds PRG screening values Page 3 of 14<br />
** Results and background values for Uranium given in mg/L<br />
• •
• • •<br />
Table 4.26. Radioactive isotopes detected above BG in RGA groundwater<br />
Sample<br />
Analytical Interval (ft b2S) Results** Lab Validation Data BG**<br />
Sample Type Group Sample ID Top /Bottom _Analytical Compound (pCiIL) Qualifier Qualifier Assessment (pCiIL)<br />
---<br />
Groundwater RADS 001183WA075 77 77 Technetium-99 575.100* ? 0.000<br />
77 77 Uranium 0.001 ? 0.000<br />
001l83WA080 82 82 Technetium-99 334~700* ? 0.000<br />
82 82 Uranium 0.004 ? 0.000<br />
001183WD075 77 77 Technetium-99 613.700* ? 0.000<br />
77 77 Uranium 0.001 ? 0.000<br />
00l184W A055 57 57 Uranium 0.100* ? 0.000<br />
001184WA060 62 62 Uranium 0.030* X ? 0.000<br />
001184W A085 87 87 Technetium-99 2,470.300* ? 0.000<br />
87 87 Uranium 0.001 X ? 0.000<br />
001184WA090 92 92 Technetium-99 1,851.700* ? 0.000<br />
92 92 Uranium 0.001 X ? 0.000<br />
001184WA 100 102 102 Uranium 0.001 X ? 0.000<br />
001184WD080 82 82 Tec:hnetium-99 1,692.300* ? 0.000<br />
82 82 Uranium 0.001 X ? 0.000<br />
091001WA070 70 71 Technetlum-99 354.700* ? 0.000<br />
70 71 Tborium-230 4.730* ? 1.400<br />
* Result exceeds PRG screening values Page 4 of 14<br />
** Results and background values for -Uranium given In mg/L
Table 4.26. Radioactive isotopes detected above BG<br />
- -<br />
in RGA groundwater<br />
.. Sample<br />
Analytical Interval (ft b~ Results** Lab 'Validation Data BG**<br />
Sample Type Group Sample ID Top !Bottom Analytical Compound (pCiIL) Qualifier Qualifier Assessment (pCiIL)<br />
Groundwater RADS 091001WA070 70 71 Uranium 0.020* ? 0.000<br />
091001WA075 75 76 Technetium-99 568.100* ? 0.000<br />
75 76 Uranium 0.003 ? 0.000<br />
091001WA085 85 86 Tethnetium-99 38.000* ? 0.000<br />
85 86 Uranium 0.005* ? 0.000<br />
091001 WD085 85 86 Technetium-99 41.200* ? 0.000<br />
85 86 Uranium 0.005* ? 0.000<br />
091002W A070 68.5 69.5 Uranium 0.010* ? 0.000<br />
09100~WA075 73.5 74.5 Technetium-99 37.400* ? 0.000<br />
73.5 74.5 Uranium 0.002 ? 0.000<br />
091002W A085 83.5 84.5 Technetium-99 18.500 ? 0.000<br />
83.5 84.5 Uranium 0.001 ? 0.000<br />
091002WA090 88.8 89.5 Thoriul11~230 3.990* ? 1.400<br />
88.8 89.5 Uranium 0.010* ? 0.000<br />
091002WA095 93.5 94.5 Thorium-230 3.820* ? 1.400<br />
93.S 94.5 Uranium 0.004 ? 0.000<br />
091002WD08S 83.5 84.5 Uranium 0.002 ? 0.000<br />
* Result exceeds PRG screening values Page 5 of 14<br />
** Results and background values for Uranium given in mg/L<br />
• • •
• • •<br />
Table 4.26. Radioactive isotopes detected above BC in RGA groundwater<br />
Sample<br />
Analytical Interval (ft b2S) Results** Lab Validation Data BG**<br />
Sample Type Group Sample ID Top iBottom Analytical Compound (pCi/L) Qualifier Qualifier Assessment (pCi/L)<br />
Groundwater RADS 720010WA055 56 56 Uraniulll 0.010* ? 0.000<br />
720010WA065 66 66 Tech~etiuln.-99 19.400 ? 0.000<br />
66 66 Uranium 0.002 ? 0.000<br />
7200 lOW A085 86 86 Technetiull1"99 151.100* ? 0.000<br />
86 86 Uranium 0.001 ? 0.000<br />
720010W A090 9, 91 Technetium-99 101.400 * ? 0.000<br />
91 91 Uranium 0.001 ? 0.000<br />
720010WD065 66 66 Plutonium-239/240 3.790* ? 0.0,,0<br />
66 66 Technetium-99 23.100 ? 0.000<br />
66 66 Thorium-230 8.600* ? 1.400<br />
66 66 Uranium 0.002 ? 0.000<br />
720011 W A060 57.5 57.5 Technetium-99 35.200* ? 0.000<br />
57.5 57.5 Uranium 0.007* ? 0.000<br />
720011WA075 72.5 72.5 Uranium 0.001 ? 0.000<br />
720011WA085 82.5 82.5 Technetium-99 134.300* ? 0.000<br />
82.5 82.5 Uranium 0.002 ? 0.000<br />
720011 W A090 87.5 87.5 Technetium-99 243.300* ? 0.000<br />
* Result ex«:eeds PRG screening values Page 6 of 14<br />
** Results and background values for Uranium given in mg/L
Table 4.26. Radioactive isotopes detected above BG in RGA groundwater<br />
--. --- .. - - - - - _. -<br />
Sample<br />
Analytical Interval (ft bgs) Results** Lab Validation Data BG**<br />
Sample Type Groul!. SampleID Top ) Bottom Analytical Compound (pCiIL) Qualifier _ Qualifier Assessment (pCiIL)<br />
_....-<br />
Groundwater RADS 720011WA090 87.5 87.5 Uranium 0.001 ? 0.000<br />
720013W A080 82 82 Technetium-99 51.700* ? 0.000<br />
82 82 Uranium 0.001 ? 0.000<br />
720013W A085 87 87 Technetium-99 38.600* ? 0.000<br />
87 87 Uranium 0.001 ? 0.000<br />
720014W A070 68 68 Pllltonium-239/240 1.550* ? 0.000<br />
68 68 Uranium 0.005* ? 0.000<br />
720014W A085 83 83 Technetium-99 27.600 ? 0.000<br />
83 83 Uranium 0.002 ? 0.000<br />
720014WD070 68 68 Thorium-230 2.690* ? 1.400<br />
68 68 Uranium 0.003 ? 0.000<br />
720015WA075 77 78 Uranium 0.001 ? 0.000<br />
720016WA01s 75 75 Uranium 0.010* ? 0.000<br />
7200 16WA080 80 80 Thorium-230 4.410* ? 1.400<br />
80 80 Uranium 0.009* ? 0.000<br />
720016WD080 80 80 thorium-230 4.340* ? 1.400<br />
80 80 Uranium 0.009* ? 0.000<br />
* Result exceeds PRG screening values Page 7 of 14<br />
** Results and background values for Uranium given in mg/L<br />
----<br />
• • •
• • •<br />
Table 4.26. Radioactive isotopes detected above BG in RGA groundwater<br />
_. _.._- - -.-- -.--<br />
- -<br />
Sample<br />
Analytical Interval (ft b~sl Results" Lab Validation Data BG**<br />
Sample Type Grou]! Sample 10 Top I Bottom Analytical Compound (pC ilL) Qualifier Qualifier Assessment (pCiIL)<br />
... ... - .<br />
Groundwater RADS 720017WA070 71 71 Uranium 0.009* ? 0.000<br />
7200 17W A080 81 81 t echnetium-99 81.300* ? 0.000<br />
81 81 Uranium 0.001 ? 0.000<br />
720017W A085 86 86 Technetium-99 109.700* ? 0.000<br />
86 86 Uranium 0.001 ? 0.000<br />
720017WA090 91 91 Technetium-99 105.500* ? 0.000<br />
91 91 Uranium 0.001 ? 0.000<br />
720011WA095 96 96 Technetium-99 78.900* ? 0.000<br />
96 96 Uranium 0.001 ? 0.000<br />
720018WA065 66 66 Technetium-99 551.900* ? 0.000<br />
66 66 Uranium 0.001* ? 0.000<br />
720018W A070 71 71 Technetium-99 285.800* ? 0.000<br />
71 71 Uranium 0.009* ? 0.000<br />
720018W A080 81 81 Technetium-99 98.800* ? 0.000<br />
81 81 Uranium 0.001 ? 0.000<br />
12001SWA085 86 86 Technetium-99 71.900* ? 0.000<br />
86 86 Uranium 0.001 ? 0.000<br />
* Result exceeds PRG screening values Page 8 of 14<br />
** Results and background values for Uranium given in mg/L
Table 4.26. Radioactive isotopes detected above BG in RGA groundwater<br />
Sample<br />
Analytical Interval (ft bgs) Results** Lab Validation Data BG**<br />
Sample Type Group Sample ID Top /Bottom Analyti~al Compound (pCiIL) Qualifier Qualifier Assessment (pC ilL)<br />
~ -<br />
-_.-<br />
Groundwater RADS 7200 18WD085 86 86 Technetium-99 85.300* ? 0.000<br />
86 86 Uranium 0.001 ? 0.000<br />
720019W A075 77 78 Uranium 0.001 ? 0.000<br />
7200 19WA085 87 88 Uranium 0.001 ? 0.000<br />
720019WA090 92 93 Uranium 0.001 ? 0.000<br />
720026W A070 71 71 Uranium 0.001 ? 0.000<br />
720026WA085 87 87 Technetium-99 76.600* ? 0.000<br />
87 87 Uranium 0.001 ? 0.000<br />
720026W A090 92 92 Technetium-99 92.200* ? 0.000<br />
92 92 Uranium 0.001 ? 0.000<br />
720026WD085 87 87 Technetium-99 72.000* ? 0.000<br />
87 87 Uranium 0.001 ? 0.000<br />
720028W A070 71 71 Plutonium-239/240 2.190* ? 0.000<br />
71 71 Uranium 0.020* ? 0.000<br />
720028W A090 91 91 Uranium 0.001 ? 0.000<br />
720028WD090 91 91 Uranium 0.001 ? 0.000<br />
720029W A065 66 66 Uranium 0.005* ? 0.000<br />
* Result exceeds PRG screening values Page 9 of 14<br />
** Results and background values for Uranium given in mgIL<br />
• • •
-<br />
• • •<br />
Table 4.26. Radioactive isotopes detected above BG in RGA groundwater<br />
-<br />
.~<br />
- - - - ------ -<br />
Sample<br />
Analytical Interval (ft bes) Results** Lab Validation Data BG**<br />
Sample Type Group SampleID Top ., Bottom Analytical Compound (pCiIL) Qualifier Qualifier Assessment (pCiIL)<br />
-<br />
Groundwater RADS 720029W A080 81 81 Technetium-99 525.300* ? 0.000<br />
81 81 Uranium 0.001 ? 0.000<br />
720029W A090 91 91 Technetium-99 157.400'" ? 0.000<br />
91 91 Uranium 0.001 ? 0.000<br />
720029W A095 96 96 Technetium~99 69.000* ? 0.000<br />
96 96 Uranium 0.005'" ? 0.000<br />
720029WD065 66 66 Thorium-230 37.580'" ? 1.400<br />
66 66 Uranium 0.006'" ? 0.000<br />
720029WD095 96 96 Technetium-99 85.000* ? 0.000<br />
96 96 Uranium 0.002 ? 0.000<br />
RADS-D 001175WA060 62 62 Uranium 0.001 ? 0.000<br />
001175WA095 97 97 Uranium 0.001 ? 0.000<br />
001175WA110 112 112 Uranium 0.001 ? 0.000<br />
001176WA065 67 67 Uranium 0.001 ? 0.000<br />
00 1176WA080 tJ2 82 Uranium 0.001 ? 0.000<br />
00 1176WA085 87 87 Uranium 0.001 ? 0.000<br />
001176WD080 82 82 Uranium 0.001 ? 0.000<br />
... Result exceeds PRG screening values Page 100114<br />
...... Results and background values for Uranium given in mg/L
Table 4.26. Radioactive isotopes detected above BG in RGA groundwater<br />
Sample<br />
Analytical !!Jterv'!~4~} Results** Lab Validation Data BG**<br />
Sample Type Group' Sample ID Top Bottom Analytical Compound (pC~) Qualifier Qualifier Assessment (pCiIL)<br />
Groundwater RADSoD 001 1 77WA 065 67 67 Uranium 0.001 ? 0.000<br />
001.,7WA090 92 92 Uranium 0.001 ? 0.000<br />
001 177WAI00<br />
~ ~ ~<br />
102 102 Uranium 0.001 ? 0.000<br />
001178WA065 67 67 Uranium 0.00. ? 0.000<br />
001178WA085 87 87 Uranium 0.001 ? 0.000<br />
001178WA090 92 92 Uranium 0.001 ? 0.000<br />
001178WD090 92 92 Uranium 0.001 ? 0.000<br />
001180WA080 82 82 Uranium 0.001 ? 0.000<br />
001181WA055 57 57 Uranium 0.001 ? 0.000<br />
001181WA060 62 62 Uranium 0.001 ? 0.000<br />
001181WA080 82 82 Uranium 0.001 ? 0.000<br />
001182WA085 87 87 Uranium 0.001 ? 0.000<br />
001 1 83WA070 72 72 Uranium 0.001 ? 0.000<br />
001183W A075 77 77 Uranium 0.001 ? 0.000<br />
001183WA080 82 82 Uranium 0.001 ? 0.000<br />
001183WD075 77 77 Uranium 0.001 ? 0.000<br />
001184WA055 57 57 Uranium 0.001 ? 0.000<br />
I<br />
* ReSult exceeds PRG screening values Page 11 of 14<br />
** Results and background talues for Uranium given in mgIL<br />
• • •
• • •<br />
Table 4.26. Radioactive isotopes detected above BG in RGA groundwater<br />
-- -<br />
Sample<br />
Analytical Interval (ft ba;s) Results** Lab Validation Data BG**<br />
Sample Type Group Sampie 10 Top I Botto~- Analytical Compound (pCiIL) Qualifier Qualifier Assessment (pCiIL)<br />
- - --<br />
- -<br />
Groundwater RADS-D 001184W A060 62 62 Uranium 0.001 ? 0.000<br />
00 tl 84WA 100 102 102 Uranium 0.001 ? 0.000<br />
091002W A070 68.5 69.5 Uranium 0.001 ? 0.000<br />
091002VV A075 73.5 74.5 Uranium 0.003 ? 0.000<br />
091002WA085 83.5 84.5 Uraniurn 0.001 ? 0.000<br />
091002WA090 88.8 89.5 Uranium 0.001 ? 0.000<br />
09 I 002WA095 93.5 94.5 Uranium 0.001 ? 0.000<br />
09 1 002WD085 83.5 84.5 Uranium 0.001 ? 0.000<br />
7200 lOW A055 56 56 Uranium 0.001 ? 0.000<br />
720010WA065 66 66 Uranium 0.001 ? 0.000<br />
720010WA090 91 91 Uranium 0.001 ? 0.000<br />
720010WD065 66 66 Uranium 0.001 ? 0.000<br />
720011 W A060 57.5 57.5 Uranium 0.001 ? 0.000<br />
7200tlWA085 82.5 82.5 Uranium 0.001 ? 0.000<br />
720013WA085 87 87 Uranium 0.001 ? 0.000<br />
7~0014W A070 68 68 Uranium 0.001 ? 0.000<br />
720014W A085 83 83 Uranium 0.001 ? 0.000<br />
* Result exceeds PRG screening values Page 12 of 14<br />
** Results and background values for Uranium given in mg/L<br />
--
Table 4.26. Radioactive isotopes detected aboveBG in RGA groundwater<br />
--<br />
--- -<br />
Sample<br />
Analytical Interval (ft b2S) Results" tab Validation Data BG**<br />
Sample Type Group Sample ID Top IBottom Analytical Compound (pCiIL) Qualifier Qualifier Assessment (pCiIL)<br />
. -<br />
_ ...<br />
Groundwater RADS·D 720014WD070 68 68 Uranium 0.001 ? 0.000<br />
72001SW A07S 77 78 Uranium 0.001 ? 0.000<br />
720017WA070 71 71 Uranium 0.001 ? 0.000<br />
7200 17WA09S 96 96 Uranium 0.001 ? 0.000<br />
720018WA06S 66 66 Uranium 0.001 ? 0.000<br />
720018W A070 71 71 Uranium 0.001 ? 0.000<br />
720018W A080 81 81 Uranium 0.001 ? 0.000<br />
720026W A08S 87 87 Uranium 0.001 ? 0.000<br />
720028W A070 71 71 Uranium 0.001 ? 0.000<br />
720028WA090 91 91 Uranium 0.001 ? 0.000<br />
7200~9W 1\065 66 66 Uranium 0.001 ? 0.000<br />
720029W A09S 96 96 Uranium 0.001 ? 0.000<br />
720029WD06S 66 66 Uranium 0.001 ? 0.000<br />
720029WD09S 96 96 Uranium 0.001 ? 0.000<br />
* Result exceeds PRG screening values Page 13 of 14<br />
** Results and background values for Uranium given in mgIL<br />
• • •
• • •<br />
Table 4.26. Radioactive isotopes detected above BG in RGA groundwater<br />
-.. _ .. _-<br />
- .. - - -- --<br />
Sample<br />
Analytical Interval (rt bars) Results** Lab Validation Data BG**<br />
Sample Type Group Sample ID Top I Bottom Analytical Compound (pCiIL) . _ Qualifier Qualifier Assessment (pCiIL)<br />
..<br />
Note: RGA groundwater samples not containing any detectable radioactive isotopes at concentrations above background are:<br />
001175WA065 OO1175WA070 001175WA080 OO1175WA090 OO1175WAI00 OO1175WAI05 001176WA060 001176WA010 001176WA075<br />
0Ol176WA090 001176WA095 001177WA 070 001177W A075 OO1177WA095 OO1178WA060 001178WA070 001178WA075 001178WA080<br />
OO1178WA09S 001178WAI00 OOl180W A060 OO1180WA06S 001180W A075 001180W A090 001180WA095 001181WA075 001181WA085<br />
001181WA090 001181WA09S 001181WAI00 001182WA09S 001183W A08S 001 183WA09O 001183W A095 001184W A065 001184W A070<br />
001184WA075 001184WA080 001184WA095 091001WA065 091001WA080 091001WA090 091001WA09S 091001WAIOO 091001WAI05<br />
091002WA06S 720010WA070 720010WA075 ~20010W A080 720011 W A070 720011WA080 720011WA095 720011WAIOO 720012W A070<br />
720012WA07S 720012W A080 720012W A08S 720013W A070 720013W A075 720013WA090 720014W A075 720014W A080 720014W A090<br />
720015WA065 720015WA070 72001SW A080 72001SWA085 720015W A090 720016W A065 720016W A070 720016W A085 720016WA090<br />
720016WA095 720017WA060 720017WA065 720017WA07S 720018W A07S 720018W A090 720019WA080 720026W A080 720028W A080<br />
720028W A085 720028W A09S 720029W A060 720029W A085<br />
* Result exceeds PRG screening values Page 14 of 14<br />
** Results and background values for Uranium given in mgIL
Table 4.27. Frequency of detection of organic compounds, metals, and radioactive isotopes exceeding BG<br />
in RGA groundwater<br />
Sample Type Analytical Group Analytical Compound<br />
Number of<br />
Analyses (a)<br />
Number of<br />
Detections<br />
above BG (a)<br />
.<br />
Groundwater VOA Tnchloroethene 225 209<br />
trans-l,2-Dichloroethene 225 108<br />
I,I-Dichloroethene 225 68<br />
cis-l,2-Dichloroethene 225 22<br />
Vinyl chloride 225 18<br />
Chloroform 37 3<br />
Carbon tetrachloride 37 2<br />
Tetrachloroethene 37 2<br />
2-Propanol 37 1<br />
Metals .. Manganese 83 67<br />
dissolved Barium 83 15<br />
Iron 83 8<br />
Zinc 83 7<br />
Calcium 83 5<br />
Magnesium 83 4<br />
Sodium 83 2<br />
Cobalt 83 1<br />
Radioactive Uranium 101 101<br />
isotopes Technetium-99 102 50<br />
Thorium-230 54 8<br />
Plutonium-239/240 54 3<br />
Cesium-137 54 1<br />
Radioactive Uranium 55 55<br />
isotopes - dissolved<br />
Number of<br />
Detections<br />
aboveBG &<br />
PRG<br />
Screening<br />
Values (a)<br />
201<br />
24<br />
68<br />
16<br />
18<br />
3<br />
2<br />
2<br />
I<br />
67<br />
15<br />
8<br />
2<br />
5<br />
4<br />
2<br />
I<br />
28<br />
44<br />
8<br />
3<br />
1<br />
o<br />
Maximum<br />
Result<br />
above BG (a)<br />
1,578.000<br />
25.000<br />
54.000<br />
31.000<br />
17.000<br />
3.200<br />
12.000<br />
4.000<br />
540.000<br />
6.880<br />
0.740<br />
15.700<br />
0.910<br />
89.300<br />
37.800<br />
161.000<br />
0.140<br />
0.120<br />
3,709.600<br />
37.580<br />
3.790<br />
20.000<br />
0.003<br />
Minimum<br />
Result<br />
above BG(a)<br />
---<br />
0.050<br />
0.050<br />
0.040<br />
0.040<br />
0.060<br />
2.100<br />
4.200<br />
~.OOO<br />
540.000<br />
0.170<br />
0.300<br />
5.130<br />
0.030<br />
47.800<br />
19.100<br />
70.600<br />
0.140<br />
0.001<br />
18.000<br />
2.690<br />
1.550<br />
20.000<br />
0.001<br />
Average<br />
Result<br />
above BG (a)<br />
126.384<br />
3.141<br />
8.248<br />
8.323<br />
1.366<br />
2.733<br />
8.100<br />
3.000<br />
540.000<br />
1.082<br />
0.442<br />
9.546<br />
0.293<br />
57.120<br />
25.375<br />
115.800<br />
0.J40<br />
0.006<br />
418.822<br />
8.770<br />
2.510<br />
20.000<br />
0.001<br />
Units<br />
ugIL<br />
ugIL<br />
ugIL<br />
ugIL<br />
ugIL<br />
ug/L<br />
ug/L<br />
ug/L<br />
ug/L<br />
mgIL<br />
mgIL<br />
mgIL<br />
mgIL<br />
mgIL<br />
mg/L<br />
mgIL<br />
mgIL<br />
mg/L<br />
pCiIL<br />
p CiIL .<br />
pCiIL<br />
pCiIL<br />
mg/L<br />
• •<br />
(a) Number of analyses/detections include both <strong>environmental</strong> samples and duplicate results<br />
Page I of I<br />
•
• • •<br />
Table 4.28. VOA compounds detected in McNairy groundwater<br />
---- .. ..<br />
Sample<br />
Analytical Interval (ft bls) Resliits Lab Validation Data<br />
Sample Type Group Sample ID Top lBottom Analytical Compound (og/L) Qualifier Qualifier Assessment<br />
Groulldwater VOA 001176WA120 118 118 Trichloroethene 0.070 J ?<br />
00 1177WA 140 147 147 trans-.l ,2-Dichloroethene 0.100 j ?<br />
001178WA120 117 117 2-Propanol 420.000* ?<br />
00 1178WA 140 152 152 Trichloroethene 0.100 J ? BfI-NF:<br />
001181WAI05 107 107 Trichloroethene 15.000* ?<br />
001182WAUO U8 U8 'trichloroethene 0.100 ?<br />
001l83WAI00 102 102 Trichloroethene 5.000* ?<br />
091002WA 100 102 103 Trichloroethene 1.900* J ?<br />
091002WA120 122.4 123.4 cis-1 ,2-Dichloroethene 0.070 J ?<br />
122.4 123.4 Trichloroethene 0.070 J ?<br />
091002WA140 137 138 cis-I ,2-DiChloroethene 0.060 J ?<br />
'720010WA095 96 96 Trichloroethene 7.500* ?<br />
96 96 Vinyl chloride 0.100* J ?<br />
7200 IOWA 120 116 116 Vinyl chloride 0.200* J ?<br />
720012WA090 92 93 trans-I ,2-Dichloroethene 1.000 j ?<br />
92 93 Trichloroethene 12.000* ?<br />
720014WA095 93 93 trans-l,2-Dichloroethene 1.800 J ?<br />
* Result exceeds PRG screening values Page I of 2
~ -<br />
Table 4.28. VOA compounds detected in McNairy groundwater<br />
Sample<br />
Analytical Interval (ft b2S) Results Lab Validation Data<br />
Sample Type Group Sample ID Top JBotto~ Analytical Compound (ugIL) Qualifier Qualifier Assessment<br />
Groundwater VOA 720014W A095 93 93 Trichloroethene 3.000* J ?<br />
720015WA120 120 122 cis-l,2-Dichloroethene 0.070 J ?<br />
120 122 Trichloroethene 0.200* J ?<br />
720017WAUO 116 116 Trichloroethene 0.400* J ?<br />
720019WA120 117 118 Trichloroethene 0.400* J ?<br />
117 118 Vinyl chloride 0.500* J ?<br />
720019WA140 137 138 Trichloroethene 0.100 J ?<br />
137 138 Vinyl chloride 0.300* J ?<br />
720028WAI00 101 101 Trichloroethelle 0.200* J ?<br />
720029WAIOO 101 101 1,I-Dichloroethene 0.200* J ?<br />
101 101 trans-I ,2-Dichloroethelle 0.100 J ?<br />
101 101 Trichloroethene 11.000* ?<br />
Note: McNairy 2roundwater samples not containin2 any detectable VOA compounds are:<br />
001175WAI20 001175WA140 001176WA140 001177WAI05 001177WAI20 001180WAI05 001181WA120 001182WA140 001l84WAI20<br />
001l84WA140 091001WA120 720011WA120 720011WA140 720012WA120 720013WA120 720013WAI40 720014WA120 720014WA140<br />
720017WA140 720018WA120 720018WA140 720028WA120 720029WA120 720029WA140<br />
* Result exceeds PRG screenin2 values Page 2 of2<br />
• • •
~-<br />
----_<br />
• • •<br />
Table 4.29. Metals detected above DO in McNairy groundwater<br />
.. __ ..<br />
~ - --<br />
Sample<br />
Analytical Interval (rt bgs) Results Lab Validation Data BG<br />
Sample Type Group Sample III Top !lJottom Analytical Compoulld (mgIL) Qualifier QuaHfier Assessment (mgIL)<br />
Groundwater METAL-D 00 11 77\vA 105 107 10' Manganese 1.14000* ? 0.16000<br />
001l77WA120 127 127 Manganese 0.52000* ? 0.16000<br />
001l77WA140 147 147 Manganese 0.49000* ? 0.16000<br />
001l81WA120 127 127 Iron 10.10000* ? 5.10000<br />
127 127 Manganese 0.72000* ? 0.16000<br />
001183WA 100 102 102 Manganese 0.74000* ? 0.16000<br />
720011WA120 117.5 117.5 Iron 10.00000· ? 5.10000<br />
117.5 117.5 Manganese 0.40000* ? 0.16000<br />
7200 II W t\ 140 134.5 134.5 Iroll 5.89000* ? 5.10000<br />
134.5 134.5 Manganese 0.46000* ? 0.16000<br />
720013WA120 117 117 Manganese 0.73000* ? 0.16000<br />
7200 13WA 140 137 137 Barium 0.48000* ? 0.29000<br />
137 137 Calcium 54.10000* ? 44.00000<br />
137 137 Iron 8.44000* ? 5.10000<br />
137 137 Magnesium 19.00000* ? 17.00000<br />
137 137 Manganese 9.60000* ? 0.16000<br />
137 137 Vanadium 0.21000* ? 0.14000<br />
* Result exceeds PRG screening values Page 1 of2
Table 4.29. Metals detected above BG iii McNairy groundwater<br />
. - ._-<br />
---- ------<br />
Sample<br />
Analytical Interval (ft bes) Results Lab Validation Data BG<br />
Sample Type Grolip Sample ID Top I Bottom . Analytical Compound (mgIL) Qualifier Qualifier Assessment (rog/L)<br />
._-<br />
..<br />
Gr9ugdwater METAL-D 720017WA120 116 116 Iron 13.60000* ? 5.10000<br />
116 116 Manganese 0.71000* ? 0.16000<br />
720017WA140 136 136 Iron 19.20000* ? 5.10000<br />
136 136 Manganese 0.58000* ? 0.16000<br />
720028WA120 116 116 Manganese 0.20000* ? 0.16000<br />
720029W A I 00 101 101 Manganese 0.45000* ? 0.16000<br />
720029W A 120 121 121 Manganese 0.29000* ? 0.16000<br />
720029WA140 136 136 Iron 5.23000* ? 5.10000<br />
136 136 Manganese 0.45000* ? 0.16000<br />
Note: McNairy groundwater samples not containing any detectable metals at concentrations above background are:<br />
720028W Al 00<br />
* Result exceeds PRG screening values Page 20f2<br />
• • •
• • •<br />
Table 4.30. Radioactive isotopes detected above BG in McNairy groundwater<br />
--<br />
Sample<br />
Analytical Interval (ft bES) Results** Lab Validation Data BG**<br />
Sample Type Group SamplelD Top IBottom Analytical Compound (pCiIL) Qualifier QtJalifier Assessment (pCiIL)<br />
Groundwater RADS 00 1l75WA140 141 141 Uranium 0.170* ? 0.000<br />
001l76WAI40 138 138 Uranium 0.040* ? 0.000<br />
001l77WA140 147 147 Uranium 0.010* ? 0.000<br />
001l78WAI20 H7 117 Uranium 0.004 ? 0.000<br />
001180WAI05 107 107 Technetium-99 25.400 ? 0.000<br />
107 107 Uranium 0.001 ? 0.000<br />
OOllS2WA 140 137 137 Uranium 0.120* ? 0.000<br />
00U83WAIOO 102 102 Technetium-99 27.800 ? 0.000<br />
102 102 Uranium 0.002 ? 0.000<br />
001184WAI20 127 127 Uranium 0.020* ? 0.000<br />
09 1 002WA 100 102 103 Thorium-230 1.530* ? 1.400<br />
102 103 Uranium 0.003 ? O.OOe)<br />
091002WAI20 122.4 123.4 Thorium-230 16.900* ? 1.400<br />
122.4 123.4 Uranium 0.020* ? 0.000<br />
091002WAI40 137 138 Thorium-230 53.770* ? L400<br />
137 138 Uranium 0.100* ? 0.000<br />
720010WA095 96 96 Technetium-99 29.300* ? 0.000<br />
* Result exceeds PRG screening values Page 1 of 3<br />
** Results and background values for Uranium given in mgIL
Table 4.30. Radioactive isotopes detected above BG<br />
-<br />
in McNairy groundwater<br />
-_._"<br />
Sample<br />
Analytical Interval (ft bes) Results** Lab Validation Data BG**<br />
Sample Type Group Sample ID Top I Bottom Analytical Compound (pCiIL) Qualifier Qualifier Assessment (pCiIL)<br />
-- --- --<br />
Groundwater RADS 720010WA095 96 96 Uranium 0.002 ? 0.000<br />
720011WA140 134.5 134.5 Uranium 0.003 ? 0.000<br />
720012WA120 117 118 Uranium 0.020* ? 0.000<br />
7200 13WA120 117 117 Uranium 0.005* ? 0.000<br />
720013WA140 137 137 Uranium 0.030* ? 0.000<br />
720014W A095 93 93 Technetium-99 27.500 ? 0.000<br />
93 93 Uranium 0.005* ? 0.000<br />
7200 18WA 120 116 116 Uranium 0.002 ? 0.000<br />
720019WA120 117 118 Uranium 0.001 ? 0.000<br />
720028W A 120 116 116 Uranium 0.020* ? 0.000<br />
720029W A 140 136 136 Uranium 0.010* ? 0.000<br />
RADS-D 00117SWAI40 141 141 Uranium 0.001 ? 0.000<br />
001176WA140 138 138 Uranium 0.001 ? 0.000<br />
001177WA140 147 147 Uranium 0.001 ? 0.000<br />
00 1178WA120 117 117 Uranium 0.001 ? 0.000<br />
001182WA140 137 137 Uranium 0.001 ? 0.000<br />
001183WAI00 102 102 Uranium 0.001 ? 0.000<br />
* Result exceeds PRG screening values Page 2 of3<br />
** Results and background values for Uranium given in mg/L<br />
• • •
• • •<br />
Table 4.30. Radioactive isotopes detected above BG in McNairy groundwater<br />
-- -<br />
Sample<br />
Analytical Interval (ft b2S) Results** Lab Validation Data BG**<br />
Sample Type Group Sample ID Top I Bottom Analytical Compound (pCi/L) Qualifier Qualifier Assessment (pCi/L)<br />
Groundwater RADS-D 001184WA120 127 U7 Uranium 0.001 ? 0.000<br />
091002WAI00 102 103 Uranium 0.001 ? 0.000<br />
091002WA120 122.4 123.4 Uranium 0.001 ? 0.000<br />
091002WAI40 137 138 Uranium 0.001 ? 0.000<br />
7200 1 OWA095 96 96 Uranium 0.001 ? 0.000<br />
720011WA140 134.5 134.5 Uranium 0.001 ? 0.000<br />
720012WA120 117 118 Uranium 0.001 ? 0.000<br />
720013WAI20 117 117 Uranium 0.001 ? 0.000<br />
720013WA140 137 137 Uranium 0.001 ? 0.000<br />
720014W A095 93 93 Uranium 0.001 ? 0.000<br />
7200 18W A 120 116 116 Uranium 0.001 ? 0.000<br />
7200 19WA 120 117 118 Uranium 0.001 ? 0.000<br />
720028W A 120 116 116 Uranium 0.00 I ? 0.000<br />
720029W A 140 136 136 Uranium 0.001 ? O.O()O<br />
Note: McNairy 2roundwater samples not containin-= any detectable radioactive isotopes at concentrations above back-=round are:<br />
001175WA120 001176WA120 001177WAI05 001177WAI20 001178WA140 001181WAI05 001181WA120 001182WA120 001l84WA140<br />
09100lWAI20 720010WAI20 720011WA120 720012VVA090 720014WA120 720014WA140 720015WAI20 720017WA120 7~0017WA140<br />
720018WA140 nOOl9WAI40 720()28WAIOO 720029WAI00 720029WA120<br />
* Result exceeds PRG screening values Page 3 of 3<br />
** Results and background values for Uranium given in mg/L
Table 4.31. Frequency of detection of organic compounds, metals, and radioactive isotopes exceeding BG<br />
in McNairy groundwater<br />
Sample Type<br />
Groundwater VOA<br />
Analytical Group<br />
"<br />
Metals -<br />
dissolved<br />
Radioactive<br />
isotopes<br />
Radioactive<br />
isotopes -<br />
dissolved<br />
- .<br />
Analytical Compound<br />
.<br />
Tnchloroethene<br />
trans-I,2-Dichloroethene<br />
Vinyl chloride<br />
cis-I,2-Dichloroethene<br />
I,I-Dichloroethelle<br />
2-Propanol<br />
Manganese<br />
Iron<br />
BariulD<br />
Calcium<br />
Magnesium<br />
Vanadium<br />
Uranium<br />
Technetium-99<br />
Thorium-230<br />
Uranium<br />
Number of<br />
Analyses (a)<br />
"<br />
50<br />
50<br />
50<br />
50<br />
50<br />
6<br />
16<br />
16<br />
16<br />
16<br />
16<br />
16<br />
21<br />
21<br />
9<br />
20<br />
Number of<br />
Detections<br />
above BG (a)<br />
16<br />
4<br />
4<br />
3<br />
1<br />
1<br />
15<br />
7<br />
1<br />
1<br />
1<br />
21<br />
4<br />
3<br />
20<br />
Number of<br />
Detections<br />
above BG &<br />
PRG<br />
Screening<br />
Values (a)<br />
11<br />
o<br />
4<br />
0<br />
1<br />
1<br />
15<br />
7<br />
1<br />
1<br />
1<br />
1<br />
13<br />
I<br />
3<br />
0<br />
Maximum<br />
Result<br />
above BG (a)<br />
--<br />
15.000<br />
1.800<br />
0.500<br />
0.070<br />
0.200<br />
420.000<br />
9.600<br />
19.200<br />
0.480<br />
54.100<br />
19.000<br />
0.210<br />
0.170<br />
29.300<br />
53.770<br />
0.001<br />
Minimum<br />
Result<br />
above BG(a)<br />
0.070<br />
0.100<br />
0.100<br />
0.060<br />
0.200<br />
420.000<br />
0.200<br />
5.230<br />
0.480<br />
54.100<br />
19.000<br />
0.210<br />
0.001<br />
25.400<br />
1.530<br />
0.001<br />
Average<br />
Result<br />
above BG (a)<br />
3.565<br />
0.750<br />
0.275<br />
0.067<br />
0.200<br />
420.000<br />
1.165<br />
10.351<br />
0.48()<br />
54.100<br />
19.000<br />
0.210<br />
0.028<br />
27.500<br />
~4.067<br />
0.001<br />
Units<br />
ugIL<br />
ug/L<br />
ugIL<br />
ugIL<br />
ugIL<br />
ugIL<br />
mgIL<br />
mgIL<br />
mgIL<br />
mgIL<br />
mg/L<br />
mgIL<br />
mgIL<br />
pCi/L<br />
pCiIL<br />
mgIL<br />
• •<br />
(a) Number of analyses/detections include both <strong>environmental</strong> samples and duplicate results<br />
Page 1 of 1
•<br />
5. CONTAMINANT FATE AND TRANSPORT<br />
5.1 INTRODUCTION<br />
This section provides an overview of the release mechanisms, potential migration<br />
pathways, mechanisms for transport, and behavior of radiological and chemical substances<br />
reported in the four sites evaluated in this report, i. e., SWMUs 001, ;091, and 196, and the C-720<br />
Complex (which includes SWMU 167). The fate and transport of site-related contaminants are<br />
important in assessing the potential for exposure to these contaminants, as well as the potential<br />
changes in concentration or migration ,jf no actions are taken, Risk management decisions are<br />
based in part on the following issues:<br />
o<br />
Potential for direct contact with chemicals in surface soil and.sediment<br />
• Potential for residual constituents in soils to impact groundwater<br />
• Potential for continued migration of groundwater contaminants to impact down gradient<br />
receptors<br />
•<br />
The potential risks associated with residuals in the <strong>environmental</strong> media relate to<br />
changes in concentration over time (persistence) and migration to downslope or downgradient<br />
areas .<br />
Physical, chemical, and 'biological processes affect the nature and distribution of<br />
chemicals in the environment. Because WAG 27 is composed of four sites. migration is<br />
addressed for the entire WAG 27 area. Although in many instances the specific chemicals.<br />
sources, and concentrations differ across the four sites, .physio-chemical and hydrogeologic<br />
conditions that affect the migration and fate of contaminants are similar.<br />
This section presents the following:<br />
o<br />
Overview of the conceptual site model, sources, and transport pathways for each site<br />
• Chemical'-specific discussions of common constituents at WAG 27. including the properties<br />
that influence migration<br />
o<br />
Discussion of the soil leachability analysis<br />
Computer-based contaminant fate and transport modeling analyses (leachability analysis)<br />
were performed to predict the maximum concentration of source-related COPCs at ,the site<br />
boundary based on the most current chemical data. These analyses indicate likely future<br />
contaminant concentrations at receptor locations via multiple media. The ultimate objectives of<br />
the analyses were to evaluate potential future impacts to human health and the environment and<br />
to provide a basis for evaluating the effectiveness of proposed remedial alternatives in the FS.<br />
The principles of contaminant fate .and transport analysis and the results of modeling<br />
activities are summarized in this section. Section 5.2 presents a conceptual model for potential<br />
contaminant migration pathways at WAG 27 that considers site topography, geology, hydrology,<br />
and site-related chemicals. Section 5.3 presents a discussion of the persistence of the contaminants<br />
in the environment and the ,physical and chemical properties of the site-related chemicals that were<br />
ATLI983500009 Sec5].doc 5-1
5-2<br />
used in the fate and transport modeling. Contaminant release mechanisms and transport media are<br />
also described in this section. Chemical migration rates for the WAG 27 COCs are presented in<br />
Sect. 5.4. Section 5.5 presents a soil leachability analysis, including its application and underlying<br />
assumptions. A discussion of uncertainties associated with the modeling results is also presented<br />
in Sect. 5.5.<br />
•<br />
5.2 CONCEPTUAL SITE MODEL<br />
The conceptual site model (CSM) developed for WAG 27 is a representation of known<br />
site conditions that serves as the framework for .quantitative modeling. Site conditions described<br />
by the CSM include waste source information, the surrounding geologic and! hydrologic<br />
conditions, site-related chemicals, and current spatial distribution of the site-related chemicals.<br />
This information is combined to identify the likely.chemical migration pathways. See Sect. 4 for<br />
the conceptual model for each of the WAG 27 sites.<br />
Potential source areas include a pit that contained a brine during one test period and a<br />
TCE-dry ice slurry during a second test period~ a landfarm used to biodegrade Waste oils, former<br />
septic systems , and a sump and floor drains used to dispose of chemicals. Releases from these<br />
sources would directly impact soils below or adjacent to the source andlor sediments and surface<br />
water in nearby drainages. Continuing transport processes may also result in secondary releases<br />
that may impact larger areas or affect additional <strong>environmental</strong> media. Transport processes<br />
likely to be active at the site include vertical! infiltration in soil, lateral and vertical migration in<br />
groundwater, soil erosion and surface runoff, volatilization, and mobilization of dust particles .<br />
The air pathway is not a viable exposure route; air monitoring during the field<br />
investigation indicates no impacts to on-site workers. Surface water is not a viable exposure<br />
pathway for the site because all runoff from the site flows into. surface ditches, the storm sewer<br />
system, and eventually into Outfalls 8, 9, and 15. Water flow in these ditches is intermittent<br />
based on seasonal rainfall. The plant ditches are generally considered to be located in areas<br />
where the local groundwater table is below the bottoms of the ditches. Therefore, the ditches<br />
probably function.as influent (losing) streams most of the time, resulting in some discharge to the<br />
subsurface. However, some sediment samples were collected to confirm that runoff is not a<br />
potential pathway for migration at these sites. Current data indicate no impacts to these surface<br />
waters. All these routes of surface-water contaminant migration ultimately discharge to Bayou<br />
Creek. A more detailed description of the air and surface-water pathways is presented in<br />
Appendix C of Vol. 3 (MEPAS Modeling).<br />
•<br />
Data were collected during the RI to characterize potential exposure pathways, including<br />
groundwater and surface and subsurface soil. Where data on source characteristics were lacking,<br />
sampling was also performed to evaluate the nature of the .source. Based on this evaluation, a<br />
fate and transport model was developed and used to simulate vertical transport of contaminants<br />
from source areas to the UCRS and RGA (see Sect. 5.5). The simulations were used to establish<br />
maximum concentrations in the RGA at the property boundary and the risk associated with the<br />
simulated concentrations to potential receptors.<br />
5.2.1 Contaminant Sources, Release Mechanisms, and Migration Pathways<br />
In accordance with historical process knowledge and the fmdings of sampling and •<br />
analysis performed at WAG 27, several contaminant sources have been identified'. Detections of .<br />
ATlJ983500009 Sec5_,.doc
•<br />
5-3<br />
chemicals in soil and groundwater confirm the potential for media-specific chemical transport.<br />
The mignition pathways discussed below by site appear to be the most viable exposure routes<br />
and include the potential for:<br />
o Leaching of contaminants through soil to groundwater<br />
• Migration of groundwater to downgradient receptors<br />
The sources, release mechanisms, and pathways for migration are as follows:<br />
SWMl:1 001. The source of release is the landfarmthat was used from 1973 to 1979 for the<br />
biodegradation of waste oils contaminated with TCE, 1,I:,I-TCA, uranium, and PCBs. It is<br />
estimated that at least 5000 gal of waste oil was applied to the landfarm over the 6-year<br />
period; oil was added at 3- to 4-month intervals. The sources of the waste oils were not<br />
reported,but it is assumed the oils were from virtually all areas of the plant. Contaminants in<br />
the surface soil have, in the past, percolated into subsurface soil, ultimately contaminating<br />
groundwater.<br />
•<br />
SWMU091. ,PGDP conducted cylinder drop tests at SWMU 091. The tests were perfonned<br />
in late 1964 and early 1965 and in February 1979. The ,1979 test used a TCE and dry-ice<br />
bath to chill one of the steel cylinders prior to testing. The cylinder was placed in a pit<br />
containing approximately 572 gal ofTCE prior to the drop test.<br />
The source of contamination was the TCEpit, which no longer exists. The contents of the<br />
pit leaked into the subsurface soil, then percolated into the deeper zone, possibly reaching the<br />
saturated zone.<br />
• SWMU 196. This SWMU consists of two abandoned septic systems that were operated from<br />
April 1956 to February 1980. Modifications to the facility included the addition of various<br />
sanitary waste operations and conversion of operations within the building to nickel and:<br />
aluminum smelting. All floor drains have been removed. Current operations at ,the SWMU<br />
inClude storage of hazardous and 'PCB waste. According to a 1993 DOEll:JSEC facility<br />
transition report, there is a potential for heavy metal and radiological contamination in the<br />
septic systems.<br />
The sources of contamination for SWMU 196 are subsurface leaks from the ,tanks or drain<br />
fields and surface soil contamination from excavation of the lines feeding the leachfield.<br />
Contaminants in the surface soil percolate into subsurface soil and eventually into<br />
groundwater. Alternatively, contaminants in the surface soil are transported via runoff to<br />
surface water (Le., ditches and creeks).<br />
•<br />
• C-720 Complex. The C-720 Building was built in 1953 and housed the Compressor Shop.<br />
Fluids drained from,compressors in the shop were directed into the compressor trench, which<br />
is located to the west of the Compressor Shop pit. One floor drain ,located in the ,compressor<br />
trench drains by gravity from west to east into the Compressor Shop pit. The design of the<br />
Compressor Shop pit is. such that if the sump pump located in the northwest portion of the pit<br />
fails and if liquid fills the sump to 'the height at which the subterranean drain discharges into<br />
the sump (3.5 ft above the bottom of the sump), the liquid will backup into the subterranean<br />
drain and (because of the construction of the drain system} will be released into the
5-4<br />
surrounding soil. There are no documented releases of this nature; therefore, no quantitative<br />
estimates are available. Based on practices perfonned in this area. the analytes of interest<br />
associated with these processes include SVOAs (from the fluid discharged from the<br />
compressors), TCE and its degradation products (degreasing agents), and metals and<br />
radionuclides (both released during the degreasing process).<br />
•<br />
The White Room (SWMU 167), which is located in the C-720 Building, was part of the<br />
process used to build and clean circuit boards. Waste solutions associated with printed<br />
circuit board operations were discharged to the sump, flushed through limestone to neutralize<br />
acids, and ultimately discharged to the building drainage system. Wastes associated with<br />
processes performed in, this area include TCE, cyanide, gold, silver, tin, lead, and chromium.<br />
According to the SWMU Assessment Report (SAR) 167, the integrity of the sump 'has not<br />
been established and therefore the sump is considered a possible pathway for release. The<br />
sump is no longer in use, and the sludge in the sump was sampled during two separate events<br />
in J.992 to determine the potential health hazard that would exist if the sump were to remain<br />
unfilled. PCBs were detected in the sludge at concentrations ranging from 1.8 to 2.5 mgIL.<br />
The C-720 building drainage system is a source of contamination. 'The major releases. from<br />
this system are subsurface leaks from the subterranean drain located near the Compressor<br />
Shop pit, leaks from the White Room sump, and leaks and/or discharges from ,the ,major exit<br />
points of the stormwatersystem as it exits the building.<br />
Contaminants in the subsurface soil! percolate into deeper strata. ultimately contaminating<br />
groundwater.<br />
5.2.2 Hydrologic Properties<br />
A description of the site hydrogeology and hydrology is provided in Sect. 3. Stormwater<br />
runoff from WAG 27 is captured by the stonnwater drainage system, consisting of sewers and<br />
ditches. Flow from the site is ina westerly direction, and ,the discharge points (Outfalls 8,9, and 15)<br />
are located along Bayou Creek.<br />
Three hydrogeologic units underlie PGDP and control the flow of groundwater and thus<br />
contaminant migration. These are, in descending order:<br />
o<br />
UCRS: approximately 50 ft of discontinuous and variable interfingerings of sand, silt, clay,<br />
and gravel beneath an overlying loess deposits<br />
9 RGA: approximately 70 ft of gravel, sand, and silt deposits that overlie the McNairy<br />
Formation<br />
e<br />
McNairy Formation: approximately 225 ft of a sandy silty confming clay<br />
For modeling purposes, it was assumed that the UCRS is not perennially saturated.<br />
Instead, it was assumed that groundwater infiltrates and migrates downward to recharge the<br />
RGA. This is a conservative assumption because, if saturated conditions in UCRS were<br />
assumed, contaminant transport through it would have been further attenuated.<br />
Computer simulations of vertical transport from the UCRS to the RGA and horizontal<br />
transport within the RGA to receptor 'locations were also performed. The results of these<br />
simulations are presented in Sect.5.4 and in Appendix C of Vol. 4,<br />
•<br />
ATIJ983500009 Sec5_r.doc
5-5<br />
5.2.2.1 WaterBaJance<br />
A water balance is a means of quantitatively accounting for all of the components of the<br />
hydrologic cycle at a site. The components of a simple steady-state water balance model include:<br />
precipitation (P), evapotranspiration (ET), ·surface runoff (Sr), and groundwater recharge or deep<br />
percolation (Gr). The simple steady-state model is defmedas follows:<br />
P=ET+Sr+Gr<br />
P-ET=Sr+Gr<br />
The amount of rainfall that enters the surface runoff and groundwater recharge<br />
compartments (Sr + Or) is the amount available to promote chemical migration away from a<br />
waste source. The annual average water balance estimates, derived primarily from the Geotrans<br />
(1992) model for PGOP, are:<br />
• Evapotranspiration, = 54% of total rainfall<br />
• Surface runoff = 38% of total rainfall<br />
•<br />
• Groundwater recharge (percolation) = 8% of total' rainfall; a small amount of which, (7% of<br />
the recharged water) flows laterally through the top portion of surface soil and is discharged<br />
to the surface-water drainage system prior to reaching the saturated: zone. For this analysis,<br />
the saturated zone is the UCRS.<br />
A past study (Geotrans 1992) has suggested that as mucb as 93% of the recharge to the<br />
UCRS may flow downward to recharge the RGA.<br />
5.2.3 Sile-relatedChemicals<br />
Site-related chemicals for WAG 27 are identified in Sect.4. These chemicals were<br />
detected frequently and at elevated concentrations in various <strong>environmental</strong> media. It is<br />
important to note that all waste-source chemicals that were detected at least once (above<br />
screening criteria) are addressed in the quantitative fate and transport modeling. The primary<br />
site-related chemicals are:<br />
• YOAs, including TCE and its degradation products (cis-ll,2-0CE, trans-l,2..;OCE, and vinyl<br />
chloride), and carbon tetrachloride<br />
• Tc-99, Cs-137, Np-237, Pu-239, Tb-230, and uranium and its decay products U-234, U-235,<br />
and U-238<br />
• Fourteen metals: arsenic, barium, berylliuIn, cadmium, chromium, copper, iron, lead,<br />
manganese, mercury, nickel, silver, thallium, and vanadium<br />
• PCBs<br />
o<br />
SYOAs, including bis2( ethylhexyl)phthlate, 4-chloro-3-methylphenol, and'di-n-octylphthlate<br />
•<br />
AT\.J983500009 Sec5J.doc
5.3 CHEMICAL PROPERTIES<br />
5-6<br />
The physical and chemical properties of the primary chemicals reported at WAG 27 that<br />
affect contaminant migration are presented in Tables 5.1 through 5.3. Organic and inorganic<br />
chemicals with high solubilities are more mobile in water than those that sorb more strongly to<br />
soils. Henry's Law constants are a measure of the partitioning of a chemical between the air<br />
phase and water phase. Because of the abundance of water in the environment, this property is<br />
best used to estimate the tendency to volatilize.<br />
The following are properties that must be measured when identifying a compound's<br />
mobility within.a specific medium:<br />
•<br />
CI<br />
Koc. the soil organic carbon partition coefficient. is a measure of the tendency for organic<br />
compounds to be adsorbed to the organic matter of soil and sediments. Koc: is expressed as<br />
the ratio of the amount of chemical adsorbed per unit weight of organic carbon to the<br />
chemical concentnltionin solution at equilibriuJa<br />
• Kow. the octanol-water partition coefficient, is an indicator of hydrophobicity (the tendency<br />
of a chemical to avoid the aqueous phase) and is correlated with potential adsorption to soils.<br />
It is also used to estimate the potential for bioconcentration of chemicals into tissues.<br />
• Kct, the soil/water partition coefficient, is a measure of the tendency of a chemical to adsorb<br />
to soil or sediment particles. For organic compounds, this coefficient is calculated as the<br />
product of the Koc value and the fraction of organic carbon in the soils. In general, chemicals<br />
with higher Kct values sorb more strongly to soil/sediment particles and are less mobile than<br />
those with lower Kct values.<br />
•<br />
Chemical distributions in both soil and water are more difficult to predict for metals than<br />
for organic compounds. A direct relationship between the measured total metal concentration in<br />
soil and the extractable aqueous concentration cannot be assumed. The metal may be fixed in,the<br />
interior of the soil and unavailable for exchange or release to water, or exchangeable metal may<br />
be present at the surface of the particles.<br />
Published Kct values generally represent the potential relationship between water and<br />
exchangeable metal at the surface of the soil, which is as follows:<br />
COIaI = Cmm + Cadlortled<br />
Kct = CadsorbecII'Cwater<br />
where<br />
C~ocaJ =<br />
Cfixcd =<br />
C adlorbed =<br />
Cwarer =<br />
total concentration of metal ~fixed plus adsorbed)<br />
fixed concentration of metal<br />
adsorbed concentration of metal<br />
concentration of metal in water<br />
This relationship is useful in determining retardation (the tendency for the metal to sorb<br />
to the surface of the soil), but it does not relate the total metal! concentration in the solid to a<br />
dissolved concentration.<br />
•<br />
ATlJ983500009 Sec5_r.doc<br />
---- -----------
•<br />
5.3.1 P AHsIPCBs<br />
5-7<br />
PAHs are common components of fuel oils and tar mixtures. Fuel use, vehicular traffic,<br />
and asphalt surfaces can contribute to detected 'levels ·of PAHs. PAHs are relatively persistent<br />
and represent a broad' class of compounds ranging from low molecular weight components (such<br />
as naphthalene) to high molecular weight compounds [such as dibenzo(a,h)anthracene).<br />
Solubility, volatility, biodegradability, and toxicity vary widely across this class of compounds.<br />
Volatility, as indicated by the Henry's Law conStant, decreases as the molecular weight<br />
of ·PAHs increases. Particulate emissions to ambient air can result from adsorption onto.soot<br />
particles that can be carried on wind currents and then returned to the surface· (dry deposition~~<br />
High molecular weight P AHs are more likely to be transported'via particulate emissions, whereas<br />
low ,molecular weight PAHs have a higher tendency to volatilize.<br />
The behavior of P AHs in tar and oil waste mixtures is determined to a large extent by the<br />
mobility and' behavior of the waste itself. For example, as tar waste weathers, volatilization,<br />
degradation. and leaching of the more mobile constituents occur. The overa1llossrate decreases<br />
exponentially over time,and the material left behind becomes richer in more viscous and<br />
persistent components. Therefore, low molecular weight P AHs can migrate from spills and<br />
continuous releases of tars and oils; however. as weathering occurs, the rate of release decreases.<br />
Higher molecular weight PARs would persist in the vicinity of the originall release.<br />
•<br />
Lower molecular weight PAHshave higher water solubilities and are more likely to be<br />
released into groundwater than higher weight molecular weight PAH compounds. The. higher<br />
molecular weightPAHs have relatively high Koc values, indicating an increased tendency for<br />
adsorption to soil or other organic matter. A primary fate and transport mechanism is the<br />
migration of adsorbed P AHs with mobile soil and sediment. The erosion of soil and movement<br />
of suspended sediments may result in PAR migration to surface water. However, the low<br />
solubility of adsorbed 'P AHs indicates that they would not partition significantly to water. Most<br />
PAHs in aquatic environments are associated with particulate materials. Only about 33% are<br />
present in dissolved form (SAle 1998).<br />
Photolysis, oxidation, and biodegradation are common attenuation mechanisms for PAH<br />
compounds. Although all PAHs transform in the presence of light via photolysis, their<br />
transformation rates are highly variable. Photolysis may reduce the concentrations of these<br />
chemicals in surface waters or surface soils, but is not relevant for subsurface soils.<br />
Biodegradation rates of PAHs in soils are also extremely variable across 'the chemical Class.<br />
Generally, the dicyclic and tricyclic PAHs biodegrade more readily than the higher molecular<br />
weightPAHs. Factors that affect the rate of biodegradation in soils include the types of<br />
microorganisms present, the availability of nutrients, the presence of oxygen, and the chemical<br />
concentration. The extent to which chemicals may biodegrade also can be affected by their<br />
presence in mixtures. SomePAHs are more degradable than, others. If both stable and mobile<br />
PARs are present in a mixture, the less degradable materials may be co-metabolized at rates<br />
similar to or greater than the rates of the more degradable compounds.<br />
•<br />
In general, PAHs are not mobile in soil or groundwater. Model simulations of . solute<br />
transport of PAHs in soil (Clausen 1996) and their physical properties (Table 5.1) indicate<br />
limited migration potential (Table 5.2). The distributions ofPAHs and PCBs are not widespread;<br />
these compounds are limited to the shallow subsurface soils, and none were detected in the<br />
groundwater. The majority of the PAHs were detected at SWMU 001'; however, none at
5·8<br />
SWMU 001 were detected above PRGs or background concentrations. The only PAHs detected<br />
above PRGsor background concentrations were those reported in soil at the C-720 Complex.<br />
•<br />
5.3.2 Chlorinated VOAs<br />
Chlorinated VOAs were detected at SWMU 001, SWMU 09i, and C-720. These are<br />
related to the use of solvents such as TCE, PCB, or l,l,l-TCA, which are typically used for<br />
degreasing activities, and in the case of SWMU 091 the brine and TCE-dry ice slurry used to<br />
submerge the steel cylinders. In addition to these solvents, common degradation products were<br />
detected, including 1,2-DCE (related to the degradation ofPCE or TCE), l,l-DCE, and l,l-DCA<br />
(related to the degradation of 1,1,I-TCA).<br />
The nature of the release is considered in interpreting constituent patterns. When<br />
releases are associated with aqueous discharges that contain trace amounts of solvents, migration<br />
is associated with the behavior of the aqueous phase. In some instances, the organic solvent<br />
itself could be spilled or released, in which case the migration of the organic phase must be<br />
considered. The presence of a solvent phase is generally suspected only when high<br />
concentrations of chlorinated VOAs are reported. These constituents were reported at various<br />
sites at levels that typically ranged from trace amounts to values as high as 1,578 J.1g/L. At<br />
SWMU 001 and the C-720 Complex, maximum concentrations of TCE exceeded 1,578 and<br />
1,262 J.1g/L, respectively. EPA (1991b) suggests that a groundwater concentration equal to 1 %<br />
effective solubility (TCE = 11,000 J.1g/L) is a good indicator of DNAPL. Therefore, the<br />
implications of a solvent phase would not be relevant. However, historical data indicate that TCE<br />
was detected in MW-160 at 94,OOOug/L at SWMU 091 (September 14, 1993) and in MW-16 1, in<br />
excess of 23,000 ugIL at SWMU 001 (May 8, 1995). Furthermore, the 15-ft bgs soil sample in<br />
boring 001-065 had a TCEconcentration of 439,000 ug/L. This level exceeds the TCE DNAPL<br />
indicator concentration of 225,000 ug/L, determined from tests performed at SWMU 091 (LMES<br />
1997). Overall, the levels of TCE in groundwater at SWMU 001 and the C-720 Complex have<br />
declined over the past 3 years, as indicated by the most recent data. Dispersion, diffusion, and<br />
degradation have contributed to the observed trend.<br />
These chemicals have high vapor pressures and Henry's Law constants, indicating a<br />
potential for volatilization. Therefore, they are not expected to persist in surface soils. The rate<br />
of loss from volatilization depends on the compound, temperature, soil gas permeability, and<br />
chemical-specific vapor pressure.<br />
Release and transport mechanisms include vertical migration through unsaturated soils<br />
toward the water table. The range of Koc: values indicates that chlorinated VOAs are mobile<br />
through soils and tend not to partition significantly from water to soil. As these compounds<br />
migrate through soil, some are retained in the pore spaces. Some VOAs may spread across layers<br />
of lower permeability. Lateral migration may occur if a low-permeability zone (or higher<br />
permeability zone) is reached, in which case the non-aqueous phase liquids (N~Ls) will<br />
migrate, depending in part on the contours of the layer surface. Generally, the flow is<br />
predominantly vertical through more permeable zones, such as those formed by sandy materials.<br />
Biodegradation and chemical degradation are important considerations in evaluating<br />
chlorinated solvents because of the potential formation of chemicals of potential concern<br />
(COPCs) anellor losses of COPCs. The redox conditions in the RGA appear to be somewhat<br />
variable; however, the groundwater chemistry indicates that only limited anaerobic degradation<br />
is occurring.<br />
•<br />
•
•<br />
•<br />
5-9<br />
Aerobic and anaerobic biodegradation are important transformation processes for<br />
chlorinated aliphatic compounds in natural water systems and soil. Considerable research has<br />
been done on the degradation mechanisms and pathways for this class of compounds. Although<br />
several degradation pathways could occur for these constituents, the patterns described below<br />
have been identified for degradation under anaerobic conditions. The anaerobic degradation<br />
pathway is as follows:<br />
PCE--> TCE--> DCE--> vinyl chloride or chloroethane<br />
The anaerobic biodegradation of TCE, which initially fonns cis-l,2-DCE, occurs under<br />
reducing conditions where sulfide- andlor methane-producing conditions exist. Such conditions<br />
occur primarily in the presence of other natural or anthropogenic carbon sources such as the oil<br />
that was applied to the landfarm at SWMU oot.The total organic carbon (TOC) level in soil'<br />
ranged from a low of 248 mg/kg at location 001-071 (SWMU 001) to 4550 mg/kg at 'location<br />
001-075 (SWMU 001), and averaged 801 mglkg. A higher TOClevel, possibly due to the<br />
availability of oil (source of free carbon) indicates a greater potential for VOAs .to sorb to soil,<br />
which maybe why more 'FCE is not present in the groundwater within and downgradient of the<br />
source (centered around location 001-065). DCE is an indicator for this degradation pathway,<br />
because it is not used as a ,pure product but is found solely as a degradation product. 1,2~DCE<br />
may further degrade anaerobically to vinyl chloride, but the rate is slower and the process may<br />
require stronger reducing conditions than those required for reduction of PCE or TCE.<br />
This condition persists for the WAG 27 sites, since l,2-DCE was present; however, a much<br />
lower concentration relative to TCE and vinyl chloride was rarely detected as a degradation<br />
product. In most cases, the ratios ofTCE to DCE were high, indicating that TCE was not readily<br />
transforming into 1,2-DCE. Ratios of TCE to 1,2-DCEfor SWMU 001, SWMU 09'1, and C-720<br />
ranged from 1 to 270, and typically exceeded 40. In addition, at the locations where TCE levels<br />
were highest, no degradation products were detected. At SWMU 00,1, the ratio of TCE to 1,2-<br />
DCE at the source (centered around the 001"()65 area) was 43. Ratios of these compounds<br />
downgradient oCthe source at 001-075 and ,001-080 were 48 and 44, respectively, indicating little<br />
transformation of TCE to DCE. A few locations (720-001, 720-002, 720-008, and 720-025 at<br />
SWMU 001) did exhibit the presence of l,2-DCE and vinyl chloride at favorable ratios,<br />
indicating biodegradation.<br />
TCE generally would be ,expected to persist under aerobic or denitrifying conditions.<br />
Denitrifying conditions are indicated when nitrates are present in groundwater, but no oxygen is<br />
present.<br />
Aerobic biodegradation of TCEmay occur under certain conditions. For example,<br />
specialized microorganisms have been identified that aerobically degrade some of these solvents<br />
in the ,presence of ammonia, methane, and toluene. Lower molecular weight chlorinated<br />
hydrocarbons, such as DCE, undergo anaerobic degradation less readily than the higher<br />
molecular weight chlorinated hydrocarbons such as TCE, but undergo aerobic degradation more<br />
readily.<br />
1,ll,1-TCA can degrade anaerobically to I,I-DCA, which subsequently degrades to the<br />
relatively non-persistent chloroethane. Significant levels of l,l-DCA were detected at SWMU<br />
001 and SWMU091. However, no detections of l,l,I-TCA were reponed in any of the soil and<br />
groundwater samples collected from WAG 27. 1, l,l-TCA can degrade chemically to 1, l-DCE.<br />
The fact that l,l'-DCE is present and no 1,1,1-TCA was detected in any of the WAG 27 samples<br />
ATIJ983500009 Sec5_r.doc
5-10<br />
indicates that degradation has completelytransfonned the l,l,l-TCA into l,l-DCE and that the<br />
l,l,-DCE is probably an aged byproduct.<br />
•<br />
The abiotic rate depends only on temperature and allows some estimations of the<br />
residence time in groundwater. The half-life for the chemical transformation is approximately 8<br />
months at 25°C, which is within 8 degrees of the temperature measured in groundwater. During<br />
this degradation process, approximately 75% of theTCA is ·transformed to acetic acid and only<br />
25% to l,l-DCE. Based on these ratios, a significant amount ofTCA was probably released.<br />
In summary, TCE, DCE, and vinyl chloride were reported in groundwater at<br />
concentrations exceeding background or PRG concentrations, demonstrating a complete<br />
migration pathway from soil to groundwater atSWMU 00 I and the C-720 Complex.<br />
5.3.3 Metals<br />
Inorganic chemicals released to unsaturated soil become dissolved in soil moisture or<br />
adsorbed onto soil particles. Dissolved inorganic analytes detected at WAG 27 include the metals<br />
listed in Table 5.2. These dissolved metals are subject to movement by vadose zone water.<br />
Aqueous transport mechanics may result in metal migration through the vadose zone to<br />
groundwater. Metals, unlike organic compounds, cannot be degraded. However, metals migration<br />
can be attenuated by retarding reactions such as adsorption, surface complexation, coprecipitation,<br />
and ion-exchange reactions with the soils with which they come into contact. Such reactions are<br />
affected by pH; oxidation-reduction conditions; and the type and amount of organic matter, clay,<br />
and hydrous oxides present. These reactions are typically reversible, resulting in dynamic metal<br />
solubility in immature or .poody developed soils. Some metals, such as arsenic and chromium, can<br />
be transformed to other oxidation states in soil. Such transformations can reduce the metals'<br />
toxicities and/or affect their mobilities by affecting the way in which they react with soil particles or<br />
other solid surfaces by ion exchange, adsorption, precipitation, or complexation.<br />
•<br />
The oxidation state and chemical speciation of inorganic chemicals control solubility and<br />
thus, to a great extent, mobility in the environment. The mobility of metals and radionuclides<br />
can be significantly enhanced by the formation of organometalic and/or anionic complexes.<br />
Chemical speciation may be an important process in detennining the chemical form present in<br />
the soil. However, speciation is very complex and difficult to distinguish in routine laboratory<br />
analysis; therefore, its impact may not be measurable or predictable. In soil, metals are typically<br />
found in the following states:<br />
o Dissolved in interstial fluids<br />
• Occupying exchange sites on inorganic soil constituents<br />
o Adsorbed on inorganic soil constituents<br />
o Associated with insoluble soil organic matter<br />
• Precipitated as pure or mixed' solids<br />
• Present in the structure of secondary minerals<br />
• Present in the structure of primary minerals<br />
In situations where metals ,have been introduced into the environment through human<br />
activities, metals are typically associated with the first five conditions. The dissolved aqueous<br />
fraction and its equilibrium solid fraction are of primary importance when considering the<br />
migration potential of metals associated with soils. The unfilterable inorganics represent the<br />
dissolved fraction, which is the more mobile fraction. Of the compounds that are most likely to<br />
•
•<br />
5-11<br />
form in soils, chlorides, nitrates, and nitrites. are the most soluble. Sulfates, carbonates, and<br />
hydroxides have low to moderate solubility. In general, soluble compounds are transported in<br />
aqueous forms that are subject to retardation, whereas insoluble compounds remain as<br />
precipitates and limit the overall dissolution of metals.<br />
Adsorption depends on the surface charge, the dissolved ion and its charge, and the pH<br />
of the soils. Positively charged metal ions (such as trivalent chromium, cadmium, lead, iron,<br />
manganese, and zinc) tend to be adsorbed, and the transport of these species is slower than the<br />
groundwater or pore water velocity. The retardation factor ~f) describes numerically the extent<br />
to which the velocity of the contaminant migration is decreased and is largely derived from the<br />
partition coefficient (~).<br />
Table 5.2 presents the range of ~ values for metals for the loam-type soils prevalent at<br />
WAG 27. The ~ values of metals vary widely in the same soil type and may vary by orders of<br />
magnitude among samples from the same site. However, for purposes of conducting transport<br />
analyses in the vertical direction through the UCRS (Le., migration from the site sources to the<br />
RGA), only the average i~ values for loam soil were usedi.For lateral transport in the RGA,<br />
average Kc! values for sandy soil were used.<br />
•<br />
Contaminant persistence is a function of physical, chemical, and biological processes<br />
that affect the chemical as it moves through air, soil, and water. Some inorganic contaminants<br />
may undergo chemical species transformation after being released to the environment. An<br />
important example oCone such transfonnation is the change of the charge state from Cr+6 to Cr+ 3 •<br />
Organometallic compounds can undergo a variety of chemical reactions. that may transform one<br />
compound into another, change the state ·of the compound, or cause a compound to combine with<br />
other chemicals; however,the metallic portion of the organometallic compounds only changes<br />
oxidation states. With the exception of changing oxidation states or possibly exchanging<br />
metallic species, inorganic contaminants are much more stable than organic contaminants.<br />
The mobility of metals is directly related to their solubility in water or other fluids and to<br />
pH and redox conditions. The pH of the RGA water samples ranged from a low of 5.75 (location<br />
001-176 at SWMU (01) to 8.28 (location 091-002 at SWMU .091) and averaged 6.24. In the<br />
absence of fluids to mobilize and transport metals. virtually no transport is possible. Even if fluids<br />
are present. metals become more mobile only under favorable pH and redox conditions. Movement<br />
of metals is also controlled hy the solubility (pH- and Eh-dependent), adsorption, and redox state of<br />
the metal. With the exceptions of hexavalent chromium, barium, and selenium, the solubility of<br />
other metals of concern is inversely proportional to pH. However,iron, manganese. and aluminum<br />
oxides, plus carbonates, hydroxides, and organic materials, may cause metals to .precipitate or 'be<br />
adsorbed onto soil particles.<br />
5.3.3.1 Abundant Metals<br />
•<br />
A recurring issue in the WAG 27 RI is the ubiquitous presence of abundant metals<br />
identified in all media. The most common of these are aluminum and iron. It is important to<br />
distinguish evidence for release and transport from the natural variability at the site ·or secondary<br />
factors that may alter the solubility. A review of the patterns of these constituents at all sites<br />
confirms that they are not primary constituents in the industrial processes performed at SWMU<br />
001, SWMU 09'1, SWMU 196, andthe C-720 Complex based on the following:<br />
ATlJ983500009 Sec5:.r.doe
5·12<br />
• Past industrial processes indicate that nickel and aluminum were used in the SWMU 196 •<br />
smelting process; and gold, cyanide, silver, tin, lead, and chromium were known waste<br />
byproducts at the C-720 Complex.<br />
o<br />
o<br />
Eleven metals occur in the RGA and McNairy aquifer systems above screening levels and<br />
their distribution is random. The random distribution makes it impossible to establish<br />
background areas· relative to process/source areas.<br />
Aluminum and iron, which have been detected above background or pRG concentrations, are<br />
the second andthird,respectively, most abundant metals in the earth's crust. These were<br />
present in the soil and sediment samples analyzed.<br />
• The PGDP background values for metals in soil and groundwater identified in this study are<br />
lower .than generally reponed literature values for metals.<br />
• The metals reported in groundwater at elevated concentrations form no distinguishable<br />
"plume" (pattern of high to lower concentrations). Dissolved concentrations were generally<br />
low. In RGA water sample 720-017, aluminum was 70 times higher in the unfiltered (total)<br />
sample than in the filtered (dissolved) sample. In the same sample, iron was 18 times higher<br />
in the unfiltered sample than in the filtered sample.<br />
o<br />
Elevated dissolved iron is also frequently related to anaerobic conditions in the groundwater,<br />
increasing the solubility of.iron in.its reduced form a-e +2).<br />
During this RI, the fate and transport of metals were frequently estimated based on the<br />
dissolved concentrations, which are typically low across WAG 27. Colloids may migrate in<br />
aquifer systems if the particle size is much smaller than the pore size. Mobile colloids are<br />
commonly smaller than 0;45 micron. The samples were filtered with a 0.45-micron filter to limit<br />
removal .of the non-mobile colloids. Filtered versus unfiltered metals data for the monitoring<br />
wells were evaluated and compared to unfiltered metals data for the borehole water samples. The<br />
results indicate that average concentrations in borehole water samples for virtually all metals<br />
were higher than values reported in the well samples.<br />
•<br />
This condition is a result of the high volume of particulate matter introduced into the<br />
samples during collection. Although turbidity was not measured on the borehole water samples,<br />
the chemists have indicated that the borehole water samples in many cases were visually turbid.<br />
It can be concluded that the concentrations of metals in. the borehole water samples are not<br />
representative of the groundwater in the RGA; the evaluation indicated anomalously high metals<br />
concentrations in these samples. At WAG 27, because of the sporadic distribution of metals, it is<br />
not possible to attribute .the metals observed in groundwater to the localized soil hot spots (i.e.<br />
720-024, 198-013, and others located at SWMU 001). Thus it is impossible to delineate the<br />
extent· of any one particular metal COPC.<br />
As proven during the WAG 6 RI, determinations of the extent of metals in .groundwater and the<br />
associated risk levels are valid only if samples from permanent monitoring wells are collected<br />
using a protocol that results in acceptable turbidity Ievel.Only ,then can background and source<br />
areas be confidently delineated.<br />
•<br />
ATL.I983500009 Sec5...:r.doc
•<br />
5.3.3.2 Trace Metals<br />
5-13<br />
The potential release and migration of metals in the subsurface environment is a complex<br />
,process. The migration of metals depends on factors such as the overall groundwater<br />
composition, pH, presence of dissolved organic matter that may complex with the metals, the<br />
valence state of the metal, and the cation exchange capacity. Metals may be removed from the<br />
water phase through, mechanisms such as precipitation and irreversible sorption.<br />
In addition to the abundant metals (aluminum and iron), other metals were sometimes<br />
reported above background levels in the various <strong>environmental</strong> media.<br />
In groundwater, interpretation of the unfiltered metals is complicated l by turbid samples.<br />
In these cases, ,low-mobility constituents (such as lead) that do not represent a dissolved plume<br />
are typically detected at significant levels.<br />
5.3.4 Radionuclides<br />
•<br />
Radionuclides represent a special case of inorganic species. Although radionuclides<br />
behave chemically as metals,the radioactive nuclides undergo spontaneous transformations that<br />
involve the emission of particles and radiant energy. Most important for WAG 27 are the<br />
emission of alpha and beta partic1esand the emission of gamma energy. The resulting daughters<br />
(i.e., product nuclides) may be radioactive ,themselves (in which case they too will undergo<br />
spontaneous decay) or may be stable nuclides. The decay process can occur by various<br />
spontaneous mechanisms .<br />
Two ·of the more important decay modes are alpha decay and beta decay; the latter is<br />
differentiated into negatron and positron decay. As with inorganic and organic chemical species<br />
that do not undergo nuclear transformations, the persistence of radionuc1ide contaminants at<br />
WAG 27 is related largely to their geochemical mobility in the environment. Table 5.3 presents<br />
the half-lives (t\l2), radioactive decay constants, and ~ values for the site-related radionuclides.<br />
The ~ values for uranium in Table 5.3 are the most conservative site-specific value reported.<br />
Natural uranium consists of three primary isotopes: U-234, U-235, and U-238. The<br />
natural abundances of these isotopes, as well as their abundance in enriched (typical power<br />
reactor grade) and depleted uranium, are listed in Table 5.3. The decay products ·of uranium<br />
isotopes are also radioactive and form decay chains. 'The decay chains ofU-238 and U .. 235 (U-<br />
234 is a member of the U-238 decay chain), along with the half-lives of each nuclide, are<br />
presented in Table 5.3.<br />
Because DOE facilities do not routinely process uranium ore concentrates, the only<br />
non-uranium members of these decay chains that are present in virgin feed materials are those<br />
that have developed since the chemical extraction of the uranium. The nuclides that occur in the<br />
extractionbyproducts include Th;,.234, Pa-234, and Th-231. The long half..;lives of Tb-230 in the<br />
11-238 ,chain and the Pa-231 in the U-235 chain effectively prevent the accumulation of<br />
significant quantities of other decay products. .Still, some Th-230 and Ra-226 may be found in<br />
the process wastewater. Thus, it is prudent to include those radionuclides in effluent andlor<br />
<strong>environmental</strong> monitoring programs.<br />
•<br />
Some of the uranium feed material that was handled at PGDP has been reclaimed or<br />
recycled from reprocessed; spent reactor fuel. The chemical processes by which recycled<br />
uranium is purified leave trace amounts of transuranic elements (neptunium and plutonium) and<br />
fission products (mainly Tc-99). 'Fc-99 is highly soluble in groundwater and is very mobile (its<br />
ATlJ983500009 Sec5_r.doc
5-14<br />
Kct is similar to that of TCE). The groundwater plumes of TCE and Tc-99 are similar ,in size and<br />
geometry. Tc-99 has migrated extensively from two suspected sources: the SWMUOOI<br />
landfarm and the C-720'Complex. The levels of Tc-99 in soil are low because of its mobility and<br />
high solubility in water, a trend that is evident at WAG 6 and other sites where Tc-99 is a COCo<br />
•<br />
On an activity basis, the principal radionuclides expected to pass through chemical<br />
processing and contaminate the recycled uranium are ,the transuranic radionuclides produced in<br />
highest abundance and with moderate half-lives: Np-237, Pu-238, Pu-239, Pu-240,and Am-241.<br />
However, characterization studies (CH2M HILL 1998; SAIC 1998) have generally shown .that<br />
these radioisotopes are usually present inactivities that are
•<br />
11=<br />
total porosity (dimensionless)<br />
{0.37 value from literature}<br />
5-15<br />
~ = chemical:..specific distribution coefficient (cc/g)<br />
The distribution coefficient ~ for organic constituents is estimated as follows:<br />
~ = Koc * foc<br />
where<br />
Koc<br />
foc<br />
=<br />
chemical-specific organic carbon partition coefficient<br />
fraction of organic carbon<br />
{0.00801 (based on soil samples collected during this RI; see<br />
Appendix H}<br />
In general, metals are persistent in the environment. Metals are not typically volatile, so<br />
any emissions to ambient air would be in the form of particulate emissions. The chemical<br />
migration rates for site-related COCs are presented in Table 5.4.<br />
5.4.1 Migration Pathways<br />
5.4.1.1 Soil to Groundwater Pathway-VCRS<br />
•<br />
Contaminants present in surface and subsurface soils may leach to the underlying<br />
aquifer. Several factors influence the dissolution of COPCs in soils and the rate of contaminant<br />
movement through soils. These include the physical/chemical properties of the contaminants<br />
(e.g., solubility, density, viscosity, mineralogy,~) and the physical/chemical properties of the<br />
environment (e.g., rainfall,percolation rate, soil permeability, porosity, particle size, and amount<br />
of organic carbon). Contaminants migrate to .groundwater through infIltration, leaching, and the<br />
movement of.subsurface water within the capillary fringe.<br />
Generally, the groundwater is relatively deep at WAG 27, and many of the potential<br />
source areas have been present for a long time. Therefore, leaching potential is indicated by the<br />
observed groundwater concentrations. The amount of water available for infiltration is based on<br />
an average rainfall recharge rate of 7 in. per year. The interstitial groundwater velocity (inJyear)<br />
is estimated by dividing the recharge rate by the volumetric moisture tontent of the unsaturated<br />
zone. Assumioga water-filled porosity of 0.37, the velocity of the infiltrating water is about 19<br />
in. per year. The depth to the water table in many areas is approximately 50 ft, suggesting a 32-<br />
year travel time from the surface to the water table. In areas beneath pavement or other lowpermeability<br />
zones, less infiltration would occur. Adjacent to paved areas, Ihigher rates of<br />
recharge may occur as runoff increases the infiltration in 'localized areas.<br />
It is obvious that vertical migration has occurred at a much higher rate than indicated by<br />
advection/leaching, primarily because of diffusion. Diffusion along permeable zones of sand~ can<br />
significantly increase the rate of contaminant migration as the chemical moves to counteract<br />
concentration gradients, which are estimated to be quite significant at WAG 27. It appears that<br />
the dominant driving force for chemical migration in the UCRS is diffusion.<br />
•<br />
Chemicals can attenuate in the vadose zone. Chemicals that strongly sorb to soils,<br />
including most PAR compounds, tend ,to remain in or near the point of release. The R,s for these<br />
constituents indicate that they would be expected to migrate much more slowly than water in<br />
ATlJ983500009 Sec53.doc
5-16<br />
some instances. In addition to their strong tendency to adsorb, these compounds biodegrade<br />
during the slow transport, limiting the impacted area. Other constituents such as VOAs tend to<br />
volatilize in the unsaturated zone, decreasing tbeirpersistence in that medium.<br />
•<br />
5.4.1.2 Groundwater Migration-RGA<br />
The COCs reported in RGA groundwater include arsenic, :beryllium, iron, chromium,<br />
lead, manganese, thallium, silver, TCE, cis-l,2-DCE, trans-t,2-DCE, vinyl chloride, I ,I-DCA,<br />
l,I,I-TCA, l,l,2-TCA, and several radionuclides. VOAs.and Tc-99 are the most widespread of<br />
the COCs. The highest concentrations of VOAs were reported at SWMU 00'1. TCE was present<br />
in SWMUOOI and C-720 in the RGA and McNairy aquifers at concentrations ranging from 0.05<br />
J.Lg/L to 1,578 J.Lg/L. l,2-DCE was reported in SWMU 001 and C-720 sites, but at much lower<br />
concentrations. As noted earlier, 1,2-DCE is formed from anaerobic biodegradation of TCE or:<br />
the DCE intermediates. It subsequently degrades to ethene andlor ethane. The data in this report<br />
indicate that anaerobic biodegradation (e.g~, TCE to DCE) isIiota major process in the<br />
hydrogeologicaVgeochemical environment at WAG 27. The major source of TCE at the c-no<br />
Complex is believed to be the outside parts wash area located on the northeast side of the<br />
building and leaks in the floor drain exit point near 720-002 and along a storm drain near 720-<br />
024. The most significant source is VOAs at the SWMU 001 landfann. where VOAshave<br />
migrated downward to the RGA and are a continuing source to the RGA.<br />
Once in the groundwater, the COCs generally move through the RGA via advection.<br />
Using the hydraulic properties of the RGA as a conservative estimate of advective transport, the<br />
seepage velocity (advection velocity) at the site was estimated at 1.2 ftJday. Therefore, based on<br />
advection alone, it was estimated that contaminants fromthe site could migrate 438ft each year.<br />
•.<br />
COCs spread both horizontally and vertically due to the process of dispersion, while<br />
adsorption retards the movement of chemicals in groundwater. Dispersion generally causes<br />
chemicals to migrate from 10 to 20% farther than migration caused by advection alone.<br />
Adsorption, which retards the movement of chemicals, counteracts the advection and dispersion<br />
processes~ Adsorption is generally described by a chemical's distribution coefficient (~. The<br />
migration potential for I year was calculated for COCs in accordance with the groundwater flow<br />
velocities at that location. These calculations were based on the following equation:<br />
where<br />
=<br />
=<br />
=<br />
Vc = V I Rr<br />
chemical horizontal migration velocity in feet per year (ftJyr)<br />
site-specific groundwater flow velocity (ftlyr)<br />
chemical-specific retardation factor ( dimensionless)<br />
Calculated horizontal migration velocities are based on advection, retardation, and<br />
dispersion, but not on the effects. of biodegradation. 'Of the COCs identified in Table 5.5, the<br />
most mobile constituents include the chlorinated VOAs. Other constituents, including P AHs and<br />
metals (such as lead and vanadium), are not readily transported in groundwater. Consistent with<br />
these properties, PAHs were not detected in. the groundwater. The widespread occurrence of<br />
unfiltered metals such as iron is the result of highly turbid groundwater samples and is not a<br />
result of migration or site-related activities.<br />
•<br />
ATU983500009 Sec5-,r.doc
•<br />
5-17<br />
TCE is the COC that represents the maximum extent of contamination confIrmed in the<br />
RGA. Considering that operations began approximately 46 years ago at the C-720 Complex and<br />
25 years ago at SWMU 001 (the two major sources at WAG 27), the current horizontal migration<br />
potentials of TCE due to advection, retardation, and dispersion are estimated to be 7947 and<br />
4319 feet. respectively. 'Fhis distance is consistent with fate and transport modeling of TCE<br />
contamination in the RGA as reported in Sect. 5.5.<br />
5.5 FATE AND TRANSPORT MODELING<br />
Contaminant fate and transport modeling has been conducted for SWMU 00 1, SWMU<br />
091, SWMU 196, and the C-720Complex.The modeling was conducted using the Multimedia<br />
Environmental Pollutant Assessment System (MEPAS) software developed at PacifIc Northwest<br />
National Laboratory. The MEPAS model calculates the fate and transport of contaminants from<br />
specifIed source terms and determines the associated risk to identifIed receptors. It can model<br />
contaminant releases to the atmosphere, surface water, and groundwater. For purposes of this<br />
analysis, only the groundwater contaminant transport portion of the model was run to calculate<br />
predicted contaminant concentrations in groundwater at receptor points within the RGA.<br />
Concentrations were modeled to two receptor points: the PGDP security fence and the DOE<br />
property boundary. The output tables (Appendix C of Vol. 4). list the maximum concentrations<br />
for each source constituent and the corresponding times at which they reach each receptor point.<br />
•<br />
The following section provides a general overview of the results of the modeling for<br />
each area in WAG 27. More details concerning contaminant screening, development of the<br />
contaminant source terms, and the parameter values entered into the model are provided in<br />
Appendix C. The results of the MEPAS modeling are compared to risk-based values. in Sect. 6 to<br />
assist in the evaluation of risks to future residential groundwater users.<br />
S.S.1 SWMU 001<br />
Based on soil boring logs, three model layers (two partially saturated and one saturated~<br />
were delineated at SWMU 00 1. These layers correspond to the upper porous, portion of the<br />
UCRS (1 to 40 ft bgs), the HU 3 aquitard (40 to 55 ft bgs), and the RGA (55 to 105 ft bgs).<br />
Figure C-6 in Appendix C of Vol. 4 presents across section delineating the layers modeled at the<br />
unit. The travel distances from the source to each downgradient exposure point were 500 ft to the<br />
PGDP security fence and 3300 feet to the DOE property boundary.<br />
•<br />
Subsurface soil data used to develop the source terms were provided by the WAG 27 RI,<br />
the CERCLA SI, and a recent (January 1998): investigation. (including test pit excavations) of<br />
geophysical' anomalies at the unit. RGA soil sampling data were available from three soil borings<br />
installed at the unit for the CERCLA SI (CH2M Hn..L 1992). Source terms were developed for<br />
four metal contaminants (antimony, cadmium, manganese, .and beryllium) and four organic<br />
[TCE, vinyl chloride, bis(2-ethylhexyl~phthalate, and xylene] subsurface soil contaminants at<br />
SWMU 001. No patterns of contaminant distribution were observed that would allow grouping<br />
of these subsurface contaminants into common source areas. Discrete subsurface source areas<br />
were defIned fOI:,each contaminant present in each subsurface layer .<br />
ATlJ983500009 Sec5_"doc
5-18<br />
Antimony was present in all three layers at the site above screening levels, so three<br />
separate source terms were developed. The largest antimony source was centered around boring<br />
H 208 at the southern end of the oillandfarrn and extended from 5 ft to 33 ft bgs. The dimensions<br />
of this source (290 ft x 200 ft) were defined to include H 208 and the eight WAG 27 RI borings<br />
in which antimony was detected above screening levels. A smaller source (100 ft x 75 ft) in the<br />
southeast comer of the landfarm (around boring H 209) was delineated from 40 to 43 ft bgs in<br />
the HU 3 layer. A detection in boring 82'10 in ,the 57- to 6O-ft interval: was used to defme the 50-<br />
ft x 50-ft RGAsource term for antimony. No other contaminants were detected above the<br />
screening levels in RGA soil samples from the unit.<br />
•<br />
A cadmium source was developed' that encompassed most of the SWMU 00 1 area in the<br />
7- to 100ft interval (Model Layer 1). A small 85-ft x 80-ft source area was defined for<br />
manganese, which was detected in one 7- to 10-ft sample from soil boring 001-137 at the<br />
southern edge of the unit. Beryllium was. detected in Model Layers 2 and 3, requiring the<br />
development of two source terms: a 50-ft x 50-ft area around boring H 210 extending from 1'5 to<br />
20 ft bgs, and a 175-ft x 75-ft rectangular area encompassing the 40- to 50-ft interval (Model<br />
Layer 3) in borings 001-179 and 00'1-166.<br />
Of the four organics detected above industrial soil PRGs at the unit, TCE and vinyl<br />
chloride source areas have the most significant concentrations and encompass the largest areas.<br />
The TCE and vinyl: chloride source areas are located in the north-central portion. of the landfarm<br />
and are defmed by several WAG 27 RI soil borings as well as by January 1998 CDM excavation<br />
samples from Test Pit 5. TCE was found athigh concentrations (average of 15,287 ~glkg) in 88<br />
soil samples taken in and around the Test Pit 5 area in the 1- to 50-ft interval (Model Layers 1<br />
and 2). Vinyl chloride was found within the same area and was confmed to the 1- to 100ft<br />
interval. The dimensions of the Model Layers 1 and 2 source areas for xylene were based on its<br />
detection in one shallow soil sample (2 to 6 (t) from boring H 052 and in one deep (50- to 55-ft)<br />
sample from boring H 208 in the western part of the unit. The source area for bis(2-<br />
ethylhexyl)phthalate extends from 1 to 32 ft in boring H 009, located in the north-central part of<br />
theSWMU.<br />
•<br />
Most contaminants were detected above screening levels in fewer than five samples, so<br />
maximum concentrations were used to estimate contaminant inventories. The exception for<br />
SWMU 001 was TCE, for which the source tenn was developed using the average concentration<br />
of 88 samples. Table 5.5 lists the results ofMEPAS modeling for SWMUOOI.<br />
5.5.2 SWMU 091<br />
Four model layers (three partially saturated and one saturated) were delineated at SWMU<br />
091. These layers include the loess deposits making up HU 1 (1 to 20 ft), the permeable but<br />
discontinuous sand and gravel lenses of the UCRS (20 to 35 ft), a silty clay aquitard HU 3 (35 to<br />
48 ft). and the RGA (48 to 106ft). A cross section showing the depths of , these layers at the unit<br />
is presented in Figure C-7 in Appendix Cof Vol. 4. The travel distance from the source ,to each<br />
downgradient exposure .point is 350 feet to the PGDP security fence and 2500 feet to the DOE<br />
property ,boundary.<br />
Subsurface soil data were provided by the WAG 27 RI, the CERCLA SI, and soilsampling<br />
activities conducted in support of the LASAGNA TM demonstration at SWMU 091.<br />
•<br />
ATLJ983500009 Sec5_r.doc
•<br />
5-19<br />
RGA soil sampling data were provided by three soil borings (H 003, H 201, and H 203) installed<br />
at the unit for the CERCLA SI (CH2M HILL 1992). These data were used to develop the source<br />
terms and inventories for the site contaminants.<br />
Five constituents (antimony, lead, phenanthrene, uranium, and di-n-butylphthalate), were<br />
identified as .present above screening levels in subsurface soils at SWMU 091. However,<br />
uranium was not retained for modeling because it was detected only once above the screening<br />
levels (in the LASAGNA TM Phase I boring LAG 11). These were un validated data. 'The MEP AS<br />
source terms were developed for the remaining four UCRS soil contaminants. In addition,one of<br />
the UCRS soil contaminants, di-n-butylphthalate, also was detected i above screening levels in<br />
RGAsoils at the site. A separate RGA source term for this constituent was developed and input<br />
into the model.<br />
•<br />
A VCRS soil contaminant, . antimony, was assumed to he present at its maximum<br />
detected concentration (5mglkg) from 5 to 30 ft bgsin a 300-ft x 125-ftarea encompassing<br />
borings H 202 and H 203. Lead' (maximum 133 mglkg) and di-n-butylphthalate (maximum 841<br />
f.lglkg) were both detected above screening levels in boring H 203, in the 25-to 30-ft (Model<br />
Layer 2) and 25- to 75-ft (Model Layers 2-4) intervals, respectively. Because no sampling was<br />
conducted beneath 75 ft, the di-n-butylphthalatesource was assumed to extend throughout the<br />
entire thickness of the RGA, to 106 bgs. Phenanthrene was detected at a maximum concentration<br />
of 2201 f.lglkg in boring HOO3 in the 18- to 24-ft interval .(Model Layer 2). The maximum<br />
concentrations of each contaminant were used to estimate contaminant inventories. The results of<br />
the MEPAS modeling atSWMV 09'1 are presented in Table 5.6<br />
5.5.3 SWMU 196<br />
Four model layers (three ,partially saturated and one saturated) were delineated at SWMV<br />
196. These layers include the loess deposits making up HU 1 (1 to 18 ft), the permeable,<br />
discontinuous sand and gravel lenses of the VCRS (18 to 35 ft), a silty clay aquitard HU 3 (35 to<br />
49 ft), and the RGA (49 to,99 ft). The travel distances from the source to each downgradient<br />
exposure ,point are 800 ft to the PGDP security fence and 2800 feet to the DOE property<br />
boundary.<br />
Surface and subsurface soil data were provided by ,the WAG 27 RI. No RGAsoil or<br />
groundwater sampling data were available for the area, so an RGA source term could not he<br />
developed. The RI soil data were used to develop the source terms and inventories for the site<br />
contaminants.<br />
•<br />
One contaminant, antimony, was found above screening levels in surface (0 to 2 ft) soil<br />
samples from the site. Because it was detected in .all surface soil samples, the source area was<br />
delineated to include all unpaved portions of the site. The maximum concentration in surface soil<br />
(62.2 mglkg) was used to calculate the contaminant inventory for the area. Antimony also was<br />
detected above screening levels in these same seven borings in subsurface (2- to lO-ft) samples,<br />
so a source area of the same dimensions (175 it x 160 ft) was. developed for the loess layer<br />
(unsaturated Layer 1) using the maximum detected concentration in subsurface soils (58.9<br />
mglkg) to calculate the inventory .<br />
ATlJ983500009 Sec5;..r.doc
5-20<br />
Ten additional metals were identified as present above screening levels in SUbSUrface.<br />
soils:bariunl, beryllium,cadmium, cobalt, copper, lead, manganese, nickel, silver, and thallium.<br />
Each was detected in only 1 or 2 borings in shallow (2- to 8-ft bgs) samples. Their source .areas<br />
are relatively thin (2l0 4 ft) rectangular areas in Model Layer 1 centered around itheborings in<br />
which the detections occurred. n was assumed conservatively that these contaminants were<br />
distributed homogeneously at their maximum detected concentrations across their source areas.<br />
The results of the MEPAS modeling conducted for SWMU 196 are ,presented in Table 5.7.<br />
5.5.4 C-720 Complex<br />
Four model layers (three partially saturated and one saturated) were delineatedatSWMU<br />
091. These layers include the loess deposits making up HU ,1 (1 to 17 ft), the ,permeable but<br />
discontinuous sand and .gravellenSes of the UCRS (17 to 42 ft),a silty clay aquitard HU 3 (42 to<br />
60 ft). and the RGA (60 to 100 ft). The travel distances from the source to each downgradient<br />
exposure point are 1,800 ft to the PGDPsecurity fence and 4600 feet to the DOE property<br />
'boundary located to the west.<br />
Subsurface soil data were provided by the WAG 27 RI. Groundwater sampling data from<br />
the WAG 27 borings and from wells installed in the surrounding area were used' to develop the<br />
RGAsource terms. The source terms and' inventories for the site contaminants are presented in<br />
Appendix C of Vol. 4.<br />
Thirteen subsurface contaminants were found above screening levels and retained for<br />
MEPAS modeling in the C-720 Complex. 'FIle most .significant subsurface source areas defined •<br />
in the C-nG' Complex are associated with elevated levels of organics, in particular 'FCE, trans- .<br />
1,2-DCE, and vinyll chloride. The high levels ofTCE define· two large source areas: one large<br />
rectangular (1,050-ft x 225-ft) area lOCated along the northern side of the C-720 Building and one<br />
slightly smallet: area (825 ft x 1'50 ft) located along the southern side, TCE was detected in ,the<br />
20- to 40-ft interval in ,these source areas. so separate sources were modeled originating from<br />
Model Layers 2 and 3 and the results were then summed ' for like time values. Viliylchloride was<br />
found in shallow soils « 23 ft bgs) in two borings (720-0Gland 720-0(2) near 'the southeast<br />
comer of the building, so small source areas. were defmed in Model Layers 1 and 2. Trans-'1,2·<br />
DCEalso was detected inone.of these borings (720-002) at very high concentrations. A 200:..ft x<br />
150-ft source are~ centered around the boring and encompassing the 12- to 160ft interval, was<br />
used for modeling trans:..l,2-DCE.<br />
Metals detected in the C-72G Complex appear Ito be concentrated in one boring (720-024)<br />
located at the southwest comer of the building. Eight metals (antimony, beryllium,cadmium,<br />
cobalt, copper, silver, thallium, and vanadium) were detected! above screening levels in this.<br />
boring in the 35- to 50- ft interval. A rectangular source area 200 ft x 120 ft in Model Layers 2<br />
and 3 was defined for these metals. The organic compound bis(2-ethylhexyl)phthalate also was<br />
detected in this boring above its PRG ,throughout the l i 5- to 50- ft interval. Lead was detected in<br />
only one boring (720-002) located near the southeast comer of the bUilding. It was confined to<br />
the shallow (12:' to 16-ft) Model Layer Ii soils. Antimony and: beryllium also were detected at the<br />
northeast comer of the building (boring 720-027) in the 20- to 28-ft interval.<br />
Because no deep soil sampling data are available for the C-720 Complex, the RGA<br />
source term for the MEPAS modeling has :been Ideveloped using groundwater data. The<br />
chemicals detected above screening ,levels in the RGA(60 to 100 ft bgs) are TCE; trans-l ,2- '<br />
DCE; and cis-l,2-DCE. The maximum detected concentrations of trans-l,2-DCE (25 fJgIL) and<br />
.'<br />
ATLI983500009Sec5..:.r.doc
5-21<br />
cis-l.2-DCE (29 J.1g/L} do not greatly exceed their residential groundwater PRGs (4 J.1g/L and 2<br />
J.1g/L, respectively). In addition. neither was detected in more than 6 groundwater samples from the<br />
area. For these reasons (and also becauseMEP AS ,does not include cis-l ,2-DCE in its chemical list).<br />
only TCE was modeled. More information concerning development of the TeE source term for the<br />
C· 720 Complex can' be found in Appendix C of Vol. 4. Results of the RGA modeling for the C-720<br />
Complex are included in Table 5~8. These results indicate that a DNAPL source is present in the<br />
RGA near the northeast comer of the C~ no Building .<br />
•<br />
•<br />
A TI.\983500011Sec7 _r.doc
5-22<br />
•<br />
This page intentionally left blank.<br />
•<br />
•<br />
ATL\983500011 Sec7..,:r.doc
• •<br />
Table 5.1 Physical and chemical properties of volatile and semi-volatile compounds.<br />
~-<br />
(..,)<br />
•<br />
SWMrlI SWllIIII SWJIIIIH C.1JOa..",...<br />
NaI. --, S •• V_ "-7',<br />
... s. ...... Ka. ..- -
Table 5.2 Distribution coefficients (K.t) for inorganic COPCs at WAG 1.7 sites<br />
Site Related I SWMUI SWMU91 SWMU 196 C-7io Building<br />
Analytes SS SI) GW SS SB GW SL SS SB SL SS SB GW<br />
-<br />
. K.J. for Loam ~. for Sand<br />
(nll.JItg)<br />
. (mLlkg)<br />
Aluminum X J: X J: X X X J:<br />
Antimony X J: X X X J:<br />
Arsenic X J: J: J: X X J:<br />
Barium X J: X J: J: X X<br />
Beryllium X J: J: J: X X J:<br />
CadmiUm X J: X J: X X X X J:<br />
Calcium J: X J: X X X X<br />
Chromium x x x J: J: X X X J:<br />
Cobalt J: x x J: X X z<br />
Copper j x X J: J: X X<br />
Iron X X z x X X X<br />
Lead X x JC X JC X X JC<br />
Magnesium X X x X X X X<br />
Manganese X X X JC X X X<br />
MerCury J: JC JC X JC JC X JC<br />
Nickel JC JC JC X JC X X JC<br />
Potassium JC JC JC X X X J:<br />
Selenium J: JC JC X X X x<br />
Silver X JC JC JC X X x<br />
Sodium X X X JC X X X X<br />
Thallium X JC X X<br />
Vanadium X JC J: JC X X X<br />
Zinc J: J: J: X JC J: J: X<br />
1500.0 1500.0<br />
185.0 45.0<br />
20if 25.0<br />
sri' 0.5<br />
800.0 650.0<br />
190.0 80.0<br />
5.0 25.0<br />
418.0 35.0<br />
1,300 (100 to 9700) 60.0<br />
3.5E+01 6 22.0<br />
351.0 2~0.0<br />
16000 (100 to 59000) 270.0<br />
13.0 1.6<br />
750 (40 to 77000) 50.0<br />
10' to 10,000" 82.0<br />
438.0 400.0<br />
40.0 15.0<br />
385.0 150.0<br />
120 (28 to 333) 90.0<br />
ISoif 74.0<br />
I.OE+03 6 1000.0<br />
200.0 2()().0 ._---<br />
• K.J values taken from Sheppard and Thibault 1990 unless otherwise noted; the range<br />
is provided in parenthesis if available.<br />
• K.J values obtained from Baeset aI. 1984.<br />
• Source: Looney el aI. 1987<br />
" Inc:licales constituent detccted above PRG or Background concentrations.<br />
x Detected above the method delection Iinlil.<br />
SS = Surface Soil<br />
SB = Subsurface Soil<br />
GW = Groundwater<br />
SL = Sludge<br />
•<br />
•
• •<br />
•<br />
Table 5.3. Radioactive half-lives, decay constants, and distribution coefficients (K d ) fot radionudid~ COPCs at WAG 27 sites<br />
Site related SWMUI SWMU91 SWMU 196 C-720 Building<br />
radionuclides SS S8 GW SS SB GW SL SS $l! SL SS SB OW<br />
Half life Decay constant K;sin loam"<br />
(Year) (day-I) (Ukg)<br />
K.! in sand"<br />
(L'kg)<br />
Z41 Arn x x x i<br />
l37<br />
es x X x X x X<br />
Zl1Np X x x x X<br />
Z39IZ4Opg<br />
X X X x X X X X<br />
99fc x X x X X % X X X X<br />
z»to X % X % % % % % X<br />
Uranium x X i X X % X X .% X<br />
2lll2l·U X . .1 i x X X x<br />
2l'U x x X X X X x<br />
l38<br />
U .i x % % X %.<br />
... _-"<br />
~ K.! values were obtained from either Sheppard and Thibault (1990) or 8acs and Sharp (1984).<br />
b K.! values were obtained from site-specific umnium sorption analysis (SAle 1996).<br />
X Indicllles constituent detected above PRG or Background concentrlllioils.<br />
x Detected above the method detection limit.<br />
SS = Surface Soil<br />
S8 = Subsurface Soil<br />
GW = Groundwlder<br />
SL = Sludge<br />
4.33E+02 4.38E-06 9600 (400 to 48,309)<br />
3.00E+01 6.33E-05 4600 (560 to 61.287)<br />
2.14E+06 8.87E-10 25 (1.3 to 79)<br />
6.58E+03 2.89E-07 1200 (100 to 5.933)<br />
2.10E+05 9.04E-09 0.1 (0.01 to 0.4)<br />
8.ooE+04 2.37E-08 24.000<br />
1.62E+05 1.17E-08 421 b<br />
7.J(jE+08 2.67E-12 421"<br />
4.5IE+09 4.2IE-13 421 b<br />
1900<br />
280<br />
5<br />
550<br />
0.1<br />
5.800<br />
35<br />
35<br />
)5 ---- ..
Table 5.4 Horizontal groundwater migration potel1tial .<br />
Chemical Name of Groundwater COPC<br />
Distribution<br />
Coefficient<br />
Kd (cc/g)<br />
Retardation<br />
Factor<br />
(Rr)<br />
Chemical<br />
Migration<br />
Rate<br />
(ft/year)<br />
Chemical Migration<br />
Rate (20% Increase<br />
Due to Dispersion)<br />
(ft/yr)<br />
Horizontal<br />
Migration<br />
Potential (C·<br />
720) (Distance<br />
[ft] over 46<br />
years)<br />
Horizontal<br />
Migration<br />
Potential (C·720)<br />
(Distance [ft]<br />
over ~5 yeats)<br />
Volatile Organic Compounds<br />
1,1-Dichloroethane<br />
1,1 Dichloroethene<br />
cis-l,2-Dichloroethene<br />
trans-I,2-Dichloroethene<br />
Acetone<br />
Carbon Tetrachloride<br />
Chloroform<br />
Tetrachloroethene<br />
Trichloroethene<br />
Vinyl Chloride<br />
0.0<br />
0.1<br />
0.03<br />
0.03<br />
0.00<br />
0.1<br />
0.04<br />
0.2<br />
0.1<br />
O.OO~<br />
2.9<br />
2.9<br />
2.8<br />
2.8<br />
2.7<br />
3.3<br />
2.9<br />
3.7<br />
3.0<br />
2.7<br />
181.5<br />
149.1<br />
154.7<br />
154.2<br />
162.0<br />
134.7<br />
151.3<br />
119.6<br />
144.0<br />
161.5<br />
217.8<br />
178.9<br />
185.7<br />
185.1<br />
194.4<br />
161.6<br />
181.6<br />
143.6<br />
172.8<br />
193.8<br />
10019.2<br />
8230.1<br />
8540.2<br />
8513.0<br />
8941.4<br />
7434.2<br />
8353.5<br />
6604.5<br />
7946.5<br />
8915.8<br />
5445.2<br />
4472.9<br />
4641.4<br />
4626.6<br />
4859.4<br />
4040.3<br />
4539.9<br />
3589.4<br />
4318.8<br />
4845.5<br />
Metals<br />
Aluminum<br />
Antimony<br />
Arsenic<br />
Barium<br />
Beryllium<br />
Cadmium<br />
Calcium<br />
Chromium<br />
Cobalt<br />
1500.0<br />
45.0<br />
25.0<br />
0.5<br />
650.0<br />
80.0<br />
25.0<br />
35.0<br />
60.0<br />
6773.0<br />
205.8<br />
115.5<br />
5.0<br />
2936.5<br />
363.8<br />
115.5<br />
160.7<br />
273.5<br />
0.1<br />
2.1<br />
3.8<br />
88.3<br />
0.1<br />
1.2<br />
3.8<br />
2.7<br />
1.6<br />
0.1<br />
2.6<br />
4.5<br />
106.0<br />
0.2<br />
1.4<br />
4.5<br />
3.3<br />
1.9<br />
3.6<br />
117.5<br />
209.3<br />
4875.0<br />
8.2<br />
66.5<br />
209.3<br />
150.5<br />
88.4<br />
1.9<br />
63.8<br />
113.7<br />
2649.5<br />
4.5<br />
36.1<br />
113.7<br />
81.8<br />
48.0<br />
ATL\983S00014 ThI_S--l.xls<br />
Page I of2<br />
•<br />
•<br />
•
• • •<br />
Table 5.4 Horizontal groundwater migration potential<br />
Horizontal<br />
Migratioil Horizontal<br />
Chemical Chemical Migration Potenti_al (C- Migration<br />
Distribution Retardation Migration Rate (20% Increase 720) (Distance Potential (C-720)<br />
Coefficient Factor Rate Due to Dispersion) rft] over 46 (Distance {ft]<br />
Chemical Name of Groundwater COPC ~ (cc/g) (Rr) (ft/year) (ft/yr) yearS) over 25 years)<br />
Copper 22.0 102.0 4.3 5.2 237.0 128.8<br />
Cyanide 10.0 47.8 9.2 11.0 505.4 274.7<br />
Iron 220.0 995.7 0.4 0.5 24.3 13.2<br />
Lead 270.0 1221.4 0.4 0.4 19.8 10.8<br />
Magnesium 1.6 9.9 44.1 53.0 2436.2 1324.0<br />
Manganese 50.0 228.4 1.9 2.3 105.9 57.5<br />
Mercury 82.0 372.8 1.2 1.4 64.9 35.2<br />
NiG~el 400.0 1808.1 0.2 0.3 13.4 7.3<br />
Potassium 15.0 70.4 6.2 7.5 343.4 186.6<br />
Selenium 150.0 679.7 0.6 0.8 35.6 19.3<br />
Silver 90.0 408.9 l.l 1.3 59.1 32.1<br />
ThaIIium 74.0 336.7 1.3 1.6 71.8 39.0<br />
Vanadium 1000.0 4516.2 0.1 0.1 5.4 2.9<br />
Zinc 200.0 905.4 0.5 0.6 26.7 14.5<br />
R~dionuclides<br />
137Cs 280.0 1266.5 0.3 0.4 19.1 10.4<br />
239/240Pu 550.0 2485.1 0.2 0.2 9.7 5.3<br />
99Tc 0.1 3.2 138.9 166.6 7665.6 4166.1<br />
230Th 5800.0 26181.1 0.02 0.02 0.9 0.5<br />
233/234U 35.0 160.7 2.7 3.3 150.5 81.8<br />
235U 35.0 160.7 2.7 3.3 150.5 81.8<br />
238U 35.0 160.7 2.7 3.3 150.5 81.8<br />
ATL\983500014 ThI_5--l.xls<br />
Page 2 of 2
"<br />
Table 5.5~ MEPASresults forSWMU 001<br />
•<br />
PGDP Security<br />
DOE 'Property<br />
Fence<br />
Bounda!'Y<br />
Source Constituent Maximum 1<br />
Time Maximum ' Time<br />
Concentration (yr) Concentration i (yr)<br />
, ,<br />
,<br />
(mg/L)<br />
(mg/U<br />
,<br />
Antimony 6.43E-2<br />
! ,<br />
794 1.31E-2 862<br />
Beryllium) 0 10,000 0 , 10,000<br />
,<br />
UCRS Bis(2-ethylhexyl) 0 10,000 0 10,000<br />
i<br />
phthalate! "<br />
Cadmium 2<br />
6.456E-33 , 9,946 to 1.543E-34 !! 9,974 to<br />
I<br />
,<br />
I<br />
15,696<br />
15,696<br />
Manganese 1.73E-1 I 2,334 2.63E-2 :1 2,643<br />
Trichloroethene 20.44 120 3.4<br />
I,<br />
122<br />
','<br />
Viny! chloride 8.19E-2 57 1.29E-2 i 63<br />
,<br />
Xylenes 1. 193E-4 I 159 1. 86E-5 171<br />
i<br />
I<br />
,<br />
I<br />
,<br />
RGA Antimony 1.67E'-2 7 8.22E-4 54<br />
I Receptor concentrations are zero over the gIVen time range.<br />
'Concentrations vary by less than 1 /loOthof 1 % of the maximum concentration over the given time range (steady state) .<br />
•<br />
•<br />
ATlJ983500009 Sec5Jdoc
•<br />
Table 5.6. MEPAS results for SWMU 091<br />
PGDP Security<br />
DOE Property<br />
:Fence , Boundary<br />
Source Constituent Maximum Time Maximum ; Time<br />
i<br />
I,<br />
Concentration (yr) Concentration (yr)<br />
(mg/L) (mgIL) I<br />
Antimony 4.2E-2 498 5.7£;-3 615<br />
, 1.2<br />
,Di-n-butylphthalate 2.23E-29 1£1;001 0 lO~OOO<br />
•<br />
UCRS i<br />
I<br />
i:<br />
i<br />
Lead 1,2 1.76E-31: 9,821 to 0 10;000 '<br />
11,821<br />
Phenanthrene 3.85E-5 4,877 5.6E~ 5,377<br />
RGA Di-n-butylphthalate l 5;380E-6 4,609 to 7.878E-7 10,001<br />
i<br />
10i055<br />
• Concentrations vary by less than l/lOOth of 1 % of the maximum concentration over thegiven.time range (steady state).<br />
'Receptor concentrations are zero:over the given time range .<br />
,<br />
i<br />
i<br />
I<br />
I<br />
I<br />
i<br />
:<br />
ATIJ983500009 Sec5..J.doc<br />
98350000
Table 5.7. MEPAS results for SWMU 196<br />
PGDP Security<br />
DOE Property<br />
Fence<br />
Boundary<br />
Source Constituent Maximum Maximum<br />
! ,<br />
Concentration Time (yr.) : Concentration Time (yr.)<br />
(mgIL)<br />
(mgIL)<br />
Surface , , Antimony 4.81E-4 6,539 1.519E-4 6,546<br />
Soil<br />
Subsurface I Antimony 1.826E-03 6,543 5.768E-4 6,544<br />
:<br />
Soil Barium)<br />
e 10,000 0 10,000<br />
I Beryllium) 0 10,000 0 iO,OOO<br />
I<br />
, Cadmiuml. l 1.401E-39 9,881 to 0 to,OOO<br />
12,381<br />
Cobalt 1.4t6E:-9 9,804 3.529E-10 9,8eS<br />
CopperZ 3.105E-17 9,925 to 5.S0E-18 9,933 to<br />
10,675 I 10,675<br />
Lead 2 6.963E-29 9,961 to I 1.026E-35 9,821 to<br />
14,211<br />
' ,<br />
14,211<br />
Mang.anese 5.91E-4 9~952 I l.'591E-4 9,953<br />
Nickell 1.004E-23 9,868 to 2.664E-24 9,876 to<br />
10,368 10,368<br />
Silver 1.814E-5 9,771<br />
"<br />
' , 5.289E-6 9,772<br />
Thallium 1.541E-03 394 4.401E-4 395<br />
1 Receptor concentrations are zero over the glVen time.range.<br />
zConcentrations vary'by less than 1'/l00th of 1% of the maximum concentration over the given time range<br />
(steady state).<br />
•<br />
•<br />
•<br />
ATU983500009 Sec5J.doc<br />
98350000
•<br />
Table 5.8.MEPAS results for C-720 Complex<br />
i'<br />
PGDP Security<br />
DOE Property<br />
Fence<br />
Boundary<br />
Source Constituent I Maximum Time Maximum Time<br />
Concentration (yr) Concentration , (yr)<br />
i! , 1mgIL) (mgIL)<br />
I<br />
Antimony I 2.55E-1 229 8.73E-2 I 361<br />
Bis(2-ethylhexyl) I • 3.67E-12 9,930 to 5.14E-21 9~996 to<br />
phthalate 2 • 11,180 I 11,180<br />
Beryllium'" I<br />
I'<br />
0 10,000 0' I 10,000<br />
Cadmium 2 ,<br />
, 4.075E-6 9,973 to 1'.13E-19 ,I 9,959 to<br />
10,723 10,723<br />
Subsurface Cobalt 1.3E-2 4,252 5;6E-3 I 4,301<br />
SoH Copper 7.88E-3 7,931 3.24E-3 9,974<br />
Lead l '0 10,000 0 HtOOO<br />
Silver 6.3E-2 847 3JDE-2 976<br />
Thallium 1.935 31 8.026E-1 38<br />
Trans-1,2- 7.22 25 2.83 30<br />
Dichloroethene<br />
Trichloroethene 12.7£-1 72 5.35E-l! 82<br />
Vanadium 2.39E-2 3,797 7:7E-3 6,039<br />
Vinyl chloride 3.63E-3 54 1:50E-3 60<br />
RGA Trichloroethene 7.66E-2 9.2 2.56E;.1 20~7<br />
I Receptor concentrations are zero over the gtven time range.<br />
'Concentrations vary by less:than 1/100thof 1% of,the maximum concentration'over the given time range (steady state) .<br />
i<br />
,<br />
I<br />
,<br />
•<br />
ATIJ983500009 Sec5_r.doc<br />
98350000
•<br />
6. RESUL TSOF BASELINE RISK ASSESSMENT<br />
This section presents the results of the baseline risk assessment (BRA) conducted for WAG<br />
27, which consisted' of two pans as discussed' in Vol. 4: the baseline human health risk assessment<br />
(BHHRA) and: the baseline ecological risk assessment (BERA).(Note, baseline risks are those which<br />
maybe present now ,orin the future in absence ,of corrective or remedial actions.) In these<br />
assessments, information collected during the recently completed RI of WAG 27 and the results of<br />
previous risk assessments for the foUr sites in WAG 27 were used to characterize the baseline risks<br />
posed to human health and the environment from contact with contaminants in soil, ditch sediment,<br />
and groundwater at the four sites. In addition, this BRA uses results of fate, and transport modeling<br />
to, estimate the baseline risks posed ,to ,bumanhealth and the environment through contact with media<br />
impacted by contaminants migrating from the various sources in WAG 27. Methods used for fate<br />
and transport modeling are presented in Sect. Sand in the BRA in Appendix C of Vol. 4.<br />
To facilitate data aggregation and to focus results on specific areas, this BRA derives risk<br />
estimates for the four WAG 27 sites individually.<br />
Consistent with regulatory guidance and agreements contained in the approved human health<br />
risk assessment methods document (DOE 1996d), the BHHRA was used to evaluate scenarios that<br />
encompass current use and several hypothetical future uses of the WAG 27 sites and the areas ,to<br />
which contaminants from those sites may migrate. The scenarios assessed in Vol. 4 are as follows.<br />
• Current on-site industrial-direct contact with sediment and surface soil (soil found 0 to 1 ft<br />
bgs).<br />
• Future on-site indUstrial-direct contact with sediment, surface soil, and use of groundwater<br />
drawn from aquifers below the WAG 27 sites.<br />
• Future on-site excavation-direct contact with surface soil combined with subsurface soil (soil<br />
found 0 to 15 ft bgs).<br />
• Future on-site recreational user-directcontact with sediment and consumption of game exposed<br />
to contaminated surface soil.<br />
• Future off-site recreational user-direct contact with surface water impacted by contaminants<br />
migrating from sources and consumption of game exposed to this surface water.<br />
• Future on-site rural resident-direct contact with surface soil at and use of groundwater drawn<br />
from aquifers below the WAG 27 sites, including consumption of vegetables that were posited<br />
to 'beraised i in this area.<br />
• Future off-site rural resident-use in the home of groundwater drawn from the RGAat the DOE<br />
property ,boundary.<br />
•<br />
Also consistent with regulatory guidance and the strategy for the ecological risk assessment<br />
of source units (DOE 1993, EPA f998),theBERA was used to evaluate risks under both current and<br />
potential' future conditions to several nonhuman receptors that may come into contact with<br />
contaminated media at or migrating from sources in the WAG 27 sites. In the BERA. as with the<br />
ATU9835000IO Sec6_r.doc 6-1
6-2<br />
BHHRA, infonnationcollected! during the recently completed RI (including the fate and<br />
transport infonnation in Sect. 5) and from ,the BRA in AppendixC of Vol. 4 was used. ~Note,<br />
because the fate and transport infonnation indicates that surface migration of contaminants from<br />
WAG 27 to creeks surrounding PGDP is not significant, a quantitative assessment of risks from<br />
surface migration to these creeks is.notincluded in this summary or in Vol. 4.)<br />
•<br />
6.1 CONCLUSIONS<br />
For all four WAG 27 sites, the cumulative human health excess lifetime cancer risk (ELCR)<br />
and systemic toxicity exceed,the accepted standards of KDEP and EPA for one or more scenarios<br />
when assessed ,using default exposure parameters. The land uses and media assessed for risk to<br />
human health for each site are presented Table 6.1. Table 6.1 also indicates the scenarios and media<br />
previously addressed. No groundwater was assessed at SWMU 196 and no surface water was<br />
evaluated at any site for current concentrations. The scenarios for which risk exceeds de minimis<br />
levels i[i.e., a cumulativeELCR of 1 x lO~or a cumulative hazard index (HI) of 1]1 are summarized in<br />
Table 6.2. This information is taken from the risk summary tables located at the end of this section<br />
(Tables 6.3 through 6.7), which present the cumulative risk values for each scenario, the COCs, and<br />
,the pathways of concern~OCs).<br />
Because the WAG 27 sites are located in the :industrialized portion of the PGDP, the BERA<br />
project team concluded'during problem formulation that it would not be appropriate to derive risk<br />
estimates for impacts to nonhuman receptors under current conditions. However,an analysis to<br />
detennine potential' impacts. to nonhuman receptors exposed to contaminants in surface soil or ditch<br />
sediment in the future, if the industrial infrastructure were removed, and to estimate the potential<br />
impact of surface· migration of contaminated media was performed. Because contaminants at the C-<br />
720 Complex and SWMU 091 are restricted to subsurface soils below graveli.. or cement-covered<br />
areas, effectively eliminating potential exposures, the BERA project team concluded that it would<br />
not be appropriate to derive risk estimates for nonhuman receptors to contaminants in surface soil at<br />
these two sites. Surface soils at SWMU 001 have already :been evaluated and addressed as part of<br />
the WAG 23 ROD, so they are not re-evaluated for SWMU001 here. Several contaminants in<br />
surface soil from SWMU 196 and sediments in drainage ditches associated i with SWMUs 001,091,<br />
and J,96 were found to be at concentrations greater than levels protective of nonhuman receptors ..<br />
Table 6.7 summarizes these chemicals of potential ecological concern (COPECs).<br />
.•<br />
6.2 OBSERVATIONS<br />
Specific observations of the BHHRA and the BERA are as presented here. Note, the<br />
observations from the BHHRAfocus on the industrial land use, the current and most plausible future<br />
land use for the WAG 27 sites, and the observations of the BERA focus on the potential! risks to<br />
nonhuman receptors. Vol. 4 includes more extensive discussions of each of the observations<br />
presented below.<br />
6.2.1 Observations of the Baseline Human Health Risk Assessment<br />
• Use of the provisional lead' reference doses (RfDs) provided by KDEP results intota! HIs that<br />
exceed 1000 for the use of grolindwaterat the WAG 27 sites and for those locations where the<br />
maximum detected concentration of lead in soil exceeded its background concentration.<br />
•<br />
ATU983S000}O Sec6_r.doc
'.<br />
•<br />
6-3<br />
However, when these provisional values are not included in the risk characterization, total HIs<br />
are markedly reduced~ (Note, because the risks calculated using the provisional lead RIDs are<br />
so uncertain, all observations presented in this summary after this discussion and in Tables 6.2<br />
through 6;6 ,do not include the quantitative contribution from lead. Therefore, the reader must<br />
take· ,care when 'exarnjning the individual uncertainties :todetermine if thereported'results<br />
contain, or, donol contain lead as a COPC~) Due to the uncertainty in the results using the<br />
provisional 'lead RIDs, a 'better understanding of the risks presented by ,lead may be gained, :by ,<br />
comparing ,the ,representative exposure concentrations of lead in soil and groundwater to<br />
screening levels fromKDEP and EPA. In these comparisons (see Sect. 1.5.6 in Vol. 4), the<br />
concentrations, of lead in R6Aand McNairy Formation groundwater at an sites are seen to<br />
exceed the KDEP screening level. The EPA screening level is also exceeded for RGA and<br />
McNairy Formation groundwater at all sites except the C.;720 Complex. The representative<br />
exposure concentrations of lead'in,sediment and' subsurface soil never exceed either screening<br />
leveL However, the representative concentration of lead in surface soil' at SWMU 196 exceeds<br />
only the KDEP screening level. None of the representative concentrations oflead in surface soil<br />
exceed the EPA screening level.<br />
• The dermal contact with soil exposure route poses considerable risk, predominantly from<br />
contact with metals in soil (primarily beryllium). In fact" for all land use scenarios evaluated,<br />
the systemic toxicity and the ELCRposed ,through the soil and sediment dermal exposure route<br />
exceed that posed by the ingestion route. As illustrated in Sect. 1.6 of Vol. 4, this is a direct<br />
result of using dermal absorption factors (ABS values) that exceed gastrointestinal absorption<br />
values and may be too conservative. This observation indicates that the risk estimates from the<br />
dermal exposure route may be unrealistic and exceed the real risk posed by this route of<br />
exposure. Although chemical';specific ABS values were used, when available, default ABS<br />
values were used for most chemicals because chemical-specific values are lacking. Chemicalspecific<br />
ABS values were available for PCBs, cadmium, and carbon disulfide and were used in<br />
theBHHRA. Remedial action decisions based on the dermal contact with soil exposure route<br />
should be carefully considered because of the uncertainty associated with risk from this<br />
exposure route.<br />
• The current land' use scenario, industrial use,hasrisk that is above de minimis 'levels at each site<br />
except the C-720 Complex, where contact with surface soil is not possible and no ditches are<br />
present. At SWMU 001, the pathway driving both systemic toxicity and ELCR is dermal<br />
contact with sediment. AtSWMU 091, ,the pathway driving systemic toxicity is dermal contact<br />
with sediment, and ELCR is driven by external exposure to sediment. At SWMU 196, the<br />
pathway driving systemic toxicity is dermal contact with sediment, and the ELCRis driven by<br />
both external exposure to soil and dermal contact with sediment. For the C-720 Complex, no<br />
COCs, were identified for soil or sediment for the current industrial worker.<br />
'Fhetotal HI at each ,site is less than 3 . .No one contaminant dominates contribution to systemic<br />
toxicity . The primary contaminant driving ELCR within this pathway is ,beryllium, and also<br />
contributing areradionuclides(Np-237 and Cs-137Hor all sites.<br />
•<br />
• The' most plausible future land use scenario, industrial use, has risk that is above de minimis<br />
levels ateach WAG 27 site. As discussed in the BHHRA, the future industrial land use scenario<br />
is identical to the current industrial land use scenario except that the former also includes use of<br />
RGA and McNairy Formation: groundwater. The addition ,of groundwater as a medium of<br />
ATU983S00010. Sec6_r.doc:
6-4<br />
exposure adds significantly to the risk for this scenario. If groundwater contribution is removed<br />
from .the risk totals, the driving pathways are identical to those of the current industrial land use<br />
scenario.<br />
•<br />
It<br />
Risks from use of groundwater,(withoutthe risk contribution of lead) drawn from both the RGA<br />
and the McNairy Formation exceed de minimis levels for aU scenarios at eacb site except<br />
SWMU 196, where noCOPCs were identified. For the RGA, across all ,land'uses at SWMH<br />
001, the contaminants contributing, greater than 10% ELCR were arsenic, mdon-222, beryllium,<br />
and Tc-99: The contaminants contributing greater than 10% systemic toxicity were. various<br />
metals. For the McNairy, across all land uses at SWMU 001, the contaminants contributing<br />
greater than 10% 'ELCR were beryllium, Am-241', and U-238. The contaminants contributing<br />
greater than 10% systemic toxicity were various metals. For the RGA, across all land uses at<br />
SWMU 091, the contaminants contributing greater than 10%ELCR were mdon-222,<br />
americium-241. and beryllium. The contaminants contributing greater than 10% systemic<br />
toxicity were various metals and trichloroetbene. 'For the McNairy, across all land uses at<br />
SWMU 091, the contaminants;contributing greater than W% ELCR were Arn-241 , Np-237, and<br />
U-238. 'The contaminant contributing greater than 10% systemic toxicity was uranium. For the<br />
RGA, across all land uses at the C-720 Complex, the contaminants contributing greater than<br />
10% ELCR were beryllium, Am-241. Np-237, U-238, l,l-dichloroethene, and Tc;..99. The<br />
contaminants contributing greater than 10% systemic toxicity were various metals,<br />
trichloroethene, and carbon tetmchloride. For the McNairy, across all land uses at the C-720<br />
Complex, the contaminants.contributinggreater than 10% ELCR were beryllium, Am-241, Np-<br />
237 ,and N-238. The contaminants contributing greater than 10% systemic toxicity were<br />
various metals.<br />
• In this assessment, 'the inhalation of VOCsand ,particulates emitted via the soil exposure route<br />
is a POC for the excavation worker atSWMU 001 and the C-720 Complex. The contaminant<br />
,driving risk within this ,pathway and scenario combination is vinyl'chloride. Unlike many<br />
previous assessments that have .been performed at· PGDP, this exposure route is seldom a POC.<br />
WAG 6 is the most recent exception~<br />
•<br />
• COCs migrating from sources in the WAG 27 soil and groundwater as determined by risk<br />
estimates for future residential groundwater users are. phenanthrene, trans-I, 2-dichloroethene,<br />
trichloroethene.vinyl chloride, xylenes, antimony, manganese, silver, thallium, and'vanadium.<br />
There were no radionuclide COCs.<br />
6.2.2 Observations of the Baseline Ecological Risk Assessment<br />
It<br />
Nine inorganic COPECs,exceeded,benchrnarksforatleast one receptor group (Table 6.7). The<br />
inorganics were aluminum, cadmium, chromium, :lead, mercury, nickel, selenium, silver,and<br />
zinc. Of these, aluminum, chromium, and lead were near background levels. Aluminum is<br />
unlikely to be of concern at WAG 27. as the maximum aluminum concentration in any of the<br />
four sites was only 1.01 times backgroun& Similarly, chromium and lead were near<br />
background levels (maximum of 1.05 times and 1.5 times background, respectively). Cadmium<br />
was of concern only for ,plants in the SWMU 091 ditch. and SWMU ,196 soil. However, hazard<br />
quotients were low Oess than 3.1), and'tbe areas are currently covered with vegetation. Mercury<br />
was of concern only for soil invertebrates exposed to ditch sediment in SWMUs091, and 196<br />
and surface soil in SWMU 196~ Nickel was of potential concern for plants and invertebrates in<br />
•.<br />
ATl:J9835000IOSec6.r.doc
•<br />
• No organic analytes exceeded! available benchmarks for any ecological receptors.<br />
6-5<br />
SWMU 196 surface soil, and for plants in SWMU 196 ditches. Selenium and' silver were of<br />
potential concern for plants in SWMU 1'96 surface soil. Zinc was of potentialconcem, with<br />
low ihazard quotients for .plants, soil invertebrates, and shrews in SWMU 196 ditches; plants<br />
and soil invertebrates in SWMU 091 ditches; and plants in SWMUOO 1 ditches. However, the<br />
maximum zinc concentration was only 3.4 times Ibackground. (NoCOPECs were identified for<br />
the C-720'Complex because contaminants are restrictedto·subsurface soils in that area.)<br />
• Estimated doses .from exposure toradionuclides m soil or ditch sediment were below<br />
recommended dose rate limits for all receptors in all areas. 'Therefore, adverse effects are not<br />
expected from exposure to radionuclides.<br />
• Uncertainty concerning.the future condition, the bioavailability of various metals (e.g.,<br />
aluminum and chromium were only slightly elevated above !background~, and use of 'only one<br />
line ·of evidence (comparison of exposures to Lowest Observed Adverse Effects Levels or<br />
LOAELs ) may have led to an overestimate of potential·futureecological risks.<br />
A summary of COEPCs and receptors potentially at risk should future exposures occur is<br />
presented in Table 6.7. Additional discussion of these results is presented in Sect. 2 of Vol. 4 .<br />
•<br />
•<br />
ATU983500010 Sec6_r.doc
•<br />
This page intentionally left ;blank.<br />
•<br />
•
•<br />
Land Use Scenario<br />
Table 6.1. Land uses and media assessed ·foreach SWMU and area of WAG 27<br />
Location<br />
SWMU,l<br />
SWMU91 SWMU 196 C-720!Complex<br />
•<br />
Current On-site Industrial Worker<br />
Surface soil<br />
Sediment<br />
Surface Water<br />
Future On-site Industrial Worker<br />
Surface soil<br />
Surface Water<br />
Sediment<br />
RGA'Groundwater<br />
McNairy· Groundwater<br />
Future On-site Excavation Worker<br />
Surface and Subsurface soil<br />
Future On-site Recreational I User<br />
SoiJ:(game)<br />
Sediment<br />
Surface water<br />
Future Off-site Recreational User<br />
Surface water<br />
Future On-site Rural Resident<br />
Surface soil<br />
RGA Groundwater<br />
McNairy Groundwater<br />
Future Off-site Rural Resident<br />
p<br />
X<br />
N<br />
P<br />
X<br />
N<br />
X<br />
X<br />
X<br />
P<br />
X<br />
N<br />
X<br />
P<br />
X<br />
X<br />
p X N<br />
X X N<br />
N N N<br />
P X N<br />
X X N<br />
N N N<br />
X N X<br />
X N X<br />
X X X<br />
P P N<br />
X X N<br />
N N N<br />
X X N<br />
P X N<br />
X N X<br />
X N X<br />
RGA Groundwater X X X X<br />
McNairy Groundwater X X X X<br />
Notes: Scenarios that were assessed in this BHHRA are marked with an X. Scenarios that were assessed as<br />
part of previous risk assessments are marked with a P (SWMU 1 surface soils were addressed as part of WAG<br />
23 RI,and SWMU 91 surface soils were addressed as .part of LASAGNA TM). Risk results from previously<br />
assessed scenarios are combined. with the risk results from thisBHHRA. Scenarios ,that are not applicable, or<br />
for which the medium is not present, are marked with an N<br />
•<br />
ATl1983500010 Sec6_r.doc
Scenario<br />
l'able 6.2 •. Scenarios for which human 'health risk exceeds de minimis :levels<br />
Location<br />
SWMUOOl SWMU091 SWMUl96 C-720 Complex<br />
•<br />
Resultsfor·excess lifetime c:ancerrisk:<br />
Current On-site Industrial Worker<br />
Exposure to Soil NA NA X NA<br />
Exposure·to Sediment X X X NA<br />
Future On-site Industrial Worker<br />
Exposure to Soil NA NA X NA<br />
Exposure to Sediment X X X NA<br />
Exposure to Groundwater b X X X<br />
Future On-site Excavation Worker<br />
Exposure to Soil X X X X<br />
Future On-site Recreational User<br />
Exposure to Game NA NA NA<br />
Exposure to Sediment X X X NA<br />
Future Off-site Recreational User<br />
Exposure to Surface Water<br />
Future On-site Rural. Resident<br />
Exposure to Soil NA NA X NA<br />
Exposure to Groundwater b X X X<br />
•<br />
Future Off-site Rural Resident<br />
Exposure to Groundwater C X X X X<br />
Results for systemic toxicity-:<br />
Current On-site Industrial Worker<br />
Exposure to Soil NA NA NA<br />
Exposure to.5ediment X X X NA<br />
Future On-site Industrial Worker<br />
Exposure to,Soil NA NA NA<br />
Exposure to Sediment X X X NA<br />
Exposure tOiGroundwater b X X X<br />
Future On-site Excavation Worker<br />
Exposure ,to Soil X X X<br />
Future On-site Recreational' User<br />
Exposure to Game NA NA NA<br />
Exposure to Sediment X X X NA<br />
•<br />
ATU983500010 Sec6_r.doc
•<br />
Scenario<br />
Table 6.2. Scenarios for which human health risk exceeds de minimis levels<br />
Location<br />
1<br />
SWMUOOI SWMU 091 SWMU<br />
196 C·720 Complex<br />
Future Off-site Recreational User<br />
Exposure to Surface Water'<br />
Future On-site Rural Resident<br />
Exposure to Soil<br />
Exposure to Groundwater b<br />
NA<br />
X<br />
NA<br />
X<br />
x<br />
NA<br />
X<br />
Future Off-site Rural Resident<br />
Exposure to·Groundwatef<br />
X<br />
X<br />
X x<br />
NOleS: Scenarios where risk exceede(hhe bcnclunarlclevels arc marked with,an X. Sccnarioswherc risk did not exceed a benchmark<br />
.b<br />
level arc marked with a -. NA indicares that the scenariollanduse combination is not appropriate.<br />
For the future recreational user andthc future on-site resident, the child rcsults arc used.<br />
The BHHRA assessed risks associated' with use of WlIIa". drawn from ·lhe RGA separately'from use of water drawn from the<br />
McNairy,Fonnation. The value n:portcd',ben: is for use of water from the RGA.<br />
Based, on rcsultsof contaminant transpon modeling. X indicates that the location contains 'one or more sources of off-site<br />
contamination inexccedance of benchmarks. and-indicates that the location is not a source of off-site contamination .<br />
•<br />
•<br />
ATU983500010 Sec6J.doc
Table 6.3. Summary of risk characterization results for SWMU 001 without lead as a COPC<br />
% %<br />
Total Total % Total Total % Total<br />
Receptor ELCRo COCS ELC~ PQ
• • •<br />
Table 6.3. Summary or risk characterization results ror SWMU 001 without lead as It COPC<br />
Future industrial· worker at 3.9 x 10~ Arsenic 6 Ing~stion of 96 2.99 Arsenic 5 Ingestion of groundwater 95<br />
current concentrations Beryllium 15 groundwater Iron 58 Dennal contact 5<br />
(McNairy groundwater Arilericium-24I 36 Dennal contact 4 Manganese 9<br />
only) Cesium-I 37
Table 6.3. Summary of risk characterization results for SWMU 001 without lead as a cope<br />
Future adult rural resident at 1.6 x 10- 2 Arsenic 53 Ingestion of 44 57 Aluminum 4 Ingestion of groundwater 66<br />
current concentrations Beryllium 8 groundwater Antimony I Dennal contact 2<br />
(RQA groundwater only) 1.1 'Oichloroethene 5 Dennal contact I Arsenic 47 Ingestion of vegetables 31<br />
Bis{2-ethyl hellyl)phthalale
• •<br />
~.<br />
..<br />
•<br />
~.<br />
Tabl~ 6.3. Summary of risk characterization reSults fot SWMU 001 without lead as a CO PC<br />
Future teen recreational user NA NA NA NA NA NE NE NE NE<br />
atcunentconcentrations<br />
(soil only)<br />
----<br />
Future teen recreational user NA NA NA NA NA 2.22 Aluminum 6 Dennal contact<br />
atcunentconcentrations Chromium 19<br />
(sediment only) IrOn 28<br />
Manganese 10<br />
Vanadium 28<br />
--<br />
Future adult recreational NE NE Ni! NE NE NE NE NE NE<br />
user at cunent<br />
concentrations (soil only)<br />
.~<br />
Future adult recreational 1.7 x 10'" Arsenic 9 Ingestion of sediment 2 0.481 Nt; NE NE<br />
user at cunent Bctyllium 89 Denna1 contact 97<br />
concentrations (sediment Neptunium-237 I External exposure I<br />
only)<br />
Future excavation worker at 2.4 x 10'" Arsenic 10 ingestion of soil 20 1.92 Arsenic 7 Ingestion of soil<br />
cunent concentrations Beryllium 46 Dennal contact 74 ChrOmium 16 Dennal contact<br />
PAHs 13 Inhalation of VOCs and 3 Manganese 14 Inhalation of VOCs and<br />
Note:<br />
a<br />
Bis(2-chloroethyl)ether
Table 6.4. Summary of risk characterization results for SWMU 091 without lead as a COPC<br />
--.. -<br />
% %<br />
Total Total % Total Total % Total<br />
Receptor ELCR o COCs ELCR POCS ELCR TotaJm o COCS m pocs m<br />
---<br />
Current industrial worker at NE NE NE NE NE NE NE NE NE NE<br />
current concentrations (soil<br />
only)<br />
Future industrial worker at<br />
current conCentrations (soil<br />
NE NE NE NE NE NE NE NE NE NE<br />
only)<br />
--<br />
Current industrial worker ot S.8 x 10~ Arsenic 2 Ingestion of sediment 2 1.96 Alulnillum 8 Dennal contact 99<br />
current concentrations lJeryllium _ 17 Dermal contilct 19 Cadmium 6<br />
(sediment only) Cesium-I 37 80 External exposure 81 Chromium IS<br />
Ufuhium
• • •<br />
Table 6.4. Summary of risk characterization results for SWMU 091 without lead as a CO PC<br />
Total Total " " Total Total "<br />
% Total<br />
Receptor ELCRo COCS ELCR POCS ELCR TotalmO COCS m pocs HI<br />
FutUre industrial worker at 6.9)( 10~ Americiilm-241 30 Ingestion of 100 0.334 NE NE NE NE<br />
current concentrations Cesium-I 37 I groundwater<br />
(McNairy groundwater Neptunium-237 13<br />
only) Thorium-230 2<br />
Uranium-235 7<br />
Uranium-238 47<br />
-<br />
Future child rural resident at NA NA NA NA NA 48.1 Aluminum I Ingestion of groundwater 55<br />
current concentrations Arsenic 2 Dermal contact I<br />
(RGA groundwater only) Barium
Table 6.4. Summary of risk characterization results for SWMU 091 without lead as a cope<br />
---<br />
. - .. - - ..<br />
% %<br />
Total Total % Total Total % Total<br />
Receptor ELCR" toes ELCR POCS ELCR Totalm" COCS m pocs III<br />
Future adult rural resident at 8.2 x 10'] Arsenic 2 Ingestion of 45 11.4 Aluminum I Ingestion of groundwater 62<br />
current concentrations Beryllium 5 groundwater Arsenic :2 DeriIIaI contact 2<br />
(RGA groundwater cUlly) I.I-Dichloroethene II Dermal contact
• •<br />
•<br />
Table 6.4. Summary of risk characterization results for SWMU 091 without lead as a CO PC<br />
% %<br />
Total Total % Total Total<br />
Receptor ~LCJl" COCS ELCR POCS ELCR Totalm" COCs m<br />
pocs<br />
% Total<br />
HI<br />
Future teen recreational user NA NA NA NA NA 2.68 Aluminum 9<br />
at cument concentrations Arsenic S<br />
(sediment only) Cadmium 7<br />
Chromium 17<br />
Iron<br />
2S<br />
Manganese 7<br />
V lIlIlIdium 25<br />
.-<br />
Future adult recreational NE NE NE NE NE NE NE NE<br />
user at current<br />
concen~tioll!l (~I)ll only)<br />
--<br />
Future adult recreational 2.3 x 10~ Arsenic 9 Ingestion of sediment
-- ---- --<br />
Table 6.S. Summary of risk characterization results for SWMU 196 without iead as a cope<br />
-- - -<br />
"k "k<br />
Total Total % Total Total "k Total<br />
Receptor ELCH.o COCS ELCR POCS ELCR TotalmO<br />
-- ~()9I HI POCS HI<br />
Current industrial worker at 4.8 x 10⁻⁶ Uranium 55 Extem~1 exposure 80 0.521 NE NE NE NE<br />
current concentrations (soil<br />
oilly)<br />
--<br />
Future industrial worker at 4.8 x 10⁻⁶ Uranium S5 External exposure 80 0.521 NE NE NE NE<br />
cum:ht concentrations (soii<br />
only)<br />
Current industrial worker at 8.7 x 10" Arsenic 9 Dermal contact 89 2.1 Aluminum II Dermal contact 99<br />
current concentrations Beryllium 81 EXternal exposure 10 Chromium 12<br />
(sediment only) Cesium-l3i 2 Iron 33<br />
Cobalt-60 2<br />
Manganese 9<br />
I<br />
Neptunium-231 2 Vanadium 16<br />
Uranium 3<br />
Future industrial worker at 8.7 x 10" Arsenic 9 Dermal contact 89 ~.1 Alulllinum II Dermal contact 99<br />
current concentrations Beryllium 81 External exposure 10 Chromium 12<br />
(sedhilent only) Cesium~137 2 Iron 33<br />
Cobalt-60 2 Manganese 9<br />
Neptunium-237 2 Vanadium 16<br />
Urimium 3<br />
Future industrial worker at NC NE NE NE NE NC NE NE NE NE<br />
current concentrations<br />
(ROA grouildwater only)<br />
---- -- --<br />
Future industrial worker at NC NE NE NE NE NC NE NE NE NE<br />
current conceiltrations<br />
(McNairy groundwater<br />
only)<br />
--- --- --<br />
Future child rural resident at NA NA NA NA NA NC NE NE NE NE<br />
CUrTent concentrations<br />
(RdA groundwater only)<br />
-- --<br />
A TU9835000 I 0 .Sec6_r.doc
• • •<br />
~~ ~<br />
-~ .<br />
~-- -<br />
~<br />
Table 6.5. Summary of risk characterization results for SWMU 196 without lead as a COPC<br />
- ~<br />
% %<br />
Tolal Tolal % Total Tolal % Total<br />
Receptor ELCit" COCs tILCR POCs ELCR Tolalm" cots Hi POCS HI<br />
Future child rural resident at NA NA NA NA NA NC NE' NE NE Nt::<br />
current concentrations<br />
(McNairy groundwater<br />
oilly) _. -<br />
Future adult rural resident at NC NA NA NA NA NC NE NE NE NE<br />
current concentrations<br />
(RGA groundwa_ter only) _<br />
Future adult rum iesident at NC NA NA NA NA NC NE NE NE NE<br />
cum:nt concentrations<br />
(McNairy groundwater<br />
only)<br />
----<br />
Future child rural resident at NA NA NA NA NA 23.9 Cadmium 35 Ingestion of soil
Table 6.5. Summary oC risk characterization results Cor SWMU 196 without lead as a tope<br />
% %<br />
Total Total % Total Total<br />
Receptor ELCR" COCS ELCR POCS ELCR Totalm" COCs HI POCs<br />
- - -_ ..<br />
Future teen reCreational user NA NA NA NA NA
• • •<br />
Table 6.6. Summary of risk characterization results for C· 720 Complex without lead as a COPC<br />
% %<br />
Total Total % Total Total % Total<br />
ReceptlJr ELCR" COCS ELCR POCs ELCR Totalm" COCS m Pots HI<br />
-<br />
Current industrial worker at NB NB Nt NE NB NE NB NB NE NE<br />
currenl concentralions (soil<br />
only)<br />
- - -<br />
FutUre industrial worker at NB NE NE NE NE NE NB NB NE NE<br />
curtenl concentrations (soil<br />
only)<br />
---<br />
Currenl industrial worker at<br />
current concentrations<br />
NE NE NE NE NE NE NE NE NE NE<br />
(sediment only)<br />
Future industrial worker at Nt NE NE NE NE NE NB NE NE NE<br />
current concentrations<br />
(sedimelll only)<br />
Fulure industrial worker at 6.0 x IO~ Arsenic I Ingestion of 94 3.03 Antimony 6 Ingestion of groundwater 85<br />
current collcentrationS Beryllium 10 groundwater IrOn 45 Dermal contact 8<br />
(RGA groundwater only) I.I-Dichloroethene 4 DennaJ contact 3 Manganese II Inhalation while showering 7<br />
Carbon tetrachloride
-<br />
~ -~ --.<br />
-~<br />
HI<br />
Table 6.6. Summary of risk characterization results for C-720 Complex without lead as a COPC<br />
% %<br />
Total Total % Total Total % Total<br />
Receptor ELCR' COCS ELCR POCS ELCR Total HI' ~OGs m ---- - P9c:s<br />
~<br />
Future induslltal worker at 6.6 x IO~ Arsenic
• • •<br />
...<br />
Table 6.6. Summary of risk characterization results for C-720 Complex without lead as.a COpe·<br />
% %<br />
Total Total % Total Total % TOlal<br />
Receptor<br />
...<br />
ELta" COCS ELCR POCS ~L~R Totalm" (;()~ . IfI POCs III<br />
FutllI'C child rural resident at NA NA NA NA NA 105 Aluminum 9 Ingestion ~f groundwater 59<br />
current concentrations Arsenic
Table 6.6. Summary of risk characterization results for C-720 Complex without lead as a COPC<br />
--<br />
. --_ .. --<br />
% %<br />
Total Total % Total Total % Total<br />
Recep'~r: - -- E~C:;~' COCs ~LC:;R POCs ELCR, Total HI' coes HI poes HI<br />
-- - -<br />
Future adult rural resident at 4.9 x 10. 3 Arsenic I Ingestion of SS 39.7 Aluminum 9 Ingestion of groundwater 6S<br />
current coneentrations Beryllium 28 groundwater Arsenic
• •<br />
•<br />
Table 6.6. Summary of risk c:haracteri:tation results for C· 720 Complex without lead asa COPC<br />
.. ..<br />
Total Total .. Total Total<br />
Receptor ELCR" CQCs EtCH. POCs ELCR T~tIIlm" coes m<br />
pocs<br />
% Total<br />
HI<br />
Future adult recreational NE NE NE NE NE NE NE NE<br />
user at current<br />
concentrations (soil only)<br />
.- ""--<br />
NE<br />
NE<br />
Future adult recreational NE NE NE NE NE NE NE NE<br />
user at current<br />
concentrations (sediment<br />
only)<br />
-- - - - -<br />
- - ----<br />
NE<br />
-.<br />
NE<br />
Future excavation worker at 7.9 x to- S Arsenic 11 Ingestion of soil 9 0.388 NE NE<br />
Cllnent concenlrntions Beryllium 82 Dermal contact 88<br />
Vinyl chloride 6 Inhalation of vaes and 2<br />
particulates<br />
Note:<br />
•<br />
-_.<br />
. - - .<br />
NA = ELCR not apphcable to child and teen cohorts. Values for adult mclude exposure as child and teen.<br />
NE = Land use scenario not of concern()r hind use not evaluated because contact with medium is not possible.<br />
NC = no COPCs were retained after data screens.<br />
Total ELCR and total HI columns reflect values from Tables 1.94 to 1.103 in Vol. 4 without lead included .<br />
NE<br />
--<br />
NE<br />
ATLI983S00010 Sec6_r.doc
Table 6.7 Summary of hazard quotients for chemicals- posingpotentiai future risks b to nonhuman<br />
receptors.<br />
Chemicals ·of Potential Ecological Concern<br />
Location Receptor AI Cd Cr Pb Hg Ni Se Ag Zn<br />
SWMUOO1<br />
Ditch soil,<br />
Plant<br />
Worm<br />
Shrew<br />
Mouse<br />
Deer<br />
16:8<br />
42.0<br />
1.3<br />
SWMU091<br />
Ditch soil,<br />
Plant<br />
Worm<br />
Shrew<br />
Mouse<br />
Deer<br />
262.0 1.6<br />
nb<br />
25.4<br />
1.2<br />
1.5<br />
16.8<br />
42.0 4.7<br />
3.3<br />
1.6<br />
SWMU196<br />
bitch soil<br />
SWMU 196<br />
'Surface soil<br />
Notes:<br />
•<br />
b<br />
Plant<br />
Worm<br />
Shrew<br />
Mouse<br />
Deer<br />
Plant<br />
Worm<br />
Shrew<br />
Mouse<br />
Deer<br />
3.1 1.1<br />
9.7<br />
U.4<br />
4.7 4.4<br />
2.2<br />
4.0<br />
10;9<br />
1.6<br />
4.8 10;5<br />
nb<br />
nb<br />
nb<br />
nb<br />
AI = aluminum; Cd= cadmium; Cr= chromium; Pb = lead; Hg = mercury; Ni = nickel; Se = selenium;Ag<br />
='silver; Zn,= zinc.<br />
"-" indicates that the hazard ,quotient for the chemicaUreceptor combination did not exceed 1 or the<br />
chemical was below background atthat site.<br />
"nb" indicates no toxicologicaIbenchmark was available for,the chemicaUreceptor combination.<br />
The table includes values for those chemicals with a'maximum concentration above !background(or no<br />
background available) and' at least one hazard quotient> 1.0. Analytes for which ecological benchmarks<br />
were not available are shown in Tables' 2. 1 ,and 2.2 of Vol. 4.<br />
Values in, this table are hazard quotients estimated by dividing the dose to the receptor by the benchmark<br />
dose.<br />
•<br />
•<br />
ATU983500010 Sec6_r.doc
•<br />
7.<br />
CONCLUSIONS<br />
7~1 'INTRODUCTION<br />
'This 'section ptesentsconclusions about the hydrogeologic setting !(Sect. 3), contaminant<br />
sources, contaminant migration pathways, affected environl1lental media, human health risk'<br />
assessment, and ecological :risk assessment at the four WAG 27 sites. These conclusions are drawn<br />
from known site .conditions .(Sect. 3), ,the nature andexteJit of .coiuamination (Sect. 4). the fate and<br />
transport of contaminants (Se.ct. 5). and the risk to human health, and the ecological communities<br />
associated! with the identified ,contaminants ,
7-2<br />
,questions that were developed~ during the WAG 27 Work Plan development stage concern the<br />
physical and chemical properties, stratigraphy, and hydrogeology of the geologic units, at each of the<br />
sites.. 'fo eliminate redundancy, these related, DQO questions are addressed below in a single<br />
section. However, special emphasis has been given to variations in conditions specific to each<br />
individual SWMU orlo the C-720 Building.<br />
What ~is the stratigraphy (and physical'and chemical properties) of the soil and how do these<br />
parameters affect the ,migration and distribution of contaminants from the source?<br />
'lihree lithologic units are encountered in the subsurface at WAG 27. These are, in<br />
ascending order: the McNairy Formation, the LCD, and tile BCD., Sediments included, within ,the<br />
McNairy Formation are predominantly gray lignitic clays and silts that subcrop at apprmdmately<br />
100 ft bgs. IfheMcNairy sediments are overlain by 50 ft of porous and permeable coarse..;grained<br />
sands and chert gravels oithe LCD. The LCD is in turn. over:lain by.a fining-upward sequence of<br />
gravels, sands, silts, and clays of the 'OCD. Sands and gravels within ,the VCD ate typically finegrained~<br />
poorly sorted,and occur ,as Ilaterally discontinuous Ilenses within a matrix of finer-grained<br />
material.<br />
'.<br />
At the PGDP, the UCD averages approximately 50, ftin thickness and lthe water ,table is<br />
typically encountered! at approxhnately 45 to 50 ft 'bgs. As a result, most of the VCD sediments are<br />
within the vadose zone, whereas the LCD and McNairy Formation are below the water table.<br />
1"he physical and chemical properties of subsurface soil and the depth to the water table at<br />
WAG 27 play an important role in the migration and distribution of contaminants in the subsurface.<br />
Because ;the primary releases at each of the sites ,occurredl ,in ,the upper few ft of soil, the significant<br />
secondary contaminant sources are located within ;the clay rich UCD sediments. Relative to the<br />
LCD, thepermeabilityofthe'OCD sediments is relatively low. However, the liCD is not an,aquitard<br />
and leaching ,of contaminants from the 'OCD during the ,infiltration and downward migration, of<br />
precipitation toward ,the LCD~and' water ,table) is the ,primary contaminant. dispersion pathway at<br />
each of the sites linvestigated~<br />
•<br />
As contaminated fluids ,migrate through the UCD, the physiochemical ,properties ,of the<br />
shallow tsoilcanhave a pronouncedaJfect on Ithe preferential ,migration pathway and can retard the<br />
migration of selectedcontaminants. At each of the thteeSWMUs,and the C-720 Building, where<br />
metals have been identifiedas,COCs, the most and highest concentrations of metals are typically<br />
restricted to the upper 20 ft of ,the UOID. The metals,are, apparently trapped by the clay rich 'soH in<br />
the upper IUCD ibecause the metali ions ihave a high affinity ,to sorb to clays. At SWMU 001, the<br />
UCD soil also was found to have a high TOCcontent (average 80 1 1 mglkg) which affects the<br />
migration of VGAs to the deeper subsurface. The source for ,this carbon is possibly from the<br />
decomposition of waste ,oil that was Ilandfarmed at SWMU 00,11. The presence of a high carbon<br />
content increases the probability that VOAs will be ,sorbed to the soil, which may explain why<br />
higher concentrations ofTCE are not present in the ROA groundwater downgradient from o.the<br />
source.<br />
Because most of the UeDis within the vadose zone" ,lateral 'transport of contaminants is not<br />
a significant contaminant distribution process. An ,exception to ,this !observation occurs at ,the C-720'<br />
Building. On the ,south side of the,building, shallow groundwater (probably sourced from a broken<br />
water !\ine) has resulted in ,the laterall transport of contaminants within the liCD. However" even<br />
where shallow groundwater is present in the VCD, the lack of continuous sands limits the<br />
availability of conduits for long distancdateral migration. The combination of a deep water table,<br />
ATL\983500011 Sec7,_r.doc
•<br />
7-3<br />
the lack of shallow continuous sands in the vadose zone, and the presence of a DNAPL (TCE) as the<br />
principle contaminant at most sites has resuhedin the development ofa UCD soil contaminant zone<br />
that is cylinder-shaped and extends from the near surface source to the top of the local water table.<br />
Once the downward migrating contaminated fluids intersect the water table (the RGA). the<br />
migration pathway is redirected from vertical to lateral as the contaminants are incorporated into.<br />
and carried along with, the groundwater .flow toward the west-northwest. Because the McNairy<br />
Fonnation has a lower penneability ,than the overlying RGA .sediments, and because groundwater<br />
flow typically will follow the path of leastre.sistance, mixing of the contaminated RGA groundwater<br />
with the deeper McNairy flow system is not extensive. As a result, the McNairy groundwater is<br />
relatively uncontaminated.<br />
7.2 WAG 27 SWMU-SPECIFICDQO QUESTIONS<br />
The primary DQO questions that were developed during scoping of the work plan have been<br />
grouped; into like categories and are addressed individually for each of the· three SWMUs investigated<br />
and for the C-720 Building.<br />
C-747-COil Landfarm (SWMU 001)<br />
What are the potential contaminants? What are the plant processes that have contributed?<br />
When did the release(s) occur?<br />
•<br />
The C-747-COil Landfarm was used l from 1973 to 1979 for landfamling of waste oils<br />
contaminated with TCE, uranium, PCBs and 1, I ,l-trichloroethene. These waste oils were believed<br />
to have been derived from a variety of plant processes. During the WAG 27 RI, VOAs (including<br />
TCE and vinyl chloride) and several metals, including arsenic, antimony, cadmium, magnesium,<br />
manganese and silver, were identified at concentrations above screening levels in the shallow<br />
subsurface soil and sediments at SWMU 001. Although not detected in soils at high concentrations.<br />
Tc-99 also may have been contained in the waste oils that were landfarmed at SWMU 001.<br />
What are the concentrations and activities at the source? What is the area and volume of the<br />
source zone?<br />
TCE was found in SWMUOO I soils at a maximum concentration of 439,000 ug/kg, a<br />
concentration that is indicative of DNAPL. Lower concentrations of several TCE degradation<br />
products are also present at the site. The extent of TCE contamination in the vadose soils is<br />
confined to. a zone that is approximately 175 x 115 ft in size located near the northside of the old<br />
landfarm. Soils impacted with TCE and associated VOAs were found to extend from the near<br />
ground surface to the top of the water table at 50 ft Ibgs. The volume of soil impacted by TCE and<br />
related VOAs is approximately 1;@06,000 cubic ft. Metals were detected in the subsurface soils at<br />
concentrations that exceed background levels by up to 27 times. The metals are widely dispersed<br />
,throughout the I and farm, but the highest concentrations of metals are generally restricted to the<br />
upper 20 ft of vadose zone soil. The maximum volume of soil contaminated by metals covers an area<br />
that is 290 x 200 x 28 ft for a volume of over 1 ,624;0@Ocubic ft. of soil.<br />
•<br />
What are the past, ,current, and future release and migration pathways? What are the<br />
contaminant migration trends? What is the effect·of utilities on the migration pathways?<br />
Releases of contaminants to the environment occurred at SWMU 001 during the<br />
llandfarming of waste oils. The landfarm is not currently active and secondary releases from the<br />
contaminated soil within the land farm represent the current and future ,potential release mechanism.<br />
ATL\983500011 Sec7_r.doc
7-4<br />
Past migration pathways at SWMV 001 during the active phase of the landfann may Ihave inclUded.<br />
downward leaching .of contaminants to groundwater,. possible sUlface-water runoff,airborne<br />
dispersion of Iparticulates,and! volatilization. The passage of time and the stabilization of the<br />
landfarm surface by vegetation have effectively reduced volatilization, airborne dispersion,and<br />
surface ,runoff pathways. Monitoring of intennittent surl'ace-water runoff at controlled discharge<br />
,points indicates that runoff is not currently a factor for contaminant migration from SWMU 0011! to<br />
downgradientreceptors.<br />
Infiltration of groundwater through the vadose zone :is the primary migration pathway for<br />
ithe dispersion .ofcontaminants from ,s:WMU 00 1. 'Underground! utilities do not represent a current or<br />
potential' future ,migration pathway. Migration of the groundwater through the vadose zone is<br />
predominantly in a vertical direction. Evidence of significant Ilateral transport or contaminants<br />
within the UCDwas not observed.<br />
Does contamination Ireach the groundwater? What is ,the ,role of the UCRS in contaminant<br />
transport? Where is the dissolved phase .plumemigrating to?<br />
Leaching of contaminants from ,the UCD soil has resulted in the migration of contaminants<br />
into . .the VCRS ,groundwater. Site-related contaminants iidentifiedi ,in ,the lJCRSat SWMU 001<br />
include 'low concentrations ·of TCE ,(312 ugIL) and' 1'CE ,degradation products. Although 18 'borings<br />
were drilled into ,the lowerUCRS, groundwater was present only in a single sample and: iis therefore<br />
not laterally extensive. When present,groundwater in the UCRS probably serves to transport<br />
dissolved phase contaminants vertically into the underlying RGA.<br />
Within the RGA, the preferential migration direction is. by lateral movement (flow and<br />
dispersal) ,through LCD sediments. A plume of .contaminated groundwater containing as much as<br />
1578 ug/L ofTCE and Ifc-99 at a maximum activity of 3709:6 pCiJl.has been identified at SWMU<br />
00 1 11. The contaminant !plume appears to be migrating to the west-northwest (downgradient) and<br />
curremly extends. beyond! the plant security fence. The source of the TCE observed ,in the RGA<br />
groundwater is from leaching of UCDsoils at SWMU 001; the source of the Tc.:99'has not been<br />
defined.<br />
Downward ,migration of contaminants into the underlying McNairy Formation, as .evidenced<br />
by the .lack of TCE at concentrations above afewugIL, does not appear to be ail' ongoing process.<br />
BF6 Cylinder Drop 'Fest Site (SWMU 091)<br />
What are Ithepotential contaminants? What are the plant processes that have contributed?<br />
When did ,therelease(s), occur?<br />
During 'late 1964 and earl y 1965 and again in February 1979, cylinder drop ,tests were<br />
conducted at SWMU09!1. A Ibrine-icebath was used to chiU the cylinder during the first test, and.a<br />
TeE and dry:.ice Ibath was used during. the 1979test.Leakage from the unlined ,in-ground pit that<br />
was .used to hold the 'FCErefrigerant and cylinder during this second testis presumed to be the<br />
source of the shallow soill and i groundwatercontaminationidentifiedi at SWMU 109,} during past<br />
investigations. Results of,the RI indicate that ,metals and ,radionucIides are present at elevated!<br />
concentrations in the shallow soils.<br />
•<br />
ATl!.\9835000 1 '11 Sec7 _r;doc
•<br />
7-5<br />
What are the concentrations and activities at the source? What is the area and volume of the<br />
source zone?<br />
Three metals (AI, Cd, and Na) and one radionuclide (Pu-2391240) were detected above<br />
screening levels in the ditch sediment samples at SWMU 091. Only one constituent, Cd, was found<br />
ata significant concentration. Pu-239/240 was detected once at an activity only slightly above<br />
screening levels. No area or volume was calculated for the sediment source zone. TOE<br />
contamination in the subsurface soil at SWMU 09:1 has been addressed in a May 1998 ROD.<br />
What are the past, current. and future release and migration pathways? What are the<br />
contaminant migration trends? What is the effect of utilities on, the migration pathways?<br />
Releases of contaminants to the environment at SWMU 091 occurred when TCE leaked<br />
from an in-ground' pit during cylinder drop testing in 1979. This pit is no longer in use and<br />
secondary releases from the contaminated soil represent the current and future potential release<br />
mechanisms. Past migration pathways at SWMU 091 may have included downward' leaching of<br />
contaminants to groundwater, possible surface-water runoff, and volatilization. Underground<br />
u~ilities are not present at SWMU 091 and, therefore, do not represent a pathway for migration.<br />
•<br />
Precipitation, mostly as rainfall infiltrating through the vadose zone to the groundwater. is<br />
the primary migration pathway for the dispersion of contaminants from SWMU09'1. Remediation<br />
of the contamination (specifically TCE) in shallow «45 ft bgs) subsurface soils currently is being<br />
implemented under an Augus~ 1998 ROD .<br />
Based on the results of the WAG 27 RI, the release ,of contaminants to nearby surface water<br />
from runoff is not a significant migration pathway.<br />
Does contamination reach the groundwater? What is the role of the VCRS in contaminant<br />
transport? Where is the dissolved phase :plume migrating to?<br />
No groundwater samples were collected from the VCRS at SWMU 091. Groundwater<br />
samples from the RGA and the McNairy flow system contained VOAs (TCE and its degradation<br />
products), radioactive isotopes, and metals at concentrations above screening levels.<br />
Contaminant migration within the RGA occurs predominantly as lateral flow and dispersion<br />
through the LCID as groundwater moves to the west-northwest. A contaminant plume of TCE and<br />
lc-99 has been identified in the RGA groundwater beneath SWMU 091, but tbeprimary sources of<br />
the contaminants appear to lie inanupgradientdirection. While vertical migration of fluid through<br />
the UCD is a major migration pathway at SWMU 091, leaching of contaminants to the RGA<br />
groundwater is not believed to be significant due to the small volume of TCEreleased at the site.<br />
Beneath SWMU 091, the maximum concentration of TCEdetected in an RGA groundwater sample<br />
was 112 ugIL. The maximum activity of Tc-99 detected was 568.1 pCilL. No clear evidence<br />
suggests that the metals detected in RGA groundwater samples at SWMU 091 were derived from a<br />
source at .5WMU 091.<br />
•<br />
Groundwater samples from the McNairy Formation beneath SWMU 091 contain low levels<br />
ofTCE (1.9 ugIL), Th-230 (maximum 53.77 pCiIL), and uranium (O.OOlpCiIL). These very low<br />
concentrations/activities indicate that the downward migration of contaminants into the low-<br />
A TI.\983500CH I Sec7 _r:doc
penneability McNairy clays from the overlying RGA, is not a major contaminant migration<br />
pathway.<br />
C·746·A Septic Systems (SWMU 196)<br />
What are the potential contaminants? What are the plant processes that have contributed?<br />
When did the releases occur?<br />
The C;. 746-A Building was used as a warehouse during plant construction. Subsequent<br />
operations were for metal storage and smelting. An aluminum smelter was operated in the west end<br />
of the building between 1956 and 1985. Beginning in 1975 and continuing until 1985, a nickel<br />
smelter was operated in the east end of the building. Current operations include storage of<br />
hazardous and PCB waste. Although no specific releases are recorded, hazardous materials. may<br />
have been processed through ,the septic systems. Based on the activities taking place in the C-746-A<br />
Building, VOAs, metals and radionuclides could have been released. Results of this RI indicate that<br />
only metals are present at concentrations above screening levels in the UCD soil' at SWMU 196.<br />
What are the concentrations and activities? What is the area and volume of the source?<br />
Eighteen metals were detected above screening levels at SWMU '196, many of which were<br />
only slightly above screening. values, The area impacted by metals at the NE septic system is<br />
approximately 70 ft x 60 ft (includes septic tank and leachfield) and extends to approximately 10 ft<br />
bgs. The area impacted by the metals contamination along the NW drain lines is more extensive, and<br />
is approximately 100 ft x 10ft along the line extending north-south to the west of the building and<br />
1'80 ft x 10 ft along the line extending east-west to the west of the septic tank. The contamination<br />
extends to approximately 10ft bgs along both of these lines. The most frequently detected metal was<br />
antimony, which was found in 28 samples from eight locations at a maximum concentration of 121<br />
mglkg. Other metals detected include beryllium (113 mglkg), cadmium (116 mglkg) , and thallium<br />
(114 mglkg).<br />
•<br />
•<br />
What are the past. current and future release and migration pathways? What are the<br />
contaminant migration trends? What is the effect of utilities on the migration pathways?<br />
Past potential release points include septic tanks and' leachfieldlines. The septic systems<br />
were plugged and abandoned in 1980 and are not a current or future release point. The septic tanks<br />
were emptied and filled with inert masonary sand in January and February 1998 and are not a<br />
current or future release point.<br />
Past migration pathways at SWMU 196 include downward leaching to groundwater.<br />
Precipitation, mostly as rainfall that infiltrates into the subsurface and migrates vertically, is the<br />
primary migration pathway for the dispersion of contaminants from SWMU 196. Results of the<br />
WAG 27 RI show that vertical migration of metals extends to approximately 10ft bgs at SWMU<br />
196.<br />
Does contamination reach the groundwater? What is the role of the UCRSin contaminant<br />
transport? Where ,is the dissolved phase plume migrating to?<br />
The water table was not encountered in the shallow borings drilled at SWMU 196.<br />
•<br />
A TL\9835000IISec7 _r.doc
•<br />
C-720 Complex<br />
7-7<br />
What are the potential contaminants? What are the plant processes that have contributed?<br />
When did the releases occur?<br />
The C-720 Building was constructed in the mid-1950s and' housed various facilities,<br />
including a compressor shop, machine shop, paint shop, valve shop and White Room for cleaning<br />
electronics. Oils, solvents, and degreasers were used frequently in the shop processes for machining<br />
and cleaning equipment. Solvents, such as TCE, were also used at a staging area' north of the<br />
building for cleaning various parts and smaller pieces of equipment.<br />
Although no specific occurrence of a release or spill was documented, the drains and sumps<br />
may have been mechanisms for contaminants to be released to the subsurface soil and groundwater.<br />
Liquids collected in the network of 150 floor drains throughout the building were discharged via<br />
eight exit points that connected to the plant stonnwater system. Due to the construction and<br />
condition of the storrnwater manholes where the building drainage system connected, these areas<br />
represented potential release mechanisms of contaminants discharged into the building drainage<br />
system.<br />
Based on the history of activities and processes within the C-720 Building, VOAs, SVOAs,<br />
PCBs, metals, and radionuclides could have been released to the surrounding environment. Data<br />
from this RI indicate, however,that only YOAs, primarily TCE and it degradation products,<br />
SYOAs, and metals have contaminated shallow subsurface soil.<br />
What are the concentrations and activities at the source? What is the area and volume of the<br />
source zone?<br />
Two separate areas of contamination. were identified at the C-720 Complex. A large<br />
rectangular area was defined north of the building measuring 1050 ft x 225 ft. An estimated<br />
4,725,000 fe of YOA-contaminated soil was reported from the zone between 17 and 42 f1. The<br />
volume of metals-contaminated soil in this zone was 660,000 fe. In the north area, a maximum TCE<br />
concentration of 14,000 'Jlg/kg was found. I,I-DCE was detected at a concentration of 200 J!glkg.<br />
Maximum detected metals concentrations were much lower than those found in the south source.<br />
Another area delineated south of the building measures 825 ft x 150 flo The constituents<br />
accounting for the greatest volumes of soil contamination south of the !building were TCE<br />
(1,608,750 re)and metals (312;000 ft\These areas are considered secondary sources due to ,the<br />
contaminant occurrence in the subsurface. The ueD soil south of the building had a maximum TCE<br />
concentration of 68,000 J!g/kg, an estimated maximum concentration of trans-,1,2-DCE of 450;000<br />
J!g/kg, and a maximum vinyl chloride concentration of 400 Jlglkg. Metals were detected at<br />
maximum concentrations in boring 720-024 between 35 and 50 flo Bis(2ethylhexyl)phthalate was<br />
also detected at a maximum concentration of 1,100 J!glkg in this boring.<br />
•<br />
The Compressor Shop pit sump is a potential source if material is being released. The<br />
sludge sample collected from ,the sump 'had the ihighest TCE concentration (420,000 uglkg) and the<br />
highest Tc-99 activity (27,520.6 pCi/g) detected at the site. l,I-DeE, bis(2-ethylhexyl)phthalate,<br />
metals, PCBs, and radionuclides were also detected in this sample .<br />
A1U983500011 Sec7J.doc
7-8<br />
What are the past, current, and' future release and migration pathways? What are the •<br />
contaminant migration trends? What is the effect of underground utilities on the migration<br />
pathway?<br />
Three historic release points were identified in the RI: the drainage system exit points, the<br />
cleaning area north ·of the building. and the Compressor Shop pit sump. Significant soil<br />
contamination was observed at five of the drainage exit points and at the cleaning area north of the<br />
building. These areas represent secondary sources that will likely continue to release contaminants<br />
to groundwater. Based on the subsurface soil contaminant distribution, the primary migration<br />
pathway is vertical through the VCD to the RGA groundwater. Lateral transport in the VCD occurs<br />
on the south side of the C-720' Building along the east-west storm drain in the 7- to lO-ft depth<br />
range. Although there is potential leaching from the Compressor Shop pit sump, this was not<br />
confirmed from soil samples taken in the area.<br />
Does contamination reach the groundwater? What is the role of the VCRS in contaminant<br />
transport? Where is the dissolved phase plume migrating to?<br />
TCE, at a maximum concentration of 149 ugIL, and small quantities of TCE degradation<br />
products were the only contaminants reported in the VCRS water samples at the C-720 Building.<br />
All five of the VCRS water samples were collected in locations adjacent to the south and east side<br />
of the building. Coincidentally, a break in. a water main located some tens of feet so,uth of the<br />
building was being repaired during the RI. Therefore, the water recovered from the VCRS in this<br />
area may have been sourced from this broken water line.<br />
TeE and Tc-99 were detected at significant levels in RGAgroundwater at the C-720<br />
Building; however, of these only TCE was detected above screening levels in the UCD soils. Once<br />
contaminants reach the RGA, migration is to ,the west-northwest. Because of the transmissivity of<br />
the RGA, migration of fluids from the RGA into the McNairy is not a major groundwater flow path.<br />
This is evidenced by the fact that little or no contamination was found in groundwater samples<br />
collected from the McNairy flow system.<br />
•<br />
7.3 BASELINE RISK ASSESSMENT<br />
For all four WAG 27 sites, the cumulative human health ELCR and systemic toxicity exceed<br />
the .accepted standards of the KDEP and the EPA for one or more scenarios when assessed using<br />
default exposure parameters. The scenarios for which risk exceeds de minimis levels (i.e., a<br />
cumulative ELCROf 1 x 10⁻⁶ or a cumulative HI of I) are summarized in Table 6.2.<br />
Because WAG 27 is located in the industrialized' portion of the PGDP, the BERA project<br />
team concluded during problem formulation that it would not be appropriate to derive risk estimates<br />
for impacts to nonhuman receptors under current conditions. However, in an analysis to deterTnine<br />
potential impacts ,to nonhuman receptors exposed to contaminants in surface soil or ditch sediment<br />
in the future, if the industrial infrastructure were removed, and to estimate the potential impact of<br />
surface migration of contaminated media wasperforrned. Several contaminants in surface soil from<br />
SWMU 196 and exposed sediments in drainage ditches associated with SWMUs 001, 091, and 1:96<br />
were found to be at concentrations greater than levels believed protective of nonhuman receptors.<br />
Table 6.7 summarizes these COPECs. Because contaminants at the C-720 Building and SWMU 091<br />
•<br />
ATI:.\9835000 II Sec? _r.doc
•<br />
7-9<br />
are restricted to subsurface soils below gravel-or cement-covered areas, effectively eliminating<br />
potential exposures, the BERA project team concluded that it would not be appropriate to derive risk<br />
estimates for nonhuman receptors to contaminants in surface soil at these two sites. Surface soils at<br />
SWMU 00 1 have already been evaluated and addressed as Ipart of the WAG 23 ROD, so they are not<br />
re-evaluated for SWMU 001 here.<br />
7.3.1 Observations of the Baseline Human Health Risk Assessment<br />
Observations from the BHHRA focus on the industrial land use (the current and most plausible<br />
future land uses for the WAG 27 sites); and the observations of the BERA focus on the potential<br />
risks to nonhuman receptors.<br />
•<br />
• Use of the provisional lead RfDs provided by KDEP results in total HIs that exceed 1000 for<br />
the use of groundwater at the WAG 27 sites and for those locations where the maximum<br />
detected'concentration of lead in soil exceeded its background concentration. However. when<br />
these ,provisional values are not included in the risk characterization, total' HIs are markedly<br />
reduced. Due to the uncertainty in the results using theprovisional l lead RIDs, a better<br />
understanding of the risks presented by lead may be gained ,by comparing the representative<br />
exposure concentrations of lead in soil and groundwater 'to screening levels from KDEP and<br />
EPA. In these .comparisons. the concentrations of lead in RGA and McNairy Formation<br />
groundwater, at all sites, are seen to exceed the KDEP screening level. The EPA screening<br />
level is also exceeded for RGA and McNairy Formation groundwater at all sites except the C<br />
no Complex. The representative exposure concentrations of lead in sediment and subsurface<br />
soil never exceed either screening level. However, the representative concentration of lead in<br />
surface soil at SWMU 196 exceeds only the KDEP screening level. None of the representative<br />
concentrations in surface soil exceed' the EPA screening 'level.<br />
o<br />
o<br />
The dermal contact with soil exposure route poses considerable risk, predominantly from<br />
contact with metals in soil (primarily beryllium). In fact, for all land use scenarios evaluated,<br />
the systemic toxicity and: the ELCR ,posed through, the soil and sediment dermal exposure route<br />
exceed that posed by the ingestion route. Remedial action decisions based on the dermal<br />
contact with soil exposure route should be carefully considered because of the uncertainty<br />
associated with risk from this exposure route.<br />
The current land use scenario, industrial use, has risk that is above de minimis levels at each<br />
site except the C-720 Complex. where contact with surface soil is not possible and no ditches<br />
are present. At SWMU001, the ,pathway driving both systemic toxicity and ELCR is dermal'<br />
contact with sediment. At SWMU 09'!1, the pathway driving systemic toxicity is dermal contact<br />
with sediment, and ELCR is driven by external exposure to sediment. At SWMU 196, the<br />
pathway driving systemic toxicity is dermal contact with sediment, andthe ELCR is driven by<br />
both external exposure to soil and dermal contact with sediment. For the C-nOComplex, no<br />
COCs were identified for soil or sediment for the current industrial' worker.<br />
No one contaminant dominates contribution to systemic toxicity. The total HI at each site is<br />
less than 3. The primary contaminant driving ELCR within this pathway is beryllium, and also<br />
I. contributing are radionuclides (Np-237 and Cs-B7) for all sites.<br />
ATL\983500011 Sec7_r:doc
• The most plausible future land use scenario, industrial use, has risk that is above de minimis<br />
levels at each WAG 27 site. The future industrial land use scenario is identical to the current<br />
industrial land use scenario except that the former also includes use of RGA and McNairy<br />
Formation groundwater. The addition of groundwater as a medium of exposure adds<br />
significantly .to the risk for this scenario. If groundwater contribution is removed from the risk<br />
totals, the driving pathways are identical to those of the current industrial land use scenario.<br />
• Risks from use of groundwater (without the risk contribution of lead) drawn from both the<br />
RGA and the McNairy Formation exceed de minimis levels for all scenarios at each site except<br />
SWMU 196, where no COPCs were identified. For the RGA,across all land uses at SWMU<br />
001, the contaminants contributing greater than 10% ELCR were arsenic, radon-222, beryllium,<br />
and technetium-99. The contaminants contributing greater than 10% systemic toxicity were<br />
various metals. For the McNairy, across all land uses at SWMU ·00;1. the contaminants<br />
contributing greater than' 10% ELCR were beryllium, americium-241, and uranium-238. The<br />
contaminants contributing greater than 10% systemic toxicity were varioils metals. For the<br />
RGA, across all' land uses at SWMU 091, the contaminants contributing greater than 10%<br />
ELCR were radon-222, americium-241, and1beryllium. The contaminants contributing greater<br />
than 10% systemic toxicity were various metals and TCE. For the McNairy, across all land<br />
uses at SWMU 091, the contaminants contributing greater than 10% ELCR were americium-<br />
24'1, neptunium-237, and uranium-238. The contaminant contributing greater than 10%<br />
systemic toxicity was uranium. For the RGA, across all land uses at the C-720 Building, the<br />
contaminants contributing greater than 10% ELCR were .beryllium, americium-241, neptunium-<br />
237, uranium-238, 1, I-dichloroethene, and technetium-99. The contaminants contributing<br />
greater than 10% systemic toxicity were various metals, 'fCE, and carbon tetrachloride. For the<br />
McNairy, across all land uses at the C-720 Complex, the contaminants contributing greater<br />
than 10% ELCR were beryllium, americium-241, neptunium-237, and uranium-238. The<br />
contaminants contributing greater than 10% systemic toxicity were various metals.<br />
•<br />
•<br />
• Inhalation of VOAs and particulates emitted via the soil exposure is a POC for the excavation<br />
worker at SWMU 001 and the C-720 Complex. The contaminant driving risk within this<br />
pathway and scenario combination is vinyl chloride.<br />
• COCs migrating from sources in the WAG 27 soil and groundwater as determined by risk<br />
estimates for future residential .groundwater users are phenanthrene. trans-l,2-dichloroethene,<br />
TCE, vinyl chloride, xylenes. antimony, manganese, silver, thallium, and vanadium. There<br />
were no radionuclide COCs.<br />
7.3.2 Observations of the Baseline Ecological Risk Assessment<br />
o Nine inorganic COPECs, all, exceeded benchmarks for at least one receptor .group (Table 6.7).<br />
The inorganics were aluminum, cadmium. chromium, lead, mercury, nickel. selenium, silver,<br />
and zinc. Of these, aluminum, chromium, and lead, were near background levels. Aluminum is<br />
unlikely to be of concern at WAG 27, as the maximum aluminum concentration in any of the<br />
four sites was only 1,.01 times background. Similarly, chromium and lead were near<br />
background levels (maximum of 1.05 times and 1.5 times background, respectively). Cadmium<br />
was of concern only for plants in the SWMU 091 ditch and SWMU 196 soil. However, hazard<br />
quotients were low (less than 3.1), and the areas are currently covered with vegetation .<br />
Mercury was ·of concern only for soil invertebrates exposed to ditch sediment in SWMUs 091<br />
•<br />
A Tt,\9835000 II Sec7 _r.doc
•<br />
and 196 and surface soil in SWMU 196. Nickel was of potential concern for plants and<br />
invertebrates in SWMU 1196 surface soil and for plants in SWMU 196 ditches. Selenium and<br />
silver were of potential concern for plants in SWMU 196 surface soil. Zinc was of potential<br />
concern, with low hazard quotients for ,plants, soil invertebrates, and shrews in SWMU ]96<br />
ditches; plants and soil invertebrates in SWMU 091 ditches; and plants in SWMU 00 I ditches.<br />
However, the maximum zinc concentration was only 3.4 times background.<br />
• Estimated doses from exposure to radionuclides in soil or ditch sediment were below<br />
recommended dose rate limits for all receptors in all areas. Therefore, no unacceptable risks<br />
are expected from exposure toradionuclides.<br />
o<br />
Uncertainty conceming the future condition, the bioavailability of various metals (e.g ..<br />
aluminum and chromium were only slightly elevated above background), and use of only one<br />
line of evidence may have led to an overestimate of potential future ecological risks.<br />
A summary of COEPCs and receptors potentially at risk should future exposures occur is<br />
presented in Table 6.7.<br />
7.4 WAG 27 SWMU-SPECIIFIC nECISION RULES AND CONCLUSIONS<br />
•<br />
The decision rules for the WAG 27 RIare addressed individually for SWMUs 001. 091. and<br />
196 and the C-720Complex in Tables 7-1 through 7-4. Conclusions based on the DQO process and<br />
the risk-based decision rules indicate that risk from exposure to contaminated media exists at each of<br />
these sites. However,these risks do not pose an imminent or immediate threat to human health or<br />
the environment at any of the four locations. Risk-based analysis of data generated during the<br />
investigation indicates that response actions may be appropriate for impacted media at each of the<br />
four sites.<br />
Based on the remediation strategy stated in the PGDP SMP (DOE 1998b), the appropriate<br />
response actions will be incorporated into the major Remedial l Actions (RAs) proposed for three of<br />
the five PGDP OUs. Specifically, impacted media at the four sites will be addressed as follows:<br />
• Impacted sediments at each of the three SWMUs will be addressed as part of the Surface Water<br />
OU. Sediments are ,not present at the C-720 Complex.<br />
• Impacted soils at SWMUs 00] and 196 will be considered as part of the Surface Soil OU.<br />
Contaminated soils at SWMU091 are included within the scope of the LASAGNA Technology.<br />
Surface soils (Ito IO ft bgs) are not applicable at the C-720 Complex.<br />
• Impacted groundwater at SWMUs 001 and 09'} and at .the C-720'Complex willibe evaluated as<br />
part of the PGDP Groundwater OU. Contaminated groundwater was not identified at SWMU<br />
]i96 .<br />
•<br />
ATL\983500011 Sec7_r.doc
7-12<br />
•<br />
This page intentionally left blank.<br />
•<br />
•<br />
ATL\983500011 Sec7Jdoc
• • •<br />
Table 7.1. WAG 27 SWMU OOl-specific decision rules and conclusions<br />
DECISION RULE<br />
b I a: If the concentration of analytes found in the source<br />
zone may result in a cumulative excess lifetime cancer<br />
risk greater than I x 10,6 or a cumulative hazard index<br />
greater than I through contact with contaminated media.<br />
or if the concentration of ailalytes in the source ?:one may<br />
result in detrimental impacts to nonhuman receptors<br />
through contact with contaminated media as indicated by<br />
exceeding ecological screening criteria. and if the<br />
concentrations of an:ilytes in the source zone are greater<br />
than those that are expected to occur naturally in the<br />
environment. then evaluate actions that will mitigate risk;<br />
otherwise pursue a "no further action" decision (see Dlh<br />
and Ole),<br />
Dr b: If concentrations of analytes found in the source<br />
ione exceed applicable or relevant and appropriate<br />
requirements (ARARs), then evaluate actions that will<br />
bring contamination within the source zone into<br />
compliance with ARARs; otherwise, pursue a "no further<br />
action" decision (see Dla and Dlc),<br />
CONCLUSION<br />
Risks from direct contact with sediment exceed de<br />
minimis levels for industrial workers,<br />
Risks to the excavation worker exposed to contaminated<br />
soils exceed de minimis levels,<br />
Risks from potential use of the RGA as a drinking water<br />
source at the SWMU exceed de minimis levels for the<br />
industrial worker.<br />
Risks to nonhuman receptors are de IIIl11lmlS under<br />
current conditions due to the industrial nature of the<br />
SWMU; additionally. the contaminant concentrations are<br />
such that risks may not exceed de minimis levels in the<br />
future,<br />
Contaminant concentrations in RGA groundwater exceed<br />
MCLs for some contaminants,<br />
COMMENTS<br />
Risks for the industrial worker from exposure to sediment<br />
were greater than de minimis when the analysis was<br />
performed using default exposure parameters. When the<br />
assessment was performed using site-specific exposure<br />
parameters and reduced dermal absorption values for<br />
inorganic chemicals, the systemic toxicity risk was less<br />
than the de minimis level, and the cancer risk approached<br />
the de minimis level.<br />
Risks were greater than de Illinimis for the excavation<br />
worker when default exposure parameters were used,<br />
However, when the assessment was performed using sitespecific<br />
exposure parameters, the systemic toxicity risk<br />
was less than the {ie minimis level and the cancer risk was<br />
IxUr s ,<br />
Groundwater drawn from the RGA below the plant is not<br />
currently used at PGDP,<br />
Exposure to surface soil was not evaluated as part of the<br />
WAG 27 project These risks arc heing mitigated as part<br />
of the WAG 23 project<br />
Migration of contaminants from soil to groundwater and<br />
surface water is discussed under Decision Rules D3a and<br />
EBh, respectively,<br />
No chemical-specilic ARARs are availahle for screening<br />
contaminant concentrations in sediment or soil.<br />
Migration of contaminants from soil to groundwater and<br />
surface water is discussed under Decision Rules D3a an
DECISION RULE<br />
Table 7.1. WAG 27 SWMU OOl-specific decisiol1 rules and conclusions<br />
CONCLUSION<br />
COMMENTS<br />
Dlc: If contaminanis found aithe site are known to<br />
transform or degrade into chemicals that could lead to<br />
increased risks to human health or the environment or<br />
into chemicals for which there are ARARs. and if the<br />
concentrations of these contaminants may result in risks<br />
greater than those defined in D I a or concentrations<br />
greater than ARARs. then evaluate actions that will<br />
mitigate potential future risk or promote compliance with<br />
ARARs; otherwise. pursue a "no fun her action" decision<br />
(see Dla and DI b).<br />
D2a: If secondary sources are found. and if the<br />
concentrations of analytes within the secondary sources<br />
are found to potentially result in a cumulative excess<br />
lifetime cancer risk greater than I x 10. 6 or a cumulative<br />
hazard index greilter than I through contact with<br />
contaminated media at the unit. and if the concentrations<br />
of analytes are greater than those that are expected to<br />
occur naturally in the environment. then evaluate actions<br />
that will mitigate risk; otherwise. do not consider<br />
secondary sources when making remedial decisions for<br />
the unit.<br />
D3a: If contaminants are found in the source zone. or if<br />
secondary sources are fuund. and are found to be<br />
migrating or may migrate from the source zone or from<br />
secondary sources at concentrations that may potentially<br />
result in a cumulative excess lifetime cancer risk greater<br />
than I x 10- 6 or a cumulative hazard index greater than I<br />
through use of contaminated media at downgradient<br />
points of exposure. and the concentrations of analytes are<br />
greater than those that are expected to occur naturally in<br />
the environment. then evaluate actions that will mitigate<br />
risk; otherWise. do not consider risk posed by migratory<br />
pathways when evaluating remedial alternatives for the<br />
unit (see D3b).<br />
The COCs driving direct contact risks in soil. sediment.<br />
and groundwater at SWMU 001 may degrade into rnore<br />
toxic substances that lead to increased risk at<br />
concentrations that exceed chemical-specific ARARs.<br />
Secondary sources were identified. These secondary<br />
sources may continue to release contaminants to<br />
groundwater.<br />
Multimedia transport modeling indicates that<br />
contaminants may be released from soils and secondary<br />
sources at SWMU 001 and result in risks to off-site<br />
residential groundwater users that exceed de milli/iris<br />
levels.<br />
The RI determined that contaminants are not migrating<br />
from swMu 001 through the surface-water pathway at<br />
concentrations that would lead to risks that exceed tie<br />
millimis levels.<br />
TCE DNAPL is present in subsurface soil at SWMU 001.<br />
Transpon modeling identified antimuny, TCE, and vinyl<br />
chloride as migrating off-site through groundW(lter at<br />
concentrations that lead to risks that exceed de millimis<br />
levels.<br />
ATL\983500011 Sec7_r.doc<br />
Page 2 of 4
• • •<br />
Table 7.1. WAG 27 SWMU OOI-specific decision rules and conclusions<br />
DECISION RULE ·CONCLUSION COMMENTS<br />
D3h: If .contaminants are found in the source zone, or if Multimedia iranSp(lrt modeling indicates that ARARs for TCE aild breakdownproducls in groundwater<br />
secondary sources are found, and if these contamillants contaminants may he released from soil and secondary are exceeded in off-site locations.<br />
are found to be migrating or may migrate from the source sources at SWMU 001 and result in concentrations in offzone<br />
or from the . secondary sources at concentrations that site groundwater that exceed MCLs.<br />
exceed ARARs, then evaluate actions that will bring<br />
migratory concentrations into compliallce with ARARs;<br />
otherwise, do not consider ARARs when examining<br />
migratory pathways during the evaluation of remedial<br />
actions (see D3a).<br />
D4a: If Decision Rules D I a, D I b, D IC. 02a, 03a, or D3b<br />
indicate that remedial actions are Ileeded, then evaluate<br />
response actions to mitigate risk in the source zone.<br />
(Refer 10 Sect. 5.11 and 5.12 of the WAG 27 Work Plan<br />
for discussions of the possible response actions.)<br />
Results for Decision Rules D I a, DI b, D I c, D2a, D3a,<br />
and D3b indicate that response actions are needed.<br />
Evaluations of response actions to mitigate risk in the<br />
source zone may be appropriate.<br />
D5a: If contaminants in the source zone are found to Multimedia transport modeling to off-site locations was Multimedia transport modeling was completcd using<br />
migrate to the RGA, then determine the contributiolls completed hecause contaminants were suspected 10 MEPAS. A more sophisticated modeling tool may he<br />
from the source ~one to support future remedial actions migrate to the RGA.This information will be considered appropriate when determining remedial actions for the<br />
for existing groundwater contamination ill the when determining remedial actions for the Groundwater Groundwater Operahle Unit.<br />
groundwater integrator unit; otherwise, do not determine Opera hie Unit at PGOP.<br />
contributions.<br />
D5b: If contaminants in the source lone are found to Transport modeling to the Surface Watedntegrator Unit<br />
migrate to the Surface Water Integrator Unit (i.e., Big and was not completed because results indicated that<br />
lillie Bayou Creek and ditches discharging directly to contaminants were not migrating.<br />
regulated out falls), then determine the contrihutions from<br />
the source zone to support future remedial actions for past<br />
releases to the Surface Water Integrator Unit; otherwise,<br />
do not determine contrihutions.<br />
A TL\9815000 II Sec7 Jdoc Pago:.1 of 4
Table 7.1. WAG 27 SWMU OOI-specific decision r~les and conclusions<br />
General ConClusions for SWMU 001:<br />
I) Contamination is present in ditches at SWMU 001 at levels that may lead to risks to industrial workers that<br />
exceed de minimis levels. However. the contaminants in the ditches are not migrating to the Surface Water<br />
Integrator Unit. Per DeCision Rule D4a. response actions to mitigate the direct contact risks may be appropriate.<br />
2) Contamination is present in subsurface soil at SWMU 001 at levels that may lead to risks to an unprotected<br />
excavation worker that exceed de minimis levels. Per Decision Rule D4a. response actions to mitigate the direct<br />
contact risks may he appropriate.<br />
3) Contamination is present in groundwater at SWMU 001 that may lead to risks to industrial workers that exceed<br />
de mitziillis levels. Additionally. results indicate that contamination is present in soil and in secondary sources at<br />
concentrations that will lead to continuing contamination of groundwater. Per Decision Rule D4a. response<br />
actions to mitigate direct contact risks through groundwater use and to address continued contaminant migration<br />
to groundwater may be appropriate.<br />
4) Contaminants in subsurface soil and secondary sources in the RGA have migrated through groundwater to off-site<br />
locations at concentrations that lead to risks that exceed de minimlts levels. Per Decisi(m Rule D4a. response<br />
actions to address migration from subsurface soil and secondary sources may be appropriate.<br />
• •<br />
ATL\983~OOOII Sec7_r.doc Page 4 of 4
• • •<br />
Table 7.2. WAG 27 SWMU 091-specific deci~ion rules and conclusions<br />
DECISION RULE<br />
D I a: If the concentration of analytes found in the source<br />
zone may result in a cumulative excess lifetime cancer<br />
risk greater than I x lO. h or a cumulative hazard index<br />
greater than I through contact with contaminated media,<br />
or if the concentration of analytes in the source zone may<br />
result in detrimental impacts to nonhuman receptors<br />
throu·gh contact with contaminated me
DECISION RULE<br />
Table 7.2. WAG 27 SWMU 091-specific decision rules and conclusions<br />
CONCLUSION<br />
COMMENTS<br />
Die: If contaminants found at the site are known to<br />
transform or degrade into chemicals that could lead to<br />
increased risks to human health or the environment or<br />
into chemicals for which there are ARARs, and if the<br />
concentrations of these contaminants may result in risks<br />
greater than those defined in D I a or concentrations<br />
greater than ARARs, then evaluate actions that will<br />
mitigate potential future risk or promote. compliance with<br />
ARARs; otherwise, pursue a "no further action" decision<br />
(see.Dla and Dlb).<br />
The COCs driving direct contact risks in soil and<br />
sediment at SWMU 091 are not expected to transform or<br />
degrade into chemicals that lead to increased risk to<br />
human health and the environment. However, some<br />
contaminants present in groundwater may transform or<br />
degrade to more toxic substances that lead to increased<br />
risk at concentrations that exceed ARARs.<br />
Contaminants identitied in soil at the siie are<br />
predominantly metals and radionuclides, which are not<br />
expected to degrade into more harmful products.<br />
Risks posed by solvents (e.g., TCE) in soil are not<br />
considered because they are being addressed as part of the<br />
LASAGNATM project.<br />
D2a: If secondary sources are found, and if the Secondary sources were not found at SWMU 091.<br />
concentrations of analytes within the secondary sources<br />
are found to potentially result in a cumulative excess<br />
lifetime cancer risk greater than I x 10. 6 or a cumulative<br />
hazard index greater than I through contact with<br />
contaminated media at the unit, and if the concentrations<br />
of analytes are greater than those that are expected to<br />
occur naturally in the environment, then evaluate actions<br />
that will mitigate risk; otherwise, do not consider<br />
secondary sources when making remedial decisions for<br />
the unit.<br />
D3a: If contaminants are found in the source zone, or if<br />
secondary sources are found, and are found to he<br />
migrating or may migrate from the source zone or from<br />
secondary sources at concentrations that may pOtentially<br />
result in a cumulative excess lifetime cancer risk greater<br />
than I x 10. 6 or a cumulative hazard index greater than I<br />
through use of contaminated media at downgradient<br />
points of exposure, and the concentrations of analytes are<br />
greater than those that are expected to occur naturally in<br />
the environment, then evaluate actions that will mitigate<br />
risk; otherwise, do not consider risk posed by migratory<br />
pathways when evaluating remedial alternatives for the<br />
unit (see D3b).<br />
Multimedia transport modeling indicates that<br />
contaminants may be released from soils at SWMU 091<br />
and result in risks to off"site residential groundwater users<br />
that exceed de minimis levels.<br />
The RI determined that contaminants are not migrating<br />
from SWMU 091 through the surface-water pathway at<br />
concentrations that would lead to risks that exceed de<br />
minimis levels.<br />
Transport modeling identified antimony as migrating offsite<br />
through groundwater at concentrations that lead to<br />
risks that exceed the de minimis levels.<br />
Risks posed by solvents (e.g.,. TCE) migrating from soil<br />
are not considered because they arc being addressed as<br />
part of the LASAGNAIM project.<br />
•<br />
ATL\9835000t t Sec73.doc<br />
Page 2 of 4<br />
•
• • •<br />
Table 7.2. WAG 27 SWMU 091-specific decision rules and conclusions<br />
---<br />
DECISION RULE CONCLUSION COMMENTS<br />
D3b: If wntaminarits are found in the source zone, or if Multimedia transport mmleling indicates that Transp(lrt modeling identified antimony as migrating -offsecondary<br />
sources are found, and if these contaminants contaminants mily be released from soil aI SWMU 091 site at concentrations that exceed MCLs.<br />
arc found to be migrating or may migrate from the source and result in concentrations in off-site groundwater that<br />
zone or from the secondary sources at concentrations that exceed MCLs. Concentrations of VOAs (e.g., TCE) migrating from soil<br />
exceed ARARs, then evaluate actions that will bring<br />
are not wnsidered because they are being addressed as<br />
migratory concentrations into compliance with ARAl'~s;<br />
part or the LASAGNAIM project.<br />
otherwise, do not consider ARARs when examining<br />
migratory pathways during the evaluation of remedial<br />
actions (see D3a).<br />
-- ----<br />
D4a: If Decision Rules D I a, D I b, D I c, D2a, D3a, or D3b<br />
indicate that remedial actions are needed, then evaluate<br />
response actions to mitigate risk in the source zone.<br />
(Refer to Sect. 5.11 and 5.12 of the WAG 27 Work Plan<br />
for discussions of the possible response actions.)<br />
Results for Decision Rules D I a, D I b, D I c, D3a, and D3b<br />
indiCate that response actions are needed. Evaluations of<br />
response actions to mitigate risk in the source woe may<br />
be appropriate.<br />
D5a: If contaminants in the source ione are found to Multimedia tra/lsport modeling to off-site locations was Multimedia transport modeling was completed using<br />
migrate to the RGA, then determine the contributions completed because contaminants were suspected to MEPAS. A more sophisticated modeling tool may he<br />
from the source zone to support future remedial actions migrate to the RGA. 1llis information will be cllllsidered appropriate when determining remedial actions for the<br />
for existing groundwater contamination in the when determining remedial actions for the groundwater groundwater operable unit.<br />
groundwater integrator unit; otherwise, do not determine<br />
contributions.<br />
operable unit at PGDP.<br />
Contamination with VOAs is being addressed as part of<br />
the LASAGNAIM project.<br />
D5b: If contaminants in the source zolle are foundio Transport modeling to the .Surface Water Integrator Unit<br />
migrate to the Surface Water Integrator Unit (i.e., Big and was not completed because results indicated that<br />
Little Bayou Creek and ditches discharging directly to contaminants were not migrating.<br />
regulated out falls), then determine the contributions from<br />
the source zone to support future remedial actions for past<br />
releases to the Surface Water Integrator Unit; otherwise,<br />
do not determine contributions.<br />
-- -- -<br />
_.-<br />
--<br />
ATLW8J50()()) t Scc7 _r.dllc Pagl! J of 4
Table 7.2. WAG 27 SWMU 091-specific decision rules and conclusions<br />
General Conclusions:<br />
I) Contamination is present in ditches at SWMlJ 091 at levels that may' lead' tn risks toilidustrial workers that<br />
exceed til' minimis levels. Ilowever, the contaminants in the ditches arc nntmigrating to thl! surfaCl! water<br />
integrator unit. Per Decision Rule D4a, response actions to mitigate the direct contact risks may he appropriate.<br />
2) Contamination is present in suhsurface soil at SWMll 091 lIt levels that may lead to risks to an unprotected<br />
excavation worker that exceed de minimis levels (under site-specific exposure parameters, risks were (Il' milJimis).<br />
Per Decision Rule D4a, response actions to mitigate the direct contact risks may he appropriate.<br />
3) Contamination is present in groundwater at SWMU 091 that may lead to.risks to industrial workers that exceed de<br />
minimis levels. Additionally, results indicate that contamination is present in soil at concentrations that will lead<br />
to continuing contamination of groundwater. Per Decision Rule D4a, response actions to mitigate direct contact<br />
risks through groundwater use and to address continued contaminant mignitioilto groul1dwater may he<br />
appropriate.<br />
4) Contaminants in subsurface soil have migrated to off-site locations through groundwater at concentrations that<br />
lead to risks that exceed de millimllJ levels. Per Decision Rule D4a, response actions to address migration from<br />
subsurface soil and secondary sources may be appropriate.<br />
• • •<br />
ATL\9835()()OII Sec7_Ldoc Page 4 of 4
• • •<br />
Table 7.3. WAG 27 SWMU 196~specific decision rules and conclusions<br />
DECISION RULE<br />
D I a: If the concentration of analytes found in the source<br />
zone may result in a cumulative excess lifetime cancer<br />
risk greater than I x 10. 6 or a cumulative hazard index<br />
greater than I through corHact with contaminated media,<br />
or if the concentration of analytes in the source zone may<br />
result in detrimental impacts to nonhuman receptors<br />
through contact with contaminated media as indicated by<br />
exceeding ecological screening criteria, and if the<br />
concentrations of analytes in the source zone are greater<br />
than those that are expected to occur naturally in the<br />
environment, then evaluate actions that will mitigate risk;<br />
otherwise pursue a "no funher action;' deCision (see D I b<br />
and Dlc).<br />
D I b:. If concentrations of analytes found in the source<br />
zone exceed applicable or relevant and appropriate<br />
requirements (ARARs), then evaluate actions that will<br />
bring contamination within the source zone into<br />
compliance with ARARs; otherwise, pursue a "no further<br />
action" decision (see Dla and Dlc).<br />
CONCLUSION<br />
Risks from direct contact with surface soil approach de<br />
minimis levels for industrial workers.<br />
Risks from direct contact with sediment exceed de<br />
milJimis levels tilr industrial workers.<br />
Risks to the excavation worker exposed to contaminated<br />
soBs ex
DECISION RULE<br />
Table 7.3. WAG 27 SWMU 196-specific decision rules and conclusions<br />
CONCLUSION<br />
COMMENTS<br />
01 c: If contaminants found at the site are known to<br />
transform or degrade into chemicals that could lead to<br />
increased risks to human health or the environment or<br />
into chemicals for which there are ARARs, and if the<br />
concentrations of these contaminants may result in risks<br />
greater than those defined in Dla or concentrations<br />
greater than ARARs, then evaluate actions that will<br />
mitigate potential future risk or promote compliance with<br />
ARARs; otherwise, pursue a "no further action" decision<br />
(see Dla and Dlb).<br />
D2a: If secondary souJces are found, and if the<br />
concentrations of analytes within the secondary sources<br />
are found to potentially result in a cumulative excess<br />
lifetime cancer risk greater than I x 10. 6 or a cumulative<br />
hazard index greater than I through contact with<br />
contaminated media at the unit. and if the concentrations<br />
of analytes are greater than those that are expected to<br />
occur naturally in the environment, then evaluate actions<br />
that will mitigate risk; otherwise, do not consider<br />
secondary sources when making remedial decisions for<br />
the unit.<br />
D3a: If contaminants are found in the source zone, or if<br />
secondary sources are found, and are found to be<br />
migrating or may migrate from the source zone or from<br />
secondary sources at concentrations that may potentially<br />
result in a cumulative excess lifetime cancer risk greater<br />
than I x 10- 6 or a cumulative hazard index greater than I<br />
through use of contaminated media at downgradient<br />
points of exposure, and the concentrations of analytes are<br />
greater than those that are expected to occur naturally in<br />
the environment, then evaluate actions that will mitigate<br />
risk; otherwise, do not consider risk posed by migratory<br />
pathways when evaluating remedial alternatives for the<br />
unit (see D3b).<br />
Contaminantsidentilied at the site are predominantly<br />
metals, which are not expected to degrade into more<br />
harmful products or into products with concentrations<br />
that exceed chemical-specific ARARs.<br />
Secondary sources were not found at SWM U .I 96.<br />
Multimedia transport modeling indicates that<br />
contaminants are not being released from soils at SWMU<br />
196 at rates that will result in risks to off-site residential<br />
groundwater users that exceed de minimis levels.<br />
Transport modeling indicates that contaminants are not<br />
being released from soils at SWMU 196 at rates that will<br />
result in risks that exceed de minimis levels for any<br />
receptor.<br />
ATL\983500011<br />
•<br />
Sec7_r.doc<br />
•<br />
Page 2 of 4
• • •<br />
Table 7.3. WAG 27 SWMU 196-specific decision rules and conclusions<br />
DECISION RULE<br />
D3h: If contaminants are found in the source zone, or if<br />
secondary sources are found, and if these contaminants<br />
are found to he migrating or may migrate from the source<br />
zone or from the secondary sources at concentrations that<br />
exceed ARARs, then evaluate actions that will hring<br />
migratory concentrations into compliance with ARARs;<br />
otherwise, do not consider ARARs when examining<br />
migratory pathways during the evaluation Of remedial<br />
actions (see D3a).<br />
D4a: If Decision Rules D I a, D I h, Die, D2a, D3a, or D3h<br />
indicate that remedial actions are needed, then evaluate<br />
response actions to mitigate risk in the source ·zone.<br />
(ReIer to Sect. 5.11 and 5.12 of the WAG 27 Work Plan<br />
for discussions of the possihle response actions.)<br />
D5a: If contaminants .in the source zone are found to<br />
migrate to the RGA, then determine the contributions<br />
from the source zone to support future remedial actions<br />
for existing groundwater contamination in the<br />
groundwater integrator unit; otherwise, do not determine<br />
contrihutions.<br />
D5b: If contaminants in the source zone are found to<br />
migrate to the Surface Water IntegratorUnit (i.e., Big and<br />
Lillie Bayou Creek and ditches discharging directly to<br />
regulated outfalls), then determine the contributions from<br />
the source zone to slipport future remedial actions for past<br />
releases to the Surface Water Integrator Unit; otherwise,<br />
do not determine contributions.<br />
CONCLUSION<br />
Multimedia transport modeling indicates thai<br />
contaminants are not being released from soils at SWMU<br />
196 at rates that will result in groundwater or surface<br />
water concentrations greater than chemical-specific<br />
ARARs.<br />
Results for Decision Rille DI a indicate that response<br />
aclions arc needed. Evahmtions of response actions to<br />
mitigate risk in Ihe source zone may be appropriate.<br />
Multimedia transport modeling to off-site locations was<br />
completed hecause contaminants were suspected to<br />
migrate to the RGA. This information will he considered<br />
when determining remedial actions for the groundwater<br />
operahle unit at PGDP.<br />
Multimedia transport modeling to oil-site locations was<br />
completed hecause contaminants were suspected 10<br />
migrate to the surface water integrator unit. This<br />
information will he considered when determining<br />
remedial actions for the surface water operahle unit at<br />
PGDP.<br />
COMMENTS<br />
Multimedia transport modeling was completed using<br />
MEPAS. A more sophisticated modeling tool may he<br />
appropriate when determining remedial actions for the<br />
groum:lwater operahle unit.<br />
Multimedia IransjlOrt modeling was completed IIsing<br />
MUSLE. A more sophisticated modeling tool may he<br />
appropriate when determining remedial actions for the<br />
surface water operahle unit.<br />
A TL\983:'i()()() II Sed _r.doc<br />
Pagl! 3 or 4
Tahle 7.3. WAG 27 SWMU 196-specific decision rules and conclusions<br />
General Condusions:<br />
I) Contamination is present in diidles and surface soil ai SWMU 196 at levels that may lead to risks to industrial<br />
workers that exceed de millimi.f levels. However. the contaminants in the ditches are not migrating to th
• • •<br />
Table 7.4. WAG 27 C-720 Complex-specific decision rules and conclusions<br />
DECISION RULE<br />
D I a: If the concentration of analytes found in the source<br />
zone may result in a cumulative excess lifetirne cancer<br />
risk greater than I x 10. 6 or a cumulative hazard index<br />
greater than I through contact with contaminated media,<br />
or if the concentration of analytes in the source zone may<br />
result in detrimental impacts to nonhuman receptors<br />
through contact with contaminated media as indicated by<br />
exceeding ecological screening criteria, and if the<br />
concentrations of analytes in the source zone are greater<br />
than those that are expected to occur naturally in the<br />
environment, then evaluate actions that will mitigate risk;<br />
otherwise pursue a "no further aCtion" decision (sec D I h<br />
andDlc).<br />
Dlb: If concentrations of analytes found in the source<br />
zone exceed applicable or relevant and appropriate<br />
requirements (ARARs), then evaluate actions that will<br />
bring contamination within the source zone into<br />
compliance with ARARs; otherwise, pur~ue a "no further<br />
action"decision (see Dla and Die).<br />
Die: If contaminants found at the site are known to<br />
transform or degrade into chemicals that could lead to<br />
increased risks to human health or the environment or<br />
illto chemicals for which there are ARARs, and if the<br />
concentrations of these contaminallts may result in risks<br />
greater than those defined in D I a or concentrations<br />
greater than ARARs, then evaluate actions that will<br />
mitigate potential future risk or promote compliance with<br />
ARARs; otherwise, pursue a "no further action" decision<br />
(see DI a and D I b).<br />
CONCLUSION<br />
Risks to the excavation worker exposed to contaminated<br />
soils exceed de minimis levels (cancer risk only).<br />
Risks from potential use of the RGA as a drinking water<br />
source at Ihe SWMU exceed de minimis levels for the<br />
industrial worker.<br />
Contaminant concentrations in RGA groundwater exceed<br />
MCLs for some contaminants.<br />
Some contaminants present in groundwater may<br />
transform or degrade to more toxic substances that lead to<br />
increased risk at concentrations that exceed ARARs.<br />
COMMENTS<br />
No surface soils or sediments are present at the C-720<br />
Complex.<br />
Cancer risks were greater than de /III/WillS for the<br />
excavation worker when default exposure parameters<br />
were used. When the assessment was performed using<br />
site-specific exposure parameters, the systemic toxicity<br />
risk remained tie /IIinimis and the cancer risk was 4 x 10. 5 .<br />
Groundwater drawn from the RGA below the plant is nllt<br />
currently used at PGDP.<br />
Migration of contaminants from soil to groundwater and<br />
surface water is discussed under Decision Rules D3a and<br />
D3b, respectively.<br />
No surface soils or sediments arc present at the C-720<br />
Complex.<br />
No chemical,specific ARARs arc available for screening<br />
contaminant concentrations in soil.<br />
Migration of contaminants from soil to groundwater and<br />
sllrface water is disclIssed under Decision Rules D3a arid<br />
D3b, respectively.<br />
No risk from direct contact was identified.<br />
ATL\983500011 Sec7_r.doc<br />
Page I of 4
Table 7.4. WAG 27 C-720 Complex-specific decision rules and conclusions<br />
DECISION RULE<br />
02a: If secondary sources are found, and if the<br />
concentrations of analytes within the secondary sources<br />
are found to potentialiy result in a cumulative excess<br />
lifetime cancer risk greater than I x 10. 6 ora cumulative<br />
hazard index greater than I through contact with<br />
contaminated media at the unit, and if the concentrations<br />
of analytes are greater than those that are expected to<br />
occur naturally in the environment, then evaluate actions<br />
that will mitigate risk; otherwise. do not consider<br />
secondary sources when making remedial decisions for<br />
the unit.<br />
03a: If contaminants are found in the source zone, or if<br />
secondary sources are found, and .lre found 10 be<br />
migrating or may migrate from the source zone or from<br />
secondary sources aI concentrations that may potentially<br />
result in a cumulative excess lifetime cancer risk greater<br />
than I x 10. 6 or a cumulative hazard index greater than I<br />
through use of contaminaled media at downgradient<br />
points of exposure, and the concentrations of analytes are<br />
greater than those that are expected to occur naturally in<br />
Ihe environment, then evaluate actions that will mitigate<br />
risk; otherwise, do not consider risk posed by migratory<br />
pathways when evaluating remedial alternatives for the<br />
unit (see 03b).<br />
03b: If conlaminanls are found in the source .zone, or if<br />
secondary sources are found, and if these contaminanlS<br />
are found to be migrating or may migrate from the source<br />
zone or from the secondary sources at concentrations that<br />
exceed ARARs. then evaluate actions that will bring<br />
migratory concentrations into compliance with ARARs;<br />
otllerwise, do not consider ARARs when examining<br />
migratory pathways during the evaluation of remedial<br />
actions (see 03a).<br />
CONCLUSION<br />
Secondary sources were not identi lied at the c-no<br />
Complex.<br />
Multimedia transport modeling indicates ihat<br />
conlaminants may be released from soil at the c-no<br />
Complex and result in risks to off-site residential<br />
groundwater users that exceed de minimis levels.<br />
Multimedia transport modeling indicales that<br />
contaminants may be released from soil at the c-no<br />
Complex and result in concentrations in ofl~site<br />
groundwater that exceed MCLs.<br />
COMMENTS<br />
Tnlnsport modeling identilied antimony, trans-I,2-DCE,<br />
TCE, and vinyl chloride as migrating off-site through<br />
groundwater at concentrations that lead to risks that<br />
exceed de millimis levels.<br />
The lack of surface soil precludes contaminant transport<br />
to the surface water integrator unit.<br />
ARARs for TCE and hreakdown products in groundwater<br />
arc exceeded and these compounds may migrate off-site.<br />
The lack of surface soil precludes contaminant transport<br />
to the surface waterintegrator unit.<br />
A TL\9835000 II Sec7 _r.doc<br />
Page 2 of 4<br />
•
• • •<br />
~,<br />
Table 7.4. WAG 27 C-720 Complex-specific decision rules and conclusions<br />
DECISION RULE CONCLUSION COMMENTS<br />
04a: If Oecision Rules 0 I a, 0 I b, 0 I c, 02a, 03a, or 03h Resulls for Decision Rules Ola, Olb, Olc, ma, and 03h<br />
indicate that remedial actions are needed, then evaluate indicate that response actions are needed. Evaluations of<br />
response actions to mitigate risk in the source zone. response actions to mitigate risk in the source ZOIle may<br />
(Refer to Sect. 5.11 and 5.12 of the WAG 27 Work Plan he appropriate.<br />
for discussions of the possihle response actions.)<br />
05a: If contaminants in the source zone arefiiund 'to Multimedia transport modeling to off-site locations was Multimedia transport modeling was completed using<br />
migrate to the RGA, then determine the contributions completed hecause contaminants were suspected to MEPAS. A more sophisticated modeling tool may be<br />
from the source zone to support future remedial actions migrate to the RGA. This information will he considered appropriate when determining remedial actions for the<br />
for existing groundwater contamination in the when determining remedial actions for the groundwater groundwater operahle unit.<br />
groundwater integrator unit; otherwise, do not determine operahle unit at PGOP.<br />
contrihutions.<br />
D5b: If contaminants in the source zone are found to<br />
migrate to the Surface Water Integrator Unit (i.e., Big and<br />
LiuleBayou Creek and ditches discharging directly to<br />
regulated outfalls), then determine the contributions from<br />
the source zone to support future remedial actions for past<br />
releases to the Surface Water Integrator Unit; otherwise,<br />
do not determine contributions.<br />
Transport modeling to the Surface Water Integrator Unit<br />
was not completed hecause surface soil is not present.<br />
.'<br />
A TL\,)83,~()()() II Sec? _r,doc i'age 3 of 4
Table7.4. WAG 27 C·720 Complex-specific decision rules and conclusions<br />
General Conclusions:<br />
I) Contamination is present in subsurface soil at the C-72rfConiplex at levels -thai may lead to risks to an<br />
unprotected excavation worker that exceed de lIIillil/l;.~ levels. Per Decision Rule 04a, response actions to mitigate<br />
the direct contact risks may be appropriate.<br />
2) Contamination is present in groundwater at the c-no Complex that may lead to risks to industrial workers tliat<br />
exceed de lIIillilllis levels. Additionally, results indicate that contamination is present in soil at concentrations<br />
that will lead to continuing contamination of groundwater. Per Decision Rule D4a, response actions to mitigate<br />
direct contact risks through groundwater use and to address continued contaminant migration to groundwater may<br />
be appropriate.<br />
]) Contaminants in subsurface s(iil have migrated to off-site locations through groundwater at concentrations that<br />
lead to risks that exceed de 111;11;111115 levels. Per Decision Rule D4a, response actions to address migration from<br />
subsurface soil and secondary sources may be appropriate.<br />
ATL\98ViO(){)tt Scc7 ~r.d()c Page .. "f ..
•<br />
8~O REFERENCES<br />
Birge, W J., T.M. Short and J.R. Lauth. 1990. Biological Monitoring Program for the <strong>Paducah</strong><br />
<strong>Gaseous</strong> Diffusion Plant, Three-Year Draft Report. Prepared by the University of Kentucky at<br />
Lexington. Prepared for;the Environmental Sciences Division, Oak Ridge National Laboratory,<br />
OakRidge, Tennessee.<br />
CDM Federal (CDM Federal Programs 'Corporation). 1992. Remedial Investigation of the<br />
Underground Storage Tanks at the C-200, C-7JO, and C-750 Buildings, <strong>Paducah</strong> <strong>Gaseous</strong><br />
Diffusion Plant, <strong>Paducah</strong>, Kentucky. Prepared for Martin Marietta Energy Systems, Inc.<br />
CDM Federal. 1994. Investigation of Sensitive Ecological Resources Inside the <strong>Paducah</strong> <strong>Gaseous</strong><br />
Diffusion Plant,<br />
CH2MHILL. 199,1. Results of the Site Investigation, Phase I, at the <strong>Paducah</strong> <strong>Gaseous</strong> Diffusion<br />
Plant, <strong>Paducah</strong>, Kentucky, KYIER-4, March.<br />
CH2M HILL. 1992. Results o/the Site Investigation, Phase II, at the <strong>Paducah</strong> <strong>Gaseous</strong> Diffusion<br />
Plant, <strong>Paducah</strong>, Kentucky, KY/SUB/BB-97777C P-031199111, April.<br />
Clausen, J. L, K. R. Davis, J. W. Douthitt, and B. E. Phillips. 1992a. <strong>Paducah</strong> <strong>Gaseous</strong> Diffusion<br />
Plant Groundwater Protection Program Plan, KYIER-2, Rev. 1, January, Hydrogeological<br />
Services Section, Environmental Restoration Division, <strong>Paducah</strong> <strong>Gaseous</strong> Diffusion Plant,<br />
<strong>Paducah</strong>~ Kentucky.<br />
Clausen, J. L., J. W. Douthitt, K. R. Davis, and B. E. Phillips. 1992b. Report of the <strong>Paducah</strong><br />
<strong>Gaseous</strong> Diffusion Plant Groundwater Investigation Phase Ill, KYIE-150, November,<br />
Hydrogeological' Services Section, Environmental Restoration Division, <strong>Paducah</strong> <strong>Gaseous</strong><br />
Diffusion Plant, <strong>Paducah</strong>, Kentucky.<br />
Clausen. J. L. 1996. Modeling of Soil and ContaminantsJrom the C-750-A&B UndergroundStorage<br />
Tanks Using SESOIL, <strong>Paducah</strong>, Kentucky. KYIEM-158, May.<br />
COE (United States Army Corps of Engineers). 1994. Environmental Investigations at the <strong>Paducah</strong><br />
<strong>Gaseous</strong> Diffusion Plant and Surrounding Area, McCracken CoUnty, Kentucky.<br />
Davis, R.W., T.W. Lambert and AJ. Hansen, Jr. 1973~ Subsurface Geology and Groundwater<br />
Resources of the Jackson Purchase Region, Kentucky. U.S. Geological Survey Water Supply<br />
Paper No; 1987.<br />
DGE ~nitedStates Department ofEner~). 1982. Environmental Measurements Laboratory<br />
Procedures Manual, HASL-300,.25 Edition.<br />
•<br />
DOE. 1993. Management Strategy for the Surface Water Integrator Unit at the <strong>Paducah</strong> <strong>Gaseous</strong><br />
Diffusion Plant, DOFJORl07-1,130&Dl, April.<br />
DOE. 1994. Baseline Risk Assessment and Technical Investigation Report for the Northwest<br />
Dissolved Phase Plume, <strong>Paducah</strong> <strong>Gaseous</strong> Diffusion Plant, DOFJORl07-1286&Dl, July.<br />
ATL\983500012 Sec8_r.doc 8-1
8·2<br />
DOE. 1995 .. Project Plan for the Background Soils Project for the <strong>Paducah</strong> <strong>Gaseous</strong> Diffusion<br />
Plant, <strong>Paducah</strong>, Kentucky. DOFJORl07-1414&Dl, September.<br />
DOE. 1996a. Phase I: <strong>Paducah</strong> <strong>Gaseous</strong> Diffusion Plant Waste Area Group 6 Industrial<br />
Hydrogeologic Study, DOFJORl07-1478&Dl, Oak Ridge National Laboratory, Grand Junction,<br />
CO and Lockheed Martin Energy Systems, Kevil, Kentucky.<br />
•<br />
DOE. 1996b. Feasibility Study for Waste Area Group 23 and Solid Waste Management Unit 1 of<br />
Waste Area Group 27 at the <strong>Paducah</strong> <strong>Gaseous</strong> Diffusion Plant, <strong>Paducah</strong>, Kentllcky,<br />
DOFJORl06-1423&D2, JacobsER Team, Kevil, Kentucky.<br />
DOE. 1996c. Final Reportfor WAG 15, C-200-A USTandC-7JO-B UST <strong>Paducah</strong> <strong>Gaseous</strong> Diffusion<br />
Plant, <strong>Paducah</strong>, Kentucky, DOFJORl07-1540&DI.<br />
DOE. 1996d. Methods for Conducting Human Health Risk Assessments and Risk Evaluations at the<br />
<strong>Paducah</strong> <strong>Gaseous</strong> Diffusion Plant, DOFJORl07-1506&Dl, August.<br />
DOE. 1997. Background Levels of Selected Radionuclides and Metals in Soils and Geologic Media<br />
at the <strong>Paducah</strong> <strong>Gaseous</strong> Diffusion Plant, <strong>Paducah</strong>, Kentucky. DOFJORl07-1586&D2, June.<br />
DOE. 1998a. WAG 6 Remedial Investigation DI, <strong>Paducah</strong> <strong>Gaseous</strong> Diffusion Plant, <strong>Paducah</strong><br />
Kentucky. DOFlORl07-1727Nl&Dl, August.<br />
DOE. 1998b. Site Management Plan, <strong>Paducah</strong> <strong>Gaseous</strong> Diffusion Plant, <strong>Paducah</strong>, KY,<br />
DOElORl07-1207 &D3.<br />
EDGe (Engineering, Design, & Geosciences Group, Inc). 1989. Groundwater Monitoring/Phase II:<br />
Pr:eliminary Hydr:ogeological Characterization of the Department of Energy Reservation and<br />
the C-404 Post Closure Compliance Program, ESO 16749, Repon 08-38-910819003,<br />
ERC Environmental and Energy Service Company, Nashville, Tennessee.<br />
ENSAFE and CH2M Hll..L. 1998. Integrated RI/FS Work Plan for WAG 27, <strong>Paducah</strong> <strong>Gaseous</strong><br />
Diffusion Plant, <strong>Paducah</strong>, Kentucky. DOElORl07-1518&D3, March.<br />
EPA (United States Environmental Protection Agency). 1980~ Prescribed Procedures for<br />
Measurement of Radioactivity in Drinking Water, EPA-600/4-80-032, August.<br />
EPA. 1984. Radiochemistry Procedures Manual, EPA 520/5-84-006, August, Eastern<br />
Environmental Radiation Facility, Montgomery, Alabama.<br />
EPA. 1986. Test Methodsfor Evaluating Solid Waste, PhysicaVChemical Methods. SW-846. Third<br />
Edition, November.<br />
EPA. 1991. Groundwater Issue: Dense Non-aqueous Phase Liquids. Office of Research and<br />
Development, and Office of Solid Waste and Emergency Response. EPN540/4-9 1-002.<br />
March.<br />
EPA. 1996. Standard Operating Procedures and Quality Assurance Manual. Region IV<br />
Environmental Sciences Division, Athens, Georgia, February.<br />
A TL\9835000 12 Sec8_r.doc
•<br />
8-3<br />
Finch, W. 1. 1'967. Geologic Map of Part of the Joppa Quadrangle, McCracken County, Kentucky.<br />
GQ-562, U.S. Department Interior; U.S. Geological Survey.<br />
Frye, J. C., etal,. l i 972. Geology and Paleontology of Late Pleistocene Lake Saline, Southeastern<br />
Illinois. Circular 471, Dlinois State Geological Survey.<br />
Gamer, L. K., E. E. Morti, and D. R. Smuin. 1995. Northeast Plume Preliminary Characterization<br />
Summary Report. OOElORl07-1339&D2, KYIER-65&D2; Environmental Management and<br />
Enrichment Facilities, <strong>Paducah</strong>, <strong>Gaseous</strong> Diffusion Plant, <strong>Paducah</strong>, Kentucky, July.<br />
GeoTrans, Inc. 1992. Groundwater Modeling and Offsite Containment Evaluation at the <strong>Paducah</strong><br />
<strong>Gaseous</strong> Diffusion Plant. GeoTrans Project No. 6506-003. Prepared for Martin Marietta<br />
Energy Systems, Inc., <strong>Paducah</strong> <strong>Gaseous</strong> Diffusion, Plant, December.<br />
Hem, J JO. 1992. Study and Interpretation of the Chemical Characteristics of Natural Water. 3 n1 ed.,<br />
USGS Water Supply Paper 2254.<br />
•<br />
Hutcheson, D,F., Jr. 1993. Characterization of the C-720White Room Sump, Request No. 92-23.<br />
Internal Correspondence.to OM. Ulrich. Martin Marietta Energy Systems, Inc. (now Lockheed<br />
Martin Energy Systems, Inc.). May .<br />
Jacobs (Jacobs Engineering, Inc.). 1995. Functions and Values Analysis for the Drainage Area<br />
South of Solid Waste Management Units 2 and 3 of Waste Area Group 22 at the <strong>Paducah</strong><br />
<strong>Gaseous</strong> Diffusion Plant, <strong>Paducah</strong>, Kentucky, JElPAD/95-0237, August.<br />
LMES. 1997. Integrated Remedial Investigation/Feasibility Study Work Plan for Work Area<br />
Grouping 6at <strong>Paducah</strong> <strong>Gaseous</strong> Diffusion Plant, <strong>Paducah</strong>, Kentucky. DOElORl07-1234&D4,<br />
January.<br />
Miller, G. R., and J. Douthitt. 1,993. Groundwater Protection Program, <strong>Paducah</strong> <strong>Gaseous</strong> Diffusion<br />
Plant, <strong>Paducah</strong>, Kentucky, KYlER-3D, May, Prepared by Science Applications International<br />
Corporation. Prepared for United States Department of Energy.<br />
Oakes, T.W., D.L. Ashburn and F.M. O'Hara. 1987. Environmental Surveillance of the U.S.<br />
Department of Energy <strong>Paducah</strong> <strong>Gaseous</strong> Diffusion Plant. ESIESH-IN3, April.<br />
Olive, W. W. 1980. Geologic Maps of the Jackson Purchase Region, Kentucky. U.S. Department<br />
Interior, U.S. Geological Survey.<br />
Pree, H.L., Jr., W.H. Walker, and L:M. MacCary. 1957. Geology and Groundwater Resources of the<br />
<strong>Paducah</strong> Area. Water-Supply Paper 1417.<br />
•<br />
SAlC (Science Applications International Corporation). 1998. Remedial .Investigation Report for<br />
Solid Waste Management Units 7 and 30 of Waste Area Grouping 22 at <strong>Paducah</strong> <strong>Gaseous</strong><br />
Diffusion Plant, <strong>Paducah</strong>, Kentucky. DOElORl07-1604Nl&D2, January .<br />
ATL\983500012 Sec8_r.doc
8-4' .<br />
SimmoI1~Engineering. 1994. Clean Closure Certification for C-720 Trichloroethylene Vapor<br />
Degrf!aser Tank and Associated Units. Prepared for Martin Marietta Energy Systems, Inc. (now<br />
Lockheed Martin Em:rgy,Systems, Inc.). March.<br />
,<br />
TcT-St. Louis. 199,1. Final Project Report of the Phase 1 Contamination Evaluation at Former<br />
Kentucky Ordnance WorkS, McCracken CoUnty, Kentucky.<br />
•<br />
USBA (UnitedSUl.tes Departme~! 'of Agricul~).~J976. Soil Surviy of Ballard and McCracken<br />
Counties, Kentucky. Prepared by the USDA Soil, Conservation Service in cooperation with the<br />
Kentucky Agricultural Experiment Station,February.<br />
W~li~,En~~rihg. 198i. ,,' Hydroge~Jqgic }nvestigation-~isting Sanitary Landfill Closure,<br />
Unlon'Catbipe Corp,;(Jration, GaseoUs Diffusion Plant,' <strong>Paducah</strong>, Kentucky. WE Project No.<br />
02340166, Wehran Bnginemng.Corporation, Middletown, NY.<br />
•<br />
ATL\983500012 Sec8_r.doc