Feasibility Study of Island Development at the ... - Canal de Panamá
Feasibility Study of Island Development at the ... - Canal de Panamá
Feasibility Study of Island Development at the ... - Canal de Panamá

Create successful ePaper yourself
Turn your PDF publications into a flip-book with our unique Google optimized e-Paper software.
CONTRACT CC-3-557<br />
Architectural and Engineering Services for<br />
Engineering Site and Assessment, Conceptual<br />
Design and Rel<strong>at</strong>ed Services<br />
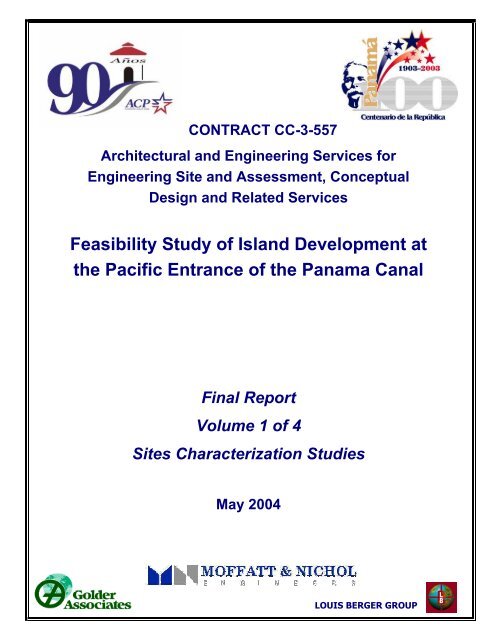
<strong>Feasibility</strong> <strong>Study</strong> <strong>of</strong> <strong>Island</strong> <strong>Development</strong> <strong>at</strong><br />
<strong>the</strong> Pacific Entrance <strong>of</strong> <strong>the</strong> Panama <strong>Canal</strong><br />
Final Report<br />
Volume 1 <strong>of</strong> 4<br />
Sites Characteriz<strong>at</strong>ion Studies<br />
May 2004<br />
LOUIS BERGER GROUP
CONTENTS<br />
1 Introduction..............................................................................................................1-1<br />
2 Background..............................................................................................................2-1<br />
2.1 M<strong>at</strong>erials Disposal Sites Screening Process ......................................................2-1<br />
2.2 Results <strong>of</strong> <strong>the</strong> Evalu<strong>at</strong>ion ....................................................................................2-4<br />
3 M<strong>at</strong>erials Characteristics ........................................................................................3-1<br />
3.1 Excav<strong>at</strong>ion Quantities.........................................................................................3-1<br />
3.2 M<strong>at</strong>erials Classific<strong>at</strong>ion.......................................................................................3-3<br />
3.2.1 Introduction....................................................................................................3-3<br />
3.2.2 Source Inform<strong>at</strong>ion ........................................................................................3-3<br />
3.2.3 Methodology..................................................................................................3-4<br />
3.2.4 Geology .........................................................................................................3-4<br />
3.2.5 Overbur<strong>de</strong>n....................................................................................................3-7<br />
3.2.6 M<strong>at</strong>erial Suitability for Construction Elements .............................................3-11<br />
3.3 M<strong>at</strong>erials Volumes ............................................................................................3-14<br />
3.4 Bulking and Shrinkage Factors.........................................................................3-15<br />
3.5 Excav<strong>at</strong>ion Program .........................................................................................3-15<br />
4 Site Characteriz<strong>at</strong>ion Studies .................................................................................4-1<br />
4.1 B<strong>at</strong>hymetry..........................................................................................................4-1<br />
4.1.1 Inshore B<strong>at</strong>hymetric Surveys.........................................................................4-2<br />
4.2 Topography.........................................................................................................4-6<br />
4.3 Geophysical........................................................................................................4-8<br />
4.3.1 Introduction....................................................................................................4-8<br />
4.3.2 Survey Objectives........................................................................................4-10<br />
4.3.3 Field Oper<strong>at</strong>ions & Instrument<strong>at</strong>ion.............................................................4-10<br />
4.3.4 Geophysical Interpret<strong>at</strong>ion <strong>of</strong> Results..........................................................4-12<br />
4.3.5 Summary & Conclusions .............................................................................4-16<br />
4.4 Geotechnical Studies........................................................................................4-17<br />
4.4.1 Marine..........................................................................................................4-17<br />
4.4.2 Landsi<strong>de</strong> Geotechnical Conditions..............................................................4-19<br />
4.5 Wind D<strong>at</strong>a.........................................................................................................4-24<br />
4.6 Ti<strong>de</strong>s & Currents...............................................................................................4-27<br />
4.6.1 Ti<strong>de</strong>s............................................................................................................4-27<br />
4.6.2 Currents.......................................................................................................4-29<br />
4.6.3 W<strong>at</strong>er Level Observ<strong>at</strong>ions ...........................................................................4-38<br />
4.6.4 Current Measurements................................................................................4-39<br />
5 Environmental Characteriz<strong>at</strong>ion.............................................................................5-1<br />
Final Report i May 2004
5.1 Background.........................................................................................................5-1<br />
5.2 Environmental Field Investig<strong>at</strong>ions .....................................................................5-1<br />
5.2.1 W<strong>at</strong>er Quality and Marine D<strong>at</strong>a Collection ....................................................5-1<br />
5.2.2 Marine Habit<strong>at</strong> Evalu<strong>at</strong>ion .............................................................................5-2<br />
5.3 General Characteriz<strong>at</strong>ion <strong>of</strong> Panama Bay ..........................................................5-5<br />
5.4 W<strong>at</strong>er Quality and Marine D<strong>at</strong>a Studies .............................................................5-7<br />
5.4.1 W<strong>at</strong>er Quality Sampling.................................................................................5-7<br />
5.4.2 Zooplankton.................................................................................................5-10<br />
5.4.3 Phytoplankton..............................................................................................5-15<br />
5.4.4 Benthos .......................................................................................................5-16<br />
5.5 Marine Habit<strong>at</strong> Evalu<strong>at</strong>ion.................................................................................5-20<br />
5.6 Area Fisheries...................................................................................................5-21<br />
6 Regional Archaeological Setting............................................................................6-1<br />
6.1 Background.........................................................................................................6-1<br />
6.2 Sites <strong>of</strong> Interest in <strong>the</strong> <strong>Study</strong> Area ......................................................................6-2<br />
6.3 Summary ............................................................................................................6-3<br />
7 Meteorological & Oceanographic Studies.............................................................7-1<br />
7.1 Pacific Ocean Wave Studies ..............................................................................7-1<br />
7.2 Wave Transform<strong>at</strong>ion Analysis ...........................................................................7-9<br />
7.2.1 Methodology..................................................................................................7-9<br />
7.2.2 B<strong>at</strong>hymetry ..................................................................................................7-10<br />
7.2.3 Mo<strong>de</strong>ling Approach......................................................................................7-12<br />
7.2.4 Mo<strong>de</strong>led Wave Conditions...........................................................................7-12<br />
7.2.5 Mo<strong>de</strong>ling Region..........................................................................................7-12<br />
7.2.6 Mo<strong>de</strong>l Results & Discussion........................................................................7-16<br />
7.3 Locally-Gener<strong>at</strong>ed Waves ................................................................................7-16<br />
7.3.1 Fetch Direction and Distance ......................................................................7-16<br />
7.3.2 Wind Speed and Direction...........................................................................7-18<br />
7.3.3 Wave Hindcast Comput<strong>at</strong>ions .....................................................................7-20<br />
7.4 Conclusions ......................................................................................................7-21<br />
8 Hydrodynamic Mo<strong>de</strong>ling .........................................................................................8-1<br />
8.1 Numerical Mo<strong>de</strong>l Description..............................................................................8-1<br />
8.2 Hydrographic D<strong>at</strong>a..............................................................................................8-2<br />
8.2.1 B<strong>at</strong>hymetry ....................................................................................................8-2<br />
8.2.2 Tidal Boundary ..............................................................................................8-2<br />
8.3 Regional Mo<strong>de</strong>l...................................................................................................8-3<br />
8.3.1 Mo<strong>de</strong>l Grid and B<strong>at</strong>hymetry...........................................................................8-3<br />
8.3.2 Boundary Conditions .....................................................................................8-3<br />
8.3.3 Regional Mo<strong>de</strong>l Verific<strong>at</strong>ion...........................................................................8-7<br />
8.4 Local Mo<strong>de</strong>l ......................................................................................................8-10<br />
Final Report ii May 2004
8.4.1 Boundary Conditions ...................................................................................8-13<br />
8.4.2 Wind Forcing ...............................................................................................8-13<br />
8.4.3 Local Mo<strong>de</strong>l verific<strong>at</strong>ion – Existing conditions .............................................8-13<br />
8.5 Currents............................................................................................................8-16<br />
9 Socio Economic Background.................................................................................9-1<br />
9.1 Introduction.........................................................................................................9-1<br />
9.2 Methodology .......................................................................................................9-1<br />
9.3 Community Characteriz<strong>at</strong>ion and Baseline Conditions.......................................9-3<br />
9.1.1 Taboga <strong>Island</strong>................................................................................................9-3<br />
9.1.2 Amador Causeway ........................................................................................9-8<br />
9.1.3 Bique Beach ................................................................................................9-10<br />
9.1.4 Vacamonte City ...........................................................................................9-13<br />
9.1.5 Port <strong>of</strong> Vacamonte.......................................................................................9-15<br />
9.1.6 Veracruz Community...................................................................................9-16<br />
Final Report iii May 2004
--- THIS PAGE INTENTIONALLY BLANK ---<br />
Final Report iv May 2004
LIST OF TABLES<br />
Table 2-1: List <strong>of</strong> Sites un<strong>de</strong>r Consi<strong>de</strong>r<strong>at</strong>ion for Pacific Si<strong>de</strong> Locks Project ....................2-4<br />
Table 2-2: Estim<strong>at</strong>ed Costs <strong>of</strong> Transport <strong>of</strong> Excav<strong>at</strong>ed M<strong>at</strong>erials to Candid<strong>at</strong>e Sites for<br />
Locks Project .............................................................................................................2-5<br />
Table 3-1: Characteristics <strong>of</strong> M<strong>at</strong>erials in <strong>the</strong> Excav<strong>at</strong>ion Area........................................3-9<br />
Table 3-2: Suitability <strong>of</strong> Excav<strong>at</strong>ed M<strong>at</strong>erials for <strong>Island</strong> Construction ............................3-11<br />
Table 3-3: Estim<strong>at</strong>ed Volumes <strong>of</strong> Primary Excav<strong>at</strong>ion M<strong>at</strong>erials C<strong>at</strong>egories .................3-15<br />
Table 4-1: Summary Results <strong>of</strong> In<strong>de</strong>x Tests – Boring RTP-6 ........................................4-19<br />
Table 4-2: Summary Results <strong>of</strong> <strong>the</strong> Point Load Strength In<strong>de</strong>x <strong>of</strong> Rock – Boring RTP-1 ..4-<br />
20<br />
Table 4-3: Summary Results <strong>of</strong> In<strong>de</strong>x Tests – All Pit Loc<strong>at</strong>ions ....................................4-21<br />
Table 4-4: Average Wind speed & direction <strong>at</strong> Balboa FAA ..........................................4-24<br />
Table 4-5: Average Wind speed & direction <strong>at</strong> Howard Air Force Base ........................4-25<br />
Table 4-6: NOAA Tidal Prediction St<strong>at</strong>ions in Panama Bay...........................................4-38<br />
Table 4-7: W<strong>at</strong>er level st<strong>at</strong>ions.......................................................................................4-38<br />
Table 4-8: ACP Current Measurement Campaign, (2002).............................................4-39<br />
Table 5-1:: Area and d<strong>at</strong>e <strong>of</strong> d<strong>at</strong>a collection <strong>of</strong> <strong>the</strong> first study. .........................................5-4<br />
Table 5-2: Area and coordin<strong>at</strong>es <strong>of</strong> d<strong>at</strong>a collection for <strong>the</strong> second study ........................5-4<br />
Table 5-3: Physical-Chemical Parameters <strong>at</strong> <strong>the</strong> D<strong>at</strong>a Collection Sites. .........................5-8<br />
Table 5-4: Physical-Chemical Parameters <strong>at</strong> <strong>the</strong> D<strong>at</strong>a Collection Sites. .........................5-9<br />
Table 5-5: Density <strong>of</strong> Organisms (org/m 3 ) N=1 ..............................................................5-10<br />
Table 5-6: Biomass Values for Diurnal and Nocturnal Collections.................................5-12<br />
Table 5-7: Properties <strong>of</strong> Planktonic Organisms (org/m 3 ) N=3 ........................................5-13<br />
Table 5-8: Number <strong>of</strong> Species Collected in Summer (January-February) and Winter<br />
(June-August) <strong>at</strong> Common Sampling Sites..............................................................5-16<br />
Table 5-9: List and abundance <strong>of</strong> <strong>the</strong> macr<strong>of</strong>auna collected <strong>at</strong> <strong>the</strong> 11 st<strong>at</strong>ions inclu<strong>de</strong>d in<br />
this study..................................................................................................................5-19<br />
Table 7-1: Astronomical Ti<strong>de</strong> Level Characteristics within <strong>the</strong> Gulf <strong>of</strong> Panama...............7-8<br />
Table 7-2: Return Periods and Wave Heights..................................................................7-9<br />
Final Report v May 2004
Table 7-3: Grid size used for Wave Mo<strong>de</strong>l runs.............................................................7-15<br />
Table 7-4: Balboa FAA Hourly Average Wind D<strong>at</strong>a 1985-2001 .....................................7-19<br />
Table 7-5: Locally-gener<strong>at</strong>ed Significant Wave Heights (m), Maximum Wave Heights<br />
(H 2% ), and Peak Spectral Wave Periods (sec).........................................................7-21<br />
Table 9-1: Popul<strong>at</strong>ion & Housing in Taboga <strong>Island</strong> (1980 – 2000) ..................................9-6<br />
Table 9-2: Socio-Demographic Indic<strong>at</strong>ors in Taboga <strong>Island</strong> (2000).................................9-6<br />
Table 9-3: Socio-Demographic Indic<strong>at</strong>ors in Bique Beach (2000) .................................9-11<br />
Table 9-4: Socio-Demographic Indic<strong>at</strong>ors in Vacamonte City (2000) ............................9-14<br />
Table 9-5: Popul<strong>at</strong>ion and Housing in <strong>the</strong> Veracruz Community (1980-2000)...............9-16<br />
Table 9-6: Socio-<strong>de</strong>mographic Indic<strong>at</strong>ors in Veracruz (2000).........................................9-17<br />
Final Report vi May 2004
LIST OF FIGURES<br />
Figure 2-1: Loc<strong>at</strong>ion <strong>of</strong> Potential Disposal Sites for Pacific Si<strong>de</strong> Capacity Expansion<br />
Projects......................................................................................................................2-3<br />
Figure 3-1: Proposed Alignment <strong>of</strong> Pacific Si<strong>de</strong> Locks Project ........................................3-2<br />
Figure 3-2: Geologic Mapping <strong>of</strong> Excav<strong>at</strong>ion Area...........................................................3-5<br />
Figure 4-1: B<strong>at</strong>hymetry <strong>of</strong> Panama Bay ...........................................................................4-3<br />
Figure 4-2: B<strong>at</strong>hymetry <strong>of</strong> <strong>Island</strong> <strong>Study</strong> Area - January 2003. .........................................4-5<br />
Figure 4-3: Coverage Area - Topographic Survey <strong>of</strong> M<strong>at</strong>erials Transport Corridor .........4-7<br />
Figure 4-4: Geophysical Survey Coverage Area..............................................................4-9<br />
Figure 4-5: B<strong>at</strong>hymetry in <strong>Study</strong> Area ............................................................................4-13<br />
Figure 4-6: Depth to Bedrock in <strong>Study</strong> Area ..................................................................4-14<br />
Figure 4-7: Thickness <strong>of</strong> Sediments in <strong>Study</strong> Area ........................................................4-15<br />
Figure 4-8: Loc<strong>at</strong>ion <strong>of</strong> Boreholes & Test Pits - Corridor Geotechnical Investig<strong>at</strong>ions ..4-22<br />
Figure 4-9: Typical Test Pit – Geotechnical Investig<strong>at</strong>ions ............................................4-23<br />
Figure 4-10: Balboa FAA - Wind Speed and Direction D<strong>at</strong>a (May to July 2002) ...........4-26<br />
Figure 4-11: <strong>Study</strong> area for Wave and Hydrodynamic Mo<strong>de</strong>ling Studies ......................4-28<br />
Figure 4-12: Net Currents in Panama Bay (Atlas <strong>of</strong> Pilot Charts) ..................................4-30<br />
Figure 4-13: Currents in Panama Bay (Bennett, 1965)..................................................4-32<br />
Figure 4-14: Loc<strong>at</strong>ion <strong>of</strong> ACP established Tidal St<strong>at</strong>ions...............................................4-34<br />
Figure 4-15: Loc<strong>at</strong>ion <strong>of</strong> Current Measurements (2003) ................................................4-35<br />
Figure 4-16: Typical Results <strong>of</strong> Current Metering - June 2002 ......................................4-36<br />
Figure 4-17: Typical Current Velocities Observed <strong>at</strong> Western Limits <strong>of</strong> <strong>Study</strong> Area.......4-37<br />
Figure 5-1: Loc<strong>at</strong>ion <strong>of</strong> marine sampling st<strong>at</strong>ions ............................................................5-3<br />
Figure 7-1: Loc<strong>at</strong>ion <strong>of</strong> Deep W<strong>at</strong>er Wave Mo<strong>de</strong>l Grid Point ...........................................7-2<br />
Figure 7-2: Percent Occurrence <strong>of</strong> Significant Wave Height.............................................7-3<br />
Figure 7-3: Percent Exceedance <strong>of</strong> Significant Wave Height ..........................................7-4<br />
Figure 7-4: Percent Exceedance <strong>of</strong> Peak Wave Period...................................................7-5<br />
Figure 7-5: Percent Occurrence <strong>of</strong> Waves and Wind by Direction...................................7-6<br />
Figure 7-6: Percent Occurrence <strong>of</strong> Waves vs. Wave Direction........................................7-7<br />
Final Report vii May 2004
Figure 7-7: Inshore Wave Mo<strong>de</strong>l Limits .........................................................................7-11<br />
Figure 7-8: Mo<strong>de</strong>l Grids for Wave <strong>Study</strong>........................................................................7-14<br />
Figure 7-9 Radially Averaged Fetches within Panama Bay for <strong>Island</strong> Sites ..................7-17<br />
Figure 7-10: Balboa FAA Hourly Average Wind D<strong>at</strong>a 1985-2001 Frequency Distribution<br />
Wind Rose ...............................................................................................................7-20<br />
Figure 8-1: NOAA Charts 1929 and 1401 .........................................................................8-4<br />
Figure 8-2: Regional Mo<strong>de</strong>l Grid ......................................................................................8-5<br />
Figure 8-3: Regional Mo<strong>de</strong>l B<strong>at</strong>hymetry...........................................................................8-6<br />
Figure 8-4: Calibr<strong>at</strong>ion <strong>of</strong> Regional Mo<strong>de</strong>l Ti<strong>de</strong>s (Contadora & Taboguilla).....................8-8<br />
Figure 8-5: Calibr<strong>at</strong>ion <strong>of</strong> Regional Mo<strong>de</strong>l Ti<strong>de</strong>s (Otoque & Mine Dock) .........................8-9<br />
Figure 8-6: Local Mo<strong>de</strong>l Grid..........................................................................................8-11<br />
Figure 8-7: B<strong>at</strong>hymetry in Local Mo<strong>de</strong>l area ..................................................................8-12<br />
Figure 8-8: Local Mo<strong>de</strong>l Ti<strong>de</strong> Calibr<strong>at</strong>ion (Mine Dock & Balboa) ...................................8-14<br />
Figure 8-9: Local Mo<strong>de</strong>l Ti<strong>de</strong> Calibr<strong>at</strong>ion (Taboguilla & Río Chepo)..............................8-15<br />
Figure 8-10: Comparison <strong>of</strong> Local Mo<strong>de</strong>l Current P<strong>at</strong>terns with Bennett (1965) - 1 ......8-17<br />
Figure 8-11: Comparison <strong>of</strong> Local Mo<strong>de</strong>l Current P<strong>at</strong>terns with Bennett (1965) - 2 ......8-18<br />
Figure 8-12: Spring Ti<strong>de</strong> Flow P<strong>at</strong>terns <strong>at</strong> <strong>the</strong> <strong>Study</strong> Site ..............................................8-19<br />
Figure 8-13: Neap Ti<strong>de</strong> Flow P<strong>at</strong>terns <strong>at</strong> <strong>the</strong> <strong>Study</strong> Site................................................8-20<br />
Figure 9-1: Communities Inclu<strong>de</strong>d in Socio-Economic Overview ....................................9-2<br />
Figure 9-2: Berth and Ferry between Panama City and Taboga .....................................9-4<br />
Figure 9-3: Taboga & Taboguilla <strong>Island</strong>s .........................................................................9-5<br />
Figure 9-4: Houses on Taboga Beach .............................................................................9-7<br />
Figure 9-5: Paved Road and Souvenir Stand Close to Ferry Landing in Taboga ............9-8<br />
Figure 9-6: Amador Causeway, West si<strong>de</strong> looking north .................................................9-9<br />
Figure 9-7: View from Amador Causeway to <strong>Island</strong> Sites..............................................9-10<br />
Figure 9-8: Bique Beach and Mangroves.......................................................................9-11<br />
Figure 9-9: “Panga” Bo<strong>at</strong> Used by Artisan Fishermen ...................................................9-12<br />
Figure 9-10: Main road in Vacamonte City.....................................................................9-14<br />
Final Report viii May 2004
1 INTRODUCTION<br />
This report presents <strong>the</strong> results <strong>of</strong> engineering feasibility and environmental studies for<br />
<strong>the</strong> <strong>de</strong>velopment <strong>of</strong> an artificial island on <strong>the</strong> west si<strong>de</strong> <strong>of</strong> <strong>the</strong> Pacific-entrance navig<strong>at</strong>ion<br />
channel. The island would be constructed from excav<strong>at</strong>ed m<strong>at</strong>erial gener<strong>at</strong>ed by <strong>the</strong><br />
construction <strong>of</strong> <strong>the</strong> proposed new set <strong>of</strong> Post-Panamax locks to be loc<strong>at</strong>ed west <strong>of</strong><br />
Miraflores Locks, and also using m<strong>at</strong>erial from <strong>the</strong> <strong>de</strong>epening <strong>of</strong> <strong>the</strong> <strong>Canal</strong> Pacific<br />
entrance channel.<br />
Depending on <strong>the</strong> final alignment selected for <strong>the</strong> locks and <strong>the</strong> loc<strong>at</strong>ion <strong>of</strong> <strong>the</strong> proposed<br />
w<strong>at</strong>er savings basins, <strong>the</strong> total m<strong>at</strong>erials volume available for disposal will be from 40 to<br />
70 million m3. At this time, <strong>the</strong> most probable alignment is <strong>de</strong>sign<strong>at</strong>ed as P1-M and<br />
would gener<strong>at</strong>e approxim<strong>at</strong>ely 69.5 million m3.<br />
Following internal discussions within <strong>the</strong> Panama <strong>Canal</strong> Authority (ACP) in 2001 with<br />
regard to <strong>the</strong> potential beneficial use <strong>of</strong> <strong>the</strong> excav<strong>at</strong>ed and dredged m<strong>at</strong>erial, a<br />
preliminary study 1 examined <strong>the</strong> commercial, technical and environmental issues rel<strong>at</strong>ed<br />
to <strong>the</strong> use <strong>of</strong> this m<strong>at</strong>erial to cre<strong>at</strong>e a new island <strong>at</strong> <strong>the</strong> Pacific entrance to <strong>the</strong> Panama<br />
<strong>Canal</strong>. The terms <strong>of</strong> reference <strong>of</strong> this first study limited island <strong>de</strong>velopment options to<br />
maritime rel<strong>at</strong>ed or port activities, such as container terminals, o<strong>the</strong>r cargo terminals,<br />
bunkering facilities, distribution centers and tra<strong>de</strong> rel<strong>at</strong>ed activities.<br />
The study, which was completed in December 2001, conclu<strong>de</strong>d th<strong>at</strong> it is technically<br />
feasible to use <strong>the</strong> m<strong>at</strong>erial to construct an island loc<strong>at</strong>ed west <strong>of</strong> <strong>the</strong> Pacific entrance to<br />
<strong>the</strong> Panama <strong>Canal</strong>. Fur<strong>the</strong>rmore, <strong>the</strong> initial financial analyses showed th<strong>at</strong> <strong>the</strong> square<br />
meter cost <strong>of</strong> <strong>the</strong> island and infrastructure appears to fall within acceptable ranges for<br />
intern<strong>at</strong>ional port and port rel<strong>at</strong>ed facilities.<br />
This report now takes <strong>the</strong> analysis to feasibility level in or<strong>de</strong>r to gener<strong>at</strong>e a higher level<br />
<strong>of</strong> confi<strong>de</strong>nce in <strong>the</strong> cost estim<strong>at</strong>e and to i<strong>de</strong>ntify key issues rel<strong>at</strong>ed to <strong>the</strong> permitting<br />
process. In turn, <strong>the</strong>se engineering feasibility studies and environmental assessment<br />
establish <strong>the</strong> found<strong>at</strong>ion for future <strong>de</strong>tailed engineering <strong>de</strong>sign for construction and<br />
provi<strong>de</strong> <strong>the</strong> basis for <strong>the</strong> formal environmental permitting process.<br />
1 Preliminary <strong>Study</strong> <strong>of</strong> <strong>Island</strong> <strong>Development</strong> <strong>at</strong> <strong>the</strong> Pacific Entrance <strong>of</strong> <strong>the</strong> Panama <strong>Canal</strong>, M<strong>of</strong>f<strong>at</strong>t<br />
& Nichol and Louis Berger Group for ACP, December 2001<br />
Final Report 1-1 May 2004
In parallel with <strong>the</strong> study, ACP has also prepared an evalu<strong>at</strong>ion 2 <strong>of</strong> o<strong>the</strong>r disposal sites<br />
for m<strong>at</strong>erial to be removed from <strong>the</strong> Locks and also from <strong>the</strong> proposed <strong>de</strong>epening and<br />
wi<strong>de</strong>ning <strong>of</strong> Gaillard Cut. This study inclu<strong>de</strong>s an assessment <strong>of</strong> transport<strong>at</strong>ion costs,<br />
environmental impacts, value ad<strong>de</strong>d potential and cost estim<strong>at</strong>es for some 17 sites, one<br />
<strong>of</strong> which is <strong>the</strong> Artificial <strong>Island</strong> th<strong>at</strong> forms <strong>the</strong> subject <strong>of</strong> this study.<br />
Environmental field work for <strong>the</strong> Disposal options study was coordin<strong>at</strong>ed with <strong>the</strong><br />
requirements <strong>of</strong> <strong>the</strong> <strong>Feasibility</strong> <strong>Study</strong> and has been as a basis for a number <strong>of</strong> <strong>the</strong><br />
conclusions in this report. Appendix E presents <strong>the</strong> results <strong>of</strong> <strong>the</strong> analyses th<strong>at</strong> were<br />
extracted from <strong>the</strong> Disposal <strong>Study</strong> investig<strong>at</strong>ions and incorpor<strong>at</strong>ed in this report.<br />
One important consi<strong>de</strong>r<strong>at</strong>ion arose from <strong>the</strong> ACP Workshops th<strong>at</strong> were held to discuss<br />
<strong>the</strong> various disposal sites and options for <strong>the</strong> entire group <strong>of</strong> Pacific Si<strong>de</strong> <strong>Canal</strong> Capacity<br />
Expansion projects. Given <strong>the</strong> aes<strong>the</strong>tic consi<strong>de</strong>r<strong>at</strong>ions and potential socio economic or<br />
environmental implic<strong>at</strong>ions <strong>of</strong> maritime rel<strong>at</strong>ed <strong>de</strong>velopment on <strong>the</strong> island, it was<br />
suggested th<strong>at</strong> <strong>the</strong> long term <strong>de</strong>velopment <strong>of</strong> <strong>the</strong> island and one o<strong>the</strong>r marine site un<strong>de</strong>r<br />
consi<strong>de</strong>r<strong>at</strong>ion should not necessarily be limited to port and port rel<strong>at</strong>ed uses.<br />
Consequently, this feasibility study <strong>of</strong>fers a broa<strong>de</strong>r panorama <strong>of</strong> potential uses for <strong>the</strong><br />
artificial island.<br />
2 Pacific Site Excav<strong>at</strong>ion & Dredging M<strong>at</strong>erial Disposal Altern<strong>at</strong>ives Evalu<strong>at</strong>ion, M<strong>of</strong>f<strong>at</strong>t & Nichol,<br />
Louis Berger Group and Gol<strong>de</strong>r Associ<strong>at</strong>es, October 2003<br />
Final Report 1-2 May 2004
2 BACKGROUND<br />
2.1 M<strong>at</strong>erials Disposal Sites Screening Process<br />
The selection <strong>of</strong> <strong>the</strong> candid<strong>at</strong>e sites to receive all <strong>of</strong> <strong>the</strong> dredged and excav<strong>at</strong>ed m<strong>at</strong>erial<br />
from <strong>the</strong> Locks and o<strong>the</strong>r <strong>Canal</strong> <strong>de</strong>epening and wi<strong>de</strong>ning projects was <strong>de</strong>veloped from a<br />
number <strong>of</strong> reports to ACP from December 2001 to October 2003, and also from a series<br />
<strong>of</strong> ACP Workshops.<br />
The sources for <strong>the</strong> sites evalu<strong>at</strong>ed over this period were:<br />
• Projects i<strong>de</strong>ntified before 1993 in various studies and ACP documents<br />
• Sites listed in <strong>the</strong> Panama <strong>Canal</strong> Altern<strong>at</strong>ives <strong>Study</strong> (1993)<br />
• Existing or Proposed ACP m<strong>at</strong>erials Disposal Sites<br />
• Abandoned US Dept <strong>of</strong> Defense Firing Ranges within <strong>the</strong> former <strong>Canal</strong> Zone<br />
• Listing <strong>of</strong> Sites consi<strong>de</strong>red by ACP during a Workshop in November 2001<br />
• Pacific Site Excav<strong>at</strong>ion & Dredging M<strong>at</strong>erial Disposal Altern<strong>at</strong>ives <strong>Study</strong>, October<br />
2003.<br />
The initial screening i<strong>de</strong>ntified some 59 sites th<strong>at</strong> had been proposed or suggested over<br />
<strong>the</strong> past 20 years or so for m<strong>at</strong>erials disposal, reclam<strong>at</strong>ion or fill. The elimin<strong>at</strong>ion <strong>of</strong><br />
those sites th<strong>at</strong> were essentially <strong>at</strong> <strong>the</strong> same loc<strong>at</strong>ion, although presented in separ<strong>at</strong>e<br />
reports reduced <strong>the</strong> number <strong>of</strong> loc<strong>at</strong>ions to 29 sites.<br />
The criteria for passing to <strong>the</strong> next level in <strong>the</strong> screening process were:<br />
• The site should accommod<strong>at</strong>e all <strong>of</strong> <strong>the</strong> m<strong>at</strong>erial from <strong>the</strong> Third Locks Project<br />
(approxim<strong>at</strong>ely 70 million m 3 )<br />
• Sites should be within an “economic” haul distance, consi<strong>de</strong>red to be 20 km.<br />
• Those sites with obvious land use, environmental or o<strong>the</strong>r critical conflicts would<br />
be elimin<strong>at</strong>ed.<br />
This <strong>the</strong>n reduced <strong>the</strong> options to six basic altern<strong>at</strong>ives th<strong>at</strong> could potentially hold all <strong>the</strong><br />
m<strong>at</strong>erial from <strong>the</strong> Locks excav<strong>at</strong>ion and <strong>the</strong>se were presented to <strong>the</strong> ACP for discussion<br />
and consi<strong>de</strong>r<strong>at</strong>ion <strong>at</strong> a Workshop on September 27, 2002. One <strong>of</strong> <strong>the</strong> first comments<br />
from <strong>the</strong> participants was <strong>the</strong> suggestion th<strong>at</strong> it was not necessary to exclu<strong>de</strong> sites th<strong>at</strong><br />
could not hold all <strong>the</strong> m<strong>at</strong>erial from <strong>the</strong> Locks excav<strong>at</strong>ion work, since several sites could<br />
be combined to accommod<strong>at</strong>e <strong>the</strong> full volume <strong>of</strong> m<strong>at</strong>erial.<br />
Final Report 2-1 May 2004
A second key consi<strong>de</strong>r<strong>at</strong>ion was th<strong>at</strong> <strong>the</strong> consultants should emphasize opportunities for<br />
beneficial use <strong>of</strong> <strong>the</strong> m<strong>at</strong>erials, which could well involve <strong>the</strong> use <strong>of</strong> rel<strong>at</strong>ively small<br />
amounts <strong>of</strong> m<strong>at</strong>erial <strong>at</strong> some <strong>of</strong> <strong>the</strong> smaller sites.<br />
It was also suggested th<strong>at</strong> consi<strong>de</strong>r<strong>at</strong>ion should be given to <strong>the</strong> use <strong>of</strong> m<strong>at</strong>erial for <strong>the</strong><br />
potential construction <strong>of</strong> a new reservoir <strong>at</strong> a site i<strong>de</strong>ntified as <strong>the</strong> Trinidad Dam. Due to<br />
<strong>the</strong> preliminary n<strong>at</strong>ure <strong>of</strong> <strong>the</strong> engineering evalu<strong>at</strong>ion <strong>of</strong> this project, it was <strong>de</strong>ci<strong>de</strong>d th<strong>at</strong><br />
only <strong>the</strong> transport<strong>at</strong>ion costs <strong>of</strong> moving m<strong>at</strong>erial to this loc<strong>at</strong>ion should be evalu<strong>at</strong>ed <strong>at</strong><br />
this time.<br />
Finally, it was recommen<strong>de</strong>d th<strong>at</strong> cost estim<strong>at</strong>es and preliminary evalu<strong>at</strong>ion should<br />
inclu<strong>de</strong> <strong>the</strong> disposal <strong>of</strong> m<strong>at</strong>erial from <strong>the</strong> Pacific entrance dredging and also for <strong>the</strong> Third<br />
Locks excav<strong>at</strong>ion using traditional <strong>de</strong>ep w<strong>at</strong>er disposal methods. The primary intent <strong>of</strong><br />
this scenario was to use <strong>the</strong> baseline cost <strong>of</strong> <strong>de</strong>ep w<strong>at</strong>er disposal to act as a benchmark<br />
against <strong>the</strong> potential transport and <strong>de</strong>velopment cost <strong>of</strong> o<strong>the</strong>r options having ad<strong>de</strong>dvalue<br />
or potential beneficial use.<br />
Based on <strong>the</strong> <strong>de</strong>liber<strong>at</strong>ions <strong>of</strong> <strong>the</strong> Workshop participants and <strong>the</strong> modific<strong>at</strong>ions to <strong>the</strong><br />
listing <strong>of</strong> candid<strong>at</strong>e sites as noted above, <strong>the</strong> sites shown in were selected for evalu<strong>at</strong>ion<br />
as candid<strong>at</strong>es to receive m<strong>at</strong>erials from <strong>the</strong> three Capacity Expansion Projects.<br />
However, this list <strong>of</strong> 17 sites inclu<strong>de</strong>s disposal loc<strong>at</strong>ions for <strong>the</strong> Gaillard Cut and Pacific<br />
entrance channel projects. Since <strong>the</strong>y are not sites th<strong>at</strong> could economically be used to<br />
receive m<strong>at</strong>erial from <strong>the</strong> Pacific Si<strong>de</strong> Locks project, <strong>the</strong>y are omitted from <strong>the</strong> final list <strong>of</strong><br />
candid<strong>at</strong>e sites shown in Table 2-1.<br />
Final Report 2-2 May 2004
Figure 2-1: Loc<strong>at</strong>ion <strong>of</strong> Potential Disposal Sites for Pacific Si<strong>de</strong> Capacity<br />
Expansion Projects<br />
Use old Fig 3-1 from PFR.<br />
Final Report 2-3 May 2004
Table 2-1: List <strong>of</strong> Sites un<strong>de</strong>r Consi<strong>de</strong>r<strong>at</strong>ion for Pacific Si<strong>de</strong> Locks Project<br />
Site<br />
Ref<br />
Design<strong>at</strong>ion<br />
Former Name<br />
(from earlier studies)<br />
Terrestrial Sites<br />
T6 UXO Area UXO<br />
T7 Miraflores West Bank Area East <strong>of</strong> Alignment P1<br />
T8 1939 Third Locks Expansion 1939 Third Locks Expansion<br />
T9 Rodman/Horoko 1993 <strong>Study</strong> Site 2<br />
T10 El Arado El Arado- Site 13 Sea Level <strong>Canal</strong> <strong>Study</strong><br />
M1 Panama Bay Fill Ciudad Marina et al.<br />
M2 Chorrillo Bay Fill<br />
M3 Amador Causeway East Wi<strong>de</strong>n Amador Causeway<br />
M4 Farfan/Palo Seco<br />
M5 Artificial <strong>Island</strong><br />
M6<br />
A1<br />
Marine Sites<br />
O<strong>the</strong>rs<br />
Site M6 - Offshore Open W<strong>at</strong>er Disposal<br />
Site A1 - Trinidad Dam Project<br />
2.2 Results <strong>of</strong> <strong>the</strong> Evalu<strong>at</strong>ion<br />
Throughout all <strong>of</strong> <strong>the</strong> discussions on <strong>the</strong> candid<strong>at</strong>e disposal sites <strong>the</strong> possibility <strong>of</strong><br />
beneficial use <strong>of</strong> <strong>the</strong> excav<strong>at</strong>ed m<strong>at</strong>erials through <strong>the</strong> construction <strong>of</strong> an artificial island<br />
was an important consi<strong>de</strong>r<strong>at</strong>ion.<br />
The results <strong>of</strong> <strong>the</strong> recently completed Dredge Disposal Options study conclu<strong>de</strong>d th<strong>at</strong>:<br />
“The key issue rel<strong>at</strong>ed to this study is <strong>the</strong> selection <strong>of</strong> one or more sites to receive some<br />
90 million m3 <strong>of</strong> m<strong>at</strong>erial from <strong>the</strong> Third Locks Project. If <strong>the</strong> El Arado site is discounted<br />
for <strong>the</strong> reasons noted earlier, only <strong>the</strong> UXO area and <strong>the</strong> Artificial <strong>Island</strong> remain as sites<br />
th<strong>at</strong> could receive all <strong>of</strong> <strong>the</strong> fill m<strong>at</strong>erial. The combined capacity <strong>of</strong> all <strong>of</strong> <strong>the</strong> o<strong>the</strong>r<br />
acceptable sites does not meet <strong>the</strong> project needs. Hence <strong>the</strong> basic choice comes down<br />
to <strong>the</strong> selection <strong>of</strong> one <strong>of</strong> <strong>the</strong>se two options.”<br />
Final Report 2-4 May 2004
Given <strong>the</strong> potential for public objections, n<strong>at</strong>ional government issues, environmental and<br />
o<strong>the</strong>r concerns associ<strong>at</strong>ed with any or all <strong>of</strong> <strong>the</strong> three sites indic<strong>at</strong>ed above,<br />
transport<strong>at</strong>ion costs were also computed for simple disposal <strong>of</strong> <strong>the</strong> Locks m<strong>at</strong>erial <strong>at</strong> a<br />
<strong>de</strong>epw<strong>at</strong>er site. This cost also provi<strong>de</strong>s a benchmark for <strong>the</strong> assessment <strong>of</strong> value ad<strong>de</strong>d<br />
potential.<br />
The compar<strong>at</strong>ive transport costs presented in <strong>the</strong> Disposal <strong>Study</strong> for <strong>the</strong> three final sites<br />
and <strong>the</strong> <strong>de</strong>ep w<strong>at</strong>er disposal option are presented in Table 2-2, below.<br />
Table 2-2: Estim<strong>at</strong>ed Costs <strong>of</strong> Transport <strong>of</strong> Excav<strong>at</strong>ed M<strong>at</strong>erials to Candid<strong>at</strong>e<br />
Sites for Locks Project<br />
Ref No.<br />
Site<br />
Unit cost <strong>of</strong><br />
M<strong>at</strong>erials<br />
Transport<br />
(B/m3)<br />
T6 UXO Site 3.43<br />
T10 El Arado 5.96<br />
M5 Artificial <strong>Island</strong> 4.25<br />
Comments<br />
Inclu<strong>de</strong>s UXO clearance & site<br />
restor<strong>at</strong>ion<br />
Inclu<strong>de</strong>s land acquisition & site<br />
restor<strong>at</strong>ion<br />
Dry m<strong>at</strong>erials, inclu<strong>de</strong>s marine site<br />
prepar<strong>at</strong>ion costs<br />
M6 Open W<strong>at</strong>er Disposal 5.08 Assumes dumping in w<strong>at</strong>er 20 m <strong>de</strong>ep<br />
As can be seen from <strong>the</strong> results presented above, <strong>the</strong> disposal <strong>of</strong> m<strong>at</strong>erial to <strong>the</strong> UXO<br />
site appears to be <strong>the</strong> most cost effective, mainly because <strong>the</strong> center <strong>of</strong> <strong>the</strong> site is less<br />
than 7 km from <strong>the</strong> center <strong>of</strong> <strong>the</strong> excav<strong>at</strong>ion area. However, as noted above, <strong>the</strong>re are a<br />
series <strong>of</strong> important issues associ<strong>at</strong>ed with all <strong>of</strong> <strong>the</strong> sites listed, and <strong>the</strong>re are no<br />
assurances <strong>at</strong> this time th<strong>at</strong> any one <strong>of</strong> <strong>the</strong> sites could be readily approved and prepared<br />
to receive <strong>the</strong> m<strong>at</strong>erial in time for <strong>the</strong> commencement <strong>of</strong> <strong>the</strong> excav<strong>at</strong>ion work <strong>at</strong> <strong>the</strong><br />
Pacific Si<strong>de</strong> Locks project.<br />
However, <strong>the</strong>se unit costs are a critical element in <strong>the</strong> financial comparison <strong>of</strong> any<br />
proposal to use <strong>the</strong> excav<strong>at</strong>ed m<strong>at</strong>erial for <strong>the</strong> construction <strong>of</strong> an artificial island.<br />
Final Report 2-5 May 2004
--- THIS PAGE INTENTIONALLY BLANK ---<br />
Final Report 2-6 May 2004
3 MATERIALS CHARACTERISTICS<br />
3.1 Excav<strong>at</strong>ion Quantities<br />
The recently completed Pacific Locks concept study examined various alignments for <strong>the</strong><br />
entrance and exit channels and <strong>the</strong> new Locks. While <strong>the</strong> results <strong>of</strong> this study have still<br />
not been <strong>of</strong>ficially released, it is un<strong>de</strong>rstood th<strong>at</strong> <strong>the</strong> recommen<strong>de</strong>d alignment is extremely<br />
close to <strong>the</strong> routing known as P1 and shown in Figure 3-1. It is un<strong>de</strong>rstood th<strong>at</strong> <strong>the</strong><br />
recommen<strong>de</strong>d alignment is <strong>de</strong>sign<strong>at</strong>ed as P1-M and will require from 50 to 69.50 million<br />
m3 <strong>of</strong> excav<strong>at</strong>ion, <strong>de</strong>pending on <strong>the</strong> channel width selected.<br />
Exact quantities <strong>of</strong> excav<strong>at</strong>ion are not available for all <strong>of</strong> <strong>the</strong> alignments un<strong>de</strong>r study <strong>at</strong> this<br />
time. However, as part <strong>of</strong> earlier studies on <strong>the</strong> Locks project, excav<strong>at</strong>ion quantities were<br />
computed for two alignments for <strong>the</strong> Locks project by Harza Associ<strong>at</strong>es in 2000 3 . These<br />
comput<strong>at</strong>ions were checked by <strong>the</strong> consultants using terrain mo<strong>de</strong>ling provi<strong>de</strong>d by ACP.<br />
At <strong>the</strong> same time, <strong>the</strong> consultants incorpor<strong>at</strong>ed a number <strong>of</strong> modific<strong>at</strong>ions to <strong>the</strong> cut<br />
pr<strong>of</strong>iles to accommod<strong>at</strong>e adjusted si<strong>de</strong> slopes and increased working areas around <strong>the</strong><br />
main locks construction zone.<br />
As a result, <strong>the</strong> total volume <strong>of</strong> m<strong>at</strong>erial to be removed from <strong>the</strong> excav<strong>at</strong>ion area is<br />
calcul<strong>at</strong>ed to be 69.35 million cubic meters (m 3 ), before <strong>the</strong> applic<strong>at</strong>ion <strong>of</strong> any coefficients<br />
for bulking and compaction <strong>at</strong> <strong>the</strong> disposal site. Since this figure represents <strong>the</strong> upper<br />
volume limit for <strong>the</strong> Locks project, and is very close to <strong>the</strong> numbers expected from <strong>the</strong><br />
modified P1 alignment, it is reasonable to use it as a basis for this study.<br />
Two potential disposal sites 4 within <strong>the</strong> Locks construction working area could potentially<br />
hold up to 9.5 million m 3 <strong>of</strong> this m<strong>at</strong>erial and adjustments to <strong>the</strong> final alignment <strong>of</strong> <strong>the</strong><br />
channels could fur<strong>the</strong>r reduce <strong>the</strong> total quantity. However, it is recommen<strong>de</strong>d th<strong>at</strong> <strong>the</strong><br />
above figure should be adopted for all island fill and transport<strong>at</strong>ion cost calcul<strong>at</strong>ions, in<br />
or<strong>de</strong>r to ensure sufficient disposal capacity for all potential scenarios.<br />
3 Evalu<strong>at</strong>ion <strong>of</strong> Lock Channel Alignments, Harza Associ<strong>at</strong>es for ACP, August 2000<br />
4 Sites T7 and T8, Pacific Sites Disposal Altern<strong>at</strong>ives <strong>Study</strong>, November 2003.<br />
Final Report 3-1 May 2004
Figure 3-1: Proposed Alignment <strong>of</strong> Pacific Si<strong>de</strong> Locks Project<br />
Final Report 3-2 May 2004
3.2 M<strong>at</strong>erials Classific<strong>at</strong>ion<br />
3.2.1 Introduction<br />
Dredging, conventional dry earth moving methods and drill-and-blast excav<strong>at</strong>ion methods<br />
will be used to remove <strong>the</strong> m<strong>at</strong>erials from <strong>the</strong> Locks area and <strong>the</strong> approach channels, with<br />
<strong>the</strong> expect<strong>at</strong>ion th<strong>at</strong> most <strong>of</strong> <strong>the</strong> m<strong>at</strong>erial will be excav<strong>at</strong>ed un<strong>de</strong>r dry conditions. The<br />
ultim<strong>at</strong>e selection <strong>of</strong> <strong>the</strong> excav<strong>at</strong>ion methods and equipment will be <strong>the</strong> responsibility <strong>of</strong><br />
<strong>the</strong> contractor, but ACP may place reasonable constraints on <strong>the</strong> contractor in or<strong>de</strong>r to<br />
optimize <strong>the</strong> beneficial use <strong>of</strong> <strong>the</strong> excav<strong>at</strong>ed m<strong>at</strong>erials or coordin<strong>at</strong>e with <strong>the</strong> overall<br />
construction program.<br />
Options for transport <strong>of</strong> <strong>the</strong> excav<strong>at</strong>ed m<strong>at</strong>erials from <strong>the</strong> work area to <strong>the</strong> proposed<br />
<strong>of</strong>fshore island inclu<strong>de</strong> truck haul, a <strong>de</strong>dic<strong>at</strong>ed rail line, barge transport and a conveyor<br />
system or a combin<strong>at</strong>ion <strong>of</strong> systems.<br />
This section <strong>of</strong> <strong>the</strong> report presents <strong>the</strong> following inform<strong>at</strong>ion to support <strong>the</strong> transport<strong>at</strong>ion<br />
system and cost mo<strong>de</strong>ling efforts:<br />
• Characteriz<strong>at</strong>ion <strong>of</strong> m<strong>at</strong>erial to be excav<strong>at</strong>ed through analysis <strong>of</strong> available geologic<br />
and geotechnical d<strong>at</strong>a and observ<strong>at</strong>ions ma<strong>de</strong> <strong>at</strong> <strong>the</strong> site.<br />
• Evalu<strong>at</strong>ion <strong>of</strong> suitability <strong>of</strong> excav<strong>at</strong>ed m<strong>at</strong>erial in artificial island construction as<br />
armor stone, un<strong>de</strong>rlayer stone, un<strong>de</strong>rw<strong>at</strong>er rock fill, compacted rock fill, compacted<br />
soil fill, and hydraulic fill.<br />
• Review and refinement <strong>of</strong> geologic plan and pr<strong>of</strong>iles to support comput<strong>at</strong>ions <strong>of</strong><br />
available quantities <strong>of</strong> each m<strong>at</strong>erial type.<br />
• Recommend<strong>at</strong>ion <strong>of</strong> bulking/shrinkage factors for each geologic unit.<br />
• Comments on <strong>the</strong> size, shape and specific gravity <strong>of</strong> <strong>the</strong> excav<strong>at</strong>ed rock.<br />
A more <strong>de</strong>tailed discussion on <strong>the</strong> m<strong>at</strong>erials characteristics evalu<strong>at</strong>ion is presented in<br />
Appendix A to this report.<br />
3.2.2 Source Inform<strong>at</strong>ion<br />
D<strong>at</strong>a and inform<strong>at</strong>ion available for this study inclu<strong>de</strong>d <strong>the</strong> following:<br />
• Panama <strong>Canal</strong> Authority Preliminary <strong>Study</strong> <strong>of</strong> <strong>Island</strong> <strong>Development</strong> <strong>at</strong> <strong>the</strong> Pacific<br />
Entrance <strong>of</strong> <strong>the</strong> Panama <strong>Canal</strong>: Final Report, December 2001 (M<strong>of</strong>f<strong>at</strong>t & Nichol<br />
Engineers);<br />
• Selected Panama <strong>Canal</strong> Company boring logs completed from 1939-1945 (Third<br />
Locks Studies);<br />
Final Report 3-3 May 2004
• Panama <strong>Canal</strong> Authority boring logs completed during 2001 (Third Locks<br />
Investig<strong>at</strong>ion);<br />
• Test results for soil and rock from borings advanced in 2001 (Third Set <strong>of</strong> Locks<br />
Project, Summary <strong>of</strong> Test results on Rock form<strong>at</strong>ions, August 2001);<br />
• 2002 Panama <strong>Canal</strong> Authority geologic map/ boring loc<strong>at</strong>ion plan (Third Locks<br />
Investig<strong>at</strong>ion)<br />
• 2002 Panama <strong>Canal</strong> Authority geologic pr<strong>of</strong>iles (Third Locks Investig<strong>at</strong>ion)<br />
• Transactions <strong>of</strong> <strong>the</strong> Intern<strong>at</strong>ional Engineering Congress, 1915: Volume 1-The<br />
Panama <strong>Canal</strong>, Paper No. 3: Outline <strong>of</strong> <strong>Canal</strong> Zone Geology.<br />
•<br />
A summary list <strong>of</strong> boring logs utilized by <strong>the</strong> consultants in this study is also found in<br />
Appendix A.<br />
3.2.3 Methodology<br />
The following steps were taken to evalu<strong>at</strong>e <strong>the</strong> geotechnical characteristics <strong>of</strong> <strong>the</strong> m<strong>at</strong>erial<br />
from <strong>the</strong> proposed third locks excav<strong>at</strong>ion:<br />
• Available d<strong>at</strong>a was compiled and analyzed.<br />
• Construction needs were recognized.<br />
• M<strong>at</strong>erial properties and behavior were generalized.<br />
• ACP geologic map and pr<strong>of</strong>iles were reviewed.<br />
• Suitability <strong>of</strong> each m<strong>at</strong>erial type for construction purposes was evalu<strong>at</strong>ed.<br />
3.2.4 Geology<br />
Rock<br />
Five rock form<strong>at</strong>ions are represented on geologic plans and pr<strong>of</strong>iles prepared by ACP<br />
following extensive borehole investig<strong>at</strong>ions in <strong>the</strong> excav<strong>at</strong>ion area for <strong>the</strong> third locks<br />
project. Figure 3-2 shows <strong>the</strong> Basaltos, Pedro Miguel Form<strong>at</strong>ion, La Boca Form<strong>at</strong>ion,<br />
Cucaracha Form<strong>at</strong>ion, and Culebra Form<strong>at</strong>ion. The complexity <strong>of</strong> <strong>the</strong> geology has been<br />
influenced by faulting and igneous activity along <strong>the</strong> alignment.<br />
Final Report 3-4 May 2004
Figure 3-2: Geologic Mapping <strong>of</strong> Excav<strong>at</strong>ion Area<br />
11x17<br />
Use 11 x 17 version <strong>of</strong> Mapa Geologico with less <strong>de</strong>tail. Show general form<strong>at</strong>ion extents<br />
and boreholes, plus Locks Alignment.<br />
Final Report 3-5 May 2004
--- THIS PAGE INTENTIONALLY BLANK ---<br />
Final Report 3-6 May 2004
As indic<strong>at</strong>ed on <strong>the</strong> geologic map and pr<strong>of</strong>iles, <strong>the</strong> Basaltos, Pedro Miguel, and La Boca<br />
Form<strong>at</strong>ions are most common in <strong>the</strong> excav<strong>at</strong>ion area, while <strong>the</strong> Cucaracha and Culebra<br />
Form<strong>at</strong>ions are encountered less frequently. Zones <strong>of</strong> fault gouge are also anticip<strong>at</strong>ed<br />
within <strong>the</strong> excav<strong>at</strong>ion area. This m<strong>at</strong>erial is rel<strong>at</strong>ively insignificant compared to <strong>the</strong> rock in<br />
which it occurs; <strong>the</strong>refore, in this report, it is tre<strong>at</strong>ed as having <strong>the</strong> same characteristics as<br />
<strong>the</strong> rock types in which it occurs. Generalized characteristics and behaviors <strong>of</strong> <strong>the</strong> rock<br />
form<strong>at</strong>ions, as <strong>de</strong>duced from analysis <strong>of</strong> <strong>the</strong> available boring logs, are <strong>de</strong>scribed in<br />
Table 3-1.<br />
3.2.5 Overbur<strong>de</strong>n<br />
The rock form<strong>at</strong>ions are overlain in most areas by overbur<strong>de</strong>n consisting <strong>of</strong> we<strong>at</strong>hered<br />
rock, residual soil, and/or fill m<strong>at</strong>erial from previous canal excav<strong>at</strong>ions. According to <strong>the</strong><br />
boring logs, <strong>the</strong> thickness <strong>of</strong> <strong>the</strong> overbur<strong>de</strong>n ranges from 0 to 52 meters. The overbur<strong>de</strong>n<br />
soils are quite variable in respect to <strong>the</strong>ir particle size, consistency, moisture content,<br />
plasticity, and dry strength.<br />
The logs indic<strong>at</strong>e th<strong>at</strong> <strong>the</strong> fill m<strong>at</strong>erial is commonly gravelly and <strong>of</strong>ten contains boul<strong>de</strong>rs.<br />
Fill consisting primarily <strong>of</strong> hard basalt boul<strong>de</strong>rs has been noted in several borings, with<br />
zones ranging in thickness from 3 to 12 meters.<br />
Final Report 3-7 May 2004
--- THIS PAGE INTENTIONALLY BLANK ---<br />
Final Report 3-8 May 2004
Table 3-1: Characteristics <strong>of</strong> M<strong>at</strong>erials in <strong>the</strong> Excav<strong>at</strong>ion Area<br />
11x17<br />
Use Table 1 from Geotechnical report<br />
Final Report 3-9 May 2004
--- THIS PAGE INTENTIONALLY BLANK ---<br />
Final Report 3-10 May 2004
3.2.6 M<strong>at</strong>erial Suitability for Construction Elements<br />
The various m<strong>at</strong>erial and rock types encountered in <strong>the</strong> study area may be divi<strong>de</strong>d into <strong>the</strong><br />
following four c<strong>at</strong>egories:<br />
• Basalt<br />
• Agglomer<strong>at</strong>e<br />
• Sedimentary Rocks<br />
• Overbur<strong>de</strong>n<br />
Based on this initial assessment, Table 3-2 indic<strong>at</strong>es <strong>the</strong> potential suitability <strong>of</strong> <strong>the</strong> four<br />
c<strong>at</strong>egories <strong>of</strong> m<strong>at</strong>erial for <strong>the</strong> various construction elements <strong>of</strong> <strong>the</strong> island project.<br />
Table 3-2: Suitability <strong>of</strong> Excav<strong>at</strong>ed M<strong>at</strong>erials for <strong>Island</strong> Construction<br />
<strong>Island</strong> Construction Element<br />
C<strong>at</strong>egory <strong>of</strong> Excav<strong>at</strong>ed M<strong>at</strong>erial<br />
Primary Armor Stone Basalt 1 or Off-Site Quarries 2<br />
Un<strong>de</strong>rlayer Stone<br />
Un<strong>de</strong>rw<strong>at</strong>er Rock Fill<br />
Compacted Rock Fill<br />
Basalt 1 (with processing)<br />
Basalt 1 , Durable Agglomer<strong>at</strong>e<br />
Basalt 1 & Durable Agglomer<strong>at</strong>e (with limited processing)<br />
Compacted Soil Fill Non-durable Agglomer<strong>at</strong>e, Sedimentary Rocks,<br />
Overbur<strong>de</strong>n<br />
Waste (Unsuitable Soils)<br />
Overbur<strong>de</strong>n, dredged m<strong>at</strong>erial<br />
1 - Additional testing is required to confirm durability <strong>of</strong> basalt for armor protection.<br />
2 - Joint spacing <strong>of</strong> <strong>the</strong> basalt is unlikely to yield sufficient size <strong>of</strong> rock pieces for primary armor on<br />
exposed faces <strong>of</strong> <strong>the</strong> island.<br />
Basalt<br />
A large portion <strong>of</strong> <strong>the</strong> excav<strong>at</strong>ion area is composed <strong>of</strong> <strong>the</strong> Basaltos Form<strong>at</strong>ion, consisting<br />
<strong>of</strong> sound, strong to very strong, basalt and diabase. Although diabase has been i<strong>de</strong>ntified<br />
as a component <strong>of</strong> <strong>the</strong> Basaltos Form<strong>at</strong>ion on boring logs and geologic plans and pr<strong>of</strong>iles,<br />
it is consi<strong>de</strong>red to behave similarly to <strong>the</strong> basalt. Therefore, <strong>the</strong>se rock types are tre<strong>at</strong>ed<br />
as one geotechnical unit (basalt) in this report. Excav<strong>at</strong>ion <strong>of</strong> basalt is projected along <strong>the</strong><br />
alignment from approxim<strong>at</strong>ely St<strong>at</strong>ion 1+500 through 2+900 and St<strong>at</strong>ion 5+000 through<br />
10+000.<br />
Final Report 3-11 May 2004
The typical spacing <strong>of</strong> joints in <strong>the</strong> Basaltos Form<strong>at</strong>ion is mo<strong>de</strong>r<strong>at</strong>ely close to close (0.06<br />
to 0.6 meters). It is expected th<strong>at</strong> well-<strong>de</strong>signed blasts will produce angular pieces th<strong>at</strong><br />
typically gra<strong>de</strong> from a few millimeters to 0.6 m although some pieces larger than 0.6 m<br />
should be expected. These units may be used in <strong>the</strong> un<strong>de</strong>rw<strong>at</strong>er rock fill up to <strong>the</strong> size<br />
th<strong>at</strong> can be handled by <strong>the</strong> equipment and in areas where piling will not be driven.<br />
Altern<strong>at</strong>ively, <strong>the</strong>y may be set asi<strong>de</strong> for use as armor stone or broken down fur<strong>the</strong>r by<br />
blasting or hoe-ramming. However, it is not likely th<strong>at</strong> <strong>the</strong> largest pieces will be <strong>of</strong><br />
sufficient size for primary armor on exposed faces <strong>of</strong> <strong>the</strong> breakw<strong>at</strong>er or revetments. D<strong>at</strong>a<br />
on specific gravity <strong>of</strong> <strong>the</strong> basalt is provi<strong>de</strong>d in Table 3-1.<br />
Field d<strong>at</strong>a and test results indic<strong>at</strong>e th<strong>at</strong> <strong>the</strong> basalt has high strength. The average<br />
strength resulting from point load tests performed by ACP was approxim<strong>at</strong>ely 70 MPa.<br />
High strength is typically indic<strong>at</strong>ive <strong>of</strong> durable m<strong>at</strong>erial. Core logs indic<strong>at</strong>e th<strong>at</strong> zeolites<br />
are locally present along fracture surfaces within <strong>the</strong> basalt. Zeolites can we<strong>at</strong>her and<br />
expand over time, resulting in <strong>de</strong>grad<strong>at</strong>ion <strong>of</strong> rock particles th<strong>at</strong> appear to be sound when<br />
excav<strong>at</strong>ed. However, since zeolites were only i<strong>de</strong>ntified along joint surfaces and not<br />
within <strong>the</strong> rock m<strong>at</strong>rix, this type <strong>of</strong> <strong>de</strong>grad<strong>at</strong>ion is not consi<strong>de</strong>red likely.<br />
Based on discussions with ACP specialists it is expected th<strong>at</strong> testing will show <strong>the</strong> basalt<br />
is durable. Hence it is most probable th<strong>at</strong> <strong>the</strong> basalt may be used directly, without<br />
processing to adjust <strong>the</strong> grad<strong>at</strong>ion, in un<strong>de</strong>rw<strong>at</strong>er rock fill. With limited processing to<br />
remove oversize m<strong>at</strong>erial, it should also be suitable in compacted rock fill. Basalt th<strong>at</strong> is<br />
found to be non-durable can be used for above w<strong>at</strong>er fill. Test blasts are recommen<strong>de</strong>d in<br />
<strong>the</strong> early stages <strong>of</strong> <strong>the</strong> excav<strong>at</strong>ions in <strong>the</strong> basalt to <strong>de</strong>termine <strong>the</strong> blast hole spacing and<br />
pow<strong>de</strong>r factor th<strong>at</strong> yield a grad<strong>at</strong>ion suitable for <strong>the</strong> fills and th<strong>at</strong> provi<strong>de</strong> a level <strong>of</strong> rock<br />
fragment<strong>at</strong>ion th<strong>at</strong> is acceptable to <strong>the</strong> contractor.<br />
Given <strong>the</strong> expect<strong>at</strong>ion <strong>of</strong> joint spacing noted above, it is most probable th<strong>at</strong> <strong>the</strong> un<strong>de</strong>rlayer<br />
stone may be obtained by processing <strong>the</strong> shot rock. However, it is not expected th<strong>at</strong> <strong>the</strong><br />
excav<strong>at</strong>ion process will gener<strong>at</strong>e a high yield <strong>of</strong> basaltic m<strong>at</strong>erial large enough for primary<br />
armor stone on exposed faces <strong>of</strong> <strong>the</strong> island.<br />
Agglomer<strong>at</strong>e<br />
Excav<strong>at</strong>ion <strong>of</strong> agglomer<strong>at</strong>e is projected along <strong>the</strong> alignment from St<strong>at</strong>ion 1+500 through<br />
7+000, approxim<strong>at</strong>ely. The sound agglomer<strong>at</strong>e <strong>of</strong> <strong>the</strong> Pedro Miguel Form<strong>at</strong>ion is medium<br />
strong to strong, and its durability varies. The m<strong>at</strong>rix <strong>of</strong> <strong>the</strong> agglomer<strong>at</strong>e can locally be<br />
more tuffaceous; hence, it will be more erodable and less durable. The average strength<br />
resulting from point load tests performed by ACP was approxim<strong>at</strong>ely 30 MPa. The typical<br />
joint spacing <strong>of</strong> <strong>the</strong> agglomer<strong>at</strong>e is close to wi<strong>de</strong> (0.6 to 2.0 meters).<br />
Final Report 3-12 May 2004
Several boring logs indic<strong>at</strong>e th<strong>at</strong> <strong>the</strong> agglomer<strong>at</strong>e exhibits a ten<strong>de</strong>ncy to hydr<strong>at</strong>e, swell,<br />
and disintegr<strong>at</strong>e upon exposure to air. However, ACP geologists 5 consi<strong>de</strong>r th<strong>at</strong> <strong>the</strong>se<br />
comments on <strong>the</strong> logs are questionable. Additional testing is <strong>the</strong>refore recommen<strong>de</strong>d in<br />
or<strong>de</strong>r to obtain a better un<strong>de</strong>rstanding <strong>of</strong> its durability:<br />
It is expected th<strong>at</strong> well-<strong>de</strong>signed blasts will produce angular pieces th<strong>at</strong> typically gra<strong>de</strong><br />
from a few millimeters to one meter with some pieces larger than one meter. D<strong>at</strong>a on<br />
specific gravity <strong>of</strong> <strong>the</strong> agglomer<strong>at</strong>e is provi<strong>de</strong>d in<br />
Table 3-1. If fur<strong>the</strong>r testing confirms <strong>the</strong> expect<strong>at</strong>ions th<strong>at</strong> <strong>the</strong> agglomer<strong>at</strong>e is durable,<br />
<strong>the</strong>se larger pieces may be used for primary armor. Altern<strong>at</strong>ively, <strong>the</strong>y may be used for<br />
un<strong>de</strong>rw<strong>at</strong>er rock fill up to <strong>the</strong> size th<strong>at</strong> can be handled by <strong>the</strong> equipment or broken down<br />
fur<strong>the</strong>r by blasting or hoe-ramming.<br />
Test blasts are recommen<strong>de</strong>d in <strong>the</strong> early stages <strong>of</strong> <strong>the</strong> excav<strong>at</strong>ions in <strong>the</strong> agglomer<strong>at</strong>e to<br />
<strong>de</strong>termine <strong>the</strong> blast hole spacing and pow<strong>de</strong>r factor th<strong>at</strong> yield a grad<strong>at</strong>ion th<strong>at</strong> is suitable<br />
for <strong>the</strong> fills and provi<strong>de</strong>s a level <strong>of</strong> rock fragment<strong>at</strong>ion th<strong>at</strong> m<strong>at</strong>ches <strong>the</strong> construction<br />
requirements for <strong>the</strong> island and transport<strong>at</strong>ion system adopted by <strong>the</strong> selected contractor.<br />
Any agglomer<strong>at</strong>e th<strong>at</strong> is found to be non-durable can be fragmented by blasting or broken<br />
down during handling and used as compacted soil fill, rail bed fill m<strong>at</strong>erial or above w<strong>at</strong>er<br />
fill m<strong>at</strong>erial in <strong>the</strong> island.<br />
Sedimentary Rocks<br />
Sedimentary rocks will be <strong>de</strong>rived from several form<strong>at</strong>ions in <strong>the</strong> excav<strong>at</strong>ion area.<br />
Interbed<strong>de</strong>d sandstone, siltstone, conglomer<strong>at</strong>e, and tuffaceous beds <strong>of</strong> varying thickness<br />
comprise <strong>the</strong> La Boca Form<strong>at</strong>ion. The Cucaracha Form<strong>at</strong>ion is predominantly shale with<br />
local sandstone or conglomer<strong>at</strong>e layers. The Pedro Miguel Form<strong>at</strong>ion sporadically<br />
contains tuff layers. Excav<strong>at</strong>ion <strong>of</strong> sedimentary rocks is projected along <strong>the</strong> alignment<br />
from approxim<strong>at</strong>ely St<strong>at</strong>ion 1+000 through 4+000, St<strong>at</strong>ion 6+000 through 6+400, St<strong>at</strong>ion<br />
6+900 through 7+600, and St<strong>at</strong>ion 8+300 through 10+000.<br />
The sedimentary rocks within <strong>the</strong> excav<strong>at</strong>ion area are typically s<strong>of</strong>t to medium s<strong>of</strong>t and <strong>of</strong><br />
weak to mo<strong>de</strong>r<strong>at</strong>e strength. The average strength resulting from point load tests<br />
performed by ACP was approxim<strong>at</strong>ely 10 MPa. In addition, <strong>the</strong>y exhibit a ten<strong>de</strong>ncy to<br />
hydr<strong>at</strong>e, swell, and disintegr<strong>at</strong>e upon exposure to air. It is expected th<strong>at</strong> <strong>the</strong> sedimentary<br />
rocks will be excav<strong>at</strong>ed primarily by ripping. Locally har<strong>de</strong>r or more massive zones <strong>of</strong><br />
conglomer<strong>at</strong>e and sandstone may require blasting. Particle sizes from <strong>the</strong> excav<strong>at</strong>ion<br />
oper<strong>at</strong>ions are expected to range from a few millimeters to a meter. With handling and<br />
exposure to moisture, <strong>the</strong> smaller particles are likely to breakdown fur<strong>the</strong>r into silt and fine<br />
sand sizes.<br />
5 Discussions with ACP geologist Pastora Franceschi<br />
Final Report 3-13 May 2004
The poor durability <strong>of</strong> <strong>the</strong>se m<strong>at</strong>erials will limit <strong>the</strong>ir use in construction to above w<strong>at</strong>er fill<br />
or access corridor fill. They should be tre<strong>at</strong>ed like soil m<strong>at</strong>erials and compacted in layers<br />
less than 300 mm thick. This will require <strong>the</strong> removal or fragment<strong>at</strong>ion <strong>of</strong> pieces larger<br />
than 150 mm.<br />
Overbur<strong>de</strong>n<br />
Overbur<strong>de</strong>n m<strong>at</strong>erials inclu<strong>de</strong> we<strong>at</strong>hered rock, residual soil, and fill m<strong>at</strong>erial <strong>de</strong>rived from<br />
previous canal excav<strong>at</strong>ion. Since <strong>the</strong>se are surface m<strong>at</strong>erials, <strong>the</strong>y will be <strong>the</strong> first to be<br />
removed in <strong>the</strong> excav<strong>at</strong>ion process and cannot be moved to <strong>the</strong> island construction site<br />
until <strong>the</strong> fill process is well advanced.<br />
Through consi<strong>de</strong>r<strong>at</strong>ion <strong>of</strong> <strong>the</strong> plastic limit as an approxim<strong>at</strong>ion <strong>of</strong> optimum moisture<br />
content, soil samples 10% wetter than optimum moisture content are likely to be<br />
unsuitable for use as compacted fill. Based on this criterion, an estim<strong>at</strong>ed one-third <strong>of</strong> <strong>the</strong><br />
overbur<strong>de</strong>n will be unsuitable for construction purposes. It is anticip<strong>at</strong>ed th<strong>at</strong> <strong>the</strong><br />
unsuitable soil types th<strong>at</strong> will be encountered most frequently during excav<strong>at</strong>ion are silts,<br />
sands, and clays <strong>of</strong> high moisture content. These soils will serve no practical use in<br />
construction <strong>of</strong> <strong>the</strong> artificial island. However <strong>the</strong>y can serve as base m<strong>at</strong>erial for<br />
landscaping or site restor<strong>at</strong>ion where n<strong>at</strong>ural reveget<strong>at</strong>ion is to be used.<br />
Some <strong>of</strong> <strong>the</strong> overbur<strong>de</strong>n may also be excav<strong>at</strong>ed by dredging. Because <strong>of</strong> its high<br />
moisture content, dredged m<strong>at</strong>erial will not be suitable for use in <strong>the</strong> artificial island and<br />
should be consi<strong>de</strong>red waste m<strong>at</strong>erial. However, as noted above, it may be used as<br />
surface cover for re-veget<strong>at</strong>ion and n<strong>at</strong>ural growth erosion protection purposes.<br />
3.3 M<strong>at</strong>erials Volumes<br />
The approxim<strong>at</strong>e l<strong>at</strong>eral extents <strong>of</strong> basalt, agglomer<strong>at</strong>e, and sedimentary rocks bene<strong>at</strong>h<br />
<strong>the</strong> overbur<strong>de</strong>n are presented on Figure 3-2. In addition, approxim<strong>at</strong>e vertical extents <strong>of</strong><br />
<strong>the</strong>se m<strong>at</strong>erials and <strong>of</strong> overbur<strong>de</strong>n soils may be inferred from <strong>the</strong> ACP geologic pr<strong>of</strong>iles.<br />
The expected in situ 6 volume <strong>of</strong> each <strong>of</strong> <strong>the</strong> major c<strong>at</strong>egories <strong>of</strong> m<strong>at</strong>erial is presented in<br />
Table 3-3, below. A more <strong>de</strong>tailed explan<strong>at</strong>ion <strong>of</strong> <strong>the</strong> calcul<strong>at</strong>ion process and<br />
comput<strong>at</strong>ions is presented in Appendix A <strong>of</strong> Volume 3 <strong>of</strong> this report.<br />
6 Volume before applic<strong>at</strong>ion <strong>of</strong> bulking or shrinkage factors are applied.<br />
Final Report 3-14 May 2004
Table 3-3: Estim<strong>at</strong>ed Volumes <strong>of</strong> Primary Excav<strong>at</strong>ion M<strong>at</strong>erials C<strong>at</strong>egories<br />
M<strong>at</strong>erial Classific<strong>at</strong>ion<br />
Expected Volume (m3)<br />
Basalts 19,110,426<br />
Agglomer<strong>at</strong>es 18,476,429<br />
Sedimentary Rock 7,018,950<br />
Overbur<strong>de</strong>n 24,744,194<br />
Total 69, 350,000<br />
3.4 Bulking and Shrinkage Factors<br />
Prior to excav<strong>at</strong>ion, in situ rock typically has a <strong>de</strong>nsity similar to <strong>the</strong> specific gravity <strong>of</strong> <strong>the</strong><br />
rock as it has little to no air space within <strong>the</strong> rock mass. Upon blasting or ripping, <strong>the</strong> rock<br />
mass breaks into discrete particles <strong>of</strong> rock which are piled randomly against each o<strong>the</strong>r.<br />
This causes bulking <strong>of</strong> <strong>the</strong> m<strong>at</strong>erial, as <strong>the</strong>re are voids between contact points <strong>of</strong> <strong>the</strong> rock<br />
fragments. For this project, bulking factors are expected to be on <strong>the</strong> or<strong>de</strong>r <strong>of</strong> 30% to 40%<br />
for <strong>the</strong> basalt and agglomer<strong>at</strong>e. For <strong>the</strong> sedimentary rocks, which will break down into<br />
smaller pieces more readily, <strong>the</strong> bulking factors should be in <strong>the</strong> range <strong>of</strong> 10% to 20%.<br />
Volume <strong>de</strong>creases are expected for <strong>the</strong> overbur<strong>de</strong>n m<strong>at</strong>erial. Factors affecting <strong>the</strong><br />
amount <strong>of</strong> shrinkage inclu<strong>de</strong> <strong>the</strong> rel<strong>at</strong>ive <strong>de</strong>nsity between <strong>the</strong> borrow and fill m<strong>at</strong>erials,<br />
losses <strong>of</strong> m<strong>at</strong>erial during transport<strong>at</strong>ion, and settlement <strong>of</strong> <strong>the</strong> m<strong>at</strong>erial. No projectspecific<br />
d<strong>at</strong>a is available for estim<strong>at</strong>ing shrinkage factors, but based on experience on<br />
o<strong>the</strong>r projects, shrinkage in <strong>the</strong> range <strong>of</strong> 15 to 20%, is expected, excluding losses due to<br />
settlement.<br />
3.5 Excav<strong>at</strong>ion Program<br />
At this time, <strong>the</strong> <strong>de</strong>tailed schedule for prepar<strong>at</strong>ion <strong>of</strong> <strong>the</strong> final <strong>de</strong>signs, acquisition <strong>of</strong><br />
finance, approvals, and construction <strong>of</strong> <strong>the</strong> new Locks has not been finalized. In<br />
discussions with ACP project staff, it was agreed th<strong>at</strong> transport productivity r<strong>at</strong>es would be<br />
computed on <strong>the</strong> expect<strong>at</strong>ion th<strong>at</strong> <strong>the</strong> excav<strong>at</strong>ion program would cover a five year period.<br />
Final Report 3-15 May 2004
Within this time period, it was also consi<strong>de</strong>red th<strong>at</strong> <strong>the</strong> excav<strong>at</strong>ion sequence would be<br />
un<strong>de</strong>rtaken to respond to <strong>the</strong> following priorities.<br />
1. Removal <strong>of</strong> Overbur<strong>de</strong>n m<strong>at</strong>erial and surface clearance in <strong>the</strong> Locks area<br />
2. Immedi<strong>at</strong>e Locks construction zone<br />
3. W<strong>at</strong>er savings basins areas<br />
4. Entrance and Exit channels to new locks<br />
5. Final cuts to Gaillard Cut and Pacific Entrance reaches<br />
Elements 1 through 4 would all be accomplished in <strong>the</strong> dry, while <strong>the</strong> final linking <strong>of</strong> <strong>the</strong><br />
locks to <strong>the</strong> main <strong>Canal</strong> reaches would be un<strong>de</strong>rtaken by marine equipment. According to<br />
earlier reports, this <strong>the</strong>n implies th<strong>at</strong> approxim<strong>at</strong>ely 90 percent <strong>of</strong> <strong>the</strong> total volume <strong>of</strong><br />
m<strong>at</strong>erial would be excav<strong>at</strong>ed un<strong>de</strong>r dry conditions.<br />
This schedule and exten<strong>de</strong>d length <strong>of</strong> <strong>the</strong> overall excav<strong>at</strong>ion zone <strong>the</strong>n dict<strong>at</strong>es th<strong>at</strong> <strong>the</strong><br />
m<strong>at</strong>erials transport system will need to serve multiple work faces and different m<strong>at</strong>erials <strong>at</strong><br />
<strong>the</strong> same time, without interference with <strong>the</strong> main construction elements <strong>of</strong> <strong>the</strong> project.<br />
If it is assumed th<strong>at</strong> work would commence on <strong>the</strong> Locks project by l<strong>at</strong>e 2005, filling <strong>of</strong> <strong>the</strong><br />
island should <strong>the</strong>n be completed by approxim<strong>at</strong>ely 2010, unless m<strong>at</strong>erial was to be placed<br />
in a large stockpile and re-handled <strong>at</strong> a l<strong>at</strong>er d<strong>at</strong>e.<br />
Finally, it should be noted th<strong>at</strong> for any land based transport<strong>at</strong>ion system, a haul corridor<br />
must be prepared and installed before any significant quantities <strong>of</strong> m<strong>at</strong>erial can be<br />
removed from <strong>the</strong> excav<strong>at</strong>ion area. This <strong>the</strong>n places <strong>the</strong> selection and <strong>de</strong>sign <strong>of</strong> <strong>the</strong><br />
disposal area on <strong>the</strong> critical p<strong>at</strong>h for <strong>the</strong> overall Locks project.<br />
Final Report 3-16 May 2004
4 SITE CHARACTERIZATION STUDIES<br />
Landsi<strong>de</strong> and marine field investig<strong>at</strong>ions were carried out to cover <strong>the</strong> potential loc<strong>at</strong>ions<br />
for <strong>the</strong> island and also <strong>the</strong> corridor expected to be used to move m<strong>at</strong>erials from <strong>the</strong><br />
excav<strong>at</strong>ion site to <strong>the</strong> island.<br />
In all cases, <strong>the</strong> field work was un<strong>de</strong>rtaken by ACP directly with assistance and<br />
coordin<strong>at</strong>ion by <strong>the</strong> consultants. Specific field work campaigns <strong>de</strong>scribed in <strong>the</strong> following<br />
sections inclu<strong>de</strong>d:<br />
Land si<strong>de</strong> Investig<strong>at</strong>ions<br />
• Topography <strong>of</strong> proposed rail or haul corridor<br />
• Trial pits and boreholes along haul corridor<br />
Marine Site Characteriz<strong>at</strong>ion Studies<br />
• B<strong>at</strong>hymetry <strong>of</strong> study area<br />
• Current metering and tidal measurements<br />
• Geophysical and si<strong>de</strong> scan surveys <strong>of</strong> study area<br />
In addition to <strong>the</strong>se investig<strong>at</strong>ions, <strong>the</strong> consulting team also carried out marine<br />
environmental sampling and socio economic field work for <strong>the</strong> Disposal <strong>Study</strong> mentioned<br />
earlier. The results <strong>of</strong> <strong>the</strong>se field investig<strong>at</strong>ions are pertinent to this <strong>Island</strong> <strong>Study</strong> and<br />
inclu<strong>de</strong>d:<br />
• W<strong>at</strong>er Quality and sediment sampling for marine sectors<br />
• Socio economic evalu<strong>at</strong>ion fields trips<br />
4.1 B<strong>at</strong>hymetry<br />
As shown in Figure 4-1, <strong>the</strong> usually consi<strong>de</strong>red Sou<strong>the</strong>rn limits <strong>of</strong> <strong>the</strong> Gulf <strong>of</strong> Panama are<br />
Punta Mala on <strong>the</strong> West and Punta Piñas to <strong>the</strong> East. The line between <strong>the</strong>se two points<br />
is very close to <strong>the</strong> 7.5 o N L<strong>at</strong>itu<strong>de</strong> line, and has an approxim<strong>at</strong>e length <strong>of</strong> 200 km. At this<br />
loc<strong>at</strong>ion <strong>the</strong> <strong>de</strong>pth is approxim<strong>at</strong>ely 200 m. Southwards <strong>the</strong> <strong>de</strong>pth increases steeply to<br />
1000 m. and more, right outsi<strong>de</strong> <strong>the</strong> Gulf entrance. Northwards, a gradual <strong>de</strong>crease <strong>of</strong> <strong>the</strong><br />
<strong>de</strong>pth is broken by Las Perlas <strong>Island</strong>s. At <strong>the</strong> western part <strong>of</strong> <strong>the</strong> Gulf extensive mud fl<strong>at</strong>s<br />
with small slopes can be observed.<br />
Final Report 4-1 May 2004
4.1.1 Inshore B<strong>at</strong>hymetric Surveys<br />
Three b<strong>at</strong>hymetric campaigns were un<strong>de</strong>rtaken in <strong>the</strong> area <strong>of</strong> interest for <strong>the</strong> Artificial<br />
<strong>Island</strong>. The first two surveys were taken by ACP in 1999 and 2000 as part <strong>of</strong> <strong>the</strong><br />
evalu<strong>at</strong>ion <strong>of</strong> <strong>the</strong> Anchorage areas, but did not fully extend to <strong>the</strong> western limits <strong>of</strong> <strong>the</strong><br />
area un<strong>de</strong>r consi<strong>de</strong>r<strong>at</strong>ion for <strong>the</strong> island construction.<br />
The third survey was un<strong>de</strong>rtaken in January 2003 as part <strong>of</strong> <strong>the</strong> geophysical survey<br />
discussed below with <strong>the</strong> instrument<strong>at</strong>ion cross linked to <strong>the</strong> si<strong>de</strong> scan sonar and seismic<br />
reflector equipment to ensure consistency <strong>of</strong> each element <strong>of</strong> <strong>the</strong> survey.<br />
The results <strong>of</strong> <strong>the</strong> three surveys were also compared with d<strong>at</strong>a from <strong>the</strong> navig<strong>at</strong>ion charts<br />
and in general, a close approxim<strong>at</strong>ion was observed between <strong>the</strong> published d<strong>at</strong>a and <strong>the</strong><br />
ACP survey results.<br />
Figure 4-2 shows <strong>the</strong> bottom contours <strong>of</strong> <strong>the</strong> inshore study area, according to <strong>the</strong><br />
b<strong>at</strong>hymetry gener<strong>at</strong>ed during <strong>the</strong> geophysical survey work carried out in 2003. It is seen<br />
th<strong>at</strong> <strong>the</strong> bottom slopes gently and consistently from <strong>the</strong> shoreline with maximum <strong>de</strong>pths <strong>of</strong><br />
approxim<strong>at</strong>ely 20 m below MLWS to be encountered close to <strong>the</strong> nor<strong>the</strong>rn shores <strong>of</strong><br />
Taboga island.<br />
Final Report 4-2 May 2004
Figure 4-1: B<strong>at</strong>hymetry <strong>of</strong> Panama Bay<br />
11x17<br />
Use Fig 3-1 from Hydro Baseline <strong>Study</strong><br />
Final Report 4-3 May 2004
--- THIS PAGE INTENTIONALLY BLANK ---<br />
Final Report 4-4 May 2004
Figure 4-2: B<strong>at</strong>hymetry <strong>of</strong> <strong>Island</strong> <strong>Study</strong> Area - January 2003.<br />
Use b<strong>at</strong>hymetric figure from Gol<strong>de</strong>r Geophysical survey<br />
Final Report 4-5 May 2004
4.2 Topography<br />
A preferred route was i<strong>de</strong>ntified for <strong>the</strong> corridor from <strong>the</strong> excav<strong>at</strong>ion area to <strong>the</strong> proposed<br />
causeway connection point as part <strong>of</strong> <strong>the</strong> Preliminary <strong>Study</strong> carried out in 2001. However,<br />
this analysis was based on topography from aerial photography and some inconsistencies<br />
were noted during <strong>the</strong> early field visits, particularly in areas <strong>of</strong> heavy tree cover.<br />
ACP <strong>the</strong>refore un<strong>de</strong>rtook a topographical survey <strong>of</strong> <strong>the</strong> entire route, covering a width <strong>of</strong><br />
200 m ei<strong>the</strong>r si<strong>de</strong> <strong>of</strong> <strong>the</strong> preferred centreline, in or<strong>de</strong>r to provi<strong>de</strong> a basis for <strong>the</strong> evalu<strong>at</strong>ion<br />
<strong>of</strong> altern<strong>at</strong>ive transport systems.<br />
The coverage <strong>of</strong> <strong>the</strong> topographic survey is indic<strong>at</strong>ed in Figure 4-3 on <strong>the</strong> following page.<br />
Fur<strong>the</strong>r <strong>de</strong>tails <strong>of</strong> <strong>the</strong> results <strong>of</strong> <strong>the</strong> survey are presented in <strong>the</strong> discussions on<br />
transport<strong>at</strong>ion altern<strong>at</strong>ives and concepts for <strong>the</strong> m<strong>at</strong>erials transport<strong>at</strong>ion and stockpiling<br />
systems.<br />
All mapping and comput<strong>at</strong>ion for <strong>the</strong> transport<strong>at</strong>ion corridor to <strong>the</strong> island are based on <strong>the</strong><br />
results <strong>of</strong> <strong>the</strong> 2003 topographic survey carried out by ACP.<br />
Final Report 4-6 May 2004
Figure 4-3: Coverage Area - Topographic Survey <strong>of</strong> M<strong>at</strong>erials Transport Corridor<br />
Final Report 4-7 May 2004
4.3 Geophysical<br />
4.3.1 Introduction<br />
A key factor in <strong>the</strong> loc<strong>at</strong>ion and cost comput<strong>at</strong>ions for <strong>the</strong> island is <strong>the</strong> un<strong>de</strong>rstanding <strong>of</strong><br />
<strong>the</strong> bottom and sub bottom conditions within <strong>the</strong> area <strong>of</strong> interest for <strong>the</strong> project.<br />
The general n<strong>at</strong>ure <strong>of</strong> <strong>the</strong> shoreline, Taboga <strong>Island</strong> and <strong>the</strong> rocky islands in <strong>the</strong> study area<br />
are an indic<strong>at</strong>ion th<strong>at</strong> rock will be encountered <strong>at</strong> varying <strong>de</strong>pths below <strong>the</strong> sea bed in <strong>the</strong><br />
study area. Work contracted by <strong>the</strong> Panama <strong>Canal</strong> Commission (PCC) along <strong>the</strong> Pacifi<br />
channel in 1999 7 indic<strong>at</strong>ed th<strong>at</strong> an<strong>de</strong>sites and basaltic rock could be encountered <strong>at</strong><br />
<strong>de</strong>pths <strong>of</strong> approxim<strong>at</strong>ely 15 m below MLWS 8 . Earlier work on <strong>the</strong> construction <strong>of</strong> <strong>the</strong> Port<br />
<strong>of</strong> Vacamonte 9 also indic<strong>at</strong>ed th<strong>at</strong> similar m<strong>at</strong>erial is encountered <strong>at</strong> <strong>de</strong>pths <strong>of</strong> 7.00 to<br />
10.00 m below MLWS and <strong>the</strong>se two boundary conditions were used as a basis for<br />
preliminary geotechnical and cost comput<strong>at</strong>ions for <strong>the</strong> Preliminary <strong>Study</strong> report prepared<br />
in 2001.<br />
At this feasibility study level, a higher level <strong>of</strong> confi<strong>de</strong>nce is required in or<strong>de</strong>r to optimize<br />
<strong>the</strong> island loc<strong>at</strong>ion and to compute dredging and o<strong>the</strong>r costs. Consequently ACP, in<br />
conjunction with <strong>the</strong> consultants, prepared a program <strong>of</strong> wash probes and boreholes to<br />
obtain a characteriz<strong>at</strong>ion <strong>of</strong> <strong>the</strong> sea bed and sub bottom m<strong>at</strong>erials in <strong>the</strong> project area.<br />
Unfortun<strong>at</strong>ely, <strong>the</strong> cost proposals for this work were extremely high and it was <strong>de</strong>ci<strong>de</strong>d<br />
th<strong>at</strong> a geophysical survey would provi<strong>de</strong> a more <strong>de</strong>tailed mapping <strong>of</strong> <strong>the</strong> sub bottom<br />
m<strong>at</strong>erials <strong>at</strong> a much reduced cost. Since ACP already owned a sub bottom pr<strong>of</strong>iler and<br />
o<strong>the</strong>r equipment, <strong>the</strong> marine geophysical investig<strong>at</strong>ions were un<strong>de</strong>rtaken as a joint<br />
exercise using ACP equipment and personnel, in conjunction with equipment and senior<br />
geophysical specialists from Gol<strong>de</strong>r Associ<strong>at</strong>es.<br />
Following an initial training period <strong>of</strong> one week in early January 2003, <strong>the</strong> field work was<br />
un<strong>de</strong>rtaken by ACP personnel from January 9th to February 6th, 2003 and covered some<br />
125 km 2 as shown in Figure 4-4. D<strong>at</strong>a analysis was performed concurrently with <strong>the</strong> field<br />
program, in or<strong>de</strong>r to modify survey techniques or i<strong>de</strong>ntify areas <strong>of</strong> special interest. Full<br />
d<strong>at</strong>a acquisition followed <strong>the</strong> survey work by approxim<strong>at</strong>ely two weeks. The d<strong>at</strong>a were<br />
analyzed by GAI geophysicists <strong>at</strong> <strong>the</strong>ir Redmond, Washington <strong>of</strong>fice.<br />
7 Seismic Survey Panama <strong>Canal</strong> Buoy 1 to 21, Coastal and Inland Marine Services Inc for Panama<br />
<strong>Canal</strong> Commission, November 1999<br />
8 Mean Low W<strong>at</strong>er Spring Ti<strong>de</strong>s<br />
9 Field Investig<strong>at</strong>ions for Vacamonte Fishing Port, Livesey & Hen<strong>de</strong>rson, 1974 to 1976<br />
Final Report 4-8 May 2004
Figure 4-4: Geophysical Survey Coverage Area<br />
Insert coverage map from Gol<strong>de</strong>r Report<br />
Final Report 4-9 May 2004
4.3.2 Survey Objectives<br />
The specific objectives <strong>of</strong> <strong>the</strong> marine geophysical survey were to:<br />
• Provi<strong>de</strong> <strong>de</strong>tailed characteriz<strong>at</strong>ion <strong>of</strong> physical fe<strong>at</strong>ures <strong>of</strong> <strong>the</strong> seafloor.<br />
• Map <strong>the</strong> thickness <strong>of</strong> unconsolid<strong>at</strong>ed sediment overlying bedrock.<br />
• Provi<strong>de</strong> general characteriz<strong>at</strong>ion <strong>of</strong> <strong>the</strong> n<strong>at</strong>ure <strong>of</strong> <strong>the</strong> unconsolid<strong>at</strong>ed<br />
sediment.<br />
• Map <strong>the</strong> <strong>de</strong>pth to <strong>the</strong> top <strong>of</strong> bedrock.<br />
4.3.3 Field Oper<strong>at</strong>ions & Instrument<strong>at</strong>ion<br />
The marine investig<strong>at</strong>ion used <strong>the</strong> following geophysical methods to achieve <strong>the</strong> project<br />
objectives:<br />
• Precision echo sounding<br />
• Si<strong>de</strong> scanning sonar<br />
• Seismic reflection pr<strong>of</strong>iling<br />
The site is approxim<strong>at</strong>ely 12 km in length (north to south) and 10 km in width (east to<br />
west). The d<strong>at</strong>a were obtained on a grid p<strong>at</strong>tern, consisting <strong>of</strong> a series <strong>of</strong> survey<br />
transects, spaced <strong>at</strong> an interval <strong>of</strong> 250m over <strong>the</strong> entire site.<br />
The survey was conducted on board a 10m hydrographic survey vessel, owned and<br />
oper<strong>at</strong>ed by ACP which also provi<strong>de</strong>d navig<strong>at</strong>ion and echo sounding equipment. The<br />
navig<strong>at</strong>ion and b<strong>at</strong>hymetric d<strong>at</strong>a were obtained with an integr<strong>at</strong>ed and autom<strong>at</strong>ed<br />
hydrographic system th<strong>at</strong> provi<strong>de</strong>d real-time on-line navig<strong>at</strong>ion and positioning <strong>of</strong> <strong>the</strong><br />
survey vessel. The hydrographic instrument<strong>at</strong>ion consisted <strong>of</strong> a Trimble 4000SE<br />
Differential GPS receiver, Coastal Oceanographic Hypack navig<strong>at</strong>ion s<strong>of</strong>tware and Odom<br />
Echotrack precision echo soun<strong>de</strong>r.<br />
The differential global positioning system (DGPS) was used to <strong>de</strong>termine <strong>the</strong> vessel’s<br />
loc<strong>at</strong>ion in real-time, and to plot <strong>the</strong> position along <strong>the</strong> survey lines. The pre-plotted<br />
survey lines, and <strong>the</strong> actual survey lines traversed by <strong>the</strong> vessel, were displayed in realtime<br />
on a vi<strong>de</strong>o monitor. The navig<strong>at</strong>ion computer transmitted event marks to <strong>the</strong><br />
geophysical recording instruments every 60 seconds. The navig<strong>at</strong>ion d<strong>at</strong>a, and event<br />
marks were digitally recor<strong>de</strong>d and used to produce <strong>the</strong> survey trackline maps nee<strong>de</strong>d for<br />
<strong>the</strong> d<strong>at</strong>a analysis task.<br />
Final Report 4-10 May 2004
Geophysical Instrument<strong>at</strong>ion<br />
The geophysical instruments were installed on <strong>the</strong> survey vessel <strong>at</strong> <strong>the</strong> ACP marine dock<br />
loc<strong>at</strong>ed near <strong>the</strong> Bridge <strong>of</strong> <strong>the</strong> Americas. Calibr<strong>at</strong>ion and checkout <strong>of</strong> <strong>the</strong> instruments was<br />
done in <strong>the</strong> harbor prior to beginning survey training and oper<strong>at</strong>ions on <strong>the</strong> following day.<br />
There was no loss <strong>of</strong> survey time resulting from failure <strong>of</strong> <strong>the</strong> seismic reflection<br />
instrument<strong>at</strong>ion and <strong>the</strong> overall quality <strong>of</strong> <strong>the</strong> d<strong>at</strong>a was very good to excellent.<br />
Si<strong>de</strong>scan Sonar<br />
Si<strong>de</strong>scan sonar produces an acoustic image <strong>of</strong> <strong>the</strong> seabed th<strong>at</strong> is analogous to an aerial<br />
photograph on land. The plan view image provi<strong>de</strong>s aerial inform<strong>at</strong>ion on <strong>the</strong> n<strong>at</strong>ure <strong>of</strong><br />
seabed sediment (silt, sand, gravel); i<strong>de</strong>ntifies <strong>the</strong> presence <strong>of</strong> rock or o<strong>the</strong>r fe<strong>at</strong>ures,<br />
including cultural artifacts, th<strong>at</strong> project above <strong>the</strong> seabed, and provi<strong>de</strong>s inform<strong>at</strong>ion on<br />
potential geohazards such as submarine sli<strong>de</strong>s or fault lineaments.<br />
The si<strong>de</strong>scan sonar d<strong>at</strong>a were acquired with a Klein 3000 system oper<strong>at</strong>ing <strong>at</strong> a frequency<br />
<strong>of</strong> 100 kHz. The si<strong>de</strong>scan transducer was suspen<strong>de</strong>d from a davit loc<strong>at</strong>ed on <strong>the</strong> port si<strong>de</strong><br />
<strong>of</strong> <strong>the</strong> survey vessel and lowered 2 to 3m below <strong>the</strong> sea surface. The d<strong>at</strong>a were stored<br />
digitally and also displayed in real-time on a <strong>the</strong>rmal graphic recor<strong>de</strong>r.<br />
Subsurface Reflection Pr<strong>of</strong>iling Systems<br />
A subbottom pr<strong>of</strong>iler and a seismic reflection system were used to characterize and map<br />
<strong>the</strong> thickness <strong>of</strong> <strong>the</strong> marine sediment. The difference in <strong>the</strong> acoustic characteristic <strong>of</strong><br />
<strong>the</strong>se two instruments provi<strong>de</strong>s a means to qualit<strong>at</strong>ively characterize <strong>the</strong> n<strong>at</strong>ure <strong>of</strong> <strong>the</strong><br />
sediment and to maximize resolution and subsurface penetr<strong>at</strong>ion.<br />
Subsurface reflection pr<strong>of</strong>iling uses acoustic pulses, emitted <strong>at</strong> regular intervals by an<br />
acoustic energy source, to image subbottom str<strong>at</strong>igraphy and geology. The transmitted<br />
acoustic pulses reflect from <strong>the</strong> seabed and un<strong>de</strong>rlying geology or str<strong>at</strong>igraphy and are<br />
received by ei<strong>the</strong>r a transmitting transducer (subbottom pr<strong>of</strong>iler, SBP) or a surface-towed<br />
hydrophone (high-resolution seismic reflection pr<strong>of</strong>iler). The transducer or hydrophone<br />
converts <strong>the</strong> acoustic pressure waves into electrical signals th<strong>at</strong> are processed and<br />
displayed on a graphic recor<strong>de</strong>r on board <strong>the</strong> survey vessel. This display, <strong>the</strong> seismic<br />
reflection record, is an acoustical pr<strong>of</strong>ile <strong>of</strong> <strong>the</strong> seabed and subbottom str<strong>at</strong>igraphy or<br />
sediment layers along <strong>the</strong> survey trackline.<br />
The l<strong>at</strong>eral and vertical distribution <strong>of</strong> fine to medium-grained sediment was mapped with<br />
a Klein subbottom pr<strong>of</strong>iler. This system, which oper<strong>at</strong>es <strong>at</strong> a frequency <strong>of</strong> 3 to 5 kHz<br />
provi<strong>de</strong>s very high-resolution (able to image thin layers <strong>of</strong> sediment) inform<strong>at</strong>ion but only<br />
achieves limited subsurface penetr<strong>at</strong>ion in medium or coarse-grained sediment (less than<br />
1 to 2 meters). The transducer was suspen<strong>de</strong>d from a davit on <strong>the</strong> port si<strong>de</strong> <strong>of</strong> <strong>the</strong> survey<br />
vessel and <strong>de</strong>ployed approxim<strong>at</strong>ely 2 to 5 meters below <strong>the</strong> w<strong>at</strong>er surface.<br />
Final Report 4-11 May 2004
High-resolution seismic reflection d<strong>at</strong>a were collected with an Applied Acoustic<br />
Engineering Mo<strong>de</strong>l 500 system. This rel<strong>at</strong>ively low frequency system (800Hz to 2 KHz)) is<br />
capable <strong>of</strong> much <strong>de</strong>eper penetr<strong>at</strong>ion than <strong>the</strong> SBP, particularly in coarse-grained<br />
sediment. At this site <strong>the</strong> maximum subsurface penetr<strong>at</strong>ion achieved with this system was<br />
estim<strong>at</strong>ed to be 28 m below <strong>the</strong> seabed.<br />
Hydrojet Probing Calibr<strong>at</strong>ion<br />
A hydrojet probe, using a Honda high-pressure w<strong>at</strong>er pump and lightweight pipes was<br />
used to verify <strong>the</strong> interpret<strong>at</strong>ion <strong>of</strong> <strong>the</strong> geophysical reflection d<strong>at</strong>a. Seven sites were<br />
selected for probing to <strong>de</strong>termine <strong>the</strong> thickness <strong>of</strong> unconsolid<strong>at</strong>ed sediment overlying<br />
bedrock. The results from <strong>the</strong> probing were compared with <strong>the</strong> sediment thickness values<br />
on <strong>the</strong> isopach map <strong>at</strong> each <strong>of</strong> <strong>the</strong> probe st<strong>at</strong>ions.<br />
4.3.4 Geophysical Interpret<strong>at</strong>ion <strong>of</strong> Results<br />
B<strong>at</strong>hymetry<br />
Although ACP had carried out recent b<strong>at</strong>hymetric surveys <strong>of</strong> <strong>the</strong> study area, <strong>the</strong> on board<br />
equipment for <strong>the</strong> geophysical survey provi<strong>de</strong>d new inform<strong>at</strong>ion th<strong>at</strong> was integr<strong>at</strong>ed with<br />
<strong>the</strong> o<strong>the</strong>r d<strong>at</strong>a inputs from <strong>the</strong> project.<br />
As can be seen in Figure 4-5, <strong>the</strong> w<strong>at</strong>er <strong>de</strong>pth in <strong>the</strong> survey area ranged from<br />
approxim<strong>at</strong>ely 1m to 18m across <strong>the</strong> survey area with <strong>the</strong> presence <strong>of</strong> occasional bedrock<br />
pinnacles or small islands. The seafloor gradient is extremely low having a maximum<br />
value <strong>of</strong> 1:250. With <strong>the</strong> exception <strong>of</strong> <strong>the</strong> small pinnacles or islands and <strong>the</strong> dredge<br />
disposal zone shown in <strong>the</strong> figure, <strong>the</strong>re were no abrupt changes in <strong>the</strong> seafloor gradient<br />
th<strong>at</strong> might have indic<strong>at</strong>ed former channels, zones <strong>of</strong> subsi<strong>de</strong>nce or submarine sli<strong>de</strong>s.<br />
Some <strong>of</strong> <strong>the</strong> mounds in <strong>the</strong> dredge disposal zone have a maximum <strong>of</strong> 1 to 3m <strong>of</strong> relief<br />
above <strong>the</strong> seabed as shown in Figure 4-5.<br />
Si<strong>de</strong>scan Sonar<br />
In general <strong>the</strong> sonar images suggest th<strong>at</strong> <strong>the</strong> seabed sediment consists <strong>of</strong> fine to mediumgrained<br />
m<strong>at</strong>erial (silt to sand size particles) with no unusual bedforms. The exceptions to<br />
this are several small areas <strong>of</strong> rock, a few small islands or pinnacles and <strong>the</strong> area loc<strong>at</strong>ed<br />
near <strong>the</strong> center <strong>of</strong> <strong>the</strong> site i<strong>de</strong>ntified as a dredge disposal zone. This zone exhibits<br />
consi<strong>de</strong>rable seabed roughness resulting from <strong>the</strong> uneven discharge <strong>of</strong> dredged m<strong>at</strong>erial.<br />
Subbottom Pr<strong>of</strong>iler and Seismic Reflection<br />
The subbottom pr<strong>of</strong>iler and seismic reflection d<strong>at</strong>a were used to produce <strong>the</strong> sediment<br />
isopach map shown in Figure 4-7 and to provi<strong>de</strong> additional inform<strong>at</strong>ion for <strong>de</strong>veloping <strong>the</strong><br />
surficial fe<strong>at</strong>ures map. The sediment thickness d<strong>at</strong>a was summed with <strong>the</strong> b<strong>at</strong>hymetric<br />
d<strong>at</strong>a to produce <strong>the</strong> <strong>de</strong>pth to top <strong>of</strong> bedrock map indic<strong>at</strong>ed in Figure 4-6.<br />
Final Report 4-12 May 2004
Figure 4-5: B<strong>at</strong>hymetry in <strong>Study</strong> Area<br />
Final Report 4-13 May 2004
Figure 4-6: Depth to Bedrock in <strong>Study</strong> Area<br />
Final Report 4-14 May 2004
Figure 4-7: Thickness <strong>of</strong> Sediments in <strong>Study</strong> Area<br />
Final Report 4-15 May 2004
The SBP equipment is only capable <strong>of</strong> obtaining good subsurface penetr<strong>at</strong>ion in finegrained<br />
sediment. Consequently, evi<strong>de</strong>nce <strong>of</strong> significant subsurface penetr<strong>at</strong>ion can be<br />
interpreted as evi<strong>de</strong>nce <strong>of</strong> fine-grained (clay or silt) sediments. This qualit<strong>at</strong>ive<br />
interpret<strong>at</strong>ion suggests th<strong>at</strong> <strong>the</strong> eastern and sou<strong>the</strong>astern area <strong>of</strong> <strong>the</strong> site is covered with<br />
fine-grained m<strong>at</strong>erial since <strong>the</strong> SBP was able to penetr<strong>at</strong>e up to 16m <strong>of</strong> m<strong>at</strong>erial. The<br />
western area <strong>of</strong> <strong>the</strong> site appears to be characterized by fine to medium-grained sediment,<br />
based on <strong>the</strong> acoustic characteristic <strong>of</strong> <strong>the</strong> reflection p<strong>at</strong>tern, and <strong>the</strong> reduced <strong>de</strong>pth <strong>of</strong><br />
penetr<strong>at</strong>ion.<br />
Over nearly <strong>the</strong> entire site <strong>the</strong> seismic reflection system was able to penetr<strong>at</strong>e <strong>the</strong> entire<br />
unconsolid<strong>at</strong>ed sediments down to bedrock. In some areas, such as in very shallow w<strong>at</strong>er<br />
or in <strong>the</strong> zone <strong>of</strong> dredge spoils, <strong>the</strong> contact between <strong>the</strong> unconsolid<strong>at</strong>ed sediment and <strong>the</strong><br />
top <strong>of</strong> bedrock was difficult to i<strong>de</strong>ntify. These acoustically opaque zones result from <strong>the</strong><br />
sc<strong>at</strong>tering <strong>of</strong> <strong>the</strong> acoustic signal by <strong>the</strong> coarse-grained surface m<strong>at</strong>erials or <strong>the</strong> presence<br />
<strong>of</strong> very <strong>de</strong>nse sediment such as we<strong>at</strong>hered rock or cobbles.<br />
As seen in Figure 4-7, <strong>the</strong> thickness <strong>of</strong> unconsolid<strong>at</strong>ed sediment ranges from<br />
approxim<strong>at</strong>ely 1 to 10m across most <strong>of</strong> <strong>the</strong> site. The exception to this is <strong>the</strong> significant<br />
<strong>de</strong>posit <strong>of</strong> m<strong>at</strong>erial th<strong>at</strong> fills <strong>the</strong> linear, channel-like fe<strong>at</strong>ure th<strong>at</strong> runs along <strong>the</strong> east si<strong>de</strong> <strong>of</strong><br />
<strong>the</strong> site parallel to <strong>the</strong> ship channel. The trench-like appearance <strong>of</strong> <strong>the</strong> fe<strong>at</strong>ure is<br />
morphologically similar to a tectonic structural fe<strong>at</strong>ure termed a graben. A graben is a<br />
linear structural block, rel<strong>at</strong>ively long compared to its width th<strong>at</strong> has been downthrown<br />
along normal-slip faults th<strong>at</strong> form its margins. This type <strong>of</strong> tectonic fe<strong>at</strong>ure generally forms<br />
in an extensional tectonic environment. There is no evi<strong>de</strong>nce <strong>of</strong> this fe<strong>at</strong>ure on <strong>the</strong><br />
b<strong>at</strong>hymetric map or <strong>the</strong> si<strong>de</strong>scan sonar d<strong>at</strong>a.<br />
4.3.5 Summary & Conclusions<br />
A summary <strong>of</strong> <strong>the</strong> results <strong>of</strong> <strong>the</strong> geophysical investig<strong>at</strong>ion are presented below:<br />
• The w<strong>at</strong>er <strong>de</strong>pth ranged from 1.0 m to 12.0 meters below MLWS. The<br />
seafloor has very little relief, with <strong>the</strong> exception <strong>of</strong> several small rock<br />
pinnacles and islands and a localized dredge disposal zone.<br />
• The interpreted si<strong>de</strong>scan sonar d<strong>at</strong>a suggests th<strong>at</strong> <strong>the</strong> seabed is mantled<br />
with fine to medium-grained sediments, i.e. clay or silt to sand. A<br />
qualit<strong>at</strong>ive classific<strong>at</strong>ion <strong>of</strong> <strong>the</strong> sediment in <strong>the</strong> dredge disposal area is not<br />
possible because <strong>of</strong> <strong>the</strong> ruggedness <strong>of</strong> <strong>the</strong> seabed.<br />
Final Report 4-16 May 2004
• The interpreted SBP d<strong>at</strong>a i<strong>de</strong>ntified a large zone <strong>of</strong> fine-grained (silt or clay<br />
size) sediment, 4 to 12m thick, th<strong>at</strong> covers <strong>the</strong> sou<strong>the</strong>astern area <strong>of</strong> <strong>the</strong><br />
site. A large area <strong>of</strong> <strong>the</strong> center and western edge <strong>of</strong> <strong>the</strong> site is covered with<br />
fine to medium-grained sediment, 1 to 3m thick. The remain<strong>de</strong>r <strong>of</strong> <strong>the</strong> site<br />
is covered with ei<strong>the</strong>r medium to coarse-grained m<strong>at</strong>erial, dredged disposal<br />
m<strong>at</strong>erial or has exposed we<strong>at</strong>hered rock.<br />
• The subsurface penetr<strong>at</strong>ion on <strong>the</strong> seismic reflection d<strong>at</strong>a, which<br />
represents <strong>the</strong> total thickness <strong>of</strong> unconsolid<strong>at</strong>ed sediment, ranged from 1 to<br />
10m across most <strong>of</strong> <strong>the</strong> site. The exception to this is <strong>the</strong> thick sediment<br />
<strong>de</strong>posit (10 to 26m) loc<strong>at</strong>ed in a trench-like fe<strong>at</strong>ure th<strong>at</strong> is loc<strong>at</strong>ed on <strong>the</strong><br />
eastern edge <strong>of</strong> <strong>the</strong> survey area.<br />
• The trench-like fe<strong>at</strong>ure th<strong>at</strong> is adjacent and runs parallel to <strong>the</strong> western<br />
edge <strong>of</strong> <strong>the</strong> canal may be fault rel<strong>at</strong>ed. Although this fe<strong>at</strong>ure could be <strong>the</strong><br />
result <strong>of</strong> stream erosion during lowered sea level its persistent linear n<strong>at</strong>ure<br />
suggests th<strong>at</strong> it is structurally controlled. Onshore, Qu<strong>at</strong>ernary-age faults<br />
have been mapped northwest <strong>of</strong> Panama City (U.S. Geological Survey,<br />
Open-File Report OFR 98-779) as well as fur<strong>the</strong>r <strong>of</strong>fshore th<strong>at</strong> project<br />
through this area. Most <strong>of</strong> <strong>the</strong> 31 seismic events recor<strong>de</strong>d in Panama are<br />
concentr<strong>at</strong>ed within and along <strong>the</strong> sou<strong>the</strong>rn projection <strong>of</strong> <strong>the</strong> Qu<strong>at</strong>ernaryage<br />
faults. The events are within 50 km <strong>of</strong> <strong>the</strong> survey area.<br />
• There is a potential risk to proposed structures if <strong>the</strong> trench-like fe<strong>at</strong>ure is<br />
loc<strong>at</strong>ed on an active fault. Motion th<strong>at</strong> could produce significant<br />
displacement <strong>of</strong> <strong>the</strong> seabed during an earthquake event may result in<br />
excessive ground motion and/or <strong>the</strong> gener<strong>at</strong>ion <strong>of</strong> local tsunami.<br />
4.4 Geotechnical Studies<br />
4.4.1 Marine<br />
It was hoped th<strong>at</strong> a number <strong>of</strong> boreholes could be driven to assist with <strong>the</strong><br />
characteriz<strong>at</strong>ion <strong>of</strong> <strong>the</strong> s<strong>of</strong>t m<strong>at</strong>erials and <strong>the</strong> transition from we<strong>at</strong>hered rock to <strong>the</strong> hard<br />
m<strong>at</strong>erials th<strong>at</strong> are encountered over <strong>the</strong> entire study area. Unfortun<strong>at</strong>ely, as noted above,<br />
<strong>the</strong> mobiliz<strong>at</strong>ion cost <strong>of</strong> <strong>the</strong> work was out <strong>of</strong> proportion to <strong>the</strong> quality <strong>of</strong> <strong>the</strong> specific d<strong>at</strong>a<br />
th<strong>at</strong> could be obtained. The geophysical survey was <strong>the</strong>n selected as <strong>the</strong> preferred<br />
approach until more <strong>de</strong>finite loc<strong>at</strong>ion for <strong>the</strong> island could be <strong>de</strong>termined. At this time, a<br />
more specific geotechnical site investig<strong>at</strong>ion can be <strong>de</strong>veloped, with <strong>the</strong> characteriz<strong>at</strong>ion<br />
<strong>of</strong> <strong>the</strong> s<strong>of</strong>t m<strong>at</strong>erials being a high priority for <strong>the</strong> program.<br />
Final Report 4-17 May 2004
In <strong>the</strong> meantime, <strong>the</strong> <strong>de</strong>sign and cost estim<strong>at</strong>ing for this study are based on <strong>the</strong><br />
<strong>de</strong>termin<strong>at</strong>ion <strong>of</strong> <strong>the</strong> <strong>de</strong>pth <strong>of</strong> <strong>the</strong> s<strong>of</strong>t m<strong>at</strong>erials, <strong>the</strong> results <strong>of</strong> bottom samples from <strong>the</strong><br />
environmental field work and <strong>the</strong> results <strong>of</strong> <strong>the</strong> geophysical survey, toge<strong>the</strong>r with<br />
anecdotal inform<strong>at</strong>ion or earlier work un<strong>de</strong>rtaken for <strong>the</strong> Vacamonte 10 fishing port project<br />
in <strong>the</strong> 1970s.<br />
Bottom samples were also taken to support an applic<strong>at</strong>ion 11 for a sand extraction<br />
concession south <strong>of</strong> Isla Tortola and within <strong>the</strong> island study area. Three soil samples<br />
were taken within <strong>the</strong> proposed concession area, and were i<strong>de</strong>ntified as fine sands with<br />
approxim<strong>at</strong>ely 90 and 65 percent passing <strong>the</strong> #4 12 and #10 sieves respectively. According<br />
to <strong>the</strong> labor<strong>at</strong>ory analysis <strong>of</strong> <strong>the</strong> samples, <strong>the</strong> m<strong>at</strong>erial would be classified as being a<br />
coarse sand.<br />
However, <strong>the</strong>re is no indic<strong>at</strong>ion in <strong>the</strong> report <strong>of</strong> <strong>the</strong> <strong>de</strong>pth <strong>at</strong> which <strong>the</strong> samples were taken,<br />
and any conclusions <strong>of</strong> <strong>the</strong> consistency <strong>of</strong> <strong>the</strong> m<strong>at</strong>erial could well be suspect.<br />
At this feasibility level <strong>of</strong> study, <strong>the</strong> results <strong>of</strong> <strong>the</strong> geophysical survey give an acceptable<br />
un<strong>de</strong>rstanding <strong>of</strong> <strong>the</strong> <strong>de</strong>pth <strong>of</strong> s<strong>of</strong>t m<strong>at</strong>erial overlying <strong>the</strong> hard rock base. However, it is<br />
known th<strong>at</strong> <strong>the</strong> s<strong>of</strong>t silts change to sand <strong>de</strong>posits <strong>at</strong> approxim<strong>at</strong>ely <strong>the</strong> 12 m contour, and<br />
<strong>the</strong> geophysical work does not clearly differenti<strong>at</strong>e between fine sands and silts over this<br />
area. The survey was also unable to give any indic<strong>at</strong>ion <strong>of</strong> <strong>the</strong> shear strength <strong>of</strong> <strong>the</strong> s<strong>of</strong>t<br />
m<strong>at</strong>erials, except for <strong>the</strong> fact th<strong>at</strong> <strong>the</strong> jet probes used to calibr<strong>at</strong>e <strong>the</strong> seismic reflection<br />
results met little or no resistance to <strong>de</strong>pths <strong>of</strong> about 5.00 m below <strong>the</strong> mud line.<br />
Figure 4-7, presented in <strong>the</strong> previous section, shows <strong>the</strong> <strong>de</strong>pth <strong>of</strong> s<strong>of</strong>t sediments or sands<br />
over <strong>the</strong> study area. However, as noted above, no conclusions can be ma<strong>de</strong> <strong>at</strong> this time<br />
as to <strong>the</strong> extent, characteristics and strength <strong>of</strong> each soil type.<br />
10 A member <strong>of</strong> <strong>the</strong> study team directed site investig<strong>at</strong>ion and <strong>de</strong>sign work for <strong>the</strong> Vacamonte Port.<br />
The field studies inclu<strong>de</strong>d boreholes, rock core extraction, wash-probes and seismic reflector<br />
surveys <strong>of</strong> <strong>the</strong> port area and approach channel.<br />
11 Estudio <strong>de</strong> Impacto Ambiental II, Solicitud <strong>de</strong> Concesión Minera para la Extracción <strong>de</strong> Arena<br />
Submarina, Panama Environmental Services S.A. for Energy Consultants S.A., November 2000<br />
12 ASTM sieves #4 and #10 have openings <strong>of</strong> 4.75 mm and 2.00 mm respectively.<br />
Final Report 4-18 May 2004
4.4.2 Landsi<strong>de</strong> Geotechnical Conditions<br />
In conjunction with <strong>the</strong> topographic surveys noted above, a series <strong>of</strong> boreholes and trial<br />
pits were taken by ACP geotechnical staff along <strong>the</strong> proposed transport corridor. In<br />
general terms, trial pits were taken to a <strong>de</strong>pth <strong>of</strong> approxim<strong>at</strong>ely 2.5 m <strong>at</strong> intervals <strong>of</strong> 500<br />
m, with boreholes being taken <strong>at</strong> all major stream crossings or potential bridge sites.<br />
Figure 4-8 shows <strong>the</strong> borehole and trial pit loc<strong>at</strong>ions for <strong>the</strong> investig<strong>at</strong>ion.<br />
A total <strong>of</strong> eight boreholes were taken over <strong>the</strong> corridor. Between five and nine samples<br />
were taken <strong>at</strong> each borehole loc<strong>at</strong>ion for a total <strong>of</strong> 56 samples. Soil samples from <strong>the</strong><br />
SPT sampler were stored in plastic bags while rock samples were sealed with paraffin and<br />
transported to <strong>the</strong> labor<strong>at</strong>ory for storage. In <strong>the</strong> labor<strong>at</strong>ory all samples were removed from<br />
<strong>the</strong> bags and dried in <strong>the</strong> work area. In<strong>de</strong>x tests to test w<strong>at</strong>er content, Atterberg Limits<br />
and specific gravity as well as a sieve analysis were conducted on each soil sample to<br />
<strong>de</strong>termine <strong>the</strong> classific<strong>at</strong>ion <strong>of</strong> <strong>the</strong> m<strong>at</strong>erial. Strength tests including unconfined<br />
compression, point load, and triaxial tests were performed on intact rock samples having a<br />
nominal diameter <strong>of</strong> 2.6 inches. Table 4-1 and Table 4-2 show typical results obtained<br />
from <strong>the</strong>se analyses.<br />
Table 4-1: Summary Results <strong>of</strong> In<strong>de</strong>x Tests – Boring RTP-6<br />
Project: Railroad to Artificial <strong>Island</strong><br />
Loc<strong>at</strong>ion: Pacific Si<strong>de</strong><br />
AUTORIDAD DEL CANAL DE PANAMA<br />
DIVISION DE INGENIERIA<br />
SECCION DE GEOTECNIA<br />
SUMMARY RESULTS OF INDEX TESTS<br />
Borehole<br />
SPT No. Depth (m) Blows (N)<br />
Specific<br />
Gravity<br />
Gs<br />
Moisture<br />
Content<br />
(%)<br />
Passing<br />
No. 200<br />
(%)<br />
Liquid<br />
Limit<br />
LL<br />
Plastic<br />
Plastic<br />
In<strong>de</strong>x<br />
Limit PL<br />
PI<br />
Classific.<br />
U.C.S.<br />
RTP-6 1 0.00-0.45 1-3-2 30.23 40.18 43 30 13 SM Silty sand Light brownish gray<br />
RTP-6 2 1.50-1.95 5-5-5 49.73 33.77 + + +<br />
RTP-6 3 3.00-3.45 3-3-5 42.3 47.88 68 33 35 SC Clayey sand Pale brown<br />
RTP-6 4 4.50-4.95 3-4-6 41.6 38.55 59 31 28 SM Silty sand Light brownish gray<br />
RTP-6 5 6.00-6.45 11-46-50 29.95 32.16 26 23 3 SM Silty sand Light yellowish brown<br />
Remarks: (+) means "insufficient m<strong>at</strong>erial"<br />
Tested By: C. Rodriguez, and X. Rios<br />
D<strong>at</strong>e: 08/08/2002<br />
File: RTP<br />
Prepared By: Xenia Rios<br />
Checked By: Gustavo Guerra B.<br />
Name<br />
Color<br />
Final Report 4-19 May 2004
Table 4-2: Summary Results <strong>of</strong> <strong>the</strong> Point Load Strength In<strong>de</strong>x <strong>of</strong> Rock – Boring<br />
RTP-1<br />
AUTORIDAD DEL CANAL DE PANAMA<br />
DIVISION DE INGENIERIA<br />
SECCION DE GEOTECNIA<br />
SUMMARY RESULTS OF THE POINT LOAD STRENGTH INDEX OF ROCK<br />
Project: Railroad to Artificial <strong>Island</strong><br />
Boring<br />
Depth<br />
(m)<br />
Loc<strong>at</strong>ion: Pacific Si<strong>de</strong><br />
Sample<br />
No.<br />
Point Load t.<br />
ls 50 (Mpa)<br />
Estim<strong>at</strong>ed<br />
Unconf. Comp.<br />
σc (Mpa)<br />
Type <strong>of</strong> Rock<br />
1 RTP-1 12.67-12-90 m-1 0.27 6 sandstone<br />
2 RTP-1 13.80-14.07 m-2 0.21 5 sandstone<br />
3 RTP-1 15.25-15.45 m-3 0.3 7 sandstone<br />
4 RTP-1 16.45-16.62 m-4 0.47 10 sandstone<br />
Remarks: rock color: sandstone light olive gray<br />
Tested and prepared By: R.Lam, X. Rios and G. Guerra 09/15/2002<br />
Seven pits were excav<strong>at</strong>ed in total. Each pit measured approxim<strong>at</strong>ely 2.5 m <strong>de</strong>ep, 4.0 m<br />
long and 2.5 m wi<strong>de</strong> (see Figure 4-9). The excav<strong>at</strong>ions were accomplished by using a D6<br />
to remove standing overgrowth and a backhoe to dig <strong>the</strong> pit. Two samples were<br />
recovered from each pit, properly packaged and tagged and sent to <strong>the</strong> labor<strong>at</strong>ories for<br />
analysis. Labor<strong>at</strong>ory in<strong>de</strong>x tests inclu<strong>de</strong>d dry <strong>de</strong>nsity, wet <strong>de</strong>nsity, specific gravity,<br />
moisture content, maximum liquid limit, plasticity limit and passing tests.<br />
Table 4-3 summarizes <strong>the</strong> results for each sample.<br />
A full report on <strong>the</strong> field work and labor<strong>at</strong>ory results is presented in Appendix C <strong>of</strong> this<br />
report.<br />
Final Report 4-20 May 2004
Table 4-3: Summary Results <strong>of</strong> In<strong>de</strong>x Tests – All Pit Loc<strong>at</strong>ions<br />
Project: Artificial <strong>Island</strong> Proposed Railroad Alignment<br />
Loc<strong>at</strong>ion: West Bank<br />
PANAMA CANAL AUTHORITY<br />
ENGINEERING AND PROJECTS DEPARTMENT<br />
ENGINEERING ENGINEERING DIVISION<br />
SOILS AND MATERIAL LABORATORY<br />
SUMMARY RESULTS OF INDEX TESTS<br />
Specific Moisture Passing Liquid Plastic Plastic<br />
PIT No. Sample Depth<br />
m Wet Densinty Dry Density Gravity Content No. 200 Limit Limit In<strong>de</strong>x Classific.<br />
Name<br />
Color<br />
(lb/ft 3 ) (lb/ft 3 ) Gs (%) (%) LL PL PI U.C.S.<br />
PIT-1 A 1.00 121 91 2.53 32.89 56.97 73 35 38 MH Sandy elastic silt Reddish brown<br />
PIT-1 B 0.80 2.53 30.95 56.97 73 35 38 MH Sandy elastic silt Reddish brown<br />
PIT-2 A 0.70 112 84 2.57 33.21 25.4 59 36 23 SM Silty sand Reddish brown<br />
PIT-2 B 1.00 2.57 33.51 25.4 59 36 23 SM Silty sand Reddish brown<br />
PIT-3 A 1.00 119 90 2.55 31.86 28.37 64 36 28 SM Silty sand Brown<br />
PIT-3 B 1.20 2.39 32.61 28.92 66 36 30 SM Silty sand Brown<br />
PIT-4 A 0.90 127 97 2.42 30.4 32.65 60 32 28 SM Silty sand Light Brown<br />
PIT-4 B 0.80 2.42 29.5 32.65 60 32 28 SM Silty sand Light Brown<br />
PIT-5 A 1.50 119 85 2.32 40.67 60.39 78 34 44 CH Sandy f<strong>at</strong> clay Brown<br />
PIT-5 B 0.86 2.2 52.06 51.49 73 43 30 MH Sandy elastic silt Light yellowish brown<br />
PIT-6 A 1.82 122 98 2.49 25.06 32.84 47 27 20 SC Clayey sand Light gray<br />
PIT-6 B 1.30 2.64 37.14 13.44 69 39 30 SM Slity sand Reddish brown<br />
PIT-7 A 1.10 116 100 2.39 16.34 30.07 54 28 26 SC Clayey sand Light reddish brown<br />
PIT-7 B 1.34 2.57 17.7 34.69 54 31 23 SM Silty sand Reddish brown<br />
Tested By: Carlos Rodriguez and Xenia Rios.<br />
Prepared By: Xenia Rios<br />
Checked By: Gustavo Guerra B.<br />
File: Pits Isla Artificial<br />
D<strong>at</strong>e: 07/24/02<br />
Final Report 4-21 May 2004
Figure 4-8:<br />
Investig<strong>at</strong>ions<br />
Loc<strong>at</strong>ion <strong>of</strong> Boreholes & Test Pits - Corridor Geotechnical<br />
Use Railroad to Artificial <strong>Island</strong> Map <strong>at</strong> <strong>the</strong> end <strong>of</strong> <strong>the</strong> ACP Lab Testing Program Report<br />
(Sept. 2002)<br />
Final Report 4-22 May 2004
Figure 4-9: Typical Test Pit – Geotechnical Investig<strong>at</strong>ions<br />
Final Report 4-23 May 2004
4.5 Wind D<strong>at</strong>a<br />
Average wind speed and direction for <strong>the</strong> study area are available <strong>at</strong> Balboa FAA st<strong>at</strong>ion<br />
from <strong>the</strong> period 1985-2002. Table 4-4 presents <strong>the</strong> monthly average speed and wind<br />
directions <strong>at</strong> th<strong>at</strong> st<strong>at</strong>ion.<br />
Table 4-4: Average Wind speed & direction <strong>at</strong> Balboa FAA<br />
St<strong>at</strong>ion<br />
Name<br />
Avg.<br />
Wind<br />
Speed<br />
(m/s)<br />
Avg.<br />
Wind<br />
Direction<br />
Jan Feb Mar Apr May Jun Jul Aug Sep Oct Nov Dec<br />
2.17 2.42 2.45 2.26 1.80 1.56 1.73 1.66 1.56 1.55 1.64 1.75<br />
333.<br />
4<br />
338.6 341.9 336.4 299.2 296.6 308.3 308.8 263.9 255.4 296.0 325.0<br />
During <strong>the</strong> rainy season months in Panama <strong>of</strong> May to November, <strong>the</strong> dominant wind<br />
direction is from <strong>the</strong> West – Southwest. Wind speeds during this period are slightly smaller<br />
than during <strong>the</strong> rest <strong>of</strong> <strong>the</strong> year. From December to April (dry season) <strong>the</strong> predominant<br />
winds are from <strong>the</strong> North-Northwest, when <strong>the</strong> nor<strong>the</strong>asterly (tra<strong>de</strong>) winds blow with more<br />
intensity.<br />
Hourly winds were also available <strong>at</strong> Balboa for <strong>the</strong> period May – July 2002 when ACP<br />
measured w<strong>at</strong>er levels and currents in Panama Bay. Time series <strong>of</strong> wind speed and<br />
direction for this period are presented in Figure 4-10.<br />
Surface wind d<strong>at</strong>a are available <strong>at</strong> Howard Air Force Base from <strong>the</strong> period 1973-1995.<br />
Table 4-5 presents <strong>the</strong> prevailing wind direction, monthly mean wind speed, maximum<br />
peak gust and highest-pressure altitu<strong>de</strong> <strong>at</strong> this st<strong>at</strong>ion.<br />
Final Report 4-24 May 2004
Table 4-5: Average Wind speed & direction <strong>at</strong> Howard Air Force Base<br />
St<strong>at</strong>ion<br />
Name<br />
Pvlg.<br />
Wind<br />
Direction<br />
Mean<br />
Speed<br />
(Pvlg Dir)<br />
Mean<br />
Speed<br />
(All Obs)<br />
Max Peak<br />
Gust<br />
Pressure<br />
Alt<br />
Units Jan Feb Mar Apr May Jun Jul Aug Sep Oct Nov Dec<br />
16 pts N N N N NNW NNW NNW NNW NNW S NNW NNW<br />
kts 8 8 9 7 6 5 6 6 5 7 5 6<br />
kts 7 8 7 6 4 3 4 4 3 3 4 5<br />
99.95% 31 32 34 31 56 35 45 41 35 36 31 56<br />
ft 295 281 300 304 300 286 276 284 292 284 292 339<br />
Source: Howard AFB Panama; Prepared by: AFCCC/DOS, Oct. 1996; Period: Jan 1973 – Dec 1995<br />
The dominant wind direction from May to November is North- Northwest. These wind<br />
speeds are again slightly smaller than during <strong>the</strong> rest <strong>of</strong> <strong>the</strong> year. From December to April<br />
<strong>the</strong> predominant winds are from <strong>the</strong> North.<br />
Final Report 4-25 May 2004
Figure 4-10: Balboa FAA - Wind Speed and Direction D<strong>at</strong>a (May to July 2002)<br />
Use Fig 3-4 from Hydro Baseline Report.<br />
Final Report 4-26 May 2004
4.6 Ti<strong>de</strong>s & Currents<br />
As seen in Figure 4-11, <strong>the</strong> Gulf <strong>of</strong> Panama is about 200 km wi<strong>de</strong> (E-W direction) and 170<br />
km long (N-S direction). There are two main groups <strong>of</strong> n<strong>at</strong>ural islands in <strong>the</strong> Gulf. The first<br />
group inclu<strong>de</strong>s <strong>the</strong> islands <strong>of</strong> Taboga and Taboguilla, loc<strong>at</strong>ed 15 km. south <strong>of</strong> Panama<br />
City, while <strong>the</strong> second group, Archipelago <strong>de</strong> Las Perlas, is loc<strong>at</strong>ed in <strong>the</strong> middle <strong>of</strong> <strong>the</strong><br />
Gulf <strong>at</strong> a distance <strong>of</strong> 90 km South East <strong>of</strong> <strong>the</strong> <strong>Canal</strong> Pacific entrance.<br />
The entrance <strong>of</strong> <strong>the</strong> Gulf loc<strong>at</strong>ed <strong>at</strong> an approxim<strong>at</strong>e L<strong>at</strong>itu<strong>de</strong> <strong>of</strong> 7.5 o N (East <strong>of</strong> Punta Mala,<br />
<strong>at</strong> <strong>the</strong> Azuero Peninsula) has <strong>de</strong>pths in <strong>the</strong> or<strong>de</strong>r <strong>of</strong> 200 m. South <strong>of</strong> <strong>the</strong> entrance, <strong>de</strong>pth<br />
increases very rapidly reaching values between 2000 to 3000 meters <strong>at</strong> a l<strong>at</strong>itu<strong>de</strong> <strong>of</strong> 6 o N.<br />
The area <strong>of</strong> interest <strong>of</strong> <strong>the</strong> present study is loc<strong>at</strong>ed in Panama Bay and it is limited by <strong>the</strong><br />
Coast <strong>of</strong> Panama along <strong>the</strong> North and West, <strong>the</strong> entrance channel to <strong>the</strong> Panama <strong>Canal</strong><br />
on <strong>the</strong> East and Punta Chame and Otoque island on <strong>the</strong> South. The <strong>de</strong>pth in this area<br />
varies from 0 to around 50 m.<br />
4.6.1 Ti<strong>de</strong>s<br />
Ti<strong>de</strong>s in Panama Bay are semidiurnal with two high w<strong>at</strong>ers and two low w<strong>at</strong>ers per day<br />
and with an approxim<strong>at</strong>e period <strong>of</strong> 12.25 hours. The average tidal range <strong>at</strong> <strong>the</strong> entrance <strong>of</strong><br />
<strong>the</strong> Gulf <strong>of</strong> Panama is 1.5 m during neap ti<strong>de</strong> and 3.4 m during spring ti<strong>de</strong>. The tidal<br />
propag<strong>at</strong>ion along <strong>the</strong> Gulf follows a standing wave p<strong>at</strong>tern. The tidal range amplifies<br />
from south to North due to <strong>the</strong> reflection <strong>of</strong> <strong>the</strong> tidal wave on <strong>the</strong> closed boundary <strong>at</strong> <strong>the</strong><br />
North <strong>of</strong> Panama Bay. At Balboa <strong>the</strong> average tidal range is approxim<strong>at</strong>ely 2.7 m during<br />
neap ti<strong>de</strong> and on <strong>the</strong> or<strong>de</strong>r <strong>of</strong> 5.0 m during spring ti<strong>de</strong>. The tidal propag<strong>at</strong>ion in <strong>the</strong> Gulf <strong>of</strong><br />
Panama is <strong>de</strong>scribed with more <strong>de</strong>tail in Bennett (1965).<br />
Final Report 4-27 May 2004
Figure 4-11: <strong>Study</strong> area for Wave and Hydrodynamic Mo<strong>de</strong>ling Studies<br />
Use Fig 2.1 from baseline Hydro report<br />
Final Report 4-28 May 2004
4.6.2 Currents<br />
The currents in <strong>the</strong> Gulf <strong>of</strong> Panama are gener<strong>at</strong>ed by tidal effects, oceanic currents and<br />
wind. A discussion <strong>of</strong> each system follows.<br />
Tidal Currents<br />
The ti<strong>de</strong>-gener<strong>at</strong>ed currents are associ<strong>at</strong>ed to <strong>the</strong> tidal variability discussed in <strong>the</strong><br />
previous section. During <strong>the</strong> filling <strong>of</strong> <strong>the</strong> bay (transition from low w<strong>at</strong>er to high w<strong>at</strong>er) <strong>the</strong><br />
flood current’s direction is to <strong>the</strong> north while during <strong>the</strong> emptying <strong>of</strong> <strong>the</strong> bay <strong>the</strong> direction <strong>of</strong><br />
<strong>the</strong> ebb current is approxim<strong>at</strong>ely south. The magnitu<strong>de</strong> <strong>of</strong> <strong>the</strong> tidal currents varies with <strong>the</strong><br />
tidal range presenting <strong>the</strong> highest values during spring ti<strong>de</strong> and <strong>the</strong> lowest during neap<br />
ti<strong>de</strong>.<br />
Oceanic Current<br />
The Oceanic currents in <strong>the</strong> Eastern Pacific are very complex and <strong>the</strong>y are associ<strong>at</strong>ed to<br />
<strong>the</strong> global wind p<strong>at</strong>terns rel<strong>at</strong>ed to <strong>the</strong> position <strong>of</strong> <strong>the</strong> Inter-tropical Convergence Zone<br />
(ITCZ). The main currents affecting <strong>the</strong> Gulf <strong>of</strong> Panama are:<br />
• The Westerly moving North-Equ<strong>at</strong>orial current, which is a direct result <strong>of</strong> <strong>the</strong> Tra<strong>de</strong><br />
Winds. This current moves west from Panama Bay <strong>at</strong> about 12 o N.<br />
• The Easterly Equ<strong>at</strong>orial Counter Current moves in <strong>the</strong> opposite direction to <strong>the</strong><br />
prevailing wind direction between 4 o and 10 o N. It is gener<strong>at</strong>ed by <strong>the</strong> horizontal<br />
pressure gradient in <strong>the</strong> w<strong>at</strong>er surface elev<strong>at</strong>ion between <strong>the</strong> West and East<br />
Pacific, produced by <strong>the</strong> tra<strong>de</strong> winds. The effects <strong>of</strong> <strong>the</strong> Equ<strong>at</strong>orial counter-current<br />
disappear between 90 o to 85 o W where it is partially incorpor<strong>at</strong>ed into <strong>the</strong><br />
circul<strong>at</strong>ion <strong>of</strong> <strong>the</strong> Gulf <strong>of</strong> Panama. The tropical w<strong>at</strong>ers <strong>of</strong> <strong>the</strong> Gulf are displaced<br />
south by <strong>the</strong> Tra<strong>de</strong> Winds forming a cyclonic (counterclockwise) circul<strong>at</strong>ion known<br />
as Gulf <strong>of</strong> Panama or Colombia current (Forsbergh, 1969; Bennett, 1965). The<br />
intensity <strong>of</strong> <strong>the</strong> current varies with <strong>the</strong> intensity <strong>of</strong> <strong>the</strong> tra<strong>de</strong> winds, being highest<br />
during <strong>the</strong> months <strong>of</strong> December to April, and lowest from May to June.<br />
Estim<strong>at</strong>ion <strong>of</strong> <strong>the</strong> net current in <strong>the</strong> Gulf <strong>of</strong> Panama has been presented in a number <strong>of</strong><br />
public<strong>at</strong>ions. The Atlas <strong>of</strong> Pilot Charts presents <strong>the</strong> net average current for each calendar<br />
month. Figure 4-12 presents <strong>the</strong> currents chart for May and July (first and last month <strong>of</strong><br />
<strong>the</strong> calibr<strong>at</strong>ion period presented in this report).<br />
Final Report 4-29 May 2004
Figure 4-12: Net Currents in Panama Bay (Atlas <strong>of</strong> Pilot Charts)<br />
Use Fig 2-2 from Baseline Hydro Report<br />
Final Report 4-30 May 2004
The currents presented in <strong>the</strong> charts shown in Figure 4-12 have <strong>the</strong> highest values during<br />
<strong>the</strong> months <strong>of</strong> April, May and June being 0.5 knots (0.26 m/s) south <strong>of</strong> Taboguilla <strong>Island</strong>,<br />
0.7 knots (0.36 m/s) west <strong>of</strong> Punta Cocalito and 1 knot (0.51 m/s) west <strong>of</strong> Punta Mala. The<br />
net average flow throughout <strong>the</strong> year <strong>at</strong> <strong>the</strong> nor<strong>the</strong>rn end <strong>of</strong> <strong>the</strong> Bay is in <strong>the</strong> or<strong>de</strong>r <strong>of</strong> 0.3-<br />
0.5 knots (0.15 – 0.26 m/s).<br />
The net current <strong>of</strong> <strong>the</strong> Gulf <strong>of</strong> Panama was also estim<strong>at</strong>ed in Bennett, (1965) using current<br />
d<strong>at</strong>a collected by <strong>the</strong> former United St<strong>at</strong>es Navy Hydrographic Office in <strong>the</strong> western Gulf<br />
<strong>of</strong> Panama from l<strong>at</strong>e August to early October 1958. The measurements were taken <strong>at</strong> five<br />
loc<strong>at</strong>ions as shown in Figure 4-13 and <strong>at</strong> three <strong>de</strong>pths. Bennett calcul<strong>at</strong>ed <strong>the</strong> net current<br />
to be about 0.35 knots (0.18 m/s) inshore <strong>at</strong> a <strong>de</strong>pth <strong>of</strong> 55 ft (17 m) and 0.7 knots (0.35<br />
m/s) <strong>of</strong>fshore <strong>at</strong> approxim<strong>at</strong>ely 100 ft (30 m) <strong>of</strong> <strong>de</strong>pth.<br />
Wind Gener<strong>at</strong>ed Currents<br />
When winds blow across <strong>the</strong> ocean surface, kinetic energy is transferred from <strong>the</strong> wind to<br />
surface w<strong>at</strong>er as a result <strong>of</strong> <strong>the</strong> friction between <strong>the</strong> two. Kinetic energy transferred to <strong>the</strong><br />
ocean surface sets <strong>the</strong> surface layer <strong>of</strong> w<strong>at</strong>er in motion and gener<strong>at</strong>es both waves and<br />
currents. Current p<strong>at</strong>terns can also be affected by <strong>the</strong> local wind clim<strong>at</strong>e, especially in <strong>the</strong><br />
shallow w<strong>at</strong>er. However, previous studies <strong>at</strong> Panama Bay conclu<strong>de</strong>d th<strong>at</strong> <strong>the</strong> local wind<br />
has a very small impact on <strong>the</strong> magnitu<strong>de</strong> and <strong>the</strong> p<strong>at</strong>tern <strong>of</strong> <strong>the</strong> currents <strong>at</strong> <strong>the</strong> North end<br />
<strong>of</strong> Panama Bay (Delft Hydraulics, 1999).<br />
Final Report 4-31 May 2004
Figure 4-13: Currents in Panama Bay (Bennett, 1965)<br />
Use Fig 2-3 from Baseline Hydro Report<br />
Final Report 4-32 May 2004
Ti<strong>de</strong>s<br />
In support <strong>of</strong> <strong>the</strong> hydrodynamic mo<strong>de</strong>ling work presented l<strong>at</strong>er in this report, tidal and<br />
current readings were taken <strong>at</strong> <strong>the</strong> limits <strong>of</strong> <strong>the</strong> study area from May to July 2002.<br />
Additional readings were also taken <strong>at</strong> <strong>the</strong> Pacific Entrance to <strong>the</strong> <strong>Canal</strong> in December<br />
2003. Tidal readings were ma<strong>de</strong> <strong>at</strong> Taboga island, <strong>the</strong> Mine Dock on Amador Causeway<br />
and also <strong>at</strong> Contadora island, as indic<strong>at</strong>ed in Figure 4-14. As current readings were taken<br />
over Spring and Neap ti<strong>de</strong>s <strong>at</strong> <strong>the</strong> three loc<strong>at</strong>ions shown in Figure 4-15, <strong>de</strong>fining <strong>the</strong><br />
boundaries <strong>of</strong> <strong>the</strong> mo<strong>de</strong>l and conditions <strong>at</strong> <strong>the</strong> expected island loc<strong>at</strong>ion. The work was<br />
un<strong>de</strong>rtaken by ACP staff with transect loc<strong>at</strong>ions and initial field work assistance from <strong>the</strong><br />
consultants.<br />
Typical output from <strong>the</strong> measurements is presented in Figure 4-16 and Figure 4-17, on <strong>the</strong><br />
following pages. The full results <strong>of</strong> <strong>the</strong> tidal and current measurements are presented in<br />
Appendix D to this report.<br />
Final Report 4-33 May 2004
Figure 4-14: Loc<strong>at</strong>ion <strong>of</strong> ACP established Tidal St<strong>at</strong>ions<br />
Use Figure 3.2 from Baseline Hydro <strong>Study</strong><br />
Final Report 4-34 May 2004
Figure 4-15: Loc<strong>at</strong>ion <strong>of</strong> Current Measurements (2003)<br />
Use Figure 3.3 from Baseline Hydro <strong>Study</strong><br />
Final Report 4-35 May 2004
Figure 4-16: Typical Results <strong>of</strong> Current Metering - June 2002<br />
Final Report 4-36 May 2004
Figure 4-17: Typical Current Velocities Observed <strong>at</strong> Western Limits <strong>of</strong> <strong>Study</strong> Area<br />
Tidal Prediction St<strong>at</strong>ions<br />
A number <strong>of</strong> NOAA tidal st<strong>at</strong>ions are available in <strong>the</strong> Gulf <strong>of</strong> Panama. Balboa is <strong>the</strong> only<br />
primary st<strong>at</strong>ion and <strong>the</strong> tidal predictions for <strong>the</strong> o<strong>the</strong>r loc<strong>at</strong>ions are calcul<strong>at</strong>ed from <strong>the</strong><br />
constituents <strong>at</strong> Balboa using some amplitu<strong>de</strong> and phase corrections. A number <strong>of</strong> <strong>the</strong>se<br />
st<strong>at</strong>ions throughout <strong>the</strong> Gulf <strong>of</strong> Panama are presented in Table 4-6. The loc<strong>at</strong>ion <strong>of</strong> <strong>the</strong>se<br />
st<strong>at</strong>ions is shown earlier in Figure 4-14.<br />
Final Report 4-37 May 2004
Table 4-6: NOAA Tidal Prediction St<strong>at</strong>ions in Panama Bay<br />
St<strong>at</strong>ion Name<br />
St<strong>at</strong>ion<br />
Type<br />
Long.<br />
(<strong>de</strong>g. W)<br />
L<strong>at</strong>.<br />
(<strong>de</strong>g. N)<br />
Mean Ti<strong>de</strong><br />
Range (m.)<br />
Spring<br />
Ti<strong>de</strong><br />
Range (m.)<br />
Mean Ti<strong>de</strong><br />
Level (m.)<br />
Bahia Piña Secondary 78.18 7.57 3.20 4.18 2.07<br />
Punta Garachine Secondary 78.42 8.08 3.32 4.33 2.13<br />
Isla <strong>de</strong>l Rey Secondary 78.90 8.30 3.26 4.24 2.10<br />
Rio Chepo Secondary 79.12 8.98 3.81 4.94 2.47<br />
BALBOA Primary 79.57 8.95 3.84 5.00 2.50<br />
Naos <strong>Island</strong> Secondary 79.53 8.92 3.78 4.75 2.38<br />
Taboga Secondary 79.55 8.80 3.81 4.94 2.47<br />
Bahia <strong>de</strong> Chame Secondary 79.75 8.68 3.81 4.94 2.47<br />
Punta Mala Secondary 80.00 7.47 2.47 3.20 1.58<br />
4.6.3 W<strong>at</strong>er Level Observ<strong>at</strong>ions<br />
ACP installed four tidal gages in Panama Bay in or<strong>de</strong>r to record <strong>the</strong> w<strong>at</strong>er level vari<strong>at</strong>ion<br />
during <strong>the</strong> months <strong>of</strong> May to September. Coordin<strong>at</strong>es and temporal extent <strong>of</strong> <strong>the</strong><br />
measured record for each st<strong>at</strong>ion are presented in Table 4-7. The measurement loc<strong>at</strong>ions<br />
are shown in Figure 4-14.<br />
Table 4-7: W<strong>at</strong>er level st<strong>at</strong>ions<br />
St<strong>at</strong>ion Name Measurement Period Longitu<strong>de</strong><br />
(<strong>de</strong>g. West)<br />
L<strong>at</strong>itu<strong>de</strong><br />
(<strong>de</strong>g. North)<br />
Otoque 07/08/02 – 09/12/02 79.61 8.61<br />
Taboguilla 07/08/02 – 09/12/02 79.52 8.81<br />
Mine Dock 05/01/02 – 09/12/02 79.54 8.92<br />
Contadora 06/25/02 – 09/12/02 79.04 8.63<br />
Final Report 4-38 May 2004
4.6.4 Current Measurements<br />
During <strong>the</strong> period May-June 2002, ACP personnel carried out five current measurement<br />
campaigns in Panama Bay (ACP, 2002). Currents were measured in a number <strong>of</strong> points<br />
along three different transects: A – Rio Pacora, B – New <strong>Island</strong> and C – Punta Chame.<br />
The measurement loc<strong>at</strong>ions along each transect are shown in Figure 4-15. The<br />
campaigns were <strong>de</strong>signed with <strong>the</strong> aim <strong>of</strong> measuring <strong>the</strong> currents in <strong>the</strong> Bay <strong>at</strong> different<br />
tidal phases. Table 4-8 provi<strong>de</strong>s <strong>the</strong> d<strong>at</strong>e and <strong>the</strong> tidal phase covered by each <strong>of</strong> <strong>the</strong><br />
measurement campaigns.<br />
Table 4-8: ACP Current Measurement Campaign, (2002)<br />
D<strong>at</strong>e Tidal Phase Tidal Range <strong>at</strong><br />
Balboa (m.)<br />
Transects<br />
measured<br />
12,13 and 14 May, 2002 Small Spring Ti<strong>de</strong> 4.65 A, B and C<br />
19,20 and 21 May, 2002 Neap Ti<strong>de</strong> 3.40 A, B and C<br />
27 May, 2002 Spring Ti<strong>de</strong> 5.26 B<br />
3, 4 and 7 June, 2002 Neap Ti<strong>de</strong> 2.56 A, B and C<br />
23, 24 and 25 June, 2002 Spring Ti<strong>de</strong> 4.98 A, B and C<br />
During each measurement series, <strong>the</strong> objective was to observe <strong>the</strong> currents <strong>at</strong> each<br />
loc<strong>at</strong>ion for High. Ebb, Low and Flood ti<strong>de</strong> stages. In addition, currents were measured<br />
near <strong>the</strong> surface <strong>at</strong> each loc<strong>at</strong>ion and <strong>at</strong> mid <strong>de</strong>pth and near <strong>the</strong> bottom. At each <strong>de</strong>pth,<br />
<strong>the</strong> current speed and direction were measured five times, with a minute separ<strong>at</strong>ion<br />
between consecutive measurements. The mean and standard <strong>de</strong>vi<strong>at</strong>ion was <strong>the</strong>n<br />
computed from <strong>the</strong> five measurements, <strong>the</strong>reby providing a better estim<strong>at</strong>e <strong>of</strong> <strong>the</strong> current<br />
conditions measured than a single value.<br />
Final Report 4-39 May 2004
--- THIS PAGE INTENTIONALLY BLANK ---<br />
Final Report 4-40 May 2004
5 ENVIRONMENTAL CHARACTERIZATION<br />
5.1 Background<br />
In or<strong>de</strong>r to establish a baseline condition for <strong>the</strong> environmental assessment <strong>of</strong> various<br />
island loc<strong>at</strong>ions and long term <strong>de</strong>velopment options, a d<strong>at</strong>a search was ma<strong>de</strong> <strong>of</strong> previous<br />
reports, papers and public<strong>at</strong>ions on <strong>the</strong> area within and surrounding <strong>the</strong> study area <strong>of</strong><br />
interest. In addition, a w<strong>at</strong>er quality and marine sediments field sampling program was<br />
un<strong>de</strong>rtaken in early 2003 to provi<strong>de</strong> benchmark values for <strong>the</strong> environmental assessment<br />
<strong>of</strong> a series <strong>of</strong> marine disposal options un<strong>de</strong>r <strong>the</strong> Pacific Si<strong>de</strong> Excav<strong>at</strong>ion and Dredging<br />
M<strong>at</strong>erial Disposal <strong>Study</strong> mentioned earlier.<br />
The inform<strong>at</strong>ion provi<strong>de</strong>d un<strong>de</strong>r this parallel study is directly pertinent to <strong>the</strong> environmental<br />
evalu<strong>at</strong>ion <strong>of</strong> <strong>the</strong> Artificial <strong>Island</strong> project and is <strong>the</strong>refore <strong>de</strong>scribed in <strong>the</strong> following<br />
sections. For a more <strong>de</strong>tailed explan<strong>at</strong>ion <strong>of</strong> <strong>the</strong> Marine Field studies and results <strong>of</strong> <strong>the</strong><br />
analyses, <strong>the</strong> rea<strong>de</strong>r is referred to Appendix E <strong>of</strong> this report.<br />
5.2 Environmental Field Investig<strong>at</strong>ions<br />
Environmental baseline studies <strong>of</strong> <strong>the</strong> marine area were un<strong>de</strong>rtaken as part <strong>of</strong> <strong>the</strong><br />
Disposal Options study in parallel with <strong>the</strong> island study. The field work un<strong>de</strong>rtaken for <strong>the</strong><br />
project was carried out in early 2003 and inclu<strong>de</strong>d w<strong>at</strong>er quality sampling, bottom samples<br />
and labor<strong>at</strong>ory analyses <strong>at</strong> <strong>the</strong> loc<strong>at</strong>ions indic<strong>at</strong>ed in Figure 5-1.<br />
5.2.1 W<strong>at</strong>er Quality and Marine D<strong>at</strong>a Collection<br />
The marine team conducted coastal intertidal and <strong>of</strong>fshore studies <strong>of</strong> <strong>the</strong> potential areas<br />
for marine disposal. In intertidal areas <strong>the</strong> studies inclu<strong>de</strong>d:<br />
• Collection <strong>of</strong> benthic organisms<br />
• Collection <strong>of</strong> w<strong>at</strong>er quality parameters<br />
• Observ<strong>at</strong>ions <strong>of</strong> <strong>the</strong> general coastal characteristics <strong>of</strong> <strong>the</strong> study areas.<br />
In open w<strong>at</strong>er areas <strong>the</strong> environmental studies consisted <strong>of</strong> collections <strong>of</strong> zooplankton ,<br />
phytoplankton and benthic organisms. Samples were obtained <strong>at</strong> six sampling st<strong>at</strong>ions,<br />
selected to typify conditions outsi<strong>de</strong> and within <strong>the</strong> study area.<br />
Diurnal and nocturnal collections were conducted <strong>at</strong> all <strong>of</strong> <strong>the</strong> six areas i<strong>de</strong>ntified in Figure<br />
5-1. At each sampling st<strong>at</strong>ion a minimum <strong>of</strong> three zooplankton samples, three<br />
phytoplankton samples, and two w<strong>at</strong>er quality samples were obtained. A total <strong>of</strong> 48<br />
samples were obtained.<br />
Final Report 5-1 May 2004
These surveys inclu<strong>de</strong>d:<br />
• Surface plankton samples (zooplankton and phytoplankton)<br />
• Surface and subsurface w<strong>at</strong>er quality samples<br />
• Benthic and sediment samples<br />
The collected samples were preserved in-situ and sent to labor<strong>at</strong>ories <strong>at</strong> <strong>the</strong> University <strong>of</strong><br />
Panama for analysis.<br />
Due to <strong>the</strong> limited timeframe <strong>of</strong> <strong>the</strong> Disposal Altern<strong>at</strong>ives <strong>Study</strong>, only results <strong>of</strong><br />
environmental conditions during <strong>the</strong> dry season were evalu<strong>at</strong>ed. Should <strong>the</strong> island project<br />
move ahead beyond this feasibility level <strong>of</strong> analysis, it is important th<strong>at</strong> this initial<br />
inform<strong>at</strong>ion collection program be exten<strong>de</strong>d to cover <strong>the</strong> rainy season as part <strong>of</strong> <strong>the</strong><br />
environmental impact assessment (EIA) study for <strong>the</strong> project.<br />
5.2.2 Marine Habit<strong>at</strong> Evalu<strong>at</strong>ion<br />
Marine habit<strong>at</strong> evalu<strong>at</strong>ion was conducted visually in coastal areas <strong>of</strong> Palo Seco, Kobbe, El<br />
Chorrillo, and Farfan during low and high ti<strong>de</strong>s, via <strong>the</strong> analysis <strong>of</strong> sediment granulometry<br />
and existing secondary d<strong>at</strong>a. Coastal habit<strong>at</strong> evalu<strong>at</strong>ions inclu<strong>de</strong>d rocky and sandy<br />
intertidal areas.<br />
A marine sampling program was also un<strong>de</strong>rtaken, with <strong>the</strong> loc<strong>at</strong>ion <strong>of</strong> <strong>the</strong> sampling sites<br />
<strong>de</strong>signed to characterize <strong>the</strong> area covering all <strong>of</strong> <strong>the</strong> altern<strong>at</strong>ive loc<strong>at</strong>ions for <strong>the</strong> marine<br />
disposal options i<strong>de</strong>ntified <strong>at</strong> <strong>the</strong> time <strong>the</strong> surveys were being un<strong>de</strong>rtaken.<br />
Final Report 5-2 May 2004
Figure 5-1: Loc<strong>at</strong>ion <strong>of</strong> marine sampling st<strong>at</strong>ions<br />
Final Report 5-3 May 2004
Table 5-1:: Area and d<strong>at</strong>e <strong>of</strong> d<strong>at</strong>a collection <strong>of</strong> <strong>the</strong> first study.<br />
AREA<br />
DATE OF DIURNAL DATA<br />
COLLECTION<br />
DATE OF NOCTURNAL DATA<br />
COLLECTION<br />
Causeway 28/01/03 07/02/03<br />
Site 2 29/01/03 06/02/03<br />
Chorrillo 28/01/03 07/02/03<br />
Site 15 30/01/03 07/02/03<br />
Artificial<br />
<strong>Island</strong><br />
Fishing<br />
Site<br />
29/01/03 06/02/03<br />
30/01/03 07/02/03<br />
The second study inclu<strong>de</strong>d six st<strong>at</strong>ions <strong>of</strong> diurnal and nocturnal d<strong>at</strong>a collection during <strong>the</strong><br />
month <strong>of</strong> February, <strong>at</strong> similar loc<strong>at</strong>ions and following geographical coordin<strong>at</strong>es (Table<br />
5-2). The position <strong>of</strong> <strong>the</strong> d<strong>at</strong>a collection st<strong>at</strong>ions was <strong>de</strong>termined using a GPS (Global<br />
Positioning System) with a precision <strong>of</strong> 50 to 100 meters.<br />
Table 5-2: Area and coordin<strong>at</strong>es <strong>of</strong> d<strong>at</strong>a collection for <strong>the</strong> second study<br />
LOCATION<br />
EASTING<br />
COORDINATES (UTM)<br />
NORTHING<br />
Causeway 662321 984382<br />
Site 15 659565 977170<br />
Artificial <strong>Island</strong> 655906 980695<br />
Fishing Site 658061 974411<br />
Site 2 658507 9844009<br />
Chorrillo 661088 987809<br />
Final Report 5-4 May 2004
5.3 General Characteriz<strong>at</strong>ion <strong>of</strong> Panama Bay<br />
As <strong>de</strong>scribed in Section 4.5, Panama Bay and nearby areas are loc<strong>at</strong>ed within <strong>the</strong> zone <strong>of</strong><br />
influence <strong>of</strong> north winds. These winds move across <strong>the</strong> isthmus during <strong>the</strong> dry season,<br />
breaking <strong>the</strong> str<strong>at</strong>ific<strong>at</strong>ion <strong>of</strong> <strong>the</strong> w<strong>at</strong>er column and bringing <strong>de</strong>ep w<strong>at</strong>ers, characterized by<br />
<strong>the</strong>ir low temper<strong>at</strong>ure, high salinity, high concentr<strong>at</strong>ion <strong>of</strong> nutrients, strong reduction in<br />
transparency and reduced levels <strong>of</strong> dissolved oxygen, to <strong>the</strong> surface. This leads to a high<br />
level <strong>of</strong> biological productivity and stimul<strong>at</strong>es plankton production. During <strong>the</strong> rainy<br />
season, run-<strong>of</strong>f w<strong>at</strong>ers and drainage from <strong>the</strong> rivers and streams draining into <strong>the</strong> Bay<br />
produce an increase in w<strong>at</strong>er temper<strong>at</strong>ure, reduction in <strong>the</strong> levels <strong>of</strong> salinity and elev<strong>at</strong>ion<br />
<strong>of</strong> nitr<strong>at</strong>es and silic<strong>at</strong>es.<br />
The high level <strong>of</strong> contamin<strong>at</strong>ion from organic m<strong>at</strong>ter in front <strong>of</strong> Panama City and near <strong>the</strong><br />
entrance to <strong>the</strong> <strong>Canal</strong> presents a strong biochemical oxygen <strong>de</strong>mand (BOD), reducing <strong>the</strong><br />
levels <strong>of</strong> dissolved oxygen. This is in addition to <strong>the</strong> presence <strong>of</strong> hydrocarbons and<br />
contamin<strong>at</strong>ion resulting from wastew<strong>at</strong>er discharges from around <strong>the</strong> study area.<br />
Important marine communities in Panama Bay inclu<strong>de</strong> coral reefs, mangroves and benthic<br />
or pelagic fishing communities. According to recent research by ANCON and <strong>the</strong><br />
Universidad <strong>de</strong> Panamá, <strong>the</strong>re are no known sea-grass prairies in <strong>the</strong> Pacific coast <strong>of</strong> <strong>the</strong><br />
Panama <strong>Canal</strong>.<br />
Coral Reefs<br />
Until recently, coral communities existed close to <strong>the</strong> entrance to <strong>the</strong> Panama <strong>Canal</strong> near<br />
<strong>the</strong> islands <strong>of</strong> Taboga, Urabá,Taboguilla and Otoque. However, <strong>the</strong> pollution in <strong>the</strong> area,<br />
as well as <strong>the</strong> increase in suspen<strong>de</strong>d sediments and <strong>the</strong> consequent <strong>de</strong>terior<strong>at</strong>ion <strong>of</strong> <strong>the</strong><br />
w<strong>at</strong>er quality have caused continuous harm to <strong>the</strong> coral reef popul<strong>at</strong>ion. In <strong>the</strong> area<br />
around <strong>the</strong> <strong>Canal</strong>, only a few represent<strong>at</strong>ive communities remain around Taboga and<br />
Urabá islands. Currently, <strong>the</strong> only coral reef popul<strong>at</strong>ion known in <strong>the</strong> Eastern Pacific, and<br />
en<strong>de</strong>mic to Panamá, is <strong>the</strong> species Si<strong>de</strong>rastrea glynni, which has been observed around<br />
<strong>the</strong> <strong>Island</strong> <strong>of</strong> Urabá.<br />
Mangroves<br />
Typical mangrove communities are loc<strong>at</strong>ed in Perequete, Caimito, Veracruz, Balboa, and<br />
Juan Díaz. These are important ecosystems th<strong>at</strong> <strong>at</strong>tract local marine species like<br />
anchovetas and camarones peneidos. Among <strong>the</strong> communities associ<strong>at</strong>ed with <strong>the</strong>se<br />
mangroves are algae, invertebr<strong>at</strong>es, birds, mammals, larva and young fish.<br />
Mangroves <strong>of</strong>fer protection and source <strong>of</strong> nourishment for <strong>the</strong> biotic community previously<br />
mentioned. Studies conducted by D’Croz et al. (1976), D’Croz, L., and Kwiecinski, B.<br />
(1980), indic<strong>at</strong>e <strong>the</strong> presence <strong>of</strong> eight species <strong>of</strong> shrimp inhabiting among its roots.<br />
Final Report 5-5 May 2004
According to D’Croz, <strong>the</strong> species known as white shrimp or prawns (Penaeus occi<strong>de</strong>ntalis,<br />
P. stylirostris, y P. vannamei) are <strong>the</strong> most abundant in <strong>the</strong> mangroves. The young stages<br />
remain <strong>the</strong>re for a long time, and as adults <strong>the</strong>y migr<strong>at</strong>e to <strong>de</strong>eper w<strong>at</strong>ers <strong>of</strong> Panama Bay.<br />
O<strong>the</strong>r common species in <strong>the</strong> mangroves inclu<strong>de</strong> <strong>the</strong> mojarra (Eucinostomus<br />
californiensis), <strong>the</strong> anchoveta (Anchoa panamensis), and <strong>the</strong> false anchoveta<br />
(Cetengraulis mysticetus) th<strong>at</strong> is used for fish flour production (Bayliff, 1966). The young<br />
stages <strong>of</strong> <strong>the</strong> false anchoveta get nourishment mainly food filtered in <strong>the</strong> pelagic zone,<br />
while <strong>the</strong> adult phases are mostly iliófagos, but also feed on plankton (Bayliff, 1966). The<br />
anchoveta is known for spawning in front <strong>of</strong> <strong>the</strong> coast <strong>of</strong> Juan Díaz and Panamá Viejo<br />
(D’Croz,).<br />
The economic importance <strong>of</strong> <strong>the</strong> mangrove ecosystems was estim<strong>at</strong>ed by D’Croz, L. and<br />
Kwiecinski, B. (1980). Anchoveta fishing and shrimp fishing were estim<strong>at</strong>ed to produce<br />
$65,164 per km and $26,350 per km, respectively. O<strong>the</strong>r common species in artisan<br />
fishing inclu<strong>de</strong> corvine Iona (Micropogon sp.), pargos (Lutjanus sp.) and robalos<br />
(Centropomus sp) and were each estim<strong>at</strong>ed to produce $3,100 per km. While <strong>the</strong>se<br />
values are expressed in 1980 currency, <strong>the</strong>ir purpose is to <strong>de</strong>monstr<strong>at</strong>e <strong>the</strong> economic<br />
significance <strong>of</strong> <strong>the</strong> mangroves in <strong>the</strong> Panama Bay.<br />
Coastal birds and marine mammals<br />
Inform<strong>at</strong>ion obtained from Adrián Carrillo (Office <strong>of</strong> <strong>the</strong> N<strong>at</strong>ional Authority <strong>of</strong> <strong>the</strong><br />
Environment in Taboga) in an interview on June 26, 2002, reveals th<strong>at</strong> <strong>the</strong> coastal life<br />
around <strong>the</strong> island <strong>of</strong> Taboga is very rich and inclu<strong>de</strong>s a 252 hectare wildlife refuge with<br />
55,000 to 70,000 birds which nest in <strong>the</strong> southwest corner <strong>of</strong> <strong>the</strong> island. The majority <strong>of</strong><br />
<strong>the</strong>se birds inclu<strong>de</strong> pelicans and p<strong>at</strong>icuervos. Both species feed in <strong>the</strong> Bay w<strong>at</strong>ers and<br />
near <strong>the</strong> entrance to <strong>the</strong> Panama <strong>Canal</strong>. Mr. Carrillo also indic<strong>at</strong>ed th<strong>at</strong> humpback whales<br />
come close to <strong>the</strong> island between June and September, but do not stay longer due to <strong>the</strong><br />
presence <strong>of</strong> humans and ships to <strong>the</strong> east, which gener<strong>at</strong>e noise disturbances. O<strong>the</strong>r<br />
marine mammals present in <strong>the</strong> zone inclu<strong>de</strong> dolphins.<br />
Benthic organisms<br />
The factors th<strong>at</strong> influence <strong>the</strong> w<strong>at</strong>er quality may also have a neg<strong>at</strong>ive effect on plankton<br />
larvae communities, whose adult stages are also <strong>of</strong> economic importance. Some<br />
examples are <strong>the</strong> post-larvae shrimp such as Penaeus occi<strong>de</strong>ntales, P. stylorostis and P.<br />
vannamai.<br />
The most common benthic organisms found in sediment samples <strong>of</strong> <strong>the</strong> <strong>Canal</strong> area<br />
inclu<strong>de</strong> <strong>the</strong> polychaets, crustaceans and molluscs; which comprise almost 90% <strong>of</strong> <strong>the</strong><br />
biological communities in <strong>the</strong>se habit<strong>at</strong>s. Many <strong>of</strong> <strong>the</strong>se organisms are commonly used<br />
as biological indic<strong>at</strong>ors in environmental studies.<br />
Final Report 5-6 May 2004
5.4 W<strong>at</strong>er Quality and Marine D<strong>at</strong>a Studies<br />
Two marine sampling studies were performed in <strong>the</strong> overall study area. The first session<br />
took place during 2002 while <strong>the</strong> second was carried out between February and March <strong>of</strong><br />
2003. Diurnal and nocturnal collections were conducted <strong>at</strong> <strong>the</strong> areas i<strong>de</strong>ntified in Figure<br />
5-1 for <strong>the</strong> collection <strong>of</strong> w<strong>at</strong>er quality, zooplankton and phytoplankton samples. W<strong>at</strong>er<br />
quality and zooplankton d<strong>at</strong>a are available for <strong>the</strong> first study, while w<strong>at</strong>er quality,<br />
zooplankton and phytoplankton d<strong>at</strong>a are available for <strong>the</strong> second. Benthic and sediment<br />
samples were taken <strong>at</strong> <strong>the</strong> same open w<strong>at</strong>er sites indic<strong>at</strong>ed in Figure 5-1 but also inclu<strong>de</strong>d<br />
sites <strong>at</strong> Palo Seco and Kobbe Beaches.<br />
The collected samples were sent to labor<strong>at</strong>ories <strong>at</strong> <strong>the</strong> University <strong>of</strong> Panama for analysis.<br />
At <strong>the</strong> labor<strong>at</strong>ory, <strong>the</strong> samples were homogenized and a sample-drop <strong>de</strong>posited over a<br />
microscope sli<strong>de</strong> for analysis. The equipment used inclu<strong>de</strong>d an Olympus differential<br />
contrast microscope (Mo<strong>de</strong>l BX50) with an <strong>at</strong>tached 35mm Olympus camera and PM-30<br />
exposure control. All i<strong>de</strong>ntified species were recor<strong>de</strong>d. Those with no clear i<strong>de</strong>ntific<strong>at</strong>ion<br />
were photographed and preserved for fur<strong>the</strong>r analysis. W<strong>at</strong>er quality sampling did not<br />
inclu<strong>de</strong> biological oxygen <strong>de</strong>mand or nutrients, since <strong>the</strong>se are evalu<strong>at</strong>ed by ACP on a<br />
regular basis. Due to <strong>the</strong> limited timeframe <strong>of</strong> this study, only results <strong>of</strong> environmental<br />
conditions during <strong>the</strong> dry season were evalu<strong>at</strong>ed. This inform<strong>at</strong>ion should be<br />
complemented with an additional set <strong>of</strong> samples to be collected during <strong>the</strong> rainy season<br />
as part <strong>of</strong> <strong>the</strong> environmental impact assessment (EIA) study if required.<br />
A full report with <strong>de</strong>tailed results <strong>of</strong> each study is presented in Appendix E to this report.<br />
5.4.1 W<strong>at</strong>er Quality Sampling<br />
First <strong>Study</strong><br />
Physical and chemical parameters <strong>of</strong> <strong>the</strong> study sites are provi<strong>de</strong>d in Table 5-3 The<br />
diurnal surface temper<strong>at</strong>ure varied from 24.4 ºC <strong>at</strong> <strong>the</strong> Causeway to 25.05 ºC <strong>at</strong> <strong>the</strong><br />
Fishing Site. The gre<strong>at</strong>est amount <strong>of</strong> suspen<strong>de</strong>d solids (34.06 mg/L) and <strong>the</strong> gre<strong>at</strong>est<br />
<strong>de</strong>gree <strong>of</strong> salinity (35.1 0/00) were also found <strong>at</strong> <strong>the</strong> Fishing Site.<br />
Final Report 5-7 May 2004
Table 5-3: Physical-Chemical Parameters <strong>at</strong> <strong>the</strong> D<strong>at</strong>a Collection Sites.<br />
Site Diurnal Temper<strong>at</strong>ure (°C) Salinity (o/oo) Suspen<strong>de</strong>d Solids (mg/L)<br />
Causeway 24.40 34.05 33.13<br />
Site 2 24.27 34.24 33.30<br />
Chorrillo 24.84 33.89 33.01<br />
Site 15 24.83 34.94 33.92<br />
Artificial<br />
<strong>Island</strong> 24.53 34.09 33.17<br />
Fishing<br />
Site 25.05 35.10 34.06<br />
Note: No nocturnal physio-chemical d<strong>at</strong>a was collected during <strong>the</strong> first set <strong>of</strong> field studies.<br />
Second <strong>Study</strong><br />
Based on <strong>the</strong> d<strong>at</strong>a from <strong>the</strong> physical-chemical parameters provi<strong>de</strong>d by <strong>the</strong> collection<br />
group, (Table 5-4), <strong>the</strong> surface temper<strong>at</strong>ure cited during <strong>the</strong> day for <strong>the</strong> entire study area<br />
ranged from 25.1 ºC <strong>at</strong> Site 2 to 27.9 ºC <strong>at</strong> <strong>the</strong> Causeway. At night, <strong>the</strong> temper<strong>at</strong>ure<br />
fluctu<strong>at</strong>ed between 24 to 25 ºC. These values were recor<strong>de</strong>d <strong>at</strong> <strong>the</strong> Artificial <strong>Island</strong> and <strong>at</strong><br />
El Chorrillo, respectively. The highest turbidity was registered <strong>at</strong> Site 2 during <strong>the</strong> day<br />
(10.2 NTU), and <strong>the</strong> lowest turbidity was obtained <strong>at</strong> night <strong>at</strong> <strong>the</strong> Fishing Site (2 NTU).<br />
The highest oxygen levels were also obtained <strong>at</strong> <strong>the</strong> Fishing Site (8.5 mg/L). The extreme<br />
salinity records ranged from 31‰ <strong>at</strong> Site 2 during <strong>the</strong> day to 37‰ <strong>at</strong> El Chorrillo <strong>at</strong> night.<br />
Final Report 5-8 May 2004
Table 5-4: Physical-Chemical Parameters <strong>at</strong> <strong>the</strong> D<strong>at</strong>a Collection Sites.<br />
Site<br />
Type <strong>of</strong><br />
Collection<br />
Temper<strong>at</strong>ure<br />
(ºC)<br />
Turbidity<br />
(NTU)<br />
Oxygen Level<br />
(mg/L)<br />
Salinity (‰)<br />
Causeway Diurnal 27.9 2.6 5.9 34.0<br />
Causeway Nocturnal 25.6 4.7 6.1 36.0<br />
Site 15 Diurnal 26.7 1.7 6.7 35.0<br />
Site 15 Nocturnal 25.0 1.9 7.8 33.1<br />
Artificial<br />
<strong>Island</strong><br />
Artificial<br />
<strong>Island</strong><br />
Fishing<br />
Site<br />
Fishing<br />
Site<br />
Diurnal 26.4 2.5 6.9 32.0<br />
Nocturnal 24.0 4.3 6.4 31.9<br />
Diurnal 26.3 2.1 6.9 33.0<br />
Nocturnal 25.2 2.0 8.5 33.4<br />
Site 2 Diurnal 25.1 10.2 5.2 31.0<br />
Site 2 Nocturnal 24.7 8.3 6.4 31.2<br />
Chorrillo Diurnal 26.8 3.1 6.8 35.0<br />
Chorrillo Nocturnal 25.8 10.0 5.3 37.0<br />
Summary and Conclusions<br />
The values for temper<strong>at</strong>ure, salinity and suspen<strong>de</strong>d solids obtained during <strong>the</strong> first study<br />
were homogeneous throughout <strong>the</strong> entire study area and cannot be used to characterize<br />
each site and establish a correl<strong>at</strong>ion to <strong>the</strong> collected organisms <strong>at</strong> each site.<br />
The <strong>de</strong>crease in temper<strong>at</strong>ure, increase in salinity above 30 ‰ and <strong>the</strong> elev<strong>at</strong>ed<br />
concentr<strong>at</strong>ion <strong>of</strong> oxygen shown in <strong>the</strong> second study are typical p<strong>at</strong>terns caused by<br />
upwelling in <strong>the</strong> study area. D’Croz et al (2003) show th<strong>at</strong> upwelling in <strong>the</strong> Gulf <strong>of</strong><br />
Panama occurs in waves, 70% <strong>of</strong> which takes place between January and February.<br />
Final Report 5-9 May 2004
Previous studies have indic<strong>at</strong>ed th<strong>at</strong> <strong>the</strong> changes caused in <strong>the</strong> plankton communities<br />
during upwelling are affected by <strong>the</strong> temper<strong>at</strong>ure and assimil<strong>at</strong>ion <strong>of</strong> chemical species<br />
(nutrients). This is consistent with <strong>the</strong> abundance <strong>of</strong> organisms (copepods, in particular)<br />
recor<strong>de</strong>d in <strong>the</strong> study area.<br />
5.4.2 Zooplankton<br />
First <strong>Study</strong><br />
Table 5-5 shows <strong>the</strong> average <strong>de</strong>nsity <strong>of</strong> zooplankton organisms <strong>at</strong> each site. The gre<strong>at</strong>est<br />
<strong>de</strong>nsity was recor<strong>de</strong>d during <strong>the</strong> night <strong>at</strong> El Chorrillo (5,987,826.00 org/m 3 ). The gre<strong>at</strong>est<br />
diurnal <strong>de</strong>nsity also occurred <strong>at</strong> El Chorrillo (249,753 org/m 3 ).<br />
Table 5-5: Density <strong>of</strong> Organisms (org/m 3 ) N=1<br />
Site<br />
Type <strong>of</strong><br />
Density (organisms/m 3 )<br />
Collection Mean ±SEM<br />
Causeway Diurnal 55,252.46 3,665.40<br />
Causeway Nocturnal 279,171.30 1,499.87<br />
Site 2 Diurnal 2,824.11 107.72<br />
Site 2 Nocturnal 33,936.12 1,153.10<br />
Chorrillo Diurnal 249,753.10 24,169.65<br />
Chorrillo Nocturnal 5,987,826.00 17,957,430.00<br />
Site 15 Diurnal 12,467.06 2,067.88<br />
Site 15 Nocturnal 3,841,729.00 104,999.00<br />
Artificial <strong>Island</strong> Diurnal 49,724.23 14,311.54<br />
Artificial <strong>Island</strong> Nocturnal 38,431.39 17,848.89<br />
Fishing Site Diurnal 6,262.93 517.12<br />
Fishing Site Nocturnal 2,576,471.00 311,307.70<br />
Final Report 5-10 May 2004
A total <strong>of</strong> 26 taxa were i<strong>de</strong>ntified. Copepods represented approxim<strong>at</strong>ely 58.19 % <strong>of</strong> <strong>the</strong><br />
total <strong>de</strong>nsity <strong>of</strong> organisms collected during <strong>the</strong> day, with <strong>the</strong> gre<strong>at</strong>est number recor<strong>de</strong>d <strong>at</strong><br />
El Chorrillo during <strong>the</strong> night. Calanoid copepods were <strong>the</strong> most abundant group and <strong>the</strong><br />
dominant species, followed by Cladoceros and Chaetogn<strong>at</strong>ha. The Fishing Site had <strong>the</strong><br />
wi<strong>de</strong>st variety <strong>of</strong> taxa, where a total <strong>of</strong> 15 taxa were found.<br />
The <strong>de</strong>nsity <strong>of</strong> fish eggs <strong>at</strong> night was highest <strong>at</strong> Site 15 (811,169.01 org/m 3 ). This value is<br />
an or<strong>de</strong>r <strong>of</strong> magnitu<strong>de</strong> gre<strong>at</strong>er than diurnal values <strong>of</strong> fish egg <strong>de</strong>nsity. The gre<strong>at</strong>est<br />
<strong>de</strong>nsity <strong>of</strong> fish larvae during <strong>the</strong> diurnal and nocturnal collections was recor<strong>de</strong>d <strong>at</strong> El<br />
Chorrillo (3,718.41 org/m 3 ). At <strong>the</strong> Artificial <strong>Island</strong>, a total <strong>of</strong> 385 larvae were recor<strong>de</strong>d<br />
during <strong>the</strong> day. In <strong>the</strong> rest <strong>of</strong> <strong>the</strong> collection sites, no fish larvae were reported during <strong>the</strong><br />
day. The most abundant larvae were Scianidae, Engraulidae, Gobiidae and Haemulidae.<br />
The mean biomass values <strong>at</strong> each site are represented in Table 5-6. The nocturnal<br />
biomass samples ranged from 0.26 mg/m 3 <strong>at</strong> Site 15 to 3.96 mg/m 3 <strong>at</strong> El Chorrillo. The<br />
diurnal biomass samples ranged from 0.12 mg/m 3 <strong>at</strong> Site 15 to 1.64 mg/m 3 <strong>at</strong> <strong>the</strong><br />
Causeway.<br />
Final Report 5-11 May 2004
Table 5-6: Biomass Values for Diurnal and Nocturnal Collections.<br />
Site Type <strong>of</strong> Collection Dry weight (mg/m 3 )<br />
Causeway Diurnal 1.64<br />
Causeway Nocturnal 3.92<br />
Site 2 Diurnal 0.32<br />
Site 2 Nocturnal 1.38<br />
Chorrillo Diurnal 0.38<br />
Chorrillo Nocturnal 3.96<br />
Site 15 Diurnal 0.12<br />
Site 15 Nocturnal 0.26<br />
Artificial <strong>Island</strong> Diurnal 0.42<br />
Artificial <strong>Island</strong> Nocturnal 3.78<br />
Fishing Site Diurnal 0.52<br />
Fishing Site Nocturnal 0.80<br />
Second <strong>Study</strong><br />
Table 5-7 shows <strong>the</strong> average <strong>de</strong>nsity <strong>of</strong> zooplankton organisms and <strong>the</strong> mean biomass <strong>at</strong><br />
each site surveyed in <strong>the</strong> second study. The gre<strong>at</strong>est <strong>de</strong>nsity was recor<strong>de</strong>d <strong>at</strong> night <strong>at</strong> El<br />
Chorrillo (302,044.65 org/m 3 ) and is far gre<strong>at</strong>er than those <strong>at</strong> o<strong>the</strong>r sites. The gre<strong>at</strong>est<br />
diurnal <strong>de</strong>nsity occurred <strong>at</strong> Site 2 (123,076.33 org/m 3 ). The mean dry biomass for<br />
nocturnal samples was between 0.13 and 1.50 mg/m 3 . The gre<strong>at</strong>est biomass was<br />
obtained during <strong>the</strong> nocturnal period <strong>at</strong> El Chorrillo (1.50 mg/m 3 ). The mean biomass for<br />
diurnal samples was between 0.37 and 0.52 mg/m 3 . The gre<strong>at</strong>est diurnal biomass was<br />
recor<strong>de</strong>d <strong>at</strong> <strong>the</strong> Artificial <strong>Island</strong>.<br />
Final Report 5-12 May 2004
Table 5-7: Properties <strong>of</strong> Planktonic Organisms (org/m 3 ) N=3<br />
Site<br />
Type <strong>of</strong><br />
Collection<br />
Density (organisms/m 3 ) Dry weight (mg/m 3 ) Ash weight (mg/m 3 )<br />
Mean ± SEM Mean ± SEM Mean ± SEM<br />
Causeway Diurnal 33,790.65 6,852.03 0.37 0.07 0.07 0.02<br />
Causeway Nocturnal 149,756.18 49,115.26 0.67 0.04 0.17 0.02<br />
Site 15 Diurnal 18,816.15 1,332.25 0.47 0.04 0.10 0.02<br />
Site 15 Nocturnal 4,421.55 913.24 0.11 0.01 0.05 0.02<br />
Artificial<br />
<strong>Island</strong><br />
Artificial<br />
<strong>Island</strong><br />
Diurnal<br />
Nocturnal<br />
73,049.28 18,729.28 0.52 0.04 0.11 0.01<br />
15,572.77 3,067.96 0.27 0.02 0.79 0.46<br />
Fishing Site Diurnal 21,983.83 7,688.89 0.47 0.03 0.13 0.02<br />
Fishing Site Nocturnal 5,228.61 1,480.94 0.13 0.02 0.03 0.01<br />
Site 2 Diurnal 123,076.33 66,738.75 0.50 0.07 0.12 0.01<br />
Site 2 Nocturnal 35,162.04 10,591.48 1.07 0.16 0.28 0.08<br />
Chorrillo Diurnal 22,934.36 4,094.61 0.38 0.04 0.08 0.01<br />
Chorrillo Nocturnal 302,044.65 107,848.50 1.50 0.01 0.31 0.01<br />
A total <strong>of</strong> 31 taxa were i<strong>de</strong>ntified, where copepods represented approxim<strong>at</strong>ely 66.4% <strong>of</strong><br />
<strong>the</strong> total <strong>de</strong>nsity <strong>of</strong> organisms collected during <strong>the</strong> day and 65.0% <strong>of</strong> th<strong>at</strong> collected <strong>at</strong><br />
night. The site with <strong>the</strong> wi<strong>de</strong>st variety <strong>of</strong> taxa during nocturnal sampling was <strong>the</strong><br />
Causeway (18 taxa). Site 2 and El Chorrillo had <strong>the</strong> wi<strong>de</strong>st variety <strong>of</strong> taxa during diurnal<br />
sampling, each containing 13 taxa. Site 2 had <strong>the</strong> gre<strong>at</strong>est diurnal <strong>de</strong>nsity <strong>of</strong> organisms,<br />
and El Chorrillo had <strong>the</strong> gre<strong>at</strong>est nocturnal <strong>de</strong>nsity.<br />
The <strong>de</strong>nsity <strong>of</strong> fish eggs and fish larvae <strong>at</strong> night was gre<strong>at</strong>est <strong>at</strong> El Chorrillo (25,711<br />
org/m 3 ) . During <strong>the</strong> day, <strong>the</strong> highest <strong>de</strong>nsity <strong>of</strong> fish eggs and larvae was recor<strong>de</strong>d <strong>at</strong> Site 2<br />
(5,833 org/m 3 ). At Site 15 and <strong>the</strong> Fishing Site no fish larvae were reported. This could<br />
be <strong>at</strong>tributed to timing in sampling. At <strong>the</strong> Causeway, <strong>the</strong> larvae i<strong>de</strong>ntified were<br />
Engraulidae (anchovies), Gobiesocidae (a typical reef group), Polynemidae and<br />
Paralichthydae (s<strong>of</strong>t bottom group). At El Chorrillo and <strong>the</strong> Artificial <strong>Island</strong> <strong>the</strong> larvae were<br />
Engraulidae.<br />
Final Report 5-13 May 2004
At Site 2, <strong>the</strong> reported larvae were Carangidae and Gobiidae. The presence <strong>of</strong> species <strong>of</strong><br />
various habit<strong>at</strong> types (pelagic, reef bottoms, sandy bottoms) is an indic<strong>at</strong>ion <strong>of</strong> <strong>the</strong> coastal<br />
dispersion <strong>of</strong> <strong>the</strong>se larval stages.<br />
Summary and Conclusions<br />
In <strong>the</strong> first study, <strong>the</strong> gre<strong>at</strong>est concentr<strong>at</strong>ion <strong>of</strong> zooplankton seems to have occurred <strong>at</strong> El<br />
Chorrillo. However, some values <strong>at</strong> <strong>the</strong> collection sites do not agree with values obtained<br />
for <strong>the</strong> zone in o<strong>the</strong>r studies. For example, <strong>the</strong> number <strong>of</strong> larvae was expected to be<br />
gre<strong>at</strong>er <strong>at</strong> night than during <strong>the</strong> day, but <strong>the</strong> d<strong>at</strong>a showed <strong>the</strong> opposite. The discrepancy<br />
in <strong>the</strong> d<strong>at</strong>a could be due to several factors, among <strong>the</strong>m being error in <strong>the</strong> measurement<br />
<strong>of</strong> <strong>the</strong> flux meter. The collected samples were also s<strong>at</strong>ur<strong>at</strong>ed with phytoplankton,<br />
indic<strong>at</strong>ing th<strong>at</strong> a net was probably used to collect <strong>the</strong> zooplankton. Fur<strong>the</strong>rmore, <strong>the</strong> small<br />
sample size <strong>of</strong> <strong>the</strong> study may have also distorted <strong>the</strong> interpret<strong>at</strong>ion <strong>of</strong> <strong>the</strong> results.<br />
In <strong>the</strong> second study, <strong>the</strong> majority <strong>of</strong> organisms found <strong>at</strong> <strong>the</strong> collection sites was common<br />
for <strong>the</strong> coastal region and consistent with <strong>the</strong> continental pl<strong>at</strong>form and with those reported<br />
in o<strong>the</strong>r studies. The gre<strong>at</strong>est percentage <strong>of</strong> <strong>de</strong>nsity <strong>of</strong> zooplankton was calanoid<br />
copepods. Cladoceros copepods and chaetogn<strong>at</strong>ha were <strong>the</strong> most abundant organisms,<br />
specifically during <strong>the</strong> day <strong>at</strong> Site 2 and <strong>at</strong> night <strong>at</strong> El Chorrillo. Both <strong>of</strong> <strong>the</strong>se sites are<br />
loc<strong>at</strong>ed in coastal areas and provi<strong>de</strong> an insight on <strong>the</strong> importance <strong>of</strong> coastal hydrological<br />
processes and <strong>the</strong>ir potential influence on commercial fisheries. Sites near <strong>the</strong> coast<br />
showed to be more productive than sites <strong>of</strong>fshore given <strong>the</strong> former’s gre<strong>at</strong>er <strong>de</strong>nsity <strong>of</strong><br />
zooplankton. Conversely, during <strong>the</strong> day, <strong>the</strong> <strong>de</strong>nsity <strong>of</strong> zooplankton <strong>at</strong> sites near <strong>the</strong><br />
coast was lower than <strong>the</strong> <strong>de</strong>nsity <strong>of</strong> sites <strong>of</strong>fshore. However, <strong>the</strong> number <strong>of</strong> organisms<br />
was higher for <strong>the</strong> sites near <strong>the</strong> shore both during <strong>the</strong> day and <strong>at</strong> night.<br />
The consistent values for dry biomass (0.37 to 0.52 mg/m 3 ) found <strong>at</strong> all collection sites<br />
can be <strong>the</strong> result <strong>of</strong> <strong>the</strong> uniformity in <strong>the</strong> physical-chemical parameters <strong>of</strong> <strong>the</strong> area.<br />
However, <strong>the</strong>se values are very low compared to those presented by Morales (2002, in<br />
press), which shows th<strong>at</strong> <strong>the</strong> total dry biomass <strong>of</strong> zooplankton for <strong>the</strong> summer season in<br />
<strong>the</strong> Gulf <strong>of</strong> Nicoya, can be between 18.2 and 22. 69 mg/m 3 . It is likely th<strong>at</strong> <strong>the</strong> low<br />
biomass values found in this study can be strongly rel<strong>at</strong>ed to <strong>the</strong> quality <strong>of</strong> <strong>the</strong> plankton,<br />
<strong>the</strong> season and <strong>the</strong> type <strong>of</strong> net used <strong>at</strong> <strong>the</strong> time <strong>of</strong> collection.<br />
The low number <strong>of</strong> taxa reported in <strong>the</strong> second study is an indic<strong>at</strong>ion th<strong>at</strong> <strong>the</strong> zooplankton<br />
fauna is rel<strong>at</strong>ively poor when compared to more productive areas in <strong>the</strong> region. The<br />
predominance <strong>of</strong> copepods is consistent with studies conducted by Morales & Brugnoli<br />
(2001) indic<strong>at</strong>ing th<strong>at</strong> copepods were <strong>the</strong> most abundant group <strong>of</strong> zooplankton in <strong>the</strong> area<br />
<strong>of</strong> Punta Morales.<br />
Final Report 5-14 May 2004
The differences between zooplankton communities in a region may be due to <strong>the</strong> fact th<strong>at</strong><br />
<strong>the</strong> structure <strong>of</strong> a community (Gómez et al., 1995) varies as a function <strong>of</strong> hydrographic<br />
region and seasons (McGowan & Miller, 1980). Therefore, <strong>the</strong> distribution, diversity, and<br />
<strong>de</strong>nsity <strong>of</strong> organisms in zooplankton communities <strong>de</strong>pend on seasonal vari<strong>at</strong>ions and <strong>the</strong><br />
tolerance <strong>of</strong> <strong>the</strong>se organisms to environmental factors (Hernán<strong>de</strong>z-Trujillo, 1989c).<br />
The reduction or absence <strong>of</strong> fish eggs and larvae <strong>at</strong> Site 15 and <strong>the</strong> Fishing Site may be<br />
<strong>at</strong>tributed to <strong>the</strong> sites’ proximity to <strong>the</strong> area <strong>of</strong> ship transit in <strong>the</strong> Panama <strong>Canal</strong>. The<br />
<strong>de</strong>nsity <strong>of</strong> eggs found in <strong>the</strong> Causeway coinci<strong>de</strong>s with <strong>the</strong> figures reported by Gómez<br />
(1994) in a st<strong>at</strong>ion near <strong>the</strong> entrance to <strong>the</strong> <strong>Canal</strong>, where <strong>the</strong> <strong>de</strong>nsity was low due to <strong>the</strong><br />
high salinity <strong>of</strong> <strong>the</strong> area (34 and 36%). Simpson (1959) indic<strong>at</strong>es th<strong>at</strong> Engraulidae<br />
Cetengraulis mysticetus lays eggs in areas with low salinity where <strong>the</strong> Panama <strong>Canal</strong><br />
enters <strong>the</strong> Pacific Ocean, and <strong>the</strong>ir abundance is gre<strong>at</strong>er during <strong>the</strong> rainy season.<br />
From an analysis <strong>of</strong> diversity indices, each site <strong>de</strong>monstr<strong>at</strong>ed homogeneity in its individual<br />
popul<strong>at</strong>ion <strong>of</strong> zooplankton macro-fauna. When comparing taxa found across sites, <strong>the</strong><br />
sites appeared to be divi<strong>de</strong>d into two groups. Site 15, <strong>the</strong> Artificial <strong>Island</strong>, <strong>the</strong> Fishing Site,<br />
and Site 2 constitute one group consi<strong>de</strong>red to be oceanic in n<strong>at</strong>ure. The Causeway and<br />
El Chorrillo compose <strong>the</strong> second group <strong>de</strong>fined by coastal characteristics. St<strong>at</strong>istical<br />
differences were found in <strong>the</strong> <strong>de</strong>nsity <strong>of</strong> zooplankton organisms across <strong>the</strong> interaction <strong>of</strong><br />
sites and collection periods. This suggests th<strong>at</strong> <strong>the</strong> zooplankton community residing in <strong>the</strong><br />
Panama Bay is typical, <strong>de</strong>monstr<strong>at</strong>ing vertical movement and migr<strong>at</strong>ion concentr<strong>at</strong>ed <strong>at</strong><br />
coastal sites.<br />
5.4.3 Phytoplankton<br />
Second <strong>Study</strong><br />
During this study, 115 microalgae taxa were i<strong>de</strong>ntified, 91 <strong>of</strong> which were di<strong>at</strong>oms<br />
(Bacilloriophyceae) divi<strong>de</strong>d into 39 genera. In addition, 24 taxa <strong>of</strong> din<strong>of</strong>lagell<strong>at</strong>es grouped<br />
into 10 genera were also i<strong>de</strong>ntified. Table EA-5 and Table EA-6 in Appendix E show th<strong>at</strong><br />
<strong>the</strong> most common species among di<strong>at</strong>oms were: Chaetoceros anastomosans,<br />
Chaetoceros lorenzianus, Chaetoceros socialis, Coscinodiscus spp , Proboscia al<strong>at</strong>a, and<br />
Pseudonotzschia pungens. Pyrophacus horologium, Noctiluca scintillans, Peridinium cf.<br />
granii, Cer<strong>at</strong>ium furca and Cer<strong>at</strong>ium tripos, are <strong>the</strong> taxa domin<strong>at</strong>ing <strong>the</strong> din<strong>of</strong>lagell<strong>at</strong>es<br />
present in <strong>the</strong> samples.<br />
In general, <strong>the</strong> frequency in di<strong>at</strong>oms was not specific to a certain collection period. On <strong>the</strong><br />
o<strong>the</strong>r hand, din<strong>of</strong>lagell<strong>at</strong>es showed higher frequencies and more cells per species in<br />
diurnal samples than in nocturnal samples, except for Pyrophacus horologicum, which<br />
showed high frequencies in nocturnal samples taken from <strong>the</strong> Causeway.<br />
Final Report 5-15 May 2004
Table 5-8 compares <strong>the</strong> number <strong>of</strong> species collected <strong>at</strong> certain sites and collection periods<br />
across seasons (winter and summer). The average number <strong>of</strong> species found in <strong>the</strong><br />
summer samples was slightly lower than <strong>the</strong> average number <strong>of</strong> species found in <strong>the</strong><br />
winter samples. In contrast, studies conducted in <strong>the</strong> same geographic area during winter<br />
months showed lower numbers <strong>of</strong> organisms than those samples collected during <strong>the</strong><br />
summer.<br />
Some species abundant in <strong>the</strong> summer samples such as Pyrophacus horologium,<br />
Noctiluca scintillans, Chaetoceros anastomosans and Chaetoceros socialis, were not<br />
observed in <strong>the</strong> winter samples, while o<strong>the</strong>r species were equally abundant in <strong>the</strong> summer<br />
and winter. The analyses <strong>of</strong> <strong>the</strong> samples collected during <strong>the</strong> month <strong>of</strong> February showed<br />
a higher number <strong>of</strong> species and <strong>of</strong> individuals per species than samples collected during<br />
<strong>the</strong> month <strong>of</strong> January<br />
Table 5-8: Number <strong>of</strong> Species Collected in Summer (January-February) and Winter<br />
(June-August) <strong>at</strong> Common Sampling Sites<br />
Site/Samples<br />
Winter<br />
Number <strong>of</strong> Species<br />
Summer<br />
Causeway diurnal (ACP 4) 37 42<br />
Artificial <strong>Island</strong> diurnal (ACP 5) 42 39<br />
Artificial <strong>Island</strong> nocturnal (ACP 6) 32 35<br />
Fishing Site diurnal (ACP 7) 46 35<br />
Fishing Site nocturnal (ACP 14) 51 34<br />
Species present <strong>at</strong> most <strong>of</strong> <strong>the</strong> sampling sites for this study inclu<strong>de</strong>d Coscinodiscus spp,<br />
Proboscia al<strong>at</strong>a, Pseudonitzschia pungens, Chaetoceros curvisetus, Pseudosolenia calcar<br />
avis, Cer<strong>at</strong>ium furca, Noctiluca scintillans and Pyrophacus horologium. In general, all<br />
samples contained di<strong>at</strong>oms or din<strong>of</strong>lagell<strong>at</strong>es.<br />
5.4.4 Benthos<br />
Background<br />
In marine coastal zones environmental parameters vary wi<strong>de</strong>ly due to factors such as<br />
proximity to land or altered levels <strong>of</strong> salinity and w<strong>at</strong>er clarity resulting from periods <strong>of</strong> rain<br />
and drought. Among <strong>the</strong> environmental parameters frequently affected is w<strong>at</strong>er clarity.<br />
The reduction in w<strong>at</strong>er clarity produces alter<strong>at</strong>ions in <strong>the</strong> structure <strong>of</strong> biotic communities.<br />
Final Report 5-16 May 2004
On one hand, phytoplankton is favored by <strong>the</strong> presence <strong>of</strong> nutrient-rich suspen<strong>de</strong>d<br />
particles. At <strong>the</strong> same time, an increase in <strong>the</strong> phytoplankton popul<strong>at</strong>ions reduces <strong>the</strong><br />
penetr<strong>at</strong>ion <strong>of</strong> sunlight in <strong>the</strong> w<strong>at</strong>er column.<br />
At <strong>the</strong> <strong>de</strong>epest portions <strong>of</strong> <strong>the</strong> w<strong>at</strong>er column, an elev<strong>at</strong>ed concentr<strong>at</strong>ion <strong>of</strong> suspen<strong>de</strong>d<br />
sediments may also modify <strong>the</strong> benthic communities; mainly because <strong>of</strong> <strong>the</strong> neg<strong>at</strong>ive<br />
effect suspen<strong>de</strong>d sediments have on <strong>the</strong> filtering organisms. If <strong>the</strong> re-suspension <strong>of</strong><br />
sediments is elev<strong>at</strong>ed and <strong>the</strong> filtering organisms are unable to elimin<strong>at</strong>e <strong>the</strong> excess<br />
particles on <strong>the</strong>ir filtering organs, it could adversely affect <strong>the</strong> biological communities <strong>at</strong> all<br />
trophic levels. On <strong>the</strong> o<strong>the</strong>r hand, if <strong>the</strong> re-suspen<strong>de</strong>d sediments contain a high<br />
concentr<strong>at</strong>ion <strong>of</strong> organic m<strong>at</strong>erial (mainly from domestic waste) or contamin<strong>at</strong>ed<br />
compounds (hydrocarbons, pestici<strong>de</strong>s, industrial, etc) environmental risk increases.<br />
Decomposing organic m<strong>at</strong>erial requires <strong>the</strong> consumption <strong>of</strong> oxygen, cre<strong>at</strong>ing anoxic zones<br />
th<strong>at</strong> hamper <strong>the</strong> <strong>de</strong>velopment <strong>of</strong> macroscopic life. These conditions allow only for<br />
organisms adapted to living in those conditions making <strong>the</strong>m typical bio-indic<strong>at</strong>ors <strong>of</strong><br />
adverse environmental conditions. Some <strong>of</strong> <strong>the</strong>se organisms inclu<strong>de</strong> polychaets<br />
(Capitella capit<strong>at</strong>a, Heteromastus filiformis) and ulvanean macroalgae.<br />
The Panama Bay constitutes <strong>the</strong> most severe case <strong>of</strong> marine contamin<strong>at</strong>ion in <strong>the</strong> country<br />
due to <strong>the</strong> untre<strong>at</strong>ed w<strong>at</strong>ers from <strong>the</strong> city producing elev<strong>at</strong>ed concentr<strong>at</strong>ions <strong>of</strong> fecal<br />
coliforms. In some areas <strong>the</strong>re are levels th<strong>at</strong> are 496 times higher than those established<br />
for w<strong>at</strong>er consumption and public recre<strong>at</strong>ion, and 50 times higher than those established<br />
for <strong>the</strong> prolifer<strong>at</strong>ion <strong>of</strong> wildlife (D´Croz et al., 1991).<br />
<strong>Study</strong> Area<br />
The sampling sites were situ<strong>at</strong>ed near shore and in oceanic areas. The sites near shore<br />
inclu<strong>de</strong>d west and east si<strong>de</strong>s <strong>of</strong> Palo Seco Beach as well as Kobbe Beach. On Kobbe<br />
Beach and on <strong>the</strong> west si<strong>de</strong> <strong>of</strong> Palo Seco samples were collected <strong>at</strong> high and low ti<strong>de</strong>s<br />
while on <strong>the</strong> east si<strong>de</strong> <strong>of</strong> Palo Seco <strong>the</strong>y were collected only during high ti<strong>de</strong>s. The<br />
samples were taken on January 9 and 10, 2003.<br />
The sites loc<strong>at</strong>ed in open w<strong>at</strong>ers inclu<strong>de</strong>d <strong>the</strong> Causeway, Site 15, <strong>the</strong> Artificial <strong>Island</strong>, <strong>the</strong><br />
Fishing Site, Site 2 and El Chorrillo. The oceanic samples were collected on February 10<br />
and 11, 2003.<br />
Methodology<br />
At <strong>the</strong> beach, six sediment samples were taken, <strong>at</strong> each site with a 0.005 m diameter core<br />
sampler, obtaining a sample <strong>of</strong> approxim<strong>at</strong>ely 6.25x10 -4 m 3 <strong>of</strong> sediment. The m<strong>at</strong>erial<br />
collected <strong>at</strong> each st<strong>at</strong>ion was set in a plastic bag, labeled, and transported to <strong>the</strong><br />
labor<strong>at</strong>ory. The replic<strong>at</strong>es were sifted through filters <strong>of</strong> 1.0 and 0.5 mm openings, where<br />
<strong>the</strong> organisms from <strong>the</strong> benthic macro fauna were separ<strong>at</strong>ed, counted, and i<strong>de</strong>ntified. The<br />
collected organisms were i<strong>de</strong>ntified with a stereoscopic Nikon SM2-10ª microscope.<br />
Final Report 5-17 May 2004
Results and Conclusions<br />
A complete compil<strong>at</strong>ion <strong>of</strong> <strong>the</strong> results <strong>of</strong> <strong>the</strong> benthic collections can be found in Tables EA-<br />
7 through EA17 in Appendix E.<br />
Overall, <strong>the</strong> sites <strong>of</strong>fshore consisted <strong>of</strong> more diverse macro fauna than <strong>the</strong> sites on <strong>the</strong><br />
beach, although <strong>the</strong> l<strong>at</strong>ter experienced higher <strong>de</strong>nsities <strong>of</strong> macro fauna. The 10 most<br />
abundant taxa found <strong>at</strong> <strong>the</strong> beach sites belonged to <strong>the</strong> Polychaet, Mollusc, or Crustacea<br />
group, all <strong>of</strong> which comprised nearly 80% <strong>of</strong> all <strong>the</strong> samples collected <strong>at</strong> <strong>the</strong> beach. Eight<br />
<strong>of</strong> <strong>the</strong> ten most dominant taxa found <strong>at</strong> <strong>the</strong> <strong>of</strong>fshore sites were Polychaets, a group<br />
specialized in feeding <strong>of</strong>f organic m<strong>at</strong>erial from sediment. Polychaets are used as bioindic<strong>at</strong>ors<br />
<strong>of</strong> pollution and/or physically perturbed areas. Additional studies during <strong>the</strong> EIA<br />
phase <strong>of</strong> this project will require extensive sampling <strong>of</strong> <strong>the</strong>se organisms to obtain a clearer<br />
interpret<strong>at</strong>ion <strong>of</strong> <strong>the</strong> numbers found. The highest number <strong>of</strong> <strong>the</strong>se organisms was found<br />
<strong>at</strong> <strong>the</strong> Artificial <strong>Island</strong>, <strong>the</strong> Fishing Site, Site 2, and East Palo Seco.<br />
A <strong>de</strong>tailed <strong>de</strong>scription <strong>of</strong> <strong>the</strong> macro fauna collected <strong>at</strong> each site is provi<strong>de</strong>d in Table 5-9.<br />
The Artificial <strong>Island</strong> had <strong>the</strong> wi<strong>de</strong>st variety <strong>of</strong> macro fauna with a reported 7 phyla and 28<br />
taxa. The highest number <strong>of</strong> organisms was found <strong>at</strong> Site 2 (232). Polychaets were <strong>the</strong><br />
most abundant group during low ti<strong>de</strong> <strong>at</strong> <strong>the</strong> West Palo Seco st<strong>at</strong>ion as well as <strong>at</strong> <strong>the</strong><br />
Causeway, Site 15, <strong>the</strong> Artificial <strong>Island</strong>, Site 2 and El Chorrillo. Molluscs domin<strong>at</strong>ed <strong>the</strong><br />
popul<strong>at</strong>ion <strong>of</strong> macro fauna <strong>at</strong> Kobbe Beach both during low and high ti<strong>de</strong>. The majority <strong>of</strong><br />
macro fauna <strong>at</strong> West Palo Seco during high ti<strong>de</strong> and <strong>at</strong> East Palo Seco fell into <strong>the</strong><br />
Crustacea group.<br />
Through standardiz<strong>at</strong>ion <strong>of</strong> <strong>the</strong> results, samples collected <strong>at</strong> sites on <strong>the</strong> beach and<br />
<strong>of</strong>fshore were easily compared. On average, <strong>the</strong> sites loc<strong>at</strong>ed <strong>at</strong> <strong>the</strong> beach had a <strong>de</strong>nsity<br />
<strong>of</strong> 1,547 organisms per m 2 while sites <strong>of</strong>fshore had a <strong>de</strong>nsity <strong>of</strong> 490 organisms per m 2 .<br />
The highest concentr<strong>at</strong>ion <strong>of</strong> organisms was found <strong>at</strong> Kobbe Beach during high ti<strong>de</strong><br />
(2,633 org/m 2 ), and <strong>the</strong> lowest <strong>de</strong>nsity <strong>of</strong> organisms occurred <strong>at</strong> Site 15 (201 org/m 2 ).<br />
Final Report 5-18 May 2004
Table 5-9: List and abundance <strong>of</strong> <strong>the</strong> macr<strong>of</strong>auna collected <strong>at</strong> <strong>the</strong> 11 st<strong>at</strong>ions inclu<strong>de</strong>d in this study.<br />
TAXA Causeway Site 15<br />
Artificial<br />
<strong>Island</strong><br />
Fishing<br />
Site<br />
Site 2<br />
Chorrillo<br />
W. Palo Seco-<br />
LT<br />
W. Palo Seco -<br />
HT<br />
E. Palo Seco Kobbe-LT<br />
Nem<strong>at</strong>ods 4 19 15 15 6<br />
Polychaets 34 26 96 69 194 45 14 4 15 6<br />
Molluscs 7 4 4 2 29 14 3 11 16 27<br />
Crustacea 7 11 9 31 22 3 6 23 18 8<br />
Echiuras 8 4 4 2<br />
Equino<strong>de</strong>rm<strong>at</strong>a 2 1 2<br />
Chord<strong>at</strong>a 1 1<br />
TOTAL 51 45 138 122 232 72 23 38 49 43<br />
TAXA 15 15 28 14 24 12 10 7 8 12<br />
Final Report 5-19 May 2004
5.5 Marine Habit<strong>at</strong> Evalu<strong>at</strong>ion<br />
The study <strong>of</strong> <strong>the</strong> granulometry <strong>of</strong> <strong>the</strong> sediment samples collected in Palo Seco and Kobbe<br />
Beach provi<strong>de</strong>s an insight into <strong>the</strong> biological abundance and specific taxonomic groups<br />
found in those areas.<br />
Cumul<strong>at</strong>ive Curves<br />
120<br />
100<br />
Percentage<br />
80<br />
60<br />
40<br />
Palo Seco W-HT<br />
Palo Seco E<br />
Kobbe L<br />
Kobbe H<br />
20<br />
0<br />
Thick Sand Medium Sand Fine Sand Very Fine Sand Clay<br />
Type <strong>of</strong> Sediment<br />
The method for <strong>the</strong> granulometric analysis was based on <strong>the</strong> Webthmore scale. Thick<br />
sand corresponds to grain size ranging from 1.0 mm to 0.5 mm in size; medium sand 0.49<br />
mm to 0.25 mm; fine sand 0.24 mm to 0.125 mm; very fine sand 0.124 mm to 0.062 mm;<br />
and clay particles smaller than 0.062 mm.<br />
The analysis <strong>of</strong> sediment shows <strong>the</strong> presence <strong>of</strong> significantly larger grain size <strong>at</strong> Kobbe<br />
Beach and smaller clayish grain size <strong>at</strong> Palo Seco. This could be due to lower flow <strong>of</strong><br />
currents in <strong>the</strong> protected area <strong>of</strong> Palo Seco Beach and <strong>the</strong> action <strong>of</strong> dredge m<strong>at</strong>erial<br />
<strong>de</strong>position and suspen<strong>de</strong>d sediment being carried “downstream” from <strong>the</strong> <strong>Canal</strong>.<br />
S<strong>of</strong>t silts and muddy clays with rock outcrops typify <strong>the</strong> area surrounding <strong>the</strong> proposed<br />
artificial island site and neighboring islands. The s<strong>of</strong>t silts serve as habit<strong>at</strong>s for bottomdwelling<br />
fish while <strong>the</strong> rock outcrops harbor marine life such as shrimp.<br />
Final Report 5-20 May 2004
5.6 Area Fisheries<br />
The fishing industry in Panama is very active on <strong>the</strong> Pacific coast, involving more than<br />
10,000 persons. The predominant fishing resources inclu<strong>de</strong> shrimp, anchovetas and<br />
arenques which produce yields th<strong>at</strong> vary significantly from year to year (D’Croz et al.,<br />
1994). These fluctu<strong>at</strong>ions have been <strong>at</strong>tributed to vari<strong>at</strong>ions in <strong>the</strong> <strong>de</strong>nsity <strong>of</strong> annual w<strong>at</strong>er<br />
movement in <strong>the</strong> Gulf <strong>of</strong> Panama, or to <strong>the</strong> El Niño phenomenon, which affects all <strong>of</strong> <strong>the</strong><br />
Gulf area. (Kwiecinski et al., 1988).<br />
At <strong>the</strong> icthyological level, plankton samples showed <strong>the</strong> presence <strong>of</strong> fish larvae<br />
(icthyioplankton) including engraulidos, carangidos, mugilidos, and cianidos, all <strong>of</strong> which<br />
are commercial species. Of importance to this project is <strong>the</strong> massive spawning <strong>of</strong><br />
anchovetas (Cetengraulis mysticetus) th<strong>at</strong> occurs in coastal areas in front <strong>of</strong> Juan Díaz<br />
and Panamá Viejo (Bayliff, 1966). The life cycle <strong>of</strong> this species is also directly associ<strong>at</strong>ed<br />
with <strong>the</strong> presence <strong>of</strong> mangroves, which serves as spawning habit<strong>at</strong>s for anchovetas.<br />
Consequently, <strong>the</strong> biological cycle <strong>of</strong> this species is completed in w<strong>at</strong>ers far away from <strong>the</strong><br />
coast between Isla Melones and <strong>the</strong> entrance to <strong>the</strong> <strong>Canal</strong>, as well as in <strong>the</strong> areas <strong>of</strong><br />
Punta Chame, where <strong>the</strong> adult stages congreg<strong>at</strong>e to feed on planktonic organisms found<br />
in <strong>the</strong> zone.<br />
Studies <strong>of</strong> upwelling <strong>of</strong> algae and w<strong>at</strong>er mass movements in <strong>the</strong> Panama Bay (D’Croz, et.<br />
al. 1991), indic<strong>at</strong>e th<strong>at</strong> during <strong>the</strong> raining season <strong>the</strong>re is a warm mass <strong>of</strong> w<strong>at</strong>er with a<br />
salinity <strong>of</strong> 30 0 / 0 , low concentr<strong>at</strong>ion <strong>of</strong> phosph<strong>at</strong>es and chlorophyll, and low <strong>de</strong>nsity <strong>of</strong><br />
phytoplankton. In <strong>the</strong> dry season, <strong>the</strong>re is an increase in <strong>the</strong> concentr<strong>at</strong>ion <strong>of</strong> <strong>the</strong> <strong>the</strong>se<br />
components. These changes are also evi<strong>de</strong>nt in higher trophic levels accompanied by an<br />
increase in anchoas, carangidos and escómbridos fish schools, and marine birds such<br />
pelícanos and cormoranes (Glynn, 1972).<br />
Final Report 5-21 May 2004
--- THIS PAGE INTENTIONALLY BLANK ---<br />
Final Report 5-22 May 2004
6 REGIONAL ARCHAEOLOGICAL SETTING<br />
6.1 Background<br />
Important <strong>the</strong>mes in Panamanian archaeology inclu<strong>de</strong>:<br />
• Paleoindian migr<strong>at</strong>ion through <strong>the</strong> isthmus, ca. 13,000 cal BP, as evi<strong>de</strong>nced by<br />
Clovis-like stone tools<br />
• Forager adapt<strong>at</strong>ions to early Holocene environments<br />
• Origins <strong>of</strong> tropical agriculture<br />
• <strong>Development</strong> <strong>of</strong> chiefdoms<br />
• Early Spanish colonial settlements and tra<strong>de</strong> routes<br />
The results <strong>of</strong> <strong>the</strong> recent STRI survey in <strong>the</strong> ROCC (western basin <strong>of</strong> <strong>the</strong> canal) (Griggs et<br />
al. 2001) indic<strong>at</strong>e <strong>the</strong> kinds <strong>of</strong> Archaeological sites th<strong>at</strong> can be anticip<strong>at</strong>ed in central<br />
Panama and <strong>the</strong> topographic settings where <strong>the</strong>y are most likely to be i<strong>de</strong>ntified. The<br />
most numerous sites found in <strong>the</strong> ROCC survey are small hamlets (caserios) d<strong>at</strong>ing from<br />
<strong>the</strong> L<strong>at</strong>e Ceramic Period (AD 750-1650). Sites containing a newly recognized type <strong>of</strong> l<strong>at</strong>e<br />
prehistoric/early colonial period pottery (Limon ware) were concentr<strong>at</strong>ed along <strong>the</strong> Rio<br />
Cocle <strong>de</strong>l Norte and Rio Toabre. One site with Limon ceramics was i<strong>de</strong>ntified on <strong>the</strong> Rio<br />
Indio.<br />
Ano<strong>the</strong>r site loc<strong>at</strong>ed near <strong>the</strong> Rio Indio was Cantera Gran<strong>de</strong>, Cp-62. Here, biface thinning<br />
flakes <strong>of</strong> chert indic<strong>at</strong>e lithic reduction during <strong>the</strong> Paleoindian or early Preceramic periods<br />
(11,000-7000 radio-carbon bp). Also situ<strong>at</strong>ed on <strong>the</strong> Rio Indio is Pn-53, a l<strong>at</strong>e Preceramic<br />
site with C 14 d<strong>at</strong>es <strong>of</strong> ca. 6600 cal BP on carbonized seeds. Small lithic flakes found in<br />
associ<strong>at</strong>ion with <strong>the</strong> d<strong>at</strong>ed m<strong>at</strong>erial may have been used to process tubers.<br />
Prehistoric Archaeological sites <strong>of</strong> this region are classified broadly into three topographic<br />
types:<br />
• rockshelters<br />
• hamlets loc<strong>at</strong>ed on upland fl<strong>at</strong>s and hilltops or gentle slopes near rivers or creeks<br />
(quebradas)<br />
• extraction or processing sites loc<strong>at</strong>ed near <strong>de</strong>posits <strong>of</strong> valued stone (e.g., quartz)<br />
or gold. Some <strong>of</strong> <strong>the</strong> earliest colonial sites also occur near gold <strong>de</strong>posits.<br />
Final Report 6-1 May 2004
6.2 Sites <strong>of</strong> Interest in <strong>the</strong> <strong>Study</strong> Area<br />
Larger sites associ<strong>at</strong>ed with l<strong>at</strong>e prehistoric chiefdoms have been found on <strong>the</strong> Pacific<br />
slope <strong>of</strong> Panama. It has been suggested th<strong>at</strong> in <strong>the</strong> l<strong>at</strong>e prehistoric period a socio-political<br />
network called “Gran Cocle,” centered in Cocle province, linked <strong>the</strong> popul<strong>at</strong>ions <strong>of</strong> <strong>the</strong><br />
Caribbean and Pacific slopes. The eastern boundary <strong>of</strong> this interaction sphere has been<br />
set (somewh<strong>at</strong> arbitrarily) about 50 km west <strong>of</strong> <strong>the</strong> <strong>Canal</strong> Zone. However, <strong>the</strong> Venado<br />
Beach site, loc<strong>at</strong>ed in <strong>the</strong> former Howard Air Force base, seems to have been rel<strong>at</strong>ed to<br />
<strong>the</strong> Cocle culture. Here was found evi<strong>de</strong>nce <strong>of</strong> a specialized workshop for manufacture <strong>of</strong><br />
ornaments from marine shells (Spondylus). Unfortun<strong>at</strong>ely, more than 360 graves<br />
equipped with shell ornaments, gold artifacts, and painted pottery <strong>at</strong> Playa Venado were<br />
unsystem<strong>at</strong>ically excav<strong>at</strong>ed in <strong>the</strong> 1950s by members <strong>of</strong> <strong>the</strong> “Panama Archaeological<br />
Society.”<br />
Similar shell ornaments have been found by Cooke <strong>at</strong> <strong>the</strong> Cerro Juan Diaz site, loc<strong>at</strong>ed<br />
200 km to <strong>the</strong> west, on <strong>the</strong> Azuero Peninsula. They are d<strong>at</strong>ed <strong>the</strong>re to ca. AD 550-700. In<br />
both areas, <strong>the</strong> ornaments are associ<strong>at</strong>ed with painted pottery <strong>of</strong> <strong>the</strong> Cubita style. Cooke<br />
et al. (2000) hypo<strong>the</strong>size th<strong>at</strong> <strong>the</strong> manufacture <strong>of</strong> ornaments <strong>of</strong> subtidal inshore reef shells<br />
peaked during this period, and th<strong>at</strong> this industry somehow was involved in <strong>the</strong> spread <strong>of</strong><br />
<strong>the</strong> Gran Cocle tradition along <strong>the</strong> coast and on <strong>the</strong> islands in Panama Bay.<br />
It should be noted th<strong>at</strong> <strong>the</strong> corridor connecting <strong>the</strong> Excav<strong>at</strong>ion sites to <strong>the</strong> Artificial <strong>Island</strong><br />
may pass through or adjacent to <strong>the</strong> Venado Beach area. Loc<strong>at</strong>ions <strong>of</strong> ancillary facilities<br />
on this route should be investig<strong>at</strong>ed for archaeological resources prior to construction.<br />
Although additional prehistoric sites were discovered on Engineer’s Hill and o<strong>the</strong>r<br />
loc<strong>at</strong>ions on <strong>the</strong> west bank <strong>of</strong> <strong>the</strong> canal in <strong>the</strong> 1970s, <strong>the</strong>y have not been intensively<br />
investig<strong>at</strong>ed. Cooke (personal communic<strong>at</strong>ion) regards <strong>the</strong> western edge <strong>of</strong> <strong>the</strong> canal as<br />
an archaeological terra incognita. No system<strong>at</strong>ic surveys have ever been conducted<br />
<strong>the</strong>re. In his opinion, it would be particularly important to recover prehistoric m<strong>at</strong>erial from<br />
intact, d<strong>at</strong>able str<strong>at</strong>ified contexts in this area.<br />
The submerged areas <strong>of</strong> <strong>the</strong> coastal shelf may be archaeologically significant since some<br />
50 km <strong>of</strong> former dry land along <strong>the</strong> sou<strong>the</strong>rn shore <strong>of</strong> Panama Bay has been inund<strong>at</strong>ed<br />
since <strong>the</strong> end <strong>of</strong> <strong>the</strong> Pleistocene era by rising sea levels. Rel<strong>at</strong>ively intact prehistoric sites<br />
may well be loc<strong>at</strong>ed <strong>of</strong>fshore in <strong>the</strong> Gulf <strong>of</strong> Panama. Their <strong>de</strong>gree <strong>of</strong> present<strong>at</strong>ion would<br />
<strong>de</strong>pend on various factors, such as <strong>the</strong> speed <strong>of</strong> inund<strong>at</strong>ion, n<strong>at</strong>ure <strong>of</strong> overlying<br />
sediments, strength and variability <strong>of</strong> local currents, etc. However, this inund<strong>at</strong>ed zone is<br />
so vast th<strong>at</strong> <strong>the</strong> small potentially affected areas <strong>of</strong>fshore are unlikely to contain uniquely<br />
significant sites th<strong>at</strong> would merit <strong>the</strong> extraordinary effort nee<strong>de</strong>d to properly excav<strong>at</strong>e<br />
<strong>the</strong>m.<br />
Final Report 6-2 May 2004
It should be noted th<strong>at</strong> <strong>the</strong> “San Jose,” a Spanish treasure ship th<strong>at</strong> sank in 1631 has been<br />
discovered recently near <strong>the</strong> Islas <strong>de</strong> Perlas. O<strong>the</strong>r ships following <strong>the</strong> same route from<br />
<strong>the</strong> Peruvian ports may have gone down closer to shore. Lost gold-la<strong>de</strong>n vessels have<br />
doubtless been <strong>the</strong> subject <strong>of</strong> both documentary research and explor<strong>at</strong>ory dives for more<br />
than 300 years. However, vessels la<strong>de</strong>n with more mundane cargoes, which have not<br />
been so strenuously sought after, may also lie undiscovered on <strong>the</strong> sea bottom in <strong>the</strong><br />
general project area.<br />
Si<strong>de</strong>-scan sonar results from <strong>the</strong> geophysical surveys taken in January 2003 might be<br />
analyzed for sign<strong>at</strong>ures <strong>of</strong> wrecks in <strong>the</strong> project area. The d<strong>at</strong>a records did show<br />
m<strong>at</strong>erials <strong>de</strong>posited in <strong>the</strong> ACP dredged m<strong>at</strong>erials disposal sites and it is possible, though<br />
unlikely, th<strong>at</strong> sonar might allow recognition <strong>of</strong> submerged shell mid<strong>de</strong>ns associ<strong>at</strong>ed with<br />
prehistoric occup<strong>at</strong>ions. Unfortun<strong>at</strong>ely, due to problems with <strong>the</strong> si<strong>de</strong> scan equipment, it<br />
was not possible to obtain a full pr<strong>of</strong>iling <strong>of</strong> all <strong>of</strong> <strong>the</strong> survey tracks.<br />
6.3 Summary<br />
Once a preferred site has been selected for <strong>the</strong> island, it is recommen<strong>de</strong>d th<strong>at</strong> <strong>the</strong> si<strong>de</strong><br />
scan sonar records be reviewed more closely in or<strong>de</strong>r to i<strong>de</strong>ntify any areas or items <strong>of</strong><br />
potential archaeological or cultural interest within <strong>the</strong> project area.<br />
The area surrounding Playa Venado also warrants particular <strong>at</strong>tention, because <strong>the</strong> rich<br />
graves found <strong>the</strong>re probably were a ritual focus for people living in hamlets and villages in<br />
<strong>the</strong> vicinity around AD 600.<br />
Final Report 6-3 May 2004
--- THIS PAGE INTENTIONALLY BLANK ---<br />
Final Report 6-4 May 2004
7 METEOROLOGICAL & OCEANOGRAPHIC STUDIES<br />
7.1 Pacific Ocean Wave Studies<br />
The wave clim<strong>at</strong>e in <strong>the</strong> region <strong>of</strong> <strong>the</strong> potential island construction due to Pacific Ocean<br />
waves was evalu<strong>at</strong>ed using existing inform<strong>at</strong>ion in or<strong>de</strong>r to <strong>de</strong>termine wave protection<br />
requirements and potential ship motion characteristics for marine terminal options. This<br />
analysis involved <strong>the</strong> <strong>de</strong>velopment and evalu<strong>at</strong>ion <strong>of</strong> <strong>the</strong> <strong>of</strong>fshore metocean d<strong>at</strong>a and <strong>the</strong><br />
transform<strong>at</strong>ion <strong>of</strong> <strong>the</strong> <strong>of</strong>fshore wave clim<strong>at</strong>e to <strong>the</strong> study region. An overview <strong>of</strong> <strong>the</strong> results<br />
<strong>of</strong> <strong>the</strong> evalu<strong>at</strong>ion is presented in this section and <strong>the</strong> rea<strong>de</strong>r is referred to Appendix F for a<br />
more complete discussion on <strong>the</strong> <strong>of</strong>fshore and near shore wave clim<strong>at</strong>es.<br />
Hindcast Methodology<br />
A 31 year wave hindcast was obtained for <strong>the</strong> project from Oceanwe<strong>at</strong>her Inc., covering<br />
<strong>the</strong> period from early 1970 through <strong>the</strong> end <strong>of</strong> <strong>the</strong> year 2000. The hindcast process<br />
involves <strong>the</strong> collection <strong>of</strong> historical wind and wave d<strong>at</strong>a from a number <strong>of</strong> loc<strong>at</strong>ions and <strong>the</strong><br />
transfer <strong>of</strong> <strong>the</strong> wave d<strong>at</strong>a to a given site, based on wind d<strong>at</strong>a, b<strong>at</strong>hymetry and physical<br />
characteristics <strong>of</strong> <strong>the</strong> study zone.<br />
The hindcast used Oceanwe<strong>at</strong>her’s Global Reanalysis <strong>of</strong> Ocean Waves (GROW) mo<strong>de</strong>l to<br />
produce a time series <strong>of</strong> wave parameters <strong>at</strong> a loc<strong>at</strong>ion just <strong>of</strong>fshore <strong>of</strong> <strong>the</strong> entrance to <strong>the</strong><br />
Gulf <strong>of</strong> Panama. The global oceans covered in <strong>the</strong> GROW mo<strong>de</strong>l are divi<strong>de</strong>d into a 0.625<br />
by 1.25 <strong>de</strong>gree l<strong>at</strong>itu<strong>de</strong>/longitu<strong>de</strong> grid with wave and wind fields archived every three<br />
hours. In or<strong>de</strong>r to <strong>de</strong>termine <strong>the</strong> <strong>of</strong>fshore <strong>de</strong>epw<strong>at</strong>er wave condition, <strong>the</strong> hindcast wave<br />
d<strong>at</strong>a were obtained for GROW2000 mo<strong>de</strong>l grid point 30275, loc<strong>at</strong>ed <strong>at</strong> 6.875 ° l<strong>at</strong>itu<strong>de</strong> and<br />
280.0 ° longitu<strong>de</strong>, just <strong>of</strong>fshore <strong>of</strong> <strong>the</strong> Gulf <strong>of</strong> Panama as shown in Figure 7-1 The mo<strong>de</strong>l<br />
output inclu<strong>de</strong>d a time series <strong>of</strong> significant wave height, wave direction, and wave period<br />
every three hours for <strong>the</strong> entire 31 year period (1970-2000). This point was selected<br />
because it is loc<strong>at</strong>ed in an area th<strong>at</strong> captures <strong>the</strong> wave clim<strong>at</strong>e from <strong>the</strong> predominant<br />
directions expected to impact <strong>the</strong> site.<br />
Final Report 7-1 May 2004
Figure 7-1: Loc<strong>at</strong>ion <strong>of</strong> Deep W<strong>at</strong>er Wave Mo<strong>de</strong>l Grid Point<br />
N<br />
GROW MODEL<br />
Point # 30275<br />
(6.975º, 280.0º)<br />
To allow for more direct analyses, <strong>the</strong> raw wave hindcast d<strong>at</strong>a were summarized by<br />
counting <strong>the</strong> number <strong>of</strong> occurrences <strong>of</strong> particular events within <strong>de</strong>fined bins, or specific<br />
ranges <strong>of</strong> values. The wave d<strong>at</strong>a were grouped in 0.25 meter bins, <strong>the</strong> wave period d<strong>at</strong>a<br />
in 2 second bins, and <strong>the</strong> wave direction d<strong>at</strong>a in 5 <strong>de</strong>gree bins. The frequency <strong>of</strong><br />
occurrence <strong>of</strong> specific events was summarized monthly and annually. The monthly d<strong>at</strong>a<br />
consisted <strong>of</strong> <strong>the</strong> total occurrences <strong>of</strong> a particular event during a given month over <strong>the</strong> 31-<br />
year time series. The annual d<strong>at</strong>a were for all occurrences <strong>of</strong> a particular event over <strong>the</strong><br />
entire 31-year time series. By grouping <strong>the</strong> d<strong>at</strong>a this way, it was possible to calcul<strong>at</strong>e<br />
percent occurrence and percent exceedance values for <strong>the</strong> different wave conditions.<br />
Joint frequency tables are provi<strong>de</strong>d in Appendix F-Part A for <strong>the</strong> whole period <strong>of</strong> hindcast<br />
for <strong>the</strong> following pairs <strong>of</strong> variables:<br />
• Significant wave height (Hs) by peak wave period (Tp)<br />
• Peak wave period (Tp) by mean wave direction (<strong>de</strong>grees clockwise from North)<br />
• Significant wave height (Hs) by mean wave direction<br />
Offshore Wave Clim<strong>at</strong>e<br />
As seen in Figure 7-1, wave energy can only reach <strong>the</strong> entrance to <strong>the</strong> Gulf <strong>of</strong> Panama<br />
from a restricted direction due to <strong>the</strong> geometric shape <strong>of</strong> <strong>the</strong> Gulf itself and <strong>the</strong><br />
surrounding geography. The only significant wave energy th<strong>at</strong> can affect <strong>the</strong> project site is<br />
from a window extending from south to west-southwest (180°–247.5°). The <strong>of</strong>fshore fetch<br />
to <strong>the</strong> south is limited by <strong>the</strong> west coast <strong>of</strong> Ecuador which blocks some <strong>of</strong> <strong>the</strong> large swells<br />
th<strong>at</strong> origin<strong>at</strong>e near <strong>the</strong> Antarctic. The Azuero Peninsular <strong>at</strong> <strong>the</strong> western edge <strong>of</strong> <strong>the</strong><br />
entrance to <strong>the</strong> Gulf <strong>of</strong> Panama limits wave energy from <strong>the</strong> northwest to west.<br />
Final Report 7-2 May 2004
The Pearl islands and o<strong>the</strong>r islands within <strong>the</strong> Gulf and <strong>the</strong> geometric configur<strong>at</strong>ion <strong>of</strong><br />
Panama Bay also provi<strong>de</strong> additional shelter from <strong>of</strong>fshore waves. Consequently, any<br />
waves <strong>at</strong> <strong>the</strong> site gener<strong>at</strong>ed from <strong>the</strong>se restricted directions will primarily be <strong>the</strong> result <strong>of</strong><br />
local winds, likely resulting in shorter period waves <strong>of</strong> limited height and energy.<br />
Significant Wave Height<br />
Figure 7-2 shows <strong>the</strong> percent occurrence <strong>of</strong> significant wave height monthly and annually.<br />
The graph illustr<strong>at</strong>es th<strong>at</strong> most significant wave heights are between 0.5 and 2.5 meters.<br />
Predominant wave heights are centered around 1.00 -1.25 m for <strong>the</strong> months <strong>of</strong> December<br />
to April and 1.50 -1.75 meters for <strong>the</strong> months <strong>of</strong> July to November.<br />
Figure 7-2: Percent Occurrence <strong>of</strong> Significant Wave Height<br />
Hindcast Wave Conditions <strong>at</strong> Oceanwe<strong>at</strong>her GROW2000 Grid Point 30275<br />
Percent Occurrence - Significant Wave Height - Monthly & Annual (1970-2000)<br />
50%<br />
45%<br />
40%<br />
35%<br />
Percent Occurrence<br />
30%<br />
25%<br />
20%<br />
15%<br />
10%<br />
5%<br />
0%<br />
0.00 0.25 0.50 0.75 1.00 1.25 1.50 1.75 2.00 2.25 2.50 2.75 3.00 3.25<br />
Significant Wave Height (m)<br />
Jan Feb Mar Apr May June July Aug Sept Oct Nov Dec Annual<br />
Final Report 7-3 May 2004
Figure 7-3 provi<strong>de</strong>s <strong>the</strong> <strong>de</strong>epw<strong>at</strong>er wave exceedance curve for significant wave heights.<br />
From <strong>the</strong> figure, it can be seen th<strong>at</strong> <strong>the</strong> <strong>of</strong>fshore wave clim<strong>at</strong>e is rel<strong>at</strong>ively mild, with<br />
significant wave heights rarely exceeding 2 meters.<br />
Figure 7-3: Percent Exceedance <strong>of</strong> Significant Wave Height<br />
100%<br />
Hindcast Wave Conditions <strong>at</strong> Oceanwe<strong>at</strong>her GROW2000 Grid Point 30275<br />
Percent Exceedance - Significant Wave Height - Annual (1970-2000)<br />
90%<br />
80%<br />
70%<br />
Percemt Exceedance<br />
60%<br />
50%<br />
40%<br />
30%<br />
20%<br />
10%<br />
0%<br />
0.00 0.25 0.50 0.75 1.00 1.25 1.50 1.75 2.00 2.25 2.50 2.75 3.00 3.25 3.50<br />
Significant Wave Height (m)<br />
Final Report 7-4 May 2004
Wave Period<br />
Figure 7-4 illustr<strong>at</strong>es <strong>the</strong> percent exceedance <strong>of</strong> wave periods within <strong>the</strong> 31-year hindcast<br />
record. From <strong>the</strong> graph, it can be seen th<strong>at</strong> over 80% <strong>of</strong> <strong>the</strong> peak <strong>of</strong>fshore waves are <strong>of</strong><br />
periods between 10 and 18 seconds.<br />
Figure 7-4: Percent Exceedance <strong>of</strong> Peak Wave Period<br />
100%<br />
Hindcast Wave Conditions <strong>at</strong> Oceanwe<strong>at</strong>her GROW2000 Grid Point 30275<br />
Percent Exceedance - Peak Wave Period - Annual (1970-2000)<br />
90%<br />
80%<br />
70%<br />
Percent Exceedance<br />
60%<br />
50%<br />
40%<br />
30%<br />
20%<br />
10%<br />
0%<br />
0 2 4 6 8 10 12 14 16 18 20 22 24 26<br />
Peak Wave Period (sec)<br />
Final Report 7-5 May 2004
Wave and Wind Direction<br />
The rel<strong>at</strong>ively small range <strong>of</strong> <strong>of</strong>fshore wave directions, limited by <strong>the</strong> geographic<br />
configur<strong>at</strong>ion <strong>of</strong> Central and South America, is clearly illustr<strong>at</strong>ed in Figure 7-5. Most<br />
waves arrive <strong>at</strong> <strong>the</strong> entrance to <strong>the</strong> Gulf <strong>of</strong> Panama from 200 to 250 <strong>de</strong>grees. The<br />
<strong>of</strong>fshore hindcast wind field is slightly shifted from <strong>the</strong> mean wave directions and is more<br />
distributed. The wind is not constrained by <strong>the</strong> land configur<strong>at</strong>ion in <strong>the</strong> same manner as<br />
waves.<br />
Figure 7-5: Percent Occurrence <strong>of</strong> Waves and Wind by Direction<br />
24%<br />
Hindcast Wave and Wind Conditions <strong>at</strong> Oceanwe<strong>at</strong>her GROW2000 Grid Point 30275<br />
Comparison <strong>of</strong> Percent Occurrence <strong>of</strong> Wave and Wind Direction - Annual (1970-2000)<br />
22%<br />
20%<br />
Mean Wave Direction<br />
Mean Wind Direction<br />
18%<br />
Percent Occurrence<br />
16%<br />
14%<br />
12%<br />
10%<br />
8%<br />
6%<br />
4%<br />
2%<br />
0%<br />
0<br />
15<br />
30<br />
45<br />
60<br />
75<br />
90<br />
105<br />
120<br />
135<br />
Direction (Degrees Azimuth)<br />
150<br />
165<br />
180<br />
195<br />
210<br />
225<br />
240<br />
255<br />
270<br />
285<br />
300<br />
315<br />
330<br />
345<br />
The percent occurrences <strong>of</strong> waves by mean wave directions are graphed for monthly and<br />
annual conditions in Figure 7-6. This graph reveals little seasonal vari<strong>at</strong>ion in <strong>the</strong> <strong>of</strong>fshore<br />
wave direction.<br />
Final Report 7-6 May 2004
Figure 7-6: Percent Occurrence <strong>of</strong> Waves vs. Wave Direction<br />
Percent Occurrence<br />
34%<br />
32%<br />
30%<br />
28%<br />
26%<br />
24%<br />
22%<br />
20%<br />
18%<br />
16%<br />
14%<br />
12%<br />
10%<br />
8%<br />
6%<br />
4%<br />
2%<br />
Hindcast Wave and Wind Conditions <strong>at</strong> Oceanwe<strong>at</strong>her GROW2000 Grid Point 30275<br />
Percent Occurrence - Waves Vs. Wave Direction - Monthly & Annual (1970-2000)<br />
0%<br />
0 20 40 60 80 100 120 140 160 180 200 220 240 260 280 300 320 340 360<br />
Direction (Degrees Azimuth)<br />
Jan Feb Mar Apr May Jun Jul Aug Sep Oct Nov Dec Annual<br />
Ti<strong>de</strong>s<br />
Tidal ranges for st<strong>at</strong>ions within <strong>the</strong> Gulf <strong>of</strong> Panama were obtained from <strong>the</strong> British<br />
Admiralty Ti<strong>de</strong> Tables and are presented in Table 7-1. The overall tidal range within <strong>the</strong><br />
Gulf is approxim<strong>at</strong>ely 4 to 5 meters.<br />
Final Report 7-7 May 2004
Table 7-1: Astronomical Ti<strong>de</strong> Level Characteristics within <strong>the</strong> Gulf <strong>of</strong> Panama<br />
Loc<strong>at</strong>ion<br />
LAT<br />
N<br />
LONG<br />
W<br />
Mean<br />
High<br />
W<strong>at</strong>er<br />
Springs<br />
(MHWS)<br />
Mean<br />
High<br />
W<strong>at</strong>er<br />
Neap<br />
(MHWN)<br />
Mean<br />
Sea<br />
Level<br />
(MSL)<br />
Mean<br />
Low<br />
W<strong>at</strong>er<br />
Neap<br />
(MLWN)<br />
Rio Chepo* 8°59’ 79°07’W 4.8 3.9 2.5 1.2 0.2<br />
Balboa* 8°57’ 79°34’W 4.9 3.8 2.6 1.1 -0.1<br />
Mean<br />
Low<br />
W<strong>at</strong>er<br />
Spring<br />
(MLWS)<br />
Punta<br />
Garachine<br />
8°05’ 78°25’W 4.2 3.3 2.2 1.1 0.2<br />
San Telmo Bay 8°18’ 78°54’W 4.2 3.3 2.1 1.1 0.2<br />
Bahia Pina 7°34’ 78°11’W 4.1 3.2 2.1 1.1 0.2<br />
Punta Malla 7°28’ 80°00’W 3.3 2.4 1.7 0.9 0.1<br />
*Permanent Tidal st<strong>at</strong>ions closest to project region<br />
Ti<strong>de</strong> levels referred to Chart D<strong>at</strong>um (m).<br />
For this study, <strong>the</strong> wave transform<strong>at</strong>ion mo<strong>de</strong>l was run <strong>at</strong> both MHWS and MLWS, with <strong>the</strong><br />
high and low tidal elev<strong>at</strong>ions taken to be 4.8 meters and 0.2 meters respectively.<br />
Extremal Wave Analysis<br />
Return periods <strong>of</strong> 2, 5, 10, 20, 50 and 100 years were computed for significant wave<br />
height. The extreme analysis shown in Table 7-2 was based on annual maximum<br />
significant wave heights for <strong>the</strong> 31 year hindcast record and used a Type I (Gumble)<br />
distribution approach.<br />
Final Report 7-8 May 2004
Table 7-2: Return Periods and Wave Heights<br />
Return Period (years)<br />
Significant Wave Height<br />
(m)<br />
2 2.6<br />
5 2.8<br />
10 3.0<br />
20 3.2<br />
50 3.4<br />
100 3.6<br />
7.2 Wave Transform<strong>at</strong>ion Analysis<br />
7.2.1 Methodology<br />
As <strong>de</strong>epw<strong>at</strong>er waves propag<strong>at</strong>e toward shore and into shallower w<strong>at</strong>er, <strong>the</strong>y are modified<br />
both in direction and height, due to interaction with <strong>the</strong> sea floor. It is important to quantify<br />
<strong>the</strong>se transform<strong>at</strong>ion effects so th<strong>at</strong> a <strong>de</strong>epw<strong>at</strong>er wave clim<strong>at</strong>e may be adapted to<br />
<strong>de</strong>scribe <strong>the</strong> nearshore clim<strong>at</strong>e <strong>at</strong> <strong>the</strong> site <strong>of</strong> interest. A wave mo<strong>de</strong>l was required to<br />
transfer <strong>the</strong> <strong>of</strong>fshore wave clim<strong>at</strong>e to <strong>the</strong> project region (proposed vicinity <strong>of</strong> <strong>the</strong> artificial<br />
islands). Regional grids were <strong>de</strong>veloped to take waves <strong>of</strong> various periods from <strong>de</strong>epw<strong>at</strong>er<br />
to <strong>the</strong> near-shore project region.<br />
Using <strong>the</strong> <strong>of</strong>fshore hindcast d<strong>at</strong>a, <strong>the</strong> waves were transformed to <strong>the</strong> project site to<br />
account for refraction, diffraction and shoaling effects from changes in <strong>the</strong> b<strong>at</strong>hymetry as<br />
waves propag<strong>at</strong>e from <strong>of</strong>fshore to <strong>the</strong> shallower near-shore project region. The wave<br />
transform<strong>at</strong>ion processes <strong>of</strong> shoaling, refraction, and diffraction <strong>de</strong>pend on <strong>the</strong> period <strong>of</strong><br />
<strong>the</strong> wave. Refraction and diffraction also <strong>de</strong>pend on <strong>the</strong> inci<strong>de</strong>nt wave direction.<br />
The process <strong>of</strong> diffraction around Punta Mala <strong>at</strong> <strong>the</strong> western edge <strong>of</strong> <strong>the</strong> entrance to <strong>the</strong><br />
Gulf <strong>of</strong> Panama and diffraction around <strong>the</strong> islands prior to <strong>the</strong> study region plays a<br />
significant role in proper represent<strong>at</strong>ion and mo<strong>de</strong>ling <strong>of</strong> <strong>the</strong> wave energy reaching <strong>the</strong><br />
study area. It was <strong>the</strong>refore critical th<strong>at</strong> a mo<strong>de</strong>l was selected with <strong>the</strong> capabilities <strong>of</strong><br />
accounting for diffraction. As a result, <strong>the</strong> Danish Hydraulic Institute, MIKE21 Parabolic<br />
Mild-Slope Mo<strong>de</strong>l (PMS) was used for this study.<br />
Final Report 7-9 May 2004
The MIKE21 Parabolic Mild-Slope Mo<strong>de</strong>l (PMS) mo<strong>de</strong>l is a parabolic linear refraction /<br />
diffraction mo<strong>de</strong>l th<strong>at</strong> takes into account <strong>the</strong> effects <strong>of</strong> refraction and shoaling due to<br />
varying <strong>de</strong>pth, diffraction along <strong>the</strong> perpendicular to <strong>the</strong> predominant wave direction and<br />
energy dissip<strong>at</strong>ion due to bottom friction and wave breaking. It is based on a parabolic<br />
approxim<strong>at</strong>ion to <strong>the</strong> elliptic mild-slope equ<strong>at</strong>ion governing <strong>the</strong> refraction, shoaling, and<br />
diffraction <strong>of</strong> linear waves propag<strong>at</strong>ing over a gently sloping b<strong>at</strong>hymetry.<br />
The parabolic approxim<strong>at</strong>ion simplifies <strong>the</strong> comput<strong>at</strong>ion and is obtained by assuming<br />
waves travel in <strong>the</strong> x-direction and by neglecting diffraction along this direction. The<br />
parabolic approxim<strong>at</strong>ion limits <strong>the</strong> allowable angle between <strong>the</strong> direction <strong>of</strong> wave<br />
propag<strong>at</strong>ion and <strong>the</strong> x-axis. Several techniques allowing for larger <strong>de</strong>vi<strong>at</strong>ions in wave<br />
angle up to 60 <strong>de</strong>grees from <strong>the</strong> predominant wave direction are available within <strong>the</strong> PMS<br />
mo<strong>de</strong>l (Padé’s mo<strong>de</strong>l and Kirby’s Minimax mo<strong>de</strong>l). The solution to <strong>the</strong> wave parameters is<br />
<strong>de</strong>termined on a rectangular Cartesian grid using Crank-Nicolson finite difference<br />
techniques.<br />
7.2.2 B<strong>at</strong>hymetry<br />
The b<strong>at</strong>hymetry d<strong>at</strong>a for <strong>the</strong> inshore wave analysis was obtained from nautical charts<br />
(Admiralty – Chart 1929: “Gulf <strong>of</strong> Panama” and Chart 1401: “Approaches to <strong>the</strong> Panama<br />
<strong>Canal</strong>”) and <strong>the</strong> recently completed hydrographic survey <strong>of</strong> <strong>the</strong> study region 13 . Current<br />
d<strong>at</strong>a with higher resolution <strong>of</strong> <strong>the</strong> b<strong>at</strong>hymetric inform<strong>at</strong>ion in <strong>the</strong> study region, especially<br />
near <strong>the</strong> site where <strong>the</strong> w<strong>at</strong>er <strong>de</strong>pths are shallower and wave interaction with <strong>the</strong> seafloor<br />
is increased, provi<strong>de</strong>s improved results for wave transform<strong>at</strong>ion calcul<strong>at</strong>ions. The<br />
b<strong>at</strong>hymetry for <strong>the</strong> Gulf <strong>of</strong> Panama and study region was digitized from this d<strong>at</strong>a. All<br />
vertical d<strong>at</strong>a was referenced to Chart D<strong>at</strong>um, approxim<strong>at</strong>ely Mean Low W<strong>at</strong>er Springs<br />
(MLWS). From <strong>the</strong> b<strong>at</strong>hymetry <strong>of</strong> <strong>the</strong> Gulf, a smaller mo<strong>de</strong>l region was extracted as<br />
shown in Figure 7-7.<br />
13 ACP – January 2003<br />
Final Report 7-10 May 2004
Figure 7-7: Inshore Wave Mo<strong>de</strong>l Limits<br />
INSERT FIGURE 3-1 from wave report<br />
Final Report 7-11 May 2004
7.2.3 Mo<strong>de</strong>ling Approach<br />
In or<strong>de</strong>r to transform <strong>the</strong> <strong>de</strong>epw<strong>at</strong>er waves to those representing <strong>the</strong> nearshore wave<br />
clim<strong>at</strong>e <strong>at</strong> <strong>the</strong> site <strong>of</strong> interest, <strong>the</strong> <strong>of</strong>fshore waves were divi<strong>de</strong>d into represent<strong>at</strong>ive perioddirection<br />
pairs. Each pair was propag<strong>at</strong>ed and transformed to calcul<strong>at</strong>e <strong>the</strong> wave clim<strong>at</strong>e<br />
within <strong>the</strong> study region. Refraction, shoaling, and diffraction were solved numerically over<br />
<strong>the</strong> mo<strong>de</strong>l area by digitizing <strong>the</strong> b<strong>at</strong>hymetry into an x-y grid and solving <strong>the</strong> governing<br />
equ<strong>at</strong>ions <strong>at</strong> each grid point<br />
The main output d<strong>at</strong>a are integral wave parameters such as wave height, peak wave<br />
period, and mean wave direction. A normalized unit inci<strong>de</strong>nt wave, specified by wave<br />
period and direction, was mo<strong>de</strong>led for each period-direction component. Grid spacing was<br />
selected to provi<strong>de</strong> a<strong>de</strong>qu<strong>at</strong>e resolution <strong>of</strong> <strong>the</strong> b<strong>at</strong>hymetry and <strong>the</strong> waves within<br />
reasonable computer storage and processing requirements.<br />
7.2.4 Mo<strong>de</strong>led Wave Conditions<br />
Wave mo<strong>de</strong>l runs were performed for w<strong>at</strong>er <strong>de</strong>pths corresponding to Mean Low W<strong>at</strong>er<br />
Spring (MLWS) and Mean High W<strong>at</strong>er Spring (MHWS), taken as 0.2 m and 4.8 m,<br />
respectively, above b<strong>at</strong>hymetry d<strong>at</strong>um (chart sounding d<strong>at</strong>um). Based on <strong>the</strong> previous<br />
<strong>of</strong>fshore wave clim<strong>at</strong>e analysis, wave periods from 6 to 20 seconds and wave directions<br />
from 200 to 240 <strong>de</strong>grees were chosen for <strong>the</strong> wave transform<strong>at</strong>ion mo<strong>de</strong>l runs.<br />
Unit wave heights were mo<strong>de</strong>led for each wave period-direction pair with wave periods<br />
taken every 2 seconds and with a directional interval <strong>of</strong> 5 <strong>de</strong>grees. In or<strong>de</strong>r to provi<strong>de</strong><br />
rel<strong>at</strong>ively smooth mo<strong>de</strong>l results and to more closely represent <strong>the</strong> n<strong>at</strong>ural vari<strong>at</strong>ion <strong>of</strong><br />
actual wave conditions, JONSWAP spectra with minor frequency and directional spreads<br />
were used to represent <strong>the</strong> <strong>of</strong>fshore boundary wave conditions.<br />
7.2.5 Mo<strong>de</strong>ling Region<br />
As shown in Figure 7-7, <strong>the</strong> b<strong>at</strong>hymetry grid for <strong>the</strong> mo<strong>de</strong>ling region was approxim<strong>at</strong>ely 60<br />
by 168 kilometers. From <strong>the</strong> larger Gulf <strong>of</strong> Panama b<strong>at</strong>hymetry grid, a comput<strong>at</strong>ional grid<br />
with uniform spacing in both <strong>the</strong> x and y-directions <strong>of</strong> 30 x 30 meters was interpol<strong>at</strong>ed and<br />
used to calcul<strong>at</strong>e transform<strong>at</strong>ion <strong>of</strong> <strong>the</strong> waves with periods <strong>of</strong> 14 to 20 seconds. This<br />
provi<strong>de</strong>d a minimum <strong>of</strong> 10 grid points per wavelength in <strong>de</strong>epw<strong>at</strong>er and a<strong>de</strong>qu<strong>at</strong>e<br />
resolution as <strong>the</strong> wavelengths are reduced in shallower w<strong>at</strong>er. The 12-second mo<strong>de</strong>ls<br />
were run using <strong>the</strong> b<strong>at</strong>hymetry grid with a higher resolution <strong>of</strong> 20 X 20 meter grid spacing.<br />
Final Report 7-12 May 2004
Figure 7-8 shows <strong>the</strong> initial mo<strong>de</strong>l grids and <strong>the</strong> reduced b<strong>at</strong>hymetry grids for <strong>the</strong> 6-10<br />
second mo<strong>de</strong>l runs, rel<strong>at</strong>ive to <strong>the</strong> original mo<strong>de</strong>ling region. The length <strong>of</strong> <strong>the</strong> mo<strong>de</strong>l grid<br />
was chosen based on diffraction behavior and <strong>the</strong> wave angle with respect to Punta Mala.<br />
For <strong>the</strong> shorter period waves, <strong>the</strong> grid was shortened a point in line with <strong>the</strong> shielding<br />
affor<strong>de</strong>d by Punta Mala and where <strong>the</strong> w<strong>at</strong>er was still <strong>de</strong>ep with respect to <strong>the</strong> wavelength<br />
(no refraction), thus allowing <strong>the</strong> <strong>of</strong>fshore wave conditions to be represent<strong>at</strong>ive <strong>at</strong> <strong>the</strong><br />
boundary.<br />
Final Report 7-13 May 2004
Figure 7-8: Mo<strong>de</strong>l Grids for Wave <strong>Study</strong><br />
INSERT FIGURE 3-2 from wave study<br />
Final Report 7-14 May 2004
Table 7-3 lists <strong>the</strong> grid size used for <strong>the</strong> entire m<strong>at</strong>rix <strong>of</strong> mo<strong>de</strong>l runs. As shown in <strong>the</strong><br />
table, some <strong>of</strong> <strong>the</strong> steeper angle mo<strong>de</strong>l runs were elimin<strong>at</strong>ed. Based on <strong>the</strong> PMS results<br />
for <strong>the</strong> 12-20 second waves, it was found th<strong>at</strong> <strong>the</strong> steeper directions did not result in<br />
significant energy reaching <strong>the</strong> proposed site. In <strong>the</strong> event th<strong>at</strong> less than 1% <strong>of</strong> <strong>the</strong><br />
<strong>of</strong>fshore wave height remained near <strong>the</strong> site for <strong>the</strong> 12-second mo<strong>de</strong>l runs, all lower period<br />
mo<strong>de</strong>l runs were elimin<strong>at</strong>ed (e.g. 235°- 240 °). The 6-8 second mo<strong>de</strong>l runs were likewise<br />
elimin<strong>at</strong>ed for <strong>the</strong> 225° -230° directions, based on <strong>the</strong> 10-second wave results.<br />
Table 7-3: Grid size used for Wave Mo<strong>de</strong>l runs<br />
Wave<br />
Direction<br />
(<strong>de</strong>grees)<br />
Wave Period (sec)<br />
6 8 10 12 14 16 18 20<br />
200 10 m 10 m 10 m 20 m 30 m 30 m 30 m 30 m<br />
205 10 m 10 m 10 m 20 m 30 m 30 m 30 m 30 m<br />
210 10 m 10 m 10 m 20 m 30 m 30 m 30 m 30 m<br />
215 10 m 10 m 10 m 20 m 30 m 30 m 30 m 30 m<br />
220 10 m 10 m 10 m 20 m 30 m 30 m 30 m 30 m<br />
225 15 m 20 m 30 m 30 m 30 m 30 m<br />
230 15 m 20 m 30 m 30 m 30 m 30 m<br />
235 20 m 30 m 30 m 30 m 30 m<br />
240 20 m 30 m 30 m 30 m 30 m<br />
Final Report 7-15 May 2004
7.2.6 Mo<strong>de</strong>l Results & Discussion<br />
The typical wave clim<strong>at</strong>e due to ocean waves in <strong>the</strong> area <strong>of</strong> <strong>the</strong> proposed artificial islands<br />
is rel<strong>at</strong>ively mild with <strong>the</strong> geometry <strong>of</strong> <strong>the</strong> Gulf <strong>of</strong> Panama and South America limiting <strong>the</strong><br />
directions <strong>of</strong> waves entering <strong>the</strong> region. The 100-year return period significant wave<br />
height was computed to be 0.7 meters with a 17 second period. These long period swell<br />
waves gener<strong>at</strong>ed by storms in <strong>the</strong> Pacific occasionally reach <strong>the</strong> area, however, <strong>the</strong>se<br />
long period waves can cause consi<strong>de</strong>rable movement <strong>of</strong> a vessel <strong>at</strong> an unprotected or<br />
partially protected berth. This in turn can lead to acceler<strong>at</strong>ed fen<strong>de</strong>r damage, inefficient or<br />
restricted cargo oper<strong>at</strong>ions and o<strong>the</strong>r oper<strong>at</strong>ional difficulties. The placement <strong>of</strong> <strong>the</strong><br />
artificial islands especially with respect to <strong>the</strong> shielding provi<strong>de</strong>d by <strong>the</strong> near-shore islands<br />
<strong>of</strong> Isla Taboga and Taboguilla will gre<strong>at</strong>ly <strong>de</strong>termine <strong>the</strong> amount <strong>of</strong> protection required for<br />
container vessel oper<strong>at</strong>ions. The gap between <strong>the</strong>se islands and <strong>the</strong> <strong>de</strong>eper w<strong>at</strong>er it<br />
contains provi<strong>de</strong>s a p<strong>at</strong>h for wave energy to get behind <strong>the</strong> islands into <strong>the</strong> proposed<br />
project region.<br />
The full results <strong>of</strong> <strong>the</strong> PMS mo<strong>de</strong>ling are presented in Appendix F <strong>of</strong> this report. Design<br />
wave conditions and wave protection requirements for each <strong>of</strong> <strong>the</strong> island loc<strong>at</strong>ions<br />
evalu<strong>at</strong>ed are presented l<strong>at</strong>er in this report, since <strong>the</strong>y are specific to <strong>the</strong> altern<strong>at</strong>ives<br />
un<strong>de</strong>r consi<strong>de</strong>r<strong>at</strong>ion.<br />
7.3 Locally-Gener<strong>at</strong>ed Waves<br />
7.3.1 Fetch Direction and Distance<br />
Following <strong>the</strong> analysis <strong>of</strong> <strong>the</strong> ocean waves th<strong>at</strong> would impact <strong>the</strong> project sites, an<br />
evalu<strong>at</strong>ion <strong>of</strong> locally-gener<strong>at</strong>ed waves was performed to assess how wind waves<br />
gener<strong>at</strong>ed within <strong>the</strong> Bahia <strong>de</strong> Panama would dict<strong>at</strong>e <strong>de</strong>sign conditions. The island sites<br />
are exposed to rel<strong>at</strong>ively long fetches over <strong>de</strong>ep w<strong>at</strong>er to <strong>the</strong> east and southwest (see<br />
Figure 7-9). The fetch distance to <strong>the</strong> east is over 70 km; to <strong>the</strong> southwest <strong>the</strong> fetch<br />
distance is about 24 km. W<strong>at</strong>er <strong>de</strong>pths to <strong>the</strong> east range from 20 to 40 m; to <strong>the</strong><br />
southwest from 10 to 14 m. The island sites are sheltered from long fetches over <strong>de</strong>ep<br />
w<strong>at</strong>er from <strong>the</strong> north, northwest, west, south, sou<strong>the</strong>ast, and nor<strong>the</strong>ast directions.<br />
Final Report 7-16 May 2004
Figure 7-9 Radially Averaged Fetches within Panama Bay for <strong>Island</strong> Sites<br />
Final Report 7-17 May 2004
7.3.2 Wind Speed and Direction<br />
Wind speed and direction d<strong>at</strong>a were obtained from <strong>the</strong> Balboa FAA records for <strong>the</strong> period<br />
1985 through 2001. These d<strong>at</strong>a were <strong>the</strong>n used to hindcast <strong>the</strong> locally-gener<strong>at</strong>ed waves<br />
th<strong>at</strong> would impact <strong>the</strong> various island loc<strong>at</strong>ions. The hourly average wind d<strong>at</strong>a are<br />
presented in Table 7-4 as a frequency distribution and Figure 7-10 presents a wind rose<br />
graph <strong>de</strong>veloped from <strong>the</strong> same d<strong>at</strong>a. The d<strong>at</strong>a are presented for sixteen directions and<br />
six wind speed ranges, and show th<strong>at</strong> almost 67 percent (66.93) <strong>of</strong> <strong>the</strong> winds th<strong>at</strong> have<br />
been recor<strong>de</strong>d over <strong>the</strong> 17-year record most winds are from <strong>the</strong> WNW to N directions.<br />
The records also show th<strong>at</strong> maximum hourly average wind speeds from any direction are<br />
generally less than 16 knots, with slightly less than one percent (0.94%) <strong>of</strong> <strong>the</strong> recor<strong>de</strong>d<br />
winds in <strong>the</strong> 11 to 16 knot range, which is typical <strong>of</strong> <strong>the</strong> tropical coastal conditions.<br />
Final Report 7-18 May 2004
Table 7-4: Balboa FAA Hourly Average Wind D<strong>at</strong>a 1985-2001<br />
Frequency Distribution<br />
Direction<br />
Speed (knots)<br />
1-3 4-6 7-10 11-16 17 - 21 > 21 Total<br />
N 0.029856 0.022474 0.024823 0.001899 0.000000 0.000000 0.079052<br />
NNE 0.010375 0.010932 0.016032 0.001429 0.000000 0.000000 0.038768<br />
NE 0.005805 0.003006 0.001335 0.000081 0.000000 0.000000 0.010227<br />
ENE 0.005999 0.002704 0.000497 0.000013 0.000000 0.000000 0.009214<br />
E 0.007207 0.004402 0.000986 0.000027 0.000000 0.000000 0.012623<br />
ESE 0.005456 0.006422 0.001604 0.000027 0.000000 0.000000 0.013509<br />
SE 0.006402 0.013730 0.003550 0.000040 0.000000 0.000000 0.023722<br />
SSE 0.006342 0.014730 0.006134 0.000047 0.000000 0.000000 0.027252<br />
S 0.009590 0.016898 0.007261 0.000067 0.000000 0.000000 0.033815<br />
SSW 0.010133 0.011079 0.002946 0.000054 0.000000 0.000000 0.024212<br />
SW 0.007778 0.006228 0.001765 0.000060 0.000000 0.000000 0.015831<br />
WSW 0.010314 0.004765 0.000778 0.000047 0.000000 0.000000 0.015904<br />
W 0.035003 0.008147 0.001758 0.000107 0.000000 0.000000 0.045015<br />
WNW 0.078072 0.031366 0.007194 0.000705 0.000000 0.000000 0.117336<br />
NW 0.145850 0.094554 0.031332 0.003664 0.000000 0.000000 0.275400<br />
NNW 0.110874 0.058712 0.026863 0.001087 0.000000 0.000000 0.197536<br />
Total 0.485055 0.310148 0.134858 0.009355 0.000000 0.000000<br />
FREQUENCY <strong>of</strong> CALM WINDS = 0.060584<br />
Final Report 7-19 May 2004
Figure 7-10: Balboa FAA Hourly Average Wind D<strong>at</strong>a 1985-2001 Frequency<br />
Distribution Wind Rose<br />
7.3.3 Wave Hindcast Comput<strong>at</strong>ions<br />
Using <strong>the</strong> above d<strong>at</strong>a, wind-gener<strong>at</strong>ed wave calcul<strong>at</strong>ions were completed for <strong>the</strong><br />
southwest and east directions. In accordance with procedures recommen<strong>de</strong>d by <strong>the</strong> U.S.<br />
Army Corps <strong>of</strong> Engineers (USACE), Coastal Engineering Manual (CEM) (USACE 2001), a<br />
radially averaged fetch distance was computed for <strong>the</strong> two directions (70 km from east and<br />
24 km from southwest as st<strong>at</strong>ed above). Wave conditions were hindcast along <strong>the</strong>se fetch<br />
directions for <strong>the</strong> maximum hourly average winds observed over <strong>the</strong> period <strong>of</strong> record.<br />
W<strong>at</strong>er levels were evalu<strong>at</strong>ed using MHWS over <strong>the</strong> average w<strong>at</strong>er <strong>de</strong>pths within <strong>the</strong> radial<br />
fetch window. Average w<strong>at</strong>er <strong>de</strong>pth to <strong>the</strong> east is about 30 m; to <strong>the</strong> southwest about 12<br />
m. Waves were hindcast for a 16 knot (8 m/s) wind speed using methods published in <strong>the</strong><br />
CEM.<br />
Final Report 7-20 May 2004
Hindcast results are presented in Table 7-5 for significant wave height (H s ), maximum<br />
wave height (H 2% ), and peak spectral wave period (T p ), respectively. Hindcast results<br />
predict significant wave heights <strong>of</strong> about 1.0 m from <strong>the</strong> east and 0.6 m from <strong>the</strong><br />
southwest. These wave heights are comparable to those from <strong>the</strong> Pacific Ocean th<strong>at</strong><br />
have been reduced due to protection from <strong>the</strong> islands as shown in <strong>the</strong> wave mo<strong>de</strong>ling<br />
discussed above.<br />
Note th<strong>at</strong> <strong>the</strong> w<strong>at</strong>er is too <strong>de</strong>ep <strong>at</strong> <strong>the</strong> site (10 m <strong>at</strong> MLWS) to cause <strong>the</strong>se hindcast waves<br />
to break prior to reaching ei<strong>the</strong>r a breakw<strong>at</strong>er or dike/revetment structure.<br />
Table 7-5: Locally-gener<strong>at</strong>ed Significant Wave Heights (m), Maximum Wave Heights<br />
(H 2% ), and Peak Spectral Wave Periods (sec)<br />
Wave Direction H S H 2% T P<br />
East 1.0 1.8 4.1<br />
Southwest 0.6 1.1 3.1<br />
7.4 Conclusions<br />
The wave analyses show two separ<strong>at</strong>e sets <strong>of</strong> dynamics controlling <strong>the</strong> wave conditions<br />
within <strong>the</strong> study area. Panama Bay is well protected from ocean swells gener<strong>at</strong>ed in <strong>the</strong><br />
Pacific Ocean, which limits <strong>the</strong> expected 100 year significant wave height <strong>at</strong> <strong>the</strong> island site<br />
to 0.70 m from <strong>the</strong> south or south west, with a 17 second period. However, <strong>the</strong> locally<br />
gener<strong>at</strong>ed wind waves are higher <strong>at</strong> 1.0 m from <strong>the</strong> east, with a 4.1 second period. The<br />
maximum wind gener<strong>at</strong>ed wave height from <strong>the</strong> same direction is computed to be 1.8 m,<br />
also with a 4.1 second period.<br />
The difference between <strong>the</strong>se two wave dynamics is <strong>of</strong> particular importance to <strong>the</strong> long<br />
term <strong>de</strong>velopment altern<strong>at</strong>ives proposed for <strong>the</strong> study. In general terms, any wave period<br />
in excess <strong>of</strong> 7 seconds is consi<strong>de</strong>red to be “long” and problem<strong>at</strong>ic from a ship motion<br />
standpoint. Long period waves are known to have caused significant ship motion<br />
problems for Pacific Coast ports from San Antonio in Chile to Los Angeles and Long<br />
Beach, regardless <strong>of</strong> <strong>the</strong> wave height and <strong>the</strong>se could be <strong>of</strong> gre<strong>at</strong> concern for container<br />
handling install<strong>at</strong>ions loc<strong>at</strong>ed without full breakw<strong>at</strong>er protection <strong>at</strong> <strong>the</strong> artificial island.<br />
Final Report 7-21 May 2004
According to <strong>the</strong> wind d<strong>at</strong>a used for this analysis, <strong>the</strong> 1.8 m maximum wind gener<strong>at</strong>ed<br />
wave is <strong>of</strong> very short dur<strong>at</strong>ion. However for <strong>the</strong> purposes <strong>of</strong> breakw<strong>at</strong>er <strong>de</strong>sign or shore<br />
protection for <strong>the</strong> island, should be taken as <strong>the</strong> <strong>de</strong>sign wave, given th<strong>at</strong> <strong>the</strong> combin<strong>at</strong>ion<br />
<strong>of</strong> a short dur<strong>at</strong>ion storm with long period regular waves from <strong>the</strong> Pacific and <strong>the</strong> high tidal<br />
range <strong>at</strong> Panama could cause significant damage to ina<strong>de</strong>qu<strong>at</strong>ely protected shoreline<br />
structures in a short period <strong>of</strong> time.<br />
Final Report 7-22 May 2004
8 HYDRODYNAMIC MODELING<br />
Hydrodynamic mo<strong>de</strong>ls <strong>of</strong> <strong>the</strong> study area were constructed in three phases during <strong>the</strong><br />
study. This section presents <strong>the</strong> results <strong>of</strong> <strong>the</strong> baseline mo<strong>de</strong>l th<strong>at</strong> was used to test a<br />
series <strong>of</strong> altern<strong>at</strong>ive island loc<strong>at</strong>ions and configur<strong>at</strong>ions.<br />
8.1 Numerical Mo<strong>de</strong>l Description<br />
Mo<strong>de</strong>ls for this study were <strong>de</strong>veloped using <strong>the</strong> Delft3D mo<strong>de</strong>ling system. The system<br />
inclu<strong>de</strong>s <strong>the</strong> DELFT3D-FLOW hydrodynamic mo<strong>de</strong>l th<strong>at</strong> solves <strong>the</strong> Navier Stokes<br />
equ<strong>at</strong>ions for an incompressible fluid, un<strong>de</strong>r <strong>the</strong> shallow w<strong>at</strong>er and <strong>the</strong> Boussinesq<br />
assumption. Vertical acceler<strong>at</strong>ions due to buoyancy effects and sud<strong>de</strong>n vari<strong>at</strong>ions in <strong>the</strong><br />
bottom topography are not taken into account.<br />
The mo<strong>de</strong>l equ<strong>at</strong>ions are solved on a staggered grid (Arakawa C-grid). The horizontal grid<br />
is an orthogonal curvilinear grid with <strong>the</strong> w<strong>at</strong>er level points in <strong>the</strong> middle <strong>of</strong> each cell. This<br />
type <strong>of</strong> grid is topologically rectangular but is continuously distorted to m<strong>at</strong>ch certain<br />
boundaries. Two significant advantages <strong>of</strong> this type <strong>of</strong> grid are th<strong>at</strong> <strong>the</strong> grid lines can be<br />
ma<strong>de</strong> to approxim<strong>at</strong>ely line up with <strong>the</strong> n<strong>at</strong>ural boundaries and th<strong>at</strong> <strong>the</strong> grid spacing can<br />
be varied in or<strong>de</strong>r to concentr<strong>at</strong>e on regions <strong>of</strong> interest. In <strong>the</strong> vertical direction a scaled<br />
coordin<strong>at</strong>e, <strong>the</strong> so-called σ-coordin<strong>at</strong>e is used. This coordin<strong>at</strong>e system is boundary fitted<br />
both to <strong>the</strong> bottom and to <strong>the</strong> moving free surface. The number <strong>of</strong> layers is constant over<br />
<strong>the</strong> horizontal comput<strong>at</strong>ional area, and <strong>the</strong>refore a set <strong>of</strong> coupled conserv<strong>at</strong>ion equ<strong>at</strong>ions<br />
is solved for each layer.<br />
The mo<strong>de</strong>l uses an Altern<strong>at</strong>ing Direction Implicit (ADI) numerical method for <strong>the</strong> shallow<br />
w<strong>at</strong>er equ<strong>at</strong>ion. This method splits <strong>the</strong> comput<strong>at</strong>ion <strong>of</strong> one time step into two stages (<strong>the</strong><br />
two horizontal directions). In addition, <strong>the</strong> mo<strong>de</strong>l uses a fully implicit method to solve <strong>the</strong><br />
equ<strong>at</strong>ions in <strong>the</strong> vertical. The mo<strong>de</strong>l allows <strong>the</strong> wetting and drying <strong>of</strong> tidal fl<strong>at</strong>s.<br />
The system also inclu<strong>de</strong>s a mo<strong>de</strong>l th<strong>at</strong> solves <strong>the</strong> transport <strong>of</strong> dissolved substances or<br />
he<strong>at</strong> using an advection-diffusion equ<strong>at</strong>ion in <strong>the</strong> three coordin<strong>at</strong>e directions. This<br />
equ<strong>at</strong>ion is formul<strong>at</strong>ed in a conserv<strong>at</strong>ive form in orthogonal curvilinear co-ordin<strong>at</strong>es in <strong>the</strong><br />
horizontal and σ-coordin<strong>at</strong>es in <strong>the</strong> vertical. The equ<strong>at</strong>ion is solved using a Cyclic method<br />
(Stelling and Leen<strong>de</strong>rtse, 1991) which is a finite difference scheme th<strong>at</strong> conserves large<br />
gradients without gener<strong>at</strong>ing artificial oscill<strong>at</strong>ions. The method is based on an implicit time<br />
integr<strong>at</strong>ion and does not impose a stability condition. To ensure th<strong>at</strong> <strong>the</strong> total mass is<br />
conserved, <strong>the</strong> transport equ<strong>at</strong>ion is solved in a mass conserving flux form.<br />
Final Report 8-1 May 2004
Since <strong>the</strong> horizontal and vertical grids are usually too coarse and <strong>the</strong> time step too large to<br />
resolve <strong>the</strong> turbulence scales <strong>of</strong> motion in <strong>the</strong> mo<strong>de</strong>l, a closure mo<strong>de</strong>l is nee<strong>de</strong>d. The<br />
horizontal processes are represented by <strong>the</strong> Reynold’s stresses which are <strong>de</strong>termined<br />
using <strong>the</strong> eddy viscosity effect. In <strong>the</strong> vertical <strong>the</strong> k-ε turbulence mo<strong>de</strong>l is applied. In this<br />
closure mo<strong>de</strong>l, transport equ<strong>at</strong>ions for both <strong>the</strong> turbulent kinetic energy, k, and for <strong>the</strong><br />
energy dissip<strong>at</strong>ion, ε, have to be solved.<br />
8.2 Hydrographic D<strong>at</strong>a<br />
8.2.1 B<strong>at</strong>hymetry<br />
The b<strong>at</strong>hymetry d<strong>at</strong>a was obtained from nautical charts 14 (see Figure 4-1) and <strong>the</strong><br />
recently completed ACP hydrographic survey <strong>of</strong> <strong>the</strong> study region. Depths were converted<br />
from Mean Low W<strong>at</strong>er Springs (MLWS) to Mean Sea Level (MSL) using available tidal<br />
correction <strong>at</strong> <strong>the</strong> primary NOAA st<strong>at</strong>ion BALBOA loc<strong>at</strong>ed <strong>at</strong> <strong>the</strong> Pacific <strong>Canal</strong> entrance.<br />
Offshore d<strong>at</strong>a not covered by <strong>the</strong> aforementioned charts were obtained from <strong>the</strong> seafloor<br />
d<strong>at</strong>a <strong>of</strong> Smith and Sandwell, (1997) which has also been inclu<strong>de</strong>d in NOAA’s ETOPO2<br />
d<strong>at</strong>abase. These d<strong>at</strong>a were <strong>de</strong>rived from s<strong>at</strong>ellite altimetry observ<strong>at</strong>ions combined with<br />
carefully, quality-assured shipboard echo-sounding measurements. The d<strong>at</strong>a is global and<br />
is grid<strong>de</strong>d <strong>at</strong> 2-minute (l<strong>at</strong>itu<strong>de</strong>-longitu<strong>de</strong>) resolution, which in <strong>the</strong> Gulf <strong>of</strong> Panama area is<br />
in <strong>the</strong> or<strong>de</strong>r <strong>of</strong> 3.5 km.<br />
8.2.2 Tidal Boundary<br />
The mo<strong>de</strong>l tidal boundaries were obtained from <strong>the</strong> TPXO.5 (TOPEX/Poseidon Global<br />
Inverse Solution) d<strong>at</strong>a set from Oregon St<strong>at</strong>e University. TPXO.5 is a global mo<strong>de</strong>l <strong>of</strong><br />
ocean ti<strong>de</strong>s, which best fits, in a least-squares sense, <strong>the</strong> Laplace Tidal Equ<strong>at</strong>ions and<br />
track averaged d<strong>at</strong>a from 232 TOPEX/Poseidon orbit cycles. All available track d<strong>at</strong>a are<br />
averaged to <strong>the</strong> chosen d<strong>at</strong>a sites. The methods used to compute <strong>the</strong> mo<strong>de</strong>l are<br />
<strong>de</strong>scribed in <strong>de</strong>tail by Egbert, Bennett, and Foreman, (1994). The ti<strong>de</strong>s are provi<strong>de</strong>d as<br />
complex amplitu<strong>de</strong>s <strong>of</strong> earth-rel<strong>at</strong>ive sea-surface elev<strong>at</strong>ion for eight primary harmonic<br />
constituents (M2, S2, N2, K2, K1, O1, P1, Q1), on a 720x335, 1/2 <strong>de</strong>gree resolution, grid<br />
between l<strong>at</strong>itu<strong>de</strong>s <strong>of</strong> 85.75oS and 81.75oN. TPXO.5 reduced <strong>the</strong> RMS error <strong>of</strong> <strong>the</strong><br />
Topex/Poseidon d<strong>at</strong>a from 0.348 m (no tidal correction), to 0.1108 m.<br />
14 Admiralty – Chart 1929: “Gulf <strong>of</strong> Panama” and Chart 1401: “Approaches to <strong>the</strong> Panama <strong>Canal</strong>”<br />
Final Report 8-2 May 2004
8.3 Regional Mo<strong>de</strong>l<br />
In or<strong>de</strong>r to propag<strong>at</strong>e <strong>the</strong> tidal variability from <strong>de</strong>ep w<strong>at</strong>er to <strong>the</strong> entrance <strong>of</strong> Panama Bay,<br />
a Regional mo<strong>de</strong>l was first cre<strong>at</strong>ed. The mo<strong>de</strong>l is limited by <strong>the</strong> Gulf <strong>of</strong> Panama and <strong>the</strong><br />
coast <strong>of</strong> Colombia and <strong>at</strong> <strong>the</strong> South by <strong>the</strong> l<strong>at</strong>itu<strong>de</strong> <strong>of</strong> 5.5 o N and <strong>at</strong> <strong>the</strong> west by <strong>the</strong><br />
Longitu<strong>de</strong> 81 o W (see Figure 4-1).<br />
8.3.1 Mo<strong>de</strong>l Grid and B<strong>at</strong>hymetry<br />
The hydrodynamic mo<strong>de</strong>l is built on a rectangular grid with a grid size <strong>of</strong> 2,750 x 2,750<br />
meters and approxim<strong>at</strong>ely 14,800 comput<strong>at</strong>ional points. The mo<strong>de</strong>l grid is presented in<br />
Figure 8-2. The mo<strong>de</strong>l b<strong>at</strong>hymetry has been cre<strong>at</strong>ed from <strong>the</strong> sources <strong>of</strong> d<strong>at</strong>a already<br />
<strong>de</strong>scribed in section 8.2.1.<br />
Figure 8-3 shows <strong>the</strong> mo<strong>de</strong>l b<strong>at</strong>hymetry.<br />
8.3.2 Boundary Conditions<br />
Tidal conditions <strong>at</strong> <strong>the</strong> two open boundaries have been obtained from <strong>the</strong> sea-surface<br />
elev<strong>at</strong>ion for eight primary harmonic constituents (M2, S2, N2, K2, K1, O1, P1, Q1) from<br />
<strong>the</strong> TPXO.5 d<strong>at</strong>a source introduced in section 8.2.2. The two boundary conditions (South<br />
and West) are indic<strong>at</strong>ed in<br />
Figure 8-2. Time series <strong>of</strong> predicted ti<strong>de</strong>s were constructed <strong>at</strong> <strong>the</strong> three extreme points <strong>of</strong><br />
<strong>the</strong> boundaries. Along each open boundary, <strong>the</strong> mo<strong>de</strong>l interpol<strong>at</strong>es between <strong>the</strong> two<br />
specified values in or<strong>de</strong>r to prescribe <strong>the</strong> w<strong>at</strong>er level <strong>at</strong> each point <strong>of</strong> <strong>the</strong> open boundary.<br />
Final Report 8-3 May 2004
Figure 8-1: NOAA Charts 1929 and 1401<br />
Use Figure 3.1 from HB report<br />
Final Report 8-4 May 2004
Figure 8-2: Regional Mo<strong>de</strong>l Grid<br />
Use Figure 3.5 from HB report<br />
Final Report 8-5 May 2004
Figure 8-3: Regional Mo<strong>de</strong>l B<strong>at</strong>hymetry<br />
Use Figure 3.6 from HB report<br />
Final Report 8-6 May 2004
8.3.3 Regional Mo<strong>de</strong>l Verific<strong>at</strong>ion<br />
In or<strong>de</strong>r to verify <strong>the</strong> validity <strong>of</strong> <strong>the</strong> mo<strong>de</strong>l to provi<strong>de</strong> correct boundary conditions for <strong>the</strong><br />
local mo<strong>de</strong>l, <strong>the</strong> results have been compared with <strong>the</strong> field observ<strong>at</strong>ions. Time series <strong>of</strong><br />
w<strong>at</strong>er levels have been extracted from <strong>the</strong> mo<strong>de</strong>l results and compared to <strong>the</strong> observed<br />
w<strong>at</strong>er levels <strong>at</strong> <strong>the</strong> ACP st<strong>at</strong>ions i<strong>de</strong>ntified earlier.<br />
Figure 8-4 and Figure 8-5 show <strong>the</strong> comparison <strong>of</strong> <strong>the</strong> observed and simul<strong>at</strong>ed time series<br />
<strong>of</strong> w<strong>at</strong>er levels. Very good agreement is obtained <strong>at</strong> all <strong>the</strong> st<strong>at</strong>ions and <strong>the</strong>refore it can be<br />
conclu<strong>de</strong>d th<strong>at</strong> <strong>the</strong> regional mo<strong>de</strong>l accur<strong>at</strong>ely reproduces <strong>the</strong> tidal variability in <strong>the</strong> Gulf <strong>of</strong><br />
Panama and can <strong>the</strong>refore be used to gener<strong>at</strong>e tidal boundaries for <strong>the</strong> <strong>de</strong>tailed mo<strong>de</strong>l.<br />
Final Report 8-7 May 2004
Figure 8-4: Calibr<strong>at</strong>ion <strong>of</strong> Regional Mo<strong>de</strong>l Ti<strong>de</strong>s (Contadora & Taboguilla)<br />
Use Fig 3-7 from HB report<br />
Final Report 8-8 May 2004
Figure 8-5: Calibr<strong>at</strong>ion <strong>of</strong> Regional Mo<strong>de</strong>l Ti<strong>de</strong>s (Otoque & Mine Dock)<br />
Use Fig 3-8 from HB report<br />
Final Report 8-9 May 2004
8.4 Local Mo<strong>de</strong>l<br />
As <strong>de</strong>scribed in <strong>the</strong> previous section, a Regional Gulf <strong>of</strong> Panama Mo<strong>de</strong>l was used to<br />
gener<strong>at</strong>e boundary conditions for a local mo<strong>de</strong>l with finer resolution <strong>at</strong> <strong>the</strong> vicinity <strong>of</strong> <strong>the</strong><br />
project area. Mo<strong>de</strong>l Grid and B<strong>at</strong>hymetry<br />
In or<strong>de</strong>r to meet <strong>the</strong> mo<strong>de</strong>l objectives, <strong>the</strong> boundary <strong>of</strong> <strong>the</strong> local mo<strong>de</strong>l was established <strong>at</strong><br />
Punta Mala on <strong>the</strong> Azuero Peninsula, and approxim<strong>at</strong>ely followed <strong>the</strong> L<strong>at</strong>itu<strong>de</strong> 7 o 28’ N, as<br />
shown in<br />
Figure 8-2.<br />
A curvilinear grid was cre<strong>at</strong>ed with approxim<strong>at</strong>ely 44,000 no<strong>de</strong>s. The mo<strong>de</strong>l grid was<br />
<strong>de</strong>fined with <strong>the</strong> aim <strong>of</strong> having fine resolution <strong>at</strong> <strong>the</strong> project area and <strong>at</strong> <strong>the</strong> same time<br />
covering Panama Bay to <strong>the</strong> previously <strong>de</strong>scribed boundary. More than half <strong>of</strong> <strong>the</strong> no<strong>de</strong>s<br />
are loc<strong>at</strong>ed within a 15 km. from <strong>the</strong> shore, which represents less than 10% <strong>of</strong> <strong>the</strong> total<br />
mo<strong>de</strong>l area.<br />
The largest grid size is in <strong>the</strong> or<strong>de</strong>r <strong>of</strong> 5.5 km., while <strong>at</strong> <strong>the</strong> vicinity <strong>of</strong> <strong>the</strong> project <strong>the</strong> grid<br />
resolution is in <strong>the</strong> or<strong>de</strong>r <strong>of</strong> 130 m., which was consi<strong>de</strong>red enough to accur<strong>at</strong>ely represent<br />
<strong>the</strong> different project altern<strong>at</strong>ives th<strong>at</strong> will be simul<strong>at</strong>ed as part <strong>of</strong> <strong>the</strong> study.<br />
Figure 8-6 presents three different views <strong>of</strong> <strong>the</strong> <strong>de</strong>tail mo<strong>de</strong>l grid, where <strong>the</strong> high resolution<br />
<strong>at</strong> <strong>the</strong> project area can be observed. Mo<strong>de</strong>l b<strong>at</strong>hymetry has been cre<strong>at</strong>ed using <strong>the</strong><br />
available d<strong>at</strong>a sources <strong>de</strong>scribed earlier in this report. Figure 8-7 presents two different<br />
views <strong>of</strong> <strong>the</strong> <strong>de</strong>tail mo<strong>de</strong>l b<strong>at</strong>hymetry.<br />
Final Report 8-10 May 2004
Figure 8-6: Local Mo<strong>de</strong>l Grid<br />
Use Fig 3-9 from Hydro Baseline Report<br />
Final Report 8-11 May 2004
Figure 8-7: B<strong>at</strong>hymetry in Local Mo<strong>de</strong>l area<br />
Use 3-10 from Hydro baseline report<br />
Final Report 8-12 May 2004
8.4.1 Boundary Conditions<br />
The boundary condition for <strong>the</strong> mo<strong>de</strong>l is prescribed as <strong>the</strong> superposition <strong>of</strong> <strong>the</strong> tidal<br />
variability extracted from <strong>the</strong> regional mo<strong>de</strong>l and a vari<strong>at</strong>ion <strong>of</strong> <strong>the</strong> w<strong>at</strong>er level along <strong>the</strong><br />
boundary th<strong>at</strong> will account for <strong>the</strong> Gulf <strong>of</strong> Panama current. This vari<strong>at</strong>ion <strong>of</strong> <strong>the</strong> w<strong>at</strong>er level<br />
was modified until a net current p<strong>at</strong>tern similar to <strong>the</strong> one presented in <strong>the</strong> Atlas <strong>of</strong> Pilot<br />
Charts, (2001) and Bennett, (1965) was obtained. In addition, <strong>the</strong> mo<strong>de</strong>l was calibr<strong>at</strong>ed to<br />
actual observed currents (ACP, 2002) gener<strong>at</strong>ed by <strong>the</strong> tidal, oceanic and wind gener<strong>at</strong>ed<br />
currents.<br />
8.4.2 Wind Forcing<br />
In or<strong>de</strong>r to account for <strong>the</strong> effect <strong>of</strong> winds on <strong>the</strong> current p<strong>at</strong>tern <strong>the</strong> Local mo<strong>de</strong>l was<br />
forced by local winds measured <strong>at</strong> Balboa. The mo<strong>de</strong>l computes <strong>the</strong> wind shear stress<br />
th<strong>at</strong> acts on <strong>the</strong> w<strong>at</strong>er surface using <strong>the</strong> <strong>de</strong>nsity <strong>of</strong> air, <strong>the</strong> wind speed and <strong>the</strong> wind drag<br />
coefficient (Cd).<br />
8.4.3 Local Mo<strong>de</strong>l verific<strong>at</strong>ion – Existing conditions<br />
W<strong>at</strong>er levels<br />
Simul<strong>at</strong>ed w<strong>at</strong>er levels from <strong>the</strong> Local Mo<strong>de</strong>l were compared with predicted ti<strong>de</strong>s <strong>at</strong> <strong>the</strong><br />
primary and secondary st<strong>at</strong>ions. In addition, <strong>the</strong> simul<strong>at</strong>ed w<strong>at</strong>er levels were compared to<br />
w<strong>at</strong>er levels measured by ACP <strong>at</strong> <strong>the</strong> Mine Dock, Balboa, Taboguilla and Rio Chepo<br />
st<strong>at</strong>ions. Figure 8-8 and Figure 8-9 show th<strong>at</strong> good agreement was obtained between<br />
observed (predicted) and simul<strong>at</strong>ed w<strong>at</strong>er for all <strong>the</strong> st<strong>at</strong>ions and it is conclu<strong>de</strong>d th<strong>at</strong> <strong>the</strong><br />
Local mo<strong>de</strong>l can be used to accur<strong>at</strong>ely simul<strong>at</strong>e <strong>the</strong> w<strong>at</strong>er level in Panama Bay.<br />
Final Report 8-13 May 2004
Figure 8-8: Local Mo<strong>de</strong>l Ti<strong>de</strong> Calibr<strong>at</strong>ion (Mine Dock & Balboa)<br />
Use Fig 4-1 from Hydro Base report<br />
Final Report 8-14 May 2004
Figure 8-9: Local Mo<strong>de</strong>l Ti<strong>de</strong> Calibr<strong>at</strong>ion (Taboguilla & Río Chepo)<br />
Use Fig 4-2 from Hydro Base report<br />
Final Report 8-15 May 2004
8.5 Currents<br />
In or<strong>de</strong>r to verify <strong>the</strong> ability <strong>of</strong> <strong>the</strong> mo<strong>de</strong>l to simul<strong>at</strong>e current p<strong>at</strong>terns in Panama Bay,<br />
mo<strong>de</strong>l results were compared to available d<strong>at</strong>a. The <strong>de</strong>pth-averaged currents computed<br />
by <strong>the</strong> mo<strong>de</strong>l are compared to a similar observed variable. It was assumed th<strong>at</strong> <strong>the</strong> Gulf <strong>of</strong><br />
Panama Current remains constant during <strong>the</strong> entire simul<strong>at</strong>ion. This assumption is based<br />
on <strong>the</strong> small monthly variability observed in (Atlas Pilot charts, 2001) and o<strong>the</strong>r studies<br />
such as Bennett, (1965) and Delft Hydraulics, (1999), which also consi<strong>de</strong>r a mean net<br />
current in Panama Bay and disregard <strong>the</strong> possible variability <strong>of</strong> this current in time.<br />
First, <strong>the</strong> simul<strong>at</strong>ed current p<strong>at</strong>terns in <strong>the</strong> nor<strong>the</strong>rn part <strong>of</strong> <strong>the</strong> Bay were compared to <strong>the</strong><br />
<strong>de</strong>pth-mean currents computed in Bennett, 1965 for <strong>the</strong> maximum spring range. Figure<br />
8-10 and Figure 8-11 present simul<strong>at</strong>ed current p<strong>at</strong>terns during <strong>the</strong> spring ti<strong>de</strong> event <strong>of</strong><br />
May 27 th 2002 toge<strong>the</strong>r with <strong>the</strong> estim<strong>at</strong>ed currents by Bennett. Bennett’s currents are<br />
approxim<strong>at</strong>ely represented as a net current <strong>of</strong> 0.35 knot (0.18 m/s) <strong>at</strong> <strong>the</strong> inshore st<strong>at</strong>ions<br />
and 0.7 knots (0.35 m/s) <strong>at</strong> <strong>the</strong> <strong>of</strong>fshore st<strong>at</strong>ions and <strong>the</strong> mo<strong>de</strong>l reproduces quite<br />
accur<strong>at</strong>ely <strong>the</strong> magnitu<strong>de</strong> and direction <strong>of</strong> <strong>the</strong> currents <strong>at</strong> all <strong>the</strong> observ<strong>at</strong>ion points. Some<br />
discrepancies in <strong>the</strong> direction <strong>of</strong> <strong>the</strong> flood current are observed <strong>at</strong> point A and for <strong>the</strong> flood<br />
and ebb currents <strong>at</strong> point E. At point E <strong>the</strong> direction <strong>of</strong> <strong>the</strong> simul<strong>at</strong>ed current seems to be<br />
influenced by <strong>the</strong> net current and this is not observed in Bennett’s estim<strong>at</strong>ed currents.<br />
Based on <strong>the</strong>se results it can be conclu<strong>de</strong>d th<strong>at</strong> <strong>the</strong> mo<strong>de</strong>l is able to reproduce quite<br />
accur<strong>at</strong>ely <strong>the</strong> tidal and oceanic currents in Panama Bay <strong>de</strong>scribed by Bennett, (1965).<br />
Figure 8-12 and Figure 8-13 present <strong>the</strong> flow p<strong>at</strong>terns in <strong>the</strong> project area for spring and<br />
neap ti<strong>de</strong> conditions. The flow p<strong>at</strong>terns are presented <strong>at</strong> four stages <strong>of</strong> <strong>the</strong> ti<strong>de</strong>: low w<strong>at</strong>er,<br />
peak flood, high w<strong>at</strong>er and peak ebb. The influence <strong>of</strong> <strong>the</strong> Gulf <strong>of</strong> Panama current to <strong>the</strong><br />
flow p<strong>at</strong>terns in <strong>the</strong> project area is easy to be observed especially during low and high<br />
w<strong>at</strong>er conditions.<br />
In general it can be conclu<strong>de</strong>d th<strong>at</strong> <strong>the</strong> mo<strong>de</strong>l can accur<strong>at</strong>ely reproduce <strong>the</strong> average tidal<br />
and flow conditions in Panama Bay particularly during conditions when <strong>the</strong> Gulf <strong>of</strong><br />
Panama current is close to <strong>the</strong> estim<strong>at</strong>ed average. The baseline mo<strong>de</strong>l may <strong>the</strong>refore be<br />
used as an analytical tool for investig<strong>at</strong>ing <strong>the</strong> impacts th<strong>at</strong> different artificial islands<br />
altern<strong>at</strong>ives will have on <strong>the</strong> hydrodynamic conditions <strong>of</strong> Panama Bay.<br />
Final Report 8-16 May 2004
Figure 8-10: Comparison <strong>of</strong> Local Mo<strong>de</strong>l Current P<strong>at</strong>terns with Bennett (1965) - 1<br />
Use Figure 4-3 from Hydro base report<br />
Final Report 8-17 May 2004
Figure 8-11: Comparison <strong>of</strong> Local Mo<strong>de</strong>l Current P<strong>at</strong>terns with Bennett (1965) - 2<br />
Use Figure 4-4 from Hydro base report<br />
Final Report 8-18 May 2004
Figure 8-12: Spring Ti<strong>de</strong> Flow P<strong>at</strong>terns <strong>at</strong> <strong>the</strong> <strong>Study</strong> Site<br />
Use Figure 4-5 from Hydro Baseline <strong>Study</strong><br />
Final Report 8-19 May 2004
Figure 8-13: Neap Ti<strong>de</strong> Flow P<strong>at</strong>terns <strong>at</strong> <strong>the</strong> <strong>Study</strong> Site<br />
Use Figure 4-6 from Hydro Baseline <strong>Study</strong><br />
Final Report 8-20 May 2004
9 SOCIO ECONOMIC BACKGROUND<br />
9.1 Introduction<br />
The construction <strong>of</strong> an artificial island within <strong>the</strong> general study area will have positive and<br />
neg<strong>at</strong>ive socio economic impacts on <strong>the</strong> communities surrounding <strong>the</strong> project area and<br />
also on those social groups <strong>de</strong>riving income or recre<strong>at</strong>ional uses <strong>of</strong> <strong>the</strong> loc<strong>at</strong>ion.<br />
Based on <strong>the</strong> results <strong>of</strong> <strong>the</strong> Pre-<strong>Feasibility</strong> Report, it was <strong>de</strong>termined th<strong>at</strong> <strong>the</strong> following<br />
loc<strong>at</strong>ions or communities, also shown in Figure 9-1, will be impacted or could potentially<br />
benefit from <strong>the</strong> construction <strong>of</strong> <strong>the</strong> artificial island:<br />
• Taboga and Taboguilla <strong>Island</strong>s<br />
• Amador Causeway<br />
• Bique Beach<br />
• Vacamonte City<br />
• Port <strong>of</strong> Vacamonte<br />
• Veracruz Community<br />
9.2 Methodology<br />
An initial assessment was ma<strong>de</strong> <strong>of</strong> <strong>the</strong> baseline socio economic conditions on<br />
communities surrounding or potentially impacted by <strong>the</strong> construction <strong>of</strong> an artificial island<br />
within <strong>the</strong> general study area. Members <strong>of</strong> <strong>the</strong> study team visited each <strong>of</strong> <strong>the</strong> communities<br />
discussed in <strong>the</strong> following paragraphs but no direct contacts were ma<strong>de</strong> to community<br />
lea<strong>de</strong>rs or local resi<strong>de</strong>nts, due to <strong>the</strong> very preliminary n<strong>at</strong>ure <strong>of</strong> <strong>the</strong> studies and a <strong>de</strong>sire to<br />
avoid unnecessary public reactions to altern<strong>at</strong>ives th<strong>at</strong> might be discar<strong>de</strong>d l<strong>at</strong>er in <strong>the</strong><br />
study process.<br />
All <strong>of</strong> <strong>the</strong> d<strong>at</strong>a presented in <strong>the</strong> following paragraphs was obtained from public sources<br />
and through observ<strong>at</strong>ions <strong>of</strong> <strong>the</strong> study sites. Additional inform<strong>at</strong>ion was also obtained<br />
from <strong>the</strong> Panama N<strong>at</strong>ional Comptroller’s <strong>of</strong>fice (Contraloría <strong>de</strong> la Republica <strong>de</strong> Panama).<br />
Final Report 9-1 May 2004
Figure 9-1: Communities Inclu<strong>de</strong>d in Socio-Economic Overview<br />
Final Report 9-2 May 2004
9.3 Community Characteriz<strong>at</strong>ion and Baseline Conditions<br />
9.1.1 Taboga <strong>Island</strong><br />
Loc<strong>at</strong>ion & Description<br />
The island <strong>of</strong> Taboga is a popular weekend or daily tourism <strong>de</strong>stin<strong>at</strong>ion for resi<strong>de</strong>nts <strong>of</strong><br />
Panama City, with frequent ferry service from <strong>the</strong> Port <strong>of</strong> Balboa. It is also a popular daily<br />
or short term anchorage for recre<strong>at</strong>ional bo<strong>at</strong>ers from <strong>the</strong> Panama area. The island is<br />
loc<strong>at</strong>ed 12 km south west <strong>of</strong> Panama City as shown in Figure 9-3, is loc<strong>at</strong>ed within<br />
Taboga county and has a surface 17 area <strong>of</strong> 8.53km 2 .<br />
Taboga has two main beach areas, two hotels, numerous vac<strong>at</strong>ion properties, a<br />
condominium building and a number <strong>of</strong> smaller lodgings or hotels.<br />
Governmental and public district services in <strong>the</strong> island inclu<strong>de</strong> <strong>the</strong> <strong>of</strong>fice <strong>of</strong> <strong>the</strong> Mayor,<br />
Municipal Courts, Health Center, N<strong>at</strong>ional Police, <strong>of</strong>fices from The N<strong>at</strong>ional Environmental<br />
Authority (ANAM), <strong>the</strong> Panama Maritime Authority (AMP) and <strong>the</strong> Electoral College.<br />
Aqu<strong>at</strong>ic transport<strong>at</strong>ion is <strong>the</strong> only means <strong>of</strong> goods and passenger transfers to and from <strong>the</strong><br />
island. Locals go to Panama City by ferry for supplies, schooling and employment and<br />
also to adjacent Taboguilla to work <strong>at</strong> recently constructed fuel bunkering install<strong>at</strong>ions and<br />
a small fish meal plant.<br />
17 Panamanian N<strong>at</strong>ional Atlas, 1988.<br />
Final Report 9-3 May 2004
Figure 9-2: Berth and Ferry between Panama City and Taboga<br />
Popul<strong>at</strong>ion & Housing<br />
The popul<strong>at</strong>ion is distributed in <strong>the</strong> Barrio Esquivel, Barrio José Agustín Arango, Barrio<br />
Santa Rosa, Barrio Pueblo Nuevo, Barrio Congreso Arriba, Barrio La Teñi<strong>de</strong>ra and <strong>the</strong><br />
Restinga neighborhoods. From Table 9-1, it is seen th<strong>at</strong> <strong>the</strong> popul<strong>at</strong>ion 18 <strong>of</strong> <strong>the</strong> island was<br />
recor<strong>de</strong>d as 908 inhabitants in 2000, distributed in 231 houses. The island contains <strong>the</strong><br />
largest popul<strong>at</strong>ion <strong>of</strong> <strong>the</strong> three cities comprising <strong>the</strong> District <strong>of</strong> Taboga, housing 64.8% <strong>of</strong><br />
<strong>the</strong> district’s inhabitants. According to <strong>the</strong> same source, 56% <strong>of</strong> <strong>the</strong> popul<strong>at</strong>ion (509) is<br />
male and 44% (399) is female.<br />
18 Popul<strong>at</strong>ion and housing census by <strong>the</strong> Panamanian N<strong>at</strong>ional Comptroller, year 2000.<br />
Final Report 9-4 May 2004
Figure 9-3: Taboga & Taboguilla <strong>Island</strong>s<br />
Approxim<strong>at</strong>e grid size 3,650 m<br />
Final Report 9-5 May 2004
Table 9-1: Popul<strong>at</strong>ion & Housing in Taboga <strong>Island</strong> (1980 – 2000)<br />
D<strong>at</strong>a 1980 1990 2000<br />
Popul<strong>at</strong>ion 1003 1199 908<br />
Housing 222 249 231<br />
Density per km 2 117.5 140.5 106.8<br />
Source: D<strong>at</strong>a from <strong>the</strong> popul<strong>at</strong>ion and housing census by <strong>the</strong> Panamanian N<strong>at</strong>ional Comptroller, year 2000.<br />
Table 9-2 summarizes additional socio-<strong>de</strong>mographic inform<strong>at</strong>ion characteristics <strong>of</strong> <strong>the</strong><br />
island in 2000 as obtained from <strong>the</strong> Panamanian N<strong>at</strong>ional Comptroller.<br />
Table 9-2: Socio-Demographic Indic<strong>at</strong>ors in Taboga <strong>Island</strong> (2000)<br />
Average Number <strong>of</strong> Members per Household 3.7<br />
Percentage <strong>of</strong> Popul<strong>at</strong>ion Un<strong>de</strong>r 15 Years <strong>of</strong> Age 21.3%<br />
Percentage <strong>of</strong> Popul<strong>at</strong>ion Between 15 and 64 Years <strong>of</strong> Age 66.1%<br />
Number <strong>of</strong> men per 100 Women 127.6<br />
Average Age in Total Popul<strong>at</strong>ion 32<br />
Percentage <strong>of</strong> Households with Male Househol<strong>de</strong>r 79.2%<br />
Source: D<strong>at</strong>a from <strong>the</strong> popul<strong>at</strong>ion and housing census by <strong>the</strong> Panamanian N<strong>at</strong>ional Comptroller, year 2000.<br />
Economy<br />
Fishing, agriculture, and tourism play important roles in <strong>the</strong> economy <strong>of</strong> <strong>the</strong> island. While<br />
some island inhabitants travel to Panama City for employment, fishermen can make a<br />
living from <strong>the</strong> varied selection <strong>of</strong> marine life found <strong>of</strong>f <strong>the</strong> coast <strong>of</strong> <strong>the</strong> island. Likewise,<br />
farmers cultiv<strong>at</strong>e crops such as pineapples, ñame, yucca, and mangos on small parcels <strong>of</strong><br />
land. Tourism from both foreigners and resi<strong>de</strong>nts <strong>of</strong> Panama City also provi<strong>de</strong>s jobs for<br />
locals. <strong>Island</strong> inhabitants also travel to Taboguilla to work <strong>at</strong> fuel bunkering install<strong>at</strong>ions<br />
and a small fish meal plant.<br />
Final Report 9-6 May 2004
Figure 9-4: Houses on Taboga Beach<br />
Infrastructure<br />
The road network on <strong>the</strong> island consists <strong>of</strong> small, narrow, steep streets. Potable w<strong>at</strong>er is<br />
accessed through local wells and distributed by sectors. Wastew<strong>at</strong>er is dumped into <strong>the</strong><br />
ocean, and a collection service provi<strong>de</strong>d by <strong>the</strong> Taboga Municipality disposes <strong>of</strong> solid<br />
waste. The construction <strong>of</strong> a wastew<strong>at</strong>er tre<strong>at</strong>ment plant is currently un<strong>de</strong>rway.<br />
Taboga <strong>Island</strong> also has small parks, an elementary school, a health care center, a church,<br />
and two hotels.<br />
Social P<strong>at</strong>rimony in Taboga <strong>Island</strong><br />
The island <strong>of</strong> Taboga has an important historic and n<strong>at</strong>ural p<strong>at</strong>rimony. The wildlife refuge,<br />
cre<strong>at</strong>ed on October 21, 1984, is consi<strong>de</strong>red to be a sanctuary for 75,000 to 85,000<br />
migr<strong>at</strong>ory birds.<br />
Final Report 9-7 May 2004
Figure 9-5: Paved Road and Souvenir Stand Close to Ferry Landing in Taboga<br />
9.1.2 Amador Causeway<br />
While not specifically a community in <strong>the</strong> same manner as <strong>the</strong> o<strong>the</strong>rs examined in this<br />
section, <strong>the</strong> <strong>de</strong>velopment and use <strong>of</strong> <strong>the</strong> Amador Causeway is an important factor in <strong>the</strong><br />
assessment <strong>of</strong> altern<strong>at</strong>ive loc<strong>at</strong>ions and long term uses for <strong>the</strong> artificial island project.<br />
The recent <strong>de</strong>velopment <strong>of</strong> <strong>the</strong> Amador Causeway has been extremely successful and <strong>the</strong><br />
area is now one <strong>of</strong> <strong>the</strong> more <strong>at</strong>tractive recre<strong>at</strong>ion and commercial <strong>de</strong>velopment areas in<br />
<strong>the</strong> City <strong>of</strong> Panama.<br />
Combined public and priv<strong>at</strong>e investments 19 to <strong>the</strong> end <strong>of</strong> 2002 were <strong>the</strong> or<strong>de</strong>r <strong>of</strong> $70<br />
million with a fur<strong>the</strong>r $320 million proposed in <strong>the</strong> future or committed in 2003. The future<br />
projects inclu<strong>de</strong> three or four new marinas, commercial and resi<strong>de</strong>ntial <strong>de</strong>velopment,<br />
hotels, restaurants, and a new golf course.<br />
19 Str<strong>at</strong>egic Plan for Tourism <strong>Development</strong> – EDSA, 1996, et al.<br />
Final Report 9-8 May 2004
Figure 9-6: Amador Causeway, West si<strong>de</strong> looking north<br />
As a result <strong>of</strong> <strong>the</strong> increased <strong>at</strong>tractiveness <strong>of</strong> <strong>the</strong> area, it has become extremely popular<br />
and <strong>of</strong>fers uninterrupted views <strong>of</strong> Panama Bay to <strong>the</strong> east and <strong>the</strong> west. To d<strong>at</strong>e, <strong>the</strong> only<br />
interruptions to this view are <strong>the</strong> <strong>Canal</strong> and ships passing into or out <strong>of</strong> <strong>the</strong> Pacific<br />
entrance channel.<br />
It <strong>the</strong>refore follows th<strong>at</strong> any proposal to construct an artificial island within <strong>the</strong> views from<br />
<strong>the</strong> Amador Causeway could well have significant socio economic impacts on <strong>the</strong> users <strong>of</strong><br />
<strong>the</strong> area and <strong>the</strong> public and priv<strong>at</strong>e sectors investing in its <strong>de</strong>velopment.<br />
Final Report 9-9 May 2004
Figure 9-7: View from Amador Causeway to <strong>Island</strong> Sites<br />
9.1.3 Bique Beach<br />
Loc<strong>at</strong>ion and Description<br />
As seen in Figure 9-1, Bique Beach is an un<strong>de</strong>rprivileged fishing community loc<strong>at</strong>ed along<br />
<strong>the</strong> shoreline <strong>of</strong> <strong>the</strong> Panama Bay, near <strong>the</strong> Veracruz community. Access to Bique village<br />
is via a dirt road through <strong>the</strong> Gambotti family est<strong>at</strong>e. The resi<strong>de</strong>nts <strong>of</strong> Bique Beach are<br />
<strong>de</strong>pen<strong>de</strong>nt on neighboring villages for employment, goods, and services.<br />
Popul<strong>at</strong>ion and Housing<br />
According to d<strong>at</strong>a from <strong>the</strong> Panama N<strong>at</strong>ional Comptroller, <strong>the</strong> community reached a<br />
popul<strong>at</strong>ion <strong>of</strong> 350 inhabitants distributed in 86 houses in <strong>the</strong> year 2000, steadily increasing<br />
from 1980 (216 inhabitants) and 1990 (216 inhabitants). The d<strong>at</strong>a in Table 9-3 also<br />
indic<strong>at</strong>es th<strong>at</strong> Bique Beach has a large young adult popul<strong>at</strong>ion, making up nearly half <strong>of</strong><br />
<strong>the</strong> total popul<strong>at</strong>ion <strong>of</strong> <strong>the</strong> island.<br />
Final Report 9-10 May 2004
Table 9-3: Socio-Demographic Indic<strong>at</strong>ors in Bique Beach (2000)<br />
Average Number <strong>of</strong> Members per Household 4.10<br />
Percentage <strong>of</strong> Popul<strong>at</strong>ion Un<strong>de</strong>r 15 Years <strong>of</strong> Age 42.0%<br />
Percentage <strong>of</strong> Popul<strong>at</strong>ion Between 15 and 64 Years <strong>of</strong> Age 54.9%<br />
Number <strong>of</strong> Men per 100 Women 112.1<br />
Average Age in Total Popul<strong>at</strong>ion 19.0<br />
Percentage <strong>of</strong> Households with Male Househol<strong>de</strong>r 86.1%<br />
Source: D<strong>at</strong>a from <strong>the</strong> popul<strong>at</strong>ion and housing census by <strong>the</strong> Panamanian N<strong>at</strong>ional Comptroller, year 2000.<br />
Figure 9-8: Bique Beach and Mangroves<br />
Final Report 9-11 May 2004
Economy<br />
The economy <strong>of</strong> Bique Beach relies heavily on <strong>the</strong> fishing industry. The inhabitants <strong>of</strong><br />
Bique Beach travel to neighboring villages including Alto Bonito, Arraiján, Vista Bella,<br />
Vacamonte Port, Chumical <strong>de</strong> Veracruz and Chumical <strong>de</strong> Vacamonte to sell fish. O<strong>the</strong>rs<br />
find seasonal work <strong>at</strong> shrimp processing factories in Vacamonte Port or work as domestic<br />
employees. Some also travel to Panama City, Chorrera and Vista Alegre for o<strong>the</strong>r types<br />
<strong>of</strong> permanent or temporary work. Still a few work <strong>the</strong> lands in <strong>the</strong> Gambotti family est<strong>at</strong>e.<br />
Figure 9-9: “Panga” Bo<strong>at</strong> Used by Artisan Fishermen<br />
Infrastructure<br />
A turbine-powered well distributes potable w<strong>at</strong>er to <strong>the</strong> houses on Bique Beach. Although<br />
most households have l<strong>at</strong>rines, <strong>the</strong>re is no system to handle <strong>the</strong> disposal <strong>of</strong> solid waste.<br />
Bique Beach has a church and a school providing 1 st to 3 rd gra<strong>de</strong> educ<strong>at</strong>ion to local<br />
children.<br />
Final Report 9-12 May 2004
9.1.4 Vacamonte City<br />
Loc<strong>at</strong>ion and Description<br />
Vacamonte City is a rel<strong>at</strong>ively recent but rapidly-growing city loc<strong>at</strong>ed in Vista Alegre<br />
County. As can be seen in Figure 9-1, it is situ<strong>at</strong>ed northwest <strong>of</strong> Vacamonte Port. A<br />
rel<strong>at</strong>ively new community started as an urban project, Vacamonte City consists largely <strong>of</strong><br />
inhabitants from o<strong>the</strong>r provinces who took advantage <strong>of</strong> <strong>the</strong> affordable housing being<br />
<strong>of</strong>fered to settle in Vacomonte City following <strong>the</strong> construction <strong>of</strong> <strong>the</strong> Vacamonte Fishing<br />
port in 1978. Inhabitants have access to goods and services within <strong>the</strong> city or in<br />
neighboring cities in Alegre County. Most resi<strong>de</strong>nts continue to work outsi<strong>de</strong> <strong>the</strong> city,<br />
mainly in Panama City.<br />
Popul<strong>at</strong>ion and Housing<br />
According to <strong>the</strong> census provi<strong>de</strong>d by <strong>the</strong> Panama N<strong>at</strong>ional Comptroller, Vacamonte City<br />
reached a popul<strong>at</strong>ion <strong>of</strong> 25,281 inhabitants distributed in 6,425 houses in <strong>the</strong> year 2000,<br />
comprising nearly 65% <strong>of</strong> <strong>the</strong> total popul<strong>at</strong>ion <strong>of</strong> Alegre County in 2000. This<br />
<strong>de</strong>monstr<strong>at</strong>es a consi<strong>de</strong>rable increase from <strong>the</strong> 232 inhabitants reported in 1990 in<br />
Vacomente City. This growth can be <strong>at</strong>tributed to urban <strong>de</strong>velopments ma<strong>de</strong> within <strong>the</strong><br />
last <strong>de</strong>ca<strong>de</strong> directly to <strong>the</strong> city <strong>of</strong> Vacomente as well as to <strong>the</strong> intense growth <strong>of</strong> areas<br />
surrounding <strong>the</strong> city including <strong>the</strong> emergence <strong>of</strong> several villages including 16 <strong>de</strong> Octubre,<br />
Los Guayacanes, 13 <strong>de</strong> Febrero, 2000, Omar, Rogelio Pare<strong>de</strong>s, Loma Cobá, 7 <strong>de</strong><br />
septiembre, Cristal, and La Paz.<br />
Final Report 9-13 May 2004
Figure 9-10: Main road in Vacamonte City<br />
Table 9-4 shows th<strong>at</strong> <strong>the</strong> majority <strong>of</strong> <strong>the</strong> popul<strong>at</strong>ion is between <strong>the</strong> ages <strong>of</strong> 15 and 64 with<br />
a large emerging popul<strong>at</strong>ion un<strong>de</strong>r 15 years <strong>of</strong> age.<br />
Table 9-4: Socio-Demographic Indic<strong>at</strong>ors in Vacamonte City (2000)<br />
Average Number <strong>of</strong> Members per Household 3.90<br />
Percentage <strong>of</strong> Popul<strong>at</strong>ion Un<strong>de</strong>r 15 34.1%<br />
Percentage <strong>of</strong> Popul<strong>at</strong>ion Between 15 and 64 63.6%<br />
Number <strong>of</strong> Men per 100 Women 92.80<br />
Average Age in Total Popul<strong>at</strong>ion 26<br />
Percentage <strong>of</strong> Households with Male Househol<strong>de</strong>r 77.4%<br />
Source: D<strong>at</strong>a from <strong>the</strong> popul<strong>at</strong>ion and housing census by <strong>the</strong> Panamanian N<strong>at</strong>ional Comptroller, year 2000.<br />
Economy<br />
As mentioned earlier, <strong>the</strong> majority <strong>of</strong> <strong>the</strong> resi<strong>de</strong>nts <strong>of</strong> Vacamonte City commute to Panama<br />
City and o<strong>the</strong>r provinces for employment. A select few (less than a third) are involved in<br />
<strong>the</strong> fishing industry, working on fishing ships and selling fish <strong>at</strong> <strong>the</strong> Port <strong>of</strong> Vacamonte.<br />
Final Report 9-14 May 2004
Infrastructure<br />
The resi<strong>de</strong>nts <strong>of</strong> Vacamonte City enjoy a wi<strong>de</strong> range <strong>of</strong> public services including<br />
telephone, cable TV, electricity, sewage, pharmacies, clinics, priv<strong>at</strong>e and public<br />
transport<strong>at</strong>ion and elementary schools and high schools for local children. The road<br />
network inclu<strong>de</strong>s access to <strong>the</strong> Panamá-Chorrera Highway and <strong>the</strong> Panamerican<br />
Highway, <strong>the</strong> two main highways in <strong>the</strong> country. This connects Vacamonte City to<br />
Panama City and o<strong>the</strong>r provinces, facilit<strong>at</strong>ing <strong>the</strong> commute for workers.<br />
9.1.5 Port <strong>of</strong> Vacamonte<br />
Loc<strong>at</strong>ion and Description<br />
The Port <strong>of</strong> Vacamonte is loc<strong>at</strong>ed in Vista Alegre county 20 km southwest <strong>of</strong> Panama City,<br />
8 km south <strong>of</strong> <strong>the</strong> Panamerican Highway, and 20 km sou<strong>the</strong>ast <strong>of</strong> <strong>the</strong> Intern<strong>at</strong>ional Port <strong>of</strong><br />
Balboa as can be seen in Figure 9-1.<br />
There are 252 companies within <strong>the</strong> port area <strong>de</strong>dic<strong>at</strong>ed to exporting and processing<br />
shrimp, chicken, turkey and pork. White and red shrimp (or pawn) are <strong>the</strong> main products<br />
exported to <strong>the</strong> United St<strong>at</strong>es, Mexico, Venezuela and Spain.<br />
Governmental and public district services <strong>at</strong> <strong>the</strong> port inclu<strong>de</strong> <strong>the</strong> <strong>of</strong>fices <strong>of</strong> <strong>the</strong> Red Cross,<br />
Consult and Ship, Marine Resources, Customs, Ministry <strong>of</strong> Health, and Solid Waste<br />
Collection, as well as a branch <strong>of</strong> <strong>the</strong> Panama N<strong>at</strong>ional Bank and <strong>the</strong> Occup<strong>at</strong>ional Health<br />
Clinic provi<strong>de</strong>d by <strong>the</strong> Social Security Agency. The Occup<strong>at</strong>ional Health Clinic provi<strong>de</strong>s a<br />
full range <strong>of</strong> medical services to workers <strong>at</strong> <strong>the</strong> port. The Port <strong>of</strong> Vacamonte also has a<br />
fire st<strong>at</strong>ion, a restaurant, a center for gasoline distribution for ships, and a shipyard.<br />
Economy<br />
There are 57 companies loc<strong>at</strong>ed in <strong>the</strong> port area, ranging from small to mid-size. These<br />
inclu<strong>de</strong> companies specializing in <strong>the</strong> sale <strong>of</strong> fuel, construction m<strong>at</strong>erials and ship repair,<br />
as well as seafood processing plants and seafood export companies. Approxim<strong>at</strong>ely 250<br />
shrimp ships, 20 <strong>of</strong> which also fish dorado and shark, arrive <strong>at</strong> <strong>the</strong> Port <strong>of</strong> Vacamonte.<br />
These ships sell <strong>the</strong>ir c<strong>at</strong>ch directly to export companies loc<strong>at</strong>ed <strong>at</strong> <strong>the</strong> port, supermarkets,<br />
retail or to <strong>the</strong> associ<strong>at</strong>ion ASOCEPROM which sells seafood to neighborhoods, houses,<br />
on streets and <strong>at</strong> local restaurants. Artisan fishermen and bucketeers also sell <strong>the</strong>ir c<strong>at</strong>ch<br />
<strong>at</strong> a local level.<br />
The port employs 5,220 people directly and 25,000 people indirectly. Direct permanent<br />
employees inclu<strong>de</strong> <strong>the</strong> crew <strong>of</strong> <strong>the</strong> fishing fleet, which comprises approxim<strong>at</strong>ely 20% <strong>of</strong> <strong>the</strong><br />
total work force. Temporary employees comprise 20% to 40% <strong>of</strong> <strong>the</strong> total work force. The<br />
work force consists <strong>of</strong> resi<strong>de</strong>nts <strong>of</strong> <strong>the</strong> Port <strong>of</strong> Vacamonte as well as resi<strong>de</strong>nts <strong>of</strong><br />
neighboring areas including Nuevo Emperador, Santa Clara, Bique, Rio Indio, Vista<br />
Alegre, La Revertida, Omar Torrijos, Burunga, Chumical, Chorrillito, Vacamonte City,<br />
Chorrera and Panama City.<br />
Final Report 9-15 May 2004
9.1.6 Veracruz Community<br />
Loc<strong>at</strong>ion and Description<br />
The Veracruz community is <strong>the</strong> main urban settlement <strong>of</strong> Veracruz County in <strong>the</strong> south<br />
Arraiján District and <strong>the</strong> closest significant community to Panama City. This community is<br />
loc<strong>at</strong>ed along <strong>the</strong> shore <strong>of</strong> <strong>the</strong> Panama Bay.<br />
Commerce and fishing, are Veracruz’s main economic activities. Veracruz has three<br />
elementary schools, a health care center and many local stores and pharmacies. The<br />
Ministry <strong>of</strong> Family, <strong>the</strong> Youth and Children, <strong>the</strong> District Attorney, and <strong>the</strong> N<strong>at</strong>ional Police all<br />
have <strong>of</strong>fices in Veracruz.<br />
Popul<strong>at</strong>ion and Housing<br />
According to <strong>the</strong> 2000 Census, <strong>the</strong> Veracruz community reached a popul<strong>at</strong>ion <strong>of</strong> 14,936<br />
inhabitants, distributed in 3,232 houses. Among <strong>the</strong>m, 7,715 were men and 7,221 were<br />
women. Table 9-5 shows <strong>the</strong> high growth r<strong>at</strong>e for <strong>the</strong> popul<strong>at</strong>ion in <strong>the</strong> last 20 years. The<br />
d<strong>at</strong>a shows increases <strong>of</strong> 49.5% and 121.5% between 1980 and 1990 and between 1990<br />
and 2000, respectively.<br />
Table 9-5: Popul<strong>at</strong>ion and Housing in <strong>the</strong> Veracruz Community (1980-2000)<br />
D<strong>at</strong>a 1980 1990 2000<br />
Popul<strong>at</strong>ion 4,511 6,744 14,936<br />
Housing 929 1,454 3,232<br />
Source: Panamanian N<strong>at</strong>ional Comptroller, year 2000.<br />
The county <strong>of</strong> Veracruz has a surface area <strong>of</strong> 13.8 km 2 , a popul<strong>at</strong>ion <strong>of</strong> 16,748 inhabitants<br />
(year 2000 census), and a <strong>de</strong>nsity <strong>of</strong> 1,213.6 inhabitants per km 2 . The Veracruz<br />
community comprises 89.2% <strong>of</strong> <strong>the</strong> total county popul<strong>at</strong>ion.<br />
O<strong>the</strong>r socio-<strong>de</strong>mographic indic<strong>at</strong>ors are shown in Table 9-6.<br />
Final Report 9-16 May 2004
Table 9-6: Socio-<strong>de</strong>mographic Indic<strong>at</strong>ors in Veracruz (2000)<br />
Average Number <strong>of</strong> Members per Household 4.5<br />
Percentage <strong>of</strong> Popul<strong>at</strong>ion Un<strong>de</strong>r 15 33.9%<br />
Percentage <strong>of</strong> Popul<strong>at</strong>ion Between 15 and 64 62.0%<br />
Number <strong>of</strong> Men per 100 Women 106.8<br />
Average Age in Total Popul<strong>at</strong>ion 23<br />
Percentage <strong>of</strong> Households with Male Househol<strong>de</strong>r 77.1%<br />
Source: D<strong>at</strong>a from <strong>the</strong> popul<strong>at</strong>ion and housing census by <strong>the</strong> Panamanian N<strong>at</strong>ional Comptroller, year 2000.<br />
Economy<br />
Veracruz is an urban community where commerce and services are <strong>the</strong> major economic<br />
activities. Most <strong>of</strong> <strong>the</strong> popul<strong>at</strong>ion is employed in <strong>the</strong> public and priv<strong>at</strong>e sector. According to<br />
d<strong>at</strong>a provi<strong>de</strong>d by <strong>the</strong> Office <strong>of</strong> <strong>the</strong> General Comptroller, <strong>the</strong>re are 134 companies in <strong>the</strong><br />
Veracruz area specialized in fishing, mining and excav<strong>at</strong>ion, manufacturing, commerce,<br />
hotels, restaurants, transport<strong>at</strong>ion, storing, communic<strong>at</strong>ion, construction, and social and<br />
health services.<br />
These companies employ 239 people and gener<strong>at</strong>e an income next to 12.3 million<br />
Balboas per year. The activities th<strong>at</strong> gener<strong>at</strong>e <strong>the</strong> most pr<strong>of</strong>it (74.6% <strong>of</strong> <strong>the</strong> total income)<br />
are retail commerce, hotels, restaurants, and manufacturing. They also account for 51.5%<br />
<strong>of</strong> <strong>the</strong> total employment <strong>of</strong> <strong>the</strong> area. Artisan fishing produces 8,400 pounds <strong>of</strong> fish per<br />
month, gener<strong>at</strong>ing a monthly income <strong>of</strong> approxim<strong>at</strong>ely 5,200 Balboas. O<strong>the</strong>r companies<br />
rel<strong>at</strong>ed to <strong>the</strong> fishing industry specialize in ship repair, equipment sales and fish flour<br />
processing. While <strong>the</strong> tourism industry is not a main contributor to <strong>the</strong> economy <strong>of</strong><br />
Veracruz, locals have established food services along <strong>the</strong> beaches to accommod<strong>at</strong>e<br />
weekend visitors.<br />
Infrastructure<br />
The road infrastructure in Veracruz consists <strong>of</strong> concrete roads in urgent need <strong>of</strong> repair. A<br />
public bus system transports resi<strong>de</strong>nts to Panama City and Arraijan. Potable w<strong>at</strong>er is<br />
available and provi<strong>de</strong>d by IDAAN, but <strong>the</strong> service is intermittent due to w<strong>at</strong>er scarcity. A<br />
solid waste collection service is available and disposes <strong>of</strong> waste <strong>at</strong> a landfill in Chorrera.<br />
Final Report 9-17 May 2004