Salt water intrusion - Canal de Panamá
Salt water intrusion - Canal de Panamá
Salt water intrusion - Canal de Panamá
Create successful ePaper yourself
Turn your PDF publications into a flip-book with our unique Google optimized e-Paper software.
<strong>Salt</strong> Water Intrusion Analysis Panama <strong>Canal</strong> Locks <strong>Salt</strong> Water Intrusion Mitigation Systems - Report F - SummaryQ3696, April 2005<br />
when the mitigation system is only used after each second (1:2) or third (1:3) ship<br />
downlockage (studied for <strong>water</strong> control scenario ‘minimum <strong>water</strong> supply’, but this<br />
effect will most probably also occur at <strong>water</strong> control scenario ‘free <strong>water</strong> supply’). The<br />
reduction of the effectiveness when the system is only applied each 2 nd or 3 rd<br />
downlockage operation, is most probably caused by the fact that higher salt<br />
concentrations can build up in the upper lock chamber in the semi-convoy mo<strong>de</strong> of<br />
operation. But also the different <strong>water</strong> balance of Gatun Lake when the mitigation<br />
system is less intensive used (less <strong>water</strong> supply, greater <strong>water</strong> release at Gatun Dam,<br />
different distribution of <strong>water</strong> over Gatun Dam and Gatun locks) plays a role.<br />
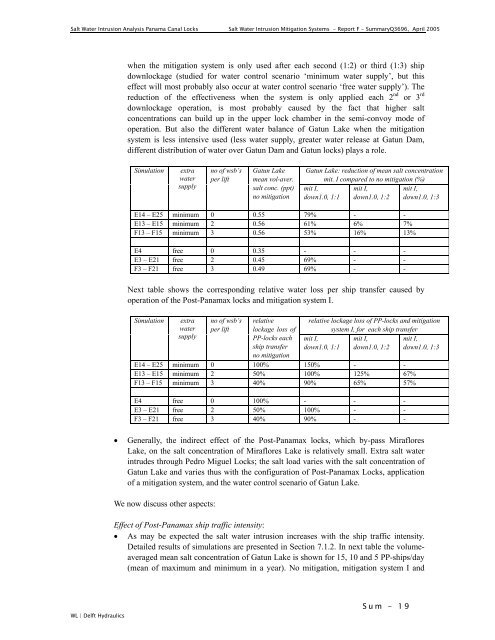
Simulation<br />
extra<br />
<strong>water</strong><br />
supply<br />
no of wsb’s<br />
per lift<br />
Gatun Lake<br />
mean vol-aver.<br />
salt conc. (ppt)<br />
no mitigation<br />
Gatun Lake: reduction of mean salt concentration<br />
mit. I compared to no mitigation (%)<br />
mit I,<br />
mit I,<br />
mit I,<br />
down1.0, 1:1 down1.0, 1:2 down1.0, 1:3<br />
E14 – E25 minimum 0 0.55 79% - -<br />
E13 – E15 minimum 2 0.56 61% 6% 7%<br />
F13 – F15 minimum 3 0.56 53% 16% 13%<br />
E4 free 0 0.35 - - -<br />
E3 – E21 free 2 0.45 69% - -<br />
F3 – F21 free 3 0.49 69% - -<br />
Next table shows the corresponding relative <strong>water</strong> loss per ship transfer caused by<br />
operation of the Post-Panamax locks and mitigation system I.<br />
Simulation<br />
extra<br />
<strong>water</strong><br />
supply<br />
no of wsb’s<br />
per lift<br />
relative<br />
lockage loss of<br />
PP-locks each<br />
ship transfer<br />
no mitigation<br />
relative lockage loss of PP-locks and mitigation<br />
system I, for each ship transfer<br />
mit I,<br />
mit I,<br />
mit I,<br />
down1.0, 1:1 down1.0, 1:2 down1.0, 1:3<br />
E14 – E25 minimum 0 100% 150% - -<br />
E13 – E15 minimum 2 50% 100% 125% 67%<br />
F13 – F15 minimum 3 40% 90% 65% 57%<br />
E4 free 0 100% - - -<br />
E3 – E21 free 2 50% 100% - -<br />
F3 – F21 free 3 40% 90% - -<br />
• Generally, the indirect effect of the Post-Panamax locks, which by-pass Miraflores<br />
Lake, on the salt concentration of Miraflores Lake is relatively small. Extra salt <strong>water</strong><br />
intru<strong>de</strong>s through Pedro Miguel Locks; the salt load varies with the salt concentration of<br />
Gatun Lake and varies thus with the configuration of Post-Panamax Locks, application<br />
of a mitigation system, and the <strong>water</strong> control scenario of Gatun Lake.<br />
We now discuss other aspects:<br />
Effect of Post-Panamax ship traffic intensity:<br />
• As may be expected the salt <strong>water</strong> <strong>intrusion</strong> increases with the ship traffic intensity.<br />
Detailed results of simulations are presented in Section 7.1.2. In next table the volumeaveraged<br />
mean salt concentration of Gatun Lake is shown for 15, 10 and 5 PP-ships/day<br />
(mean of maximum and minimum in a year). No mitigation, mitigation system I and<br />
WL | Delft Hydraulics<br />
Sum - 19


