2009, Third Quarter - Mark Pankin Home Page
2009, Third Quarter - Mark Pankin Home Page
2009, Third Quarter - Mark Pankin Home Page

You also want an ePaper? Increase the reach of your titles
YUMPU automatically turns print PDFs into web optimized ePapers that Google loves.
<strong>2009</strong> <strong>Third</strong> <strong>Quarter</strong> Volume 15.1<br />
<strong>Mark</strong> <strong>Pankin</strong> Managed<br />
Accounts Newsletter<br />
Please Note<br />
I will be contacting clients for my more or less annual or more frequent follow-up discussions<br />
about your investment objectives and overall financial picture. The default method will be over the<br />
phone, possibly using e-mail to determine good times for me to call you. If you prefer, we can do it<br />
all via e-mail or not at all if nothing significant has changed. Just drop me an e-mail at<br />
“mdp2@pankin.com”.<br />
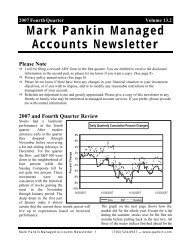
<strong>Third</strong> <strong>Quarter</strong> Review<br />
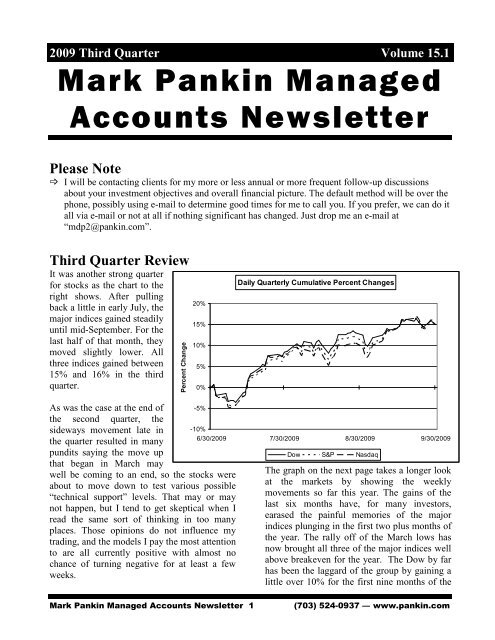
It was another strong quarter<br />
for stocks as the chart to the<br />
right shows. After pulling<br />
back a little in early July, the<br />
major indices gained steadily<br />
until mid-September. For the<br />
last half of that month, they<br />
moved slightly lower. All<br />
three indices gained between<br />
15% and 16% in the third<br />
quarter.<br />
Percent Change<br />
20%<br />
15%<br />
10%<br />
5%<br />
0%<br />
Daily <strong>Quarter</strong>ly Cumulative Percent Changes<br />
As was the case at the end of -5%<br />
the second quarter, the<br />
sideways movement late in -10%<br />
the quarter resulted in many<br />
pundits saying the move up<br />
that began in March may<br />
well be coming to an end, so the stocks were<br />
about to move down to test various possible<br />
“technical support” levels. That may or may<br />
not happen, but I tend to get skeptical when I<br />
read the same sort of thinking in too many<br />
places. Those opinions do not influence my<br />
trading, and the models I pay the most attention<br />
to are all currently positive with almost no<br />
chance of turning negative for at least a few<br />
weeks.<br />
6/30/<strong>2009</strong> 7/30/<strong>2009</strong> 8/30/<strong>2009</strong> 9/30/<strong>2009</strong><br />
Dow S&P Nasdaq<br />
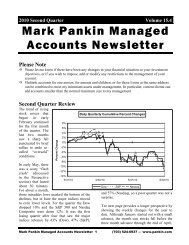
The graph on the next page takes a longer look<br />
at the markets by showing the weekly<br />
movements so far this year. The gains of the<br />
last six months have, for many investors,<br />
earased the painful memories of the major<br />
indices plunging in the first two plus months of<br />
the year. The rally off of the March lows has<br />
now brought all three of the major indices well<br />
above breakeven for the year. The Dow by far<br />
has been the laggard of the group by gaining a<br />
little over 10% for the first nine months of the<br />
<strong>Mark</strong> <strong>Pankin</strong> Managed Accounts Newsletter 1<br />
(703) 524-0937 — www.pankin.com
year. The S&P is doing<br />
considerably better being up<br />
17%, but the real star has 40%<br />
been the Nasdaq Composite,<br />
30%<br />
which has more than<br />
doubled the gains of the<br />
20%<br />
S&P by climbing almost<br />
35% for the first three<br />
quarters. It is typical that the<br />
10%<br />
0%<br />
Nasdaq, which is heavily -10%<br />
influenced by high tech<br />
stocks, moves up faster than<br />
the other two. However, the<br />
-20%<br />
-30%<br />
extent of the difference this<br />
year is unusually large,<br />
which might suggest that the<br />
market is getting a bit “frothy” and may be due<br />
for a “correction” in the not too distant future.<br />
The traditional seasonal patterns have not held<br />
so far in <strong>2009</strong>. January saw the S&P fall by<br />
over 8%, so according to the “barometer” based<br />
on that month, the remainder of the year did not<br />
figure to be a good one for stocks. The fourth<br />
quarter would have to see a substantial pullback<br />
for that to be true. One old saw is “sell in May<br />
and go away” to take advantage of the<br />
historical pattern of the November through<br />
April six months being much stronger than the<br />
May through October period. Clearly that has<br />
not been so this year. The November-January<br />
period is historically the best three months for<br />
stocks although that was not the case last year.<br />
It will interesting to see if that behavior<br />
resumes later this year or if the pattern of antipatterns<br />
1 continues.<br />
Managed accounts did well in the third<br />
quarter and for the year to date:<br />
The active management style I use for<br />
managing accounts is designed to manage risk<br />
by avoiding large drawdowns in account values<br />
as well as generating substantial profits in<br />
favorable market conditions. For the most part<br />
that has been the case so far this year.<br />
1 Am I trying to write my own Wall Street Gibberish?!<br />
Percent Change<br />
Weekly Cumulative Percent Changes for <strong>2009</strong><br />
12/31/2008 3/31/<strong>2009</strong> 6/30/<strong>2009</strong> 9/30/<strong>2009</strong><br />
Dow S&P Nasdaq<br />
All of the returns shown below are based on<br />
trading in typical accounts. With the exception<br />
of the model for trading real estate funds, the<br />
values include the effects of my management<br />
fees.<br />
Selects Switching: My oldest managed<br />
account program, which began in late 1994,<br />
trades the Fidelity Selects group of sector<br />
funds. All accounts began the third quarter<br />
fully invested holding two Select funds. The<br />
weakness of stocks in early July resulted in our<br />
moving to being entirely in cash by the middle<br />
of that month. Later in the month, accounts<br />
were half in a single sector fund and half in<br />
cash. After Labor Day, they were again fully<br />
invested by holding two Select funds, which<br />
was the position at the end of the quarter.<br />
For the third quarter, accounts gained 6.7%,<br />
and they are virtually even for <strong>2009</strong>.<br />
Performance for the year was hurt by not being<br />
able to buy a fund in April that Fidelity was<br />
closing in June. That was discussed in the last<br />
editions of this and the program specific<br />
newsletter.<br />
Rydex Sector Trading: I have two methods I<br />
use in managed accounts. One, which I call<br />
Sector Trading Adverse to Risk (STAR), places<br />
more emphasis on risk reduction than<br />
exceptional profits. With the weak markets for<br />
the first two months of the year, the accounts<br />
were totally in cash far more often than they<br />
<strong>Mark</strong> <strong>Pankin</strong> Managed Accounts Newsletter 2<br />
(703) 524-0937 — www.pankin.com
nibbled at attractive sector funds. Trading<br />
activity picked up in the second quarter and<br />
continued through the third quarter. However,<br />
much of the time there were partial holdings of<br />
the money market fund. One reason is that the<br />
method requires a pullback before buying a<br />
fund, and in very strong markets such actions<br />
may not occur very often. Nonetheless, the<br />
cautious approach has worked well this year as<br />
the typical account gained 12.8% in the third<br />
quarter, which brought <strong>2009</strong> gains up to 27.5%.<br />
The other method is called Aggressive Rydex<br />
Trading (ART). While STAR may own up to<br />
three sector funds at a time and will be partially<br />
or fully in money market more often than not,<br />
ART normally owns just one sector fund at a<br />
time and will be out of the market only when I<br />
judge that the risks of stock ownership in<br />
general and trading sector funds are too high<br />
relative to the potential rewards. Also, ART<br />
may own Rydex Precious Metals instead of or<br />
in addition to one other sector fund. That fund<br />
has been owned for more than two years.<br />
Originally about 20% of assets were placed into<br />
the gold fund, and in January 2008 those<br />
positions were increased.<br />
ART accounts had stopped trading sector funds<br />
in mid-January as the weak markets made the<br />
risks of aggressive sector fund trading too high<br />
relative to the potential profits. Trading of<br />
sector funds resumed in early April and has<br />
continued through the end of third quarter<br />
except for a few days in July. For the third<br />
quarter, the sector fund trading gained 6.5%,<br />
which moved it ahead 3.1% for the nine<br />
months. The gold fund has showed nice gains,<br />
although with a considerable amount of<br />
volatility, so far this year. For the last quarter,<br />
the fund was up 23%, and for the year so far it<br />
is up almost 45%. The combination of the two<br />
trading types gained 10.1% in the third quarter,<br />
and ART accounts are up 10.4% for the year so<br />
far.<br />
Dow Turnarounds: Unlike those above, this<br />
managed account program can buy individual<br />
stocks instead of or in addition to mutual funds.<br />
<strong>Mark</strong> <strong>Pankin</strong> Managed Accounts Newsletter 3<br />
Some accounts may also employ options<br />
strategies, usually fairly conservative ones. All<br />
the stocks it buys are in the Dow Jones<br />
Industrial Average when they have been beaten<br />
down enough. The plan is holding them for two<br />
or three years until their prices recover.<br />
Sometimes, the recovery comes in less than a<br />
year.<br />
Up until this past year, my thinking was those<br />
Dow components and other “blue chip” stocks<br />
that had seen their prices drop significantly<br />
could be considered as relatively low-risk<br />
investments. However, we have seen too many<br />
of them—AIG, Citigroup, and GM in<br />
particular—have virtually all of their value<br />
wiped out, and they are unlikely to see any<br />
meaningful recovery in their worth for years if<br />
at all. All three of those have been removed<br />
from the Dow. I still think beaten down Dow<br />
stocks can be outstanding investments, but in<br />
the current market environment, the risks of<br />
owning them are far higher than they have been<br />
historically.<br />
It is fortunate that the one remaining Dow<br />
Turnarounds account has never been invested<br />
entirely in Dow stocks. It currently also holds<br />
positions in an index fund, a gold fund, and a<br />
real estate fund. For the third quarter it gained<br />
12.8% and for the year it is ahead 18.4%.<br />
Tactical Asset Allocation: These accounts<br />
sold their equity fund holdings in December<br />
2007 and were out of stocks until early June<br />
except for a one-week whipsaw trade in an<br />
S&P index fund in late May 2008. The S&P<br />
index fund purchased at the beginning of June<br />
was sold in late July, and bought again in late<br />
August. It is still held at the end of the quarter.<br />
There is no “pure” TAA account, but the TAA<br />
newsletter has examples of how such an<br />
account might have performed.<br />
The typical managed account in this program<br />
holds a gold stock fund and also trades<br />
according to non-TAA models, such as the one<br />
for real estate funds. This program provides a<br />
wide range of options in the conservative-to-<br />
(703) 524-0937 — www.pankin.com
aggressive spectrum. The choice of target<br />
allocations and possible trading according to<br />
other models is customized to fit client needs in<br />
order to achieve financial goals within the<br />
anticipated investment time frame and at<br />
acceptable risk levels.<br />
The gold stock fund has done well as discussed<br />
under Rydex sectors as has the real estate fund,<br />
which is discussed below. Combined with the<br />
index fund trading, the typical account gained<br />
almost 15% for the quarter and is ahead 23.5%<br />
for the year so far.<br />
Some of these managed account programs have<br />
separate newsletters that provide details and<br />
additional commentary. Please request any of<br />
interest.<br />
Real Estate Fund Model: About three years<br />
ago I developed a trend following model based<br />
on the Fidelity Real Estate Investment Fund<br />
(ticker symbol FRESX). That fund has the<br />
longest history of any fund in the sector, and I<br />
base my research on historical performance,<br />
which is why I used it. Funds from some other<br />
companies perform quite similarly as does at<br />
least one exchange traded real estate fund.<br />
The model I developed had been negative since<br />
November 2007 as real estate property values<br />
fell sharply as part of the financial crisis in<br />
2008. In late April, the model gave a buy<br />
signal. The fund gained 41% in the third<br />
quarter bringing the open trade profit to about<br />
50% at the end of September.<br />
As is the case with gold stock funds, real estate<br />
funds can be quite volatile, so trading them<br />
entails a significant level of risk. Consequently,<br />
it is best to limit ones exposure to such funds.<br />
Depending on how risk tolerant one is, 10-20%<br />
of the portfolio would be an appropriate<br />
maximum exposure.<br />
As always, you should not assume that any of<br />
the investment performance discussed here will<br />
be achieved in the future. Also, there can be no<br />
assurances that any of the trading methods or<br />
client accounts will be profitable in the future.<br />
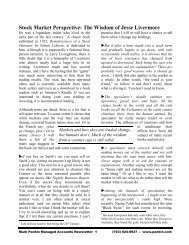
Stock <strong>Mark</strong>et Perspective: Is the Secular Bear Losing Its Claws?<br />
Conventional “wisdom” defines a bear market<br />
as a 20% drop from a previous high, and also<br />
uses a gain of that size to establish a bull<br />
market. 2 The size of the gains since early<br />
March has generated a lot of talk and writing<br />
about whether the March lows will be the<br />
ultimate lows of the secular bear market that<br />
began in 2000. If so, we may now be in a<br />
secular bull market.<br />
historically low levels. For example, in late<br />
1974, the price-to-earnings ratio for the S&P<br />
500 fell to about 8, and in late 1979 and early<br />
1980 is was around 7. Currently, its P/E based<br />
on estimated earnings for the next 12 months is<br />
in the 15-17 range. Bullish pundits say that is a<br />
“fair value” because it is close to some<br />
historical average or another depending on the<br />
period of the average.<br />
My guess is that the secular bear is still on the<br />
prowl, so the current rise is a cyclical bull<br />
market rather than the start of a very long<br />
period of rising markets. I say that because<br />
secular bear markets in the past have not been<br />
over until valuations are beaten down to<br />
2 Since it takes a 25% gain to recover a 20% loss, the<br />
definition of a bull market should require that much of a<br />
gain. Wisdom is in quotes due to “thinking” that a fixed<br />
percentage can define a change in the animalistic nature<br />
of the stock market.<br />
<strong>Mark</strong> <strong>Pankin</strong> Managed Accounts Newsletter 4<br />
There are a couple of problems with that<br />
reasoning. Since current earnings are<br />
depressed, the current P/E based on trailing<br />
earnings is quite high, over 70 according to The<br />
Wall Street Journal. Since earnings are almost<br />
certain to improve, it makes sense to use<br />
estimates, but earnings estimates are<br />
notoriously inaccurate. Even if a P/E around 15<br />
is some sort of “fair” value for stocks, markets<br />
typically overshoot “correct” valuations in both<br />
directions. If prior secular bear markets are any<br />
(703) 524-0937 — www.pankin.com
guide, we are going to see a P/E based on real,<br />
not estimated, earnings much lower than 15.<br />
In order to get some idea of how the current<br />
secular bear may play out, I will compare what<br />
we have seen so far with the last full one in the<br />
1966-82 period. That will at best provide a<br />
rough idea. One prior comparison has no<br />
statistical significance. Moreover, the end of<br />
the period was more than a quarter century ago<br />
and its beginning was more than four decades<br />
in the past when LBJ was the President and<br />
Obama was starting elementary school.<br />
The approach is looking at the changes in<br />
percentage terms of the S&P 500 from the high<br />
points in 1966 and 2000. I use close of the<br />
week data to keep the graphs from becoming<br />
too messy. In 1966 the weekly high of 93.81<br />
was made on February 11. In <strong>2009</strong> dollars,<br />
using the Consumer Price Index (CPI) to make<br />
the adjustment, that value is 626.93. That is less<br />
than ten percent lower than the low the S&P<br />
made this past March, 43 years later, which<br />
shows how secular bear markets can be<br />
devastating to longer term investment returns.<br />
The highest weekly close in 2000 was on<br />
March 24. The index was at 1527.46, or<br />
1908.04 in constant <strong>2009</strong> dollars.<br />
The graph below is based on the inflation<br />
adjusted weekly index values. The longer solid<br />
line tracks the index in the 1966-82 secular<br />
bear market. The chart goes through the end of<br />
1982 even though the market bottomed out in<br />
August. The shorter dashed line shows the<br />
index changes since March 24, 2000, the start<br />
of the current secular bear market, which is<br />
now more than nine years old.<br />
There are some striking similarities and<br />
differences. The actual S&P made new highs in<br />
the 1969 and again in early 1973. Adjusting for<br />
inflation, the movement was essentially<br />
sideways, which is not unusual in a secular bear<br />
market. In contrast, the index lost about half of<br />
its “real” value in the first three years after<br />
2000. About seven years into the periods, the<br />
Inflation Adjusted S&P 500 from Start of Secular Bear <strong>Mark</strong>ets<br />
10%<br />
0%<br />
-10%<br />
-20%<br />
-30%<br />
-40%<br />
-50%<br />
-60%<br />
-70%<br />
0 3 6 9 12 15<br />
Years Since High<br />
Feb. 11, 1966 - Dec. 31, 1962 Mar. 24, 2000 - Oct. 2, <strong>2009</strong><br />
<strong>Mark</strong> <strong>Pankin</strong> Managed Accounts Newsletter 5<br />
(703) 524-0937 — www.pankin.com
index topped out and fell sharply. In the older<br />
one, it almost reached the 1966 high. However,<br />
when it made new nominal highs in 2007, the<br />
S&P was still almost 20% lower in constant<br />
dollars than it was at the start of the secular<br />
bear market. After those peaks, the sell offs in<br />
the next year to two years were quite severe<br />
leading to drawdowns of around 60% in<br />
inflation adjusted terms.<br />
The cyclical bull<br />
market that began in<br />
late 1974 had its peak<br />
about 15 months later about 43% above the low<br />
in constant dollars. That rise is not as great as<br />
in the current cyclical bull market and it took<br />
quite a bit longer. After that, the overall trend<br />
down resumed for nearly another six years.<br />
The graph on the previous page suggests that<br />
we are about half way through the current<br />
secular bear market. Such is consistent with<br />
bear periods historical length of 15-20 years.<br />
One significant difference between the current<br />
one and the last half of the prior one is the rate<br />
of inflation. After pushing above 5% for a few<br />
months in the summer of 2008, the year-overyear<br />
change in the CPI is now negative and<br />
figures to remain quite low for at least another<br />
year. The greater concern now is avoiding a<br />
prolonged and deep deflation that could lead to<br />
a very severe recession or a full depression.<br />
The annual change in the CPI climbed steadily<br />
in the early 1970s and peaked over 12% in late<br />
1974 3 when the drop in stocks from the early<br />
1973 peak bottomed out. Inflation dropped<br />
briefly under 5% in 1976 before soaring to<br />
about 14% in 1980. Those high values pull<br />
down the inflation adjusted S&P shown in the<br />
chart.<br />
Another major difference between the current<br />
environment and the 1966-82 period is the<br />
dividend yield on the S&P. Back then the yield<br />
level rarely got much below 3%, which was<br />
The secular bear market is now over nine<br />
years old. Have we seen the low point as<br />
we did by one measure in the last one?<br />
sometimes considered an indication that stocks<br />
were overvalued. By late 1974, the yield was<br />
over 5%. It fell to under 4% later in that decade<br />
before rising to a peak of 6.4% 4 in June 1982, a<br />
couple of months before the low at the end of<br />
the secular bear market. In contrast, the S&P’s<br />
yield in 2000 at the end of the long secular bull<br />
market fell to just a bit<br />
over one percent, and<br />
is still below 2.5%.<br />
Dividend policies of<br />
most corporations have<br />
changed considerably, so it is unlikely that the<br />
higher level of yields will be seen any time in<br />
the foreseeable future. One factor in the 1970s<br />
was that the high inflation often enabled<br />
companies to raise their prices, which resulted<br />
in increased nominal earnings and the<br />
capability to pay higher dividends. To improve<br />
the comparison between the two periods’<br />
market movements, the graph on the next page<br />
shows the total return of the S&P 500 adjusted<br />
for inflation. The total return lines assume<br />
reinvestment of the dividends, which is<br />
normally what happens with an index tracking<br />
mutual fund. There were no index funds in<br />
1966; Vanguard started the first one in 1976. A<br />
very low expense ratio fund such as that one,<br />
ones offered by some other fund companies,<br />
and the exchanged traded “spiders” fund will<br />
closely track the total return of the S&P 500.<br />
We can see that when looking at the total<br />
return, the drop in late 1974 was reduced quite<br />
a bit, from almost 60% below the start of the<br />
secular bear to a little over 40%. The drop since<br />
2000 also is reduced, but not by a whole lot,<br />
from somewhat over 60% to a bit under that<br />
level.<br />
The high dividend yields resulted in the total<br />
return inflation adjusted low point during the<br />
prior secular bear being in late 1974. In<br />
November 1980, the purchasing power of the<br />
total return index was back to where it was in<br />
3 You may remember President Ford wearing a WIN<br />
button standing for whip inflation now.<br />
4 Data downloaded from the web site of the American<br />
Association of Individual Investors (AAII).<br />
<strong>Mark</strong> <strong>Pankin</strong> Managed Accounts Newsletter 6<br />
(703) 524-0937 — www.pankin.com
February 1966 for a couple of weeks. At least<br />
the “buy and hope” investor in a hypothetical<br />
S&P index fund with a zero expense ratio<br />
lower, which would result in the dashed line<br />
falling substantially. Another reason the current<br />
market may not keep up with the late 1970s is<br />
Inflation Adjusted S&P 500 Total Return from Start of Secular Bear <strong>Mark</strong>ets<br />
20%<br />
10%<br />
0%<br />
-10%<br />
-20%<br />
-30%<br />
-40%<br />
-50%<br />
-60%<br />
0 3 6 9 12 15<br />
would briefly have preserved his or her<br />
purchasing power over an almost fifteen year<br />
period. 5 That assumes the investor could stand<br />
seeing the fund lose almost half of its<br />
purchasing power and could hold on and not<br />
sell the fund.<br />
The chart suggests that the worst of the current<br />
bear market may be over. As long as inflation<br />
remains very low, even today’s meager<br />
dividend yields will enhance the inflation<br />
adjusted total return of the index. Due to<br />
current corporate dividend policies, it is<br />
unlikely that the yield on the S&P will rise<br />
significantly unless stock prices move sharply<br />
5 The fund would need to have been held in a<br />
hypothetical IRA or 401(K) type account, which did not<br />
exist in 1966, or there would have been taxes to be paid<br />
on the fund’s distributions. Even in such an account the<br />
taxes due when money was withdrawn would bring the<br />
real after-tax returns to less than breakeven.<br />
Years Since High<br />
Feb. 11, 1966 - Dec. 31, 1962 Mar. 24, 2000 - Oct. 2, <strong>2009</strong><br />
that inflation may well pick up if the economy<br />
starts growing again. There has been a lot of<br />
money pumped in by the Fed. Although it<br />
claims it will be able to drain liquidity to<br />
prevent high inflation when the time comes,<br />
that is a daunting task requiring precise timing<br />
to avoid severely hurting the economy. Based<br />
on the uncertainties and difficulties involved,<br />
the past Fed performance suggests that it will<br />
not be able to achieve its goals all that well.<br />
Another reason I am not optimistic about the<br />
chances of the future course of the dashed line<br />
following the solid one is the P/E ratios<br />
discussed at the beginning of this section. In<br />
other words, despite the two deep drops we<br />
have seen since 2000, I don’t think the level of<br />
fear among the investing public has yet reached<br />
the capitulation point where it takes an<br />
immense amount of courage to continue<br />
owning stocks, much less buy more. That is the<br />
<strong>Mark</strong> <strong>Pankin</strong> Managed Accounts Newsletter 7<br />
(703) 524-0937 — www.pankin.com
sort of pessimism that marks secular bear<br />
market lows. Please note that these views do<br />
not affect my management of your accounts as<br />
well as my personal ones because it is done<br />
using thoroughly tested formulas that tell me<br />
when I should or should not be in stocks.<br />
(Not Quite) Wall Street Gibberish<br />
Normally I use this occasional feature to<br />
expose spoken or written “wisdom” that is<br />
technically correct, but is also misleading and<br />
potentially harmful to investors’ financial well<br />
being. This time I was motivated by a Wall<br />
Street Journal article about a woman in<br />
England who has been on a thirty year<br />
campaign for “Plain English” to make business<br />
and government writing understandable and to<br />
eliminate confusing and ambiguous text. For<br />
example, instead of a bank talking about a<br />
“maximum debit balance,” they should say the<br />
“most that can be owed.” Or the Fed and<br />
Britain’s central bank say they will be doing<br />
“quantitative easing” when it would be clearer<br />
to say they are adding money to the economy.<br />
In that spirit, I found a humorous list of famous<br />
book titles and what they might be if written in<br />
today’s hype filled environment:<br />
Questions and Answers<br />
To make sure I answer the right ones, be sure to ask them.<br />
Original: The Wealth of Nations<br />
Revised: Invisible Hands: The Mysterious<br />
<strong>Mark</strong>et Forces That Control Our Lives and<br />
How to Profit from Them<br />
Original: Walden<br />
Revised: Camping with Myself: Two Years in<br />
American Tuscany<br />
Original: The Theory of the Leisure Class<br />
Revised: Buying Out Loud: The Unbelievable<br />
Truth About What We Consume and What It<br />
Says About Us<br />
Original: The Prince<br />
Revised: The Prince (Foreword by Oprah<br />
Winfrey)<br />
How to Contact Me<br />
Questions, comments, requests for information, or anything else you feel like talking about:<br />
<strong>Mark</strong> D. <strong>Pankin</strong><br />
1018 N. Cleveland St.<br />
Arlington, VA 22201<br />
(703) 524-0937 (voice and fax)<br />
E-mail: mdp2@pankin.com<br />
Internet web site: http://www.pankin.com<br />
<strong>Mark</strong> <strong>Pankin</strong> Managed Accounts Newsletter 8<br />
(703) 524-0937 — www.pankin.com