Course Syllabus - Panola College
Course Syllabus - Panola College
Course Syllabus - Panola College

You also want an ePaper? Increase the reach of your titles
YUMPU automatically turns print PDFs into web optimized ePapers that Google loves.
TW1: Integrate different viewpoints as a member of a team<br />
TW2: Work with others to support and accomplish a shared goal<br />
Personal Responsibility – to include the ability to connect choices, actions, and consequences to<br />
ethical decision-making<br />
PR1: Evaluate choices and actions and relate consequences to decision-making<br />
Social Responsibility – to include intercultural competence, knowledge of civic responsibility, and the<br />
ability to engage effectively in regional, national, and global communities<br />
SR1: Demonstrate intercultural competence<br />
SR2: Identify civic responsibility<br />
SR3: Engage in regional, national, and global communities<br />
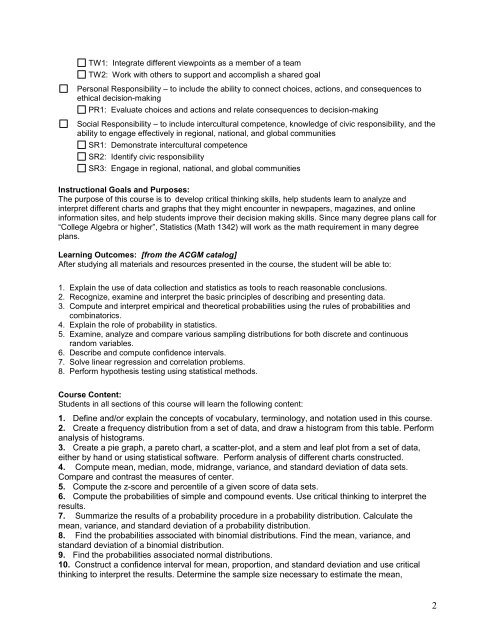
Instructional Goals and Purposes:<br />
The purpose of this course is to develop critical thinking skills, help students learn to analyze and<br />
interpret different charts and graphs that they might encounter in newpapers, magazines, and online<br />
information sites, and help students improve their decision making skills. Since many degree plans call for<br />
“<strong>College</strong> Algebra or higher”, Statistics (Math 1342) will work as the math requirement in many degree<br />
plans.<br />
Learning Outcomes: [from the ACGM catalog]<br />
After studying all materials and resources presented in the course, the student will be able to:<br />
1. Explain the use of data collection and statistics as tools to reach reasonable conclusions.<br />
2. Recognize, examine and interpret the basic principles of describing and presenting data.<br />
3. Compute and interpret empirical and theoretical probabilities using the rules of probabilities and<br />
combinatorics.<br />
4. Explain the role of probability in statistics.<br />
5. Examine, analyze and compare various sampling distributions for both discrete and continuous<br />
random variables.<br />
6. Describe and compute confidence intervals.<br />
7. Solve linear regression and correlation problems.<br />
8. Perform hypothesis testing using statistical methods.<br />
<strong>Course</strong> Content:<br />
Students in all sections of this course will learn the following content:<br />
1. Define and/or explain the concepts of vocabulary, terminology, and notation used in this course.<br />
2. Create a frequency distribution from a set of data, and draw a histogram from this table. Perform<br />
analysis of histograms.<br />
3. Create a pie graph, a pareto chart, a scatter-plot, and a stem and leaf plot from a set of data,<br />
either by hand or using statistical software. Perform analysis of different charts constructed.<br />
4. Compute mean, median, mode, midrange, variance, and standard deviation of data sets.<br />
Compare and contrast the measures of center.<br />
5. Compute the z-score and percentile of a given score of data sets.<br />
6. Compute the probabilities of simple and compound events. Use critical thinking to interpret the<br />
results.<br />
7. Summarize the results of a probability procedure in a probability distribution. Calculate the<br />
mean, variance, and standard deviation of a probability distribution.<br />
8. Find the probabilities associated with binomial distributions. Find the mean, variance, and<br />
standard deviation of a binomial distribution.<br />
9. Find the probabilities associated normal distributions.<br />
10. Construct a confidence interval for mean, proportion, and standard deviation and use critical<br />
thinking to interpret the results. Determine the sample size necessary to estimate the mean,<br />
2