Social background of MPs - Parliament
Social background of MPs - Parliament
Social background of MPs - Parliament

You also want an ePaper? Increase the reach of your titles
YUMPU automatically turns print PDFs into web optimized ePapers that Google loves.
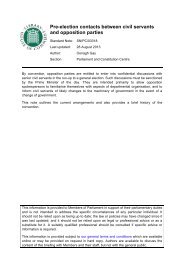
Figure 1 Women <strong>MPs</strong> 1979 to 2010<br />
160<br />
140<br />
Women <strong>MPs</strong> elected at General Elections 1979 to 2010<br />
Proportion <strong>of</strong> women <strong>MPs</strong> from each party<br />
120<br />
100<br />
80<br />
60<br />
40<br />
20<br />
0<br />
03-May-79 09-Jun-83 11-Jun-87 09-Apr-92 01-May-97 07-Jun-01 05-May-05 06-May-10<br />
General Election<br />
1.2 Age<br />
The average age <strong>of</strong> <strong>MPs</strong> has been remarkably consistent since 1979, at around 50 years.<br />
From 1997 to 2005 the average age <strong>of</strong> <strong>MPs</strong> elected rose, from 49.3 years in 1997 to 51.2<br />
years in 2005, before falling to 49.9 in 2010.<br />
In 2010, 51% (331) <strong>of</strong> those elected were aged over 50. This is lower than in 2001 (52%) and<br />
2005 (56%), but higher than at the other general elections since 1979. The spread in the<br />
ages <strong>of</strong> <strong>MPs</strong> was greater in 2010 than in previous years – in particular, there are 15 <strong>MPs</strong><br />
aged less than 30 and 16 <strong>MPs</strong> aged 70 and over in 2010.<br />
Table 3 Age <strong>of</strong> <strong>MPs</strong> at General Elections 1979 to 2010<br />
Election<br />
Average Age<br />
at election<br />
date 18-29 30-39 40-49 50-59 60-69 70+ Total<br />
1979 49.6 6 120 205 203 87 14 635<br />
1983 48.8 10 120 223 201 86 9 649<br />
1987 49.0 4 112 252 197 79 6 650<br />
1992 50.0 1 82 259 211 95 3 651<br />
1997 49.3 10 92 255 225 69 8 659<br />
2001 50.3 4 79 236 247 83 10 659<br />
2005 51.2 3 89 191 249 100 14 646<br />
2010 49.9 15 108 196 216 99 16 650<br />
Of those elected at the 2010 General Election, on average Labour <strong>MPs</strong> are older than those<br />
from the other major parties. 85% <strong>of</strong> Labour <strong>MPs</strong> are aged over 40 compared to 77% <strong>of</strong><br />
Conservative <strong>MPs</strong> and 79% <strong>of</strong> Liberal Democrat <strong>MPs</strong>.<br />
3