

PBL rapport 550026002 Calibration and validation of the land use ...
PBL rapport 550026002 Calibration and validation of the land use ...
PBL rapport 550026002 Calibration and validation of the land use ...

You also want an ePaper? Increase the reach of your titles
YUMPU automatically turns print PDFs into web optimized ePapers that Google loves.
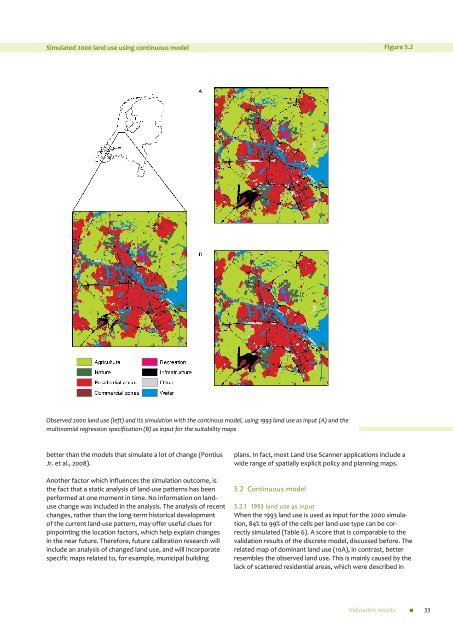
Simulated 2000 l<strong>and</strong> <strong>use</strong> using continuous model<br />
Figure 5.2<br />
Observed 2000 l<strong>and</strong> <strong>use</strong> (left) <strong>and</strong> its simulation with <strong>the</strong> continous model, using 1993 l<strong>and</strong> <strong>use</strong> as input (A) <strong>and</strong> <strong>the</strong><br />
multinomial regression specification (B) as input for <strong>the</strong> suitability maps<br />
better than <strong>the</strong> models that simulate a lot <strong>of</strong> change (Pontius<br />
Jr. et al., 2008).<br />
Ano<strong>the</strong>r factor which influences <strong>the</strong> simulation outcome, is<br />
<strong>the</strong> fact that a static analysis <strong>of</strong> l<strong>and</strong>-<strong>use</strong> patterns has been<br />
performed at one moment in time. No information on l<strong>and</strong><strong>use</strong><br />
change was included in <strong>the</strong> analysis. The analysis <strong>of</strong> recent<br />
changes, ra<strong>the</strong>r than <strong>the</strong> long-term historical development<br />
<strong>of</strong> <strong>the</strong> current l<strong>and</strong>-<strong>use</strong> pattern, may <strong>of</strong>fer <strong>use</strong>ful clues for<br />
pinpointing <strong>the</strong> location factors, which help explain changes<br />
in <strong>the</strong> near future. Therefore, future calibration research will<br />
include an analysis <strong>of</strong> changed l<strong>and</strong> <strong>use</strong>, <strong>and</strong> will incorporate<br />
specific maps related to, for example, municipal building<br />
plans. In fact, most L<strong>and</strong> Use Scanner applications include a<br />
wide range <strong>of</strong> spatially explicit policy <strong>and</strong> planning maps.<br />
5.2<br />
Continuous model<br />
5.2.1 1993 l<strong>and</strong> <strong>use</strong> as input<br />
When <strong>the</strong> 1993 l<strong>and</strong> <strong>use</strong> is <strong>use</strong>d as input for <strong>the</strong> 2000 simulation,<br />
84% to 99% <strong>of</strong> <strong>the</strong> cells per l<strong>and</strong>-<strong>use</strong> type can be correctly<br />
simulated (Table 6). A score that is comparable to <strong>the</strong><br />
<strong>validation</strong> results <strong>of</strong> <strong>the</strong> discrete model, discussed before. The<br />
related map <strong>of</strong> dominant l<strong>and</strong> <strong>use</strong> (10A), in contrast, better<br />
resembles <strong>the</strong> observed l<strong>and</strong> <strong>use</strong>. This is mainly ca<strong>use</strong>d by <strong>the</strong><br />
lack <strong>of</strong> scattered residential areas, which were described in<br />
Validation results 33


