Statistical Handbook 2007 - University of Peradeniya
Statistical Handbook 2007 - University of Peradeniya
Statistical Handbook 2007 - University of Peradeniya

Create successful ePaper yourself
Turn your PDF publications into a flip-book with our unique Google optimized e-Paper software.
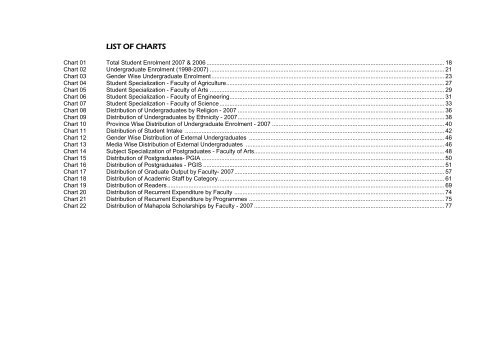
LIST OF CHARTS<br />
Chart 01 Total Student Enrolment <strong>2007</strong> & 2006 ................................................................................................................................................. 18<br />
Chart 02 Undergraduate Enrolment (1998-<strong>2007</strong>) ............................................................................................................................................... 21<br />
Chart 03 Gender Wise Undergraduate Enrolment.............................................................................................................................................. 23<br />
Chart 04 Student Specialization - Faculty <strong>of</strong> Agriculture..................................................................................................................................... 27<br />
Chart 05 Student Specialization - Faculty <strong>of</strong> Arts ............................................................................................................................................... 29<br />
Chart 06 Student Specialization - Faculty <strong>of</strong> Engineering................................................................................................................................... 31<br />
Chart 07 Student Specialization - Faculty <strong>of</strong> Science ......................................................................................................................................... 33<br />
Chart 08 Distribution <strong>of</strong> Undergraduates by Religion - <strong>2007</strong> .............................................................................................................................. 36<br />
Chart 09 Distribution <strong>of</strong> Undergraduates by Ethnicity - <strong>2007</strong>.............................................................................................................................. 38<br />
Chart 10 Province Wise Distribution <strong>of</strong> Undergraduate Enrolment - <strong>2007</strong> ......................................................................................................... 40<br />
Chart 11 Distribution <strong>of</strong> Student Intake .............................................................................................................................................................. 42<br />
Chart 12 Gender Wise Distribution <strong>of</strong> External Undergraduates ....................................................................................................................... 46<br />
Chart 13 Media Wise Distribution <strong>of</strong> External Undergraduates ......................................................................................................................... 46<br />
Chart 14 Subject Specialization <strong>of</strong> Postgraduates - Faculty <strong>of</strong> Arts.................................................................................................................... 48<br />
Chart 15 Distribution <strong>of</strong> Postgraduates- PGIA .................................................................................................................................................... 50<br />
Chart 16 Distribution <strong>of</strong> Postgraduates - PGIS ................................................................................................................................................... 51<br />
Chart 17 Distribution <strong>of</strong> Graduate Output by Faculty- <strong>2007</strong>................................................................................................................................ 57<br />
Chart 18 Distribution <strong>of</strong> Academic Staff by Category.......................................................................................................................................... 61<br />
Chart 19 Distribution <strong>of</strong> Readers......................................................................................................................................................................... 69<br />
Chart 20 Distribution <strong>of</strong> Recurrent Expenditure by Faculty ................................................................................................................................ 74<br />
Chart 21 Distribution <strong>of</strong> Recurrent Expenditure by Programmes ....................................................................................................................... 75<br />
Chart 22 Distribution <strong>of</strong> Mahapola Scholarships by Faculty - <strong>2007</strong> .................................................................................................................... 77