Statistical Handbook 2007 - University of Peradeniya
Statistical Handbook 2007 - University of Peradeniya
Statistical Handbook 2007 - University of Peradeniya

You also want an ePaper? Increase the reach of your titles
YUMPU automatically turns print PDFs into web optimized ePapers that Google loves.
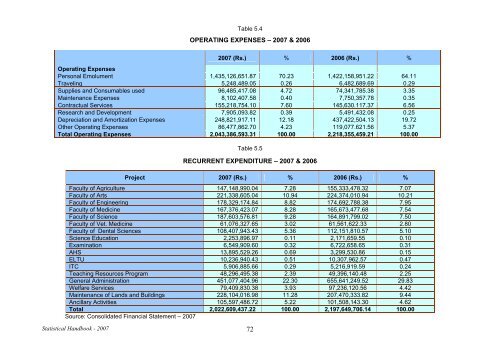
Table 5.4<br />
OPERATING EXPENSES – <strong>2007</strong> & 2006<br />
<strong>Statistical</strong> <strong>Handbook</strong> - <strong>2007</strong> 72<br />
<strong>2007</strong> (Rs.) % 2006 (Rs.) %<br />
Operating Expenses<br />
Personal Emolument 1,435,126,651.87 70.23 1,422,158,951.22 64.11<br />
Traveling 5,248,489.05 0.26 6,482,689.69 0.29<br />
Supplies and Consumables used 96,485,417.08 4.72 74,341,785.38 3.35<br />
Maintenance Expenses 8,102,407.58 0.40 7,750,357.78 0.35<br />
Contractual Services 155,218,754.10 7.60 145,630.117.37 6.56<br />
Research and Development 7,905,093.82 0.39 5,491,432.08 0.25<br />
Depreciation and Amortization Expenses 248,821,917.11 12.18 437,422,504.13 19.72<br />
Other Operating Expenses 86,477,862.70 4.23 119,077.621.56 5.37<br />
Total Operating Expenses 2,043,386,593.31 100.00 2,218,355,459.21 100.00<br />
Table 5.5<br />
RECURRENT EXPENDITURE – <strong>2007</strong> & 2006<br />
Project <strong>2007</strong> (Rs.) % 2006 (Rs.) %<br />
Faculty <strong>of</strong> Agriculture 147,148,990.04 7.28 155,333,478.32 7.07<br />
Faculty <strong>of</strong> Arts 221,338,605.04 10.94 224,374,010.94 10.21<br />
Faculty <strong>of</strong> Engineering 178,329,174.84 8.82 174,692,788.38 7.95<br />
Faculty <strong>of</strong> Medicine 167,376,423.07 8.28 165,673,477.68 7.54<br />
Faculty <strong>of</strong> Science 187,603,576.81 9.28 164,891,799.02 7.50<br />
Faculty <strong>of</strong> Vet. Medicine 61,076,327.65 3.02 61,561,622.33 2.80<br />
Faculty <strong>of</strong> Dental Sciences 108,407,943.43 5.36 112,151,810.57 5.10<br />
Science Education 2,253,896.97 0.11 2,171,659.55 0.10<br />
Examination 6,549,909.60 0.32 6,722,658.65 0.31<br />
AHS 13,895,529.26 0.69 3,299,530.86 0.15<br />
ELTU 10,236,940.43 0.51 10,307,962.57 0.47<br />
ITC 5,906,885.66 0.29 5,216,919.59 0.24<br />
Teaching Resources Program 48,296,495.38 2.39 49,396,140.48 2.25<br />
General Administration 451,077,404.96 22.30 655,641,249.52 29.83<br />
Welfare Services 79,409,830.38 3.93 97,236,120.56 4.42<br />
Maintenance <strong>of</strong> Lands and Buildings 228,104,016.98 11.28 207,470,333.82 9.44<br />
Ancillary Activities 105,597,486.72 5.22 101,508,143.30 4.62<br />
Total 2,022,609,437.22 100.00 2,197,649,706.14 100.00<br />
Source: Consolidated Financial Statement – <strong>2007</strong>