PEI 300 2009 - PEI Media
PEI 300 2009 - PEI Media
PEI 300 2009 - PEI Media

Create successful ePaper yourself
Turn your PDF publications into a flip-book with our unique Google optimized e-Paper software.
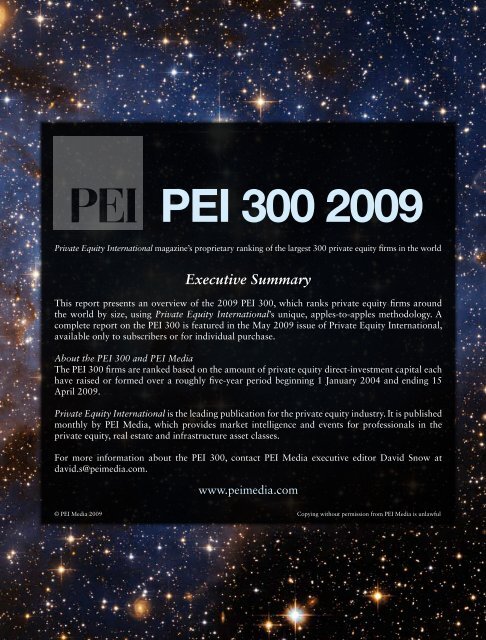
<strong>PEI</strong> <strong>300</strong> <strong>2009</strong><br />
Private Equity International magazine’s proprietary ranking of the largest <strong>300</strong> private equity firms in the world<br />
Executive Summary<br />
This report presents an overview of the <strong>2009</strong> <strong>PEI</strong> <strong>300</strong>, which ranks private equity firms around<br />
the world by size, using Private Equity International’s unique, apples-to-apples methodology. A<br />
complete report on the <strong>PEI</strong> <strong>300</strong> is featured in the May <strong>2009</strong> issue of Private Equity International,<br />
available only to subscribers or for individual purchase.<br />
About the <strong>PEI</strong> <strong>300</strong> and <strong>PEI</strong> <strong>Media</strong><br />
The <strong>PEI</strong> <strong>300</strong> firms are ranked based on the amount of private equity direct-investment capital each<br />
have raised or formed over a roughly five-year period beginning 1 January 2004 and ending 15<br />
April <strong>2009</strong>.<br />
Private Equity International is the leading publication for the private equity industry. It is published<br />
monthly by <strong>PEI</strong> <strong>Media</strong>, which provides market intelligence and events for professionals in the<br />
private equity, real estate and infrastructure asset classes.<br />
For more information about the <strong>PEI</strong> <strong>300</strong>, contact <strong>PEI</strong> <strong>Media</strong> executive editor David Snow at<br />
david.s@peimedia.com.<br />
www.peimedia.com<br />
© <strong>PEI</strong> <strong>Media</strong> <strong>2009</strong> Copying without permission from <strong>PEI</strong> <strong>Media</strong> is unlawful<br />
www.peimedia.com
Now with fund performance,<br />
analytics and GP data<br />
PE Connect<br />
Win the race for funds<br />
PE Connect is the definitive online database tracking<br />
investors in private equity and venture capital funds<br />
worldwide. Part of the world’s foremost private equity<br />
information group, it is widely regarded as the most reliable<br />
route to funds for the private equity industry worldwide.<br />
The surest way to sharpen your edge<br />
• Search and compare almost 3,500 LP profiles<br />
• Access new sources of capital from new types of<br />
investors and countries<br />
• Target LPs according to geographic or fund type<br />
appetite, assets under management or<br />
previous investments<br />
• Gain a competitive edge when searching for<br />
capital with PE Connect news and a FREE<br />
subscription to Privateequityonline<br />
To subscribe or for a free demonstration, please call Steven Randell<br />
on +1 212 645 1919 or +44 (0) 20 7566 5460 or email steven.r@peimedia.com<br />
Investor Intelligence. From a source you can trust.<br />
www.privateequityconnect.com<br />
PRIVATE EQUITY INTERNATIONAL
<strong>2009</strong> <strong>PEI</strong> <strong>300</strong> Executive Summary page 3<br />
The <strong>PEI</strong> <strong>300</strong><br />
Although <strong>2009</strong> marks the debut of the <strong>PEI</strong> <strong>300</strong>, this is the third year in a row that<br />
Private Equity International has ranked the largest 50 private equity firms in the<br />
world, called the <strong>PEI</strong> 50. As with last year, the line-up of the top 50 firms has<br />
not remained static. Some firms managed to close sizeable fundraisings, which<br />
boosted their respective ranks significantly, or allowed them to debut on the<br />
top 50 list. As in prior years, the <strong>PEI</strong> <strong>300</strong> based its rankings on this measure: the<br />
amount of private equity direct-investment capital raised or created over the past<br />
five years. See p. 10 for greater detail on the <strong>PEI</strong> <strong>300</strong> methodology.<br />
www.peimedia.com<br />
Capital raised OVER 2008<br />
Rank Name of firm Headquarters last five years ($Bn) Rank<br />
1 TPG Fort Worth (Texas) $52.35 3<br />
2 Goldman Sachs Principal Investment Area New York $48.99 2<br />
3 The Carlyle Group Washington DC $47.73 1<br />
4 Kohlberg Kravis Roberts New York $40.46 4<br />
5 Apollo Global Management New York $35.18 6<br />
6 Bain Capital Boston $34.95 7<br />
7 CVC Capital Partners London $33.73 5<br />
8 The Blackstone Group New York $30.8 10<br />
9 Warburg Pincus New York $23 11<br />
10 Apax Partners London $21.33 9<br />
11 First Reserve Corporation Greenwich (Connecticut) $20.89 23<br />
12 3i Group London $18.39 12<br />
13 American Capital Bethesda (Maryland) $17.99 15<br />
14 Hellman & Friedman San Francisco $17.9 25<br />
15 Providence Equity Partners Providence (Rhode Island) $16.36 16<br />
Legend: Higher rank than 2008 Lower rank than 2008 Same rank as 2008 <strong>PEI</strong> 50 debut<br />
*<br />
*Notes: “Five years” defined as 1 January 2004 to press time on 15 April <strong>2009</strong><br />
Firms with the same five-year fundraising total are further ranked based on size of largest fund, then most recent closing of fund<br />
All currencies have been converted at a set of standard exchange rates
page 4 <strong>PEI</strong> <strong>300</strong> Executive Summary <strong>2009</strong><br />
Capital raised over 2008<br />
Rank Name of firm Headquarters last five years ($bn) Rank<br />
16 Advent International Boston $16.13 13<br />
17 Terra Firma Capital Partners London $14.21 14<br />
18 General Atlantic Greenwich (Connecticut) $14.10 21<br />
19 Fortress Investment Group New York $14.08 20<br />
20 Silver Lake Menlo Park $14.0 17<br />
21 Cerberus Capital Management New York $13.9 18<br />
22 Permira London $12.67 8<br />
23 Clayton Dubilier & Rice New York $11.72 28<br />
24 Lehman Brothers Private Equity New York $11.71 31<br />
25 PAI Partners Paris $11.5 22<br />
26 Bridgepoint London $10.87 27<br />
27 EQT Partners Stockholm $10.82 24<br />
28 Madison Dearborn Partners Chicago $10.6 47<br />
29 Charterhouse Capital Partners London $10.56 30<br />
30 Teachers’ Private Capital Toronto $10.24 29<br />
31 Thomas H. Lee Partners Boston $10.21 32<br />
32 Cinven London $10.17 26<br />
33 Onex Toronto $9.59 49<br />
*<br />
34 Riverstone Holdings New York $9.4 N/A<br />
35 AXA Private Equity Paris $9.37 34<br />
36 JC Flowers & Co. New York $8.9 40<br />
37 Oaktree Capital Management Los Angeles $8.85 36<br />
38 BC Partners London $8.75 33<br />
*<br />
39 Candover London $8.45 N/A<br />
40 Welsh Carson Anderson & Stowe New York $8.42 50<br />
*<br />
41 Nordic Capital Stockholm $8.18 N/A<br />
42 WL Ross & Co. New York $7.77 45<br />
*<br />
43 Lindsay Goldberg New York $7.69 N/A<br />
44 Sun Capital Partners Boca Raton (Florida) $7.5 38<br />
45 NGP Energy Capital Management Dallas $7.47 35<br />
*<br />
*<br />
*<br />
46 AlpInvest Partners Amsterdam $7.26 N/A<br />
47 Kelso & Co. New York $7.2 N/A<br />
48 Citi Alternative Investments New York $7.08 N/A<br />
49 Marfin Investment Group Athens $6.86 37<br />
50 MatlinPatterson New York $6.83 44<br />
Legend: Higher rank than 2008 Lower rank than 2008 Same rank as 2008 <strong>PEI</strong> 50 debut<br />
www.peimedia.com<br />
*<br />
*Notes: “Five years” defined as 1 January 2004 to press time on 15 April <strong>2009</strong><br />
Firms with the same five-year fundraising total are further ranked based on size of largest fund, then most recent closing of fund<br />
All currencies have been converted at a set of standard exchange rates
<strong>2009</strong> <strong>PEI</strong> <strong>300</strong> Executive Summary page 5<br />
Capital raised over<br />
Rank Name of firm Headquarters last five years ($M)<br />
51 TA Associates Boston $6,827<br />
52 New Mountain Capital New York $6,687<br />
53 EnCap Investments Houston $6,575<br />
54 Abraaj Capital Dubai $6,493<br />
55 Doughty Hanson London $6,396<br />
56 Oak Hill Capital Partners Stamford (Connecticut) $6,<strong>300</strong><br />
57 Stone Point Capital Greenwich (Connecticut) $6,226<br />
58 Summit Partners Boston $6,101<br />
59 Investcorp Manama (Bahrain) $5,958<br />
60 ArcLight Capital Partners Boston $5,800<br />
61 Barclays Private Equity London $5,405<br />
62 HIG Capital Management Miami $5,342<br />
63 Leonard Green & Partners Los Angeles $5,<strong>300</strong><br />
64 Technology Crossover Ventures Palo Alto $5,<strong>300</strong><br />
65 Eurazeo Paris $4,847<br />
66 Arcapita Manama (Bahrain) $4,839<br />
67 Sequoia Capital Menlo Park $4,821<br />
68 Actis London $4,442<br />
69 CCMP Capital New York $4,318<br />
70 LS Power Group New York $4,285<br />
71 Altor Equity Partners Stockholm $4,158<br />
72 Crestview Partners New York $4,150<br />
73 TowerBrook Capital Partners New York $4,130<br />
74 Oak Investment Partners Westport (Connecticut) $4,110<br />
75 Citadel Capital Cairo $4,100<br />
76 MBK Partners Seoul $4,060<br />
77 One Equity Partners New York $4,000<br />
78 Pacific Equity Partners Sydney $3,835<br />
79 Lion Capital London $3,756<br />
80 Platinum Equity Partners Los Angeles $3,700<br />
81 Quantum Energy Partners Houston $3,665<br />
82 Vestar Capital Partners Boston $3,650<br />
83 Babson Capital Boston $3,636<br />
84 The Jordan Company New York $3,600<br />
85 New Enterprise Associates Chevy Chase (Maryland) $3,600<br />
86 Mid Europa Partners London $3,500<br />
87 Affinity Equity Partners Hong Kong $3,500<br />
88 Advantage Partners Tokyo $3,433<br />
89 Accel Partners Menlo Park $3,385<br />
90 American Securities Capital Partners New York $3,<strong>300</strong><br />
91 IK Investment Partners Stockholm $3,<strong>300</strong><br />
92 Softbank Group Tokyo $3,263<br />
93 GI Partners Menlo Park $3,250<br />
94 Tenaska Capital Management Omaha (Nebraska) $3,238<br />
95 Draper Fisher Jurvetson Menlo Park $3,237<br />
96 Hopu Investment Management Beijing $3,232<br />
97 Yucaipa Companies Los Angeles $3,225<br />
98 Centerbridge Capital Partners New York $3,200<br />
99 KRG Capital Denver $3,184<br />
100 Court Square Capital Partners New York $3,100<br />
*Notes: “Five years” defined as 1 January 2004 to press time on 15 April <strong>2009</strong><br />
Firms with the same five-year fundraising total are further ranked based on size of largest fund, then most recent closing of fund<br />
All currencies have been converted at a set of standard exchange rates<br />
www.peimedia.com
page 6 <strong>PEI</strong> <strong>300</strong> Executive Summary <strong>2009</strong><br />
Capital raised over<br />
Rank Name of firm Headquarters last five years ($M)<br />
101 Berkshire Partners Boston $3,100<br />
102 HSBC Principal Investments London $3,000<br />
103 Montagu Private Equity London $2,970<br />
104 ABRY Partners Boston $2,950<br />
105 Bohai Industrial Investment Fund Management Tianjin (China) $2,931<br />
106 Norwest Equity Partners Minneapolis $2,900<br />
107 Capital International London $2,868<br />
108 Kleiner Perkins Caufield & Byers Menlo Park $2,860<br />
109 Hony Capital Beijing $2,836<br />
110 Clessidra Milan $2,797<br />
111 Unitas Capital (formerly CCMP Capital Asia) Hong Kong $2,790<br />
112 GTCR Golder Rauner Chicago $2,750<br />
113 Irving Place Capital (formerly Bear Stearns Merchant Banking) New York $2,700<br />
114 CDH Investments Hong Kong $2,660<br />
115 Lime Rock Partners Westport (Connecticut) $2,633<br />
116 Unison Capital Partners Tokyo $2,620<br />
117 The Riverside Company New York $2,581<br />
118 MidOcean Partners New York $2,580<br />
119 LBO France Paris $2,576<br />
120 GP Investments Sao Paulo $2,550<br />
121 Golden Gate Capital San Francisco $2,414<br />
122 Credit Suisse Private Equity New York $2,400<br />
123 Energy Investors Funds San Francisco $2,400<br />
124 Audax Group New York $2,400<br />
125 Gavea Investimentos Rio de Janeiro $2,390<br />
126 Global Investment House Safat (Kuwait) $2,378<br />
127 Dubai International Capital Private Equity Dubai $2,376<br />
128 Francisco Partners San Francisco $2,332<br />
129 TDR Capital London $2,310<br />
130 Kohlberg & Co. Mount Kisco (New York) $2,<strong>300</strong><br />
131 IDG Ventures Boston $2,290<br />
132 Energy Capital Partners Short Hills (New Jersey) $2,250<br />
133 Odyssey Investment Partners New York $2,250<br />
134 Friedman Fleischer & Lowe San Francisco $2,250<br />
135 BLUM Capital Partners San Francisco $2,200<br />
136 Kayne Anderson Capital Advisors Los Angeles $2,200<br />
137 Veronis Suhler Stevenson New York $2,151<br />
138 Pamplona Capital Management London $2,141<br />
139 HgCapital London $2,139<br />
140 ChrysCapital New Delhi $2,080<br />
141 Genstar Capital San Francisco $2,025<br />
142 Morgan Stanley Private Equity New York $2,015<br />
143 Insight Venture Partners New York $2,010<br />
144 Baring Private Equity Asia Hong Kong $2,005<br />
145 Avista Capital Partners New York $2,000<br />
146 Investindustrial Milan $1,980<br />
147 SAIF Partners Hong Kong $1,977<br />
148 Catterton Partners Greenwich (Connecticut) $1,950<br />
149 Baring Vostok Capital Partners Moscow $1,913<br />
150 Essex Woodlands Health Ventures Palo Alto $1,900<br />
*Notes: “Five years” defined as 1 January 2004 to press time on 15 April <strong>2009</strong><br />
Firms with the same five-year fundraising total are further ranked based on size of largest fund, then most recent closing of fund<br />
All currencies have been converted at a set of standard exchange rates<br />
www.peimedia.com
<strong>2009</strong> <strong>PEI</strong> <strong>300</strong> Executive Summary page 7<br />
Capital raised over<br />
Rank Name of firm Headquarters last five years ($M)<br />
151 Herkules Capital Oslo $1,885<br />
152 Great Hill Partners Boston $1,850<br />
153 Index Ventures Geneva $1,848<br />
154 Waterland Private Equity Investments Bussum (Netherlands) $1,836<br />
155 Diamond Castle Holdings New York $1,825<br />
156 EnerVest Houston $1,801<br />
157 Moelis Capital Partners Los Angeles $1,800<br />
158 Quadrangle Group New York $1,800<br />
159 ARC Financial Corp. Calgary $1,771<br />
160 Exponent Private Equity London $1,753<br />
161 Blue Ridge China Beijing $1,750<br />
162 AEA Investors New York $1,745<br />
163 CapMan Private Equity Helsinki $1,720<br />
164 Energy Spectrum Partners Dallas $1,716<br />
165 Sterling Partners Baltimore $1,703<br />
166 Centre Partners Management New York $1,660<br />
167 KPS Capital Partners New York $1,654<br />
168 Cognetas London $1,650<br />
169 Duke Street London $1,634<br />
170 JLL Partners New York $1,600<br />
171 Astorg Partners Paris $1,598<br />
172 VantagePoint Venture Partners San Bruno (California) $1,585<br />
173 Yorktown Partners New York $1,580<br />
174 Ignition Partners Bellevue (Washington) $1,575<br />
175 Vector Capital San Francisco $1,550<br />
176 Mayfield Fund Menlo Park $1,536<br />
177 Castle Harlan New York $1,531<br />
178 Olympus Partners Stamford (Connecticut) $1,530<br />
179 Flexpoint Ford Chicago $1,505<br />
180 Elevation Partners Menlo Park $1,500<br />
181 Golub Capital Chicago $1,500<br />
182 Wind Point Partners Chicago $1,460<br />
183 Englefield Capital London $1,450<br />
184 Battery Ventures Waltham (Massachusetts) $1,450<br />
185 Climate Change Capital London $1,448<br />
186 Pine Brook Road Partners New York $1,430<br />
187 Austin Ventures Austin (Texas) $1,425<br />
188 Roark Capital Group Atlanta $1,416<br />
189 General Catalyst Partners Boston $1,416<br />
190 Navis Capital Partners Kuala Lumpur $1,415<br />
191 Sofinnova Paris $1,403<br />
192 Enterprise Investors Warsaw $1,396<br />
193 Archer Capital Sydney $1,394<br />
194 Balderton Capital London $1,365<br />
195 Vision Capital London $1,359<br />
196 Baird Private Equity Chicago $1,358<br />
197 Bessemer Venture Partners Larchmont (New York) $1,350<br />
198 Swicorp Riyadh $1,350<br />
199 Emerging Capital Partners Washington DC $1,344<br />
200 New Silk Route Partners New York $1,340<br />
*Notes: “Five years” defined as 1 January 2004 to press time on 15 April <strong>2009</strong><br />
Firms with the same five-year fundraising total are further ranked based on size of largest fund, then most recent closing of fund<br />
All currencies have been converted at a set of standard exchange rates<br />
www.peimedia.com
page 8 <strong>PEI</strong> <strong>300</strong> Executive Summary <strong>2009</strong><br />
Capital raised over<br />
Rank Name of firm Headquarters last five years ($M)<br />
201 Gimv Antwerp (Belgium) $1,323<br />
202 Venrock Palo Alto $1,317<br />
203 Vista Equity Partners San Francisco $1,<strong>300</strong><br />
204 Gores Group Los Angeles $1,<strong>300</strong><br />
205 Pamodzi Investment Holdings Athol (South Africa) $1,<strong>300</strong><br />
206 Code Hennessy & Simmons Chicago $1,<strong>300</strong><br />
207 Monitor Clipper Partners Boston $1,<strong>300</strong><br />
208 KERN Partners Calgary $1,296<br />
209 Lightspeed Venture Partners Menlo Park $1,288<br />
210 Foundation Capital Menlo Park $1,275<br />
211 Levine Leichtman Capital Partners Beverly Hills $1,269<br />
212 Lincolnshire Management New York $1,268<br />
213 LD Invest Equity Copenhagen $1,256<br />
214 InterWest Partners Menlo Park $1,256<br />
215 AAC Capital Partners Amsterdam $1,254<br />
216 Mercapital Madrid $1,254<br />
217 Greenhill Capital Partners New York $1,253<br />
218 Huntsman Gay Capital Partners Boston $1,250<br />
219 Intel Capital Santa Clara (California) $1,250<br />
220 CITIC Capital Hong Kong $1,246<br />
221 US Venture Partners Menlo Park $1,225<br />
222 Vitruvian Partners London $1,221<br />
223 Menlo Ventures Menlo Park $1,200<br />
224 Paine & Partners Foster City (California) $1,200<br />
225 Spectrum Equity Investors San Francisco $1,200<br />
226 Clearwater Capital Partners New York $1,200<br />
227 Domain Associates Princeton (New Jersey) $1,200<br />
228 Aisling Capital New York $1,200<br />
229 Gilde Utrecht (Netherlands) $1,188<br />
230 Perseus Washington DC $1,182<br />
231 The Sentient Group Sydney $1,175<br />
232 Benchmark Capital Menlo Park $1,175<br />
233 Electra Partners London $1,160<br />
234 LLR Equity Partners Philadelphia $1,160<br />
235 Clarus Ventures Cambridge (Massachusetts) $1,160<br />
236 Russia Partners Management (Siguler Guff) Moscow $1,135<br />
237 Egeria Amsterdam $1,132<br />
238 CLSA Capital Partners Hong Kong $1,130<br />
239 Magnum Capital Industrial Partners Lisbon $1,122<br />
240 HitecVision Stavanger (Norway) $1,116<br />
241 Highland Capital Partners Lexington (Massachusetts) $1,108<br />
242 Corsair Capital Partners New York $1,100<br />
243 Aquiline Capital Partners New York $1,100<br />
244 KSL Capital Partners Denver $1,100<br />
245 Brazos Private Equity Partners Dallas $1,100<br />
246 Canaan Partners Menlo Park $1,100<br />
247 Sentinel Capital Partners New York $1,084<br />
248 Frazier Healthcare Ventures Seattle $1,075<br />
249 Pegasus Capital Partners Cos Cob (Connecticut) $1,066<br />
250 Cartesian Capital New York $1,050<br />
*Notes: “Five years” defined as 1 January 2004 to press time on 15 April <strong>2009</strong><br />
Firms with the same five-year fundraising total are further ranked based on size of largest fund, then most recent closing of fund<br />
All currencies have been converted at a set of standard exchange rates<br />
www.peimedia.com
<strong>2009</strong> <strong>PEI</strong> <strong>300</strong> Executive Summary page 9<br />
Capital raised over<br />
Rank Name of firm Headquarters last five years ($M)<br />
251 Water Street Capital Management Chicago $1,020<br />
252 Quad-C Management Charlottesville (Virginia) $1,008<br />
253 Ironbridge Capital Sydney $1,005<br />
254 Lee Equity Partners New York $1,000<br />
255 Brysam Global Partners New York $1,000<br />
256 Greenbriar Equity Group Rye (New York) $1,000<br />
257 Polaris Venture Partners Boston $1,000<br />
258 Wellspring Capital Management New York $1,000<br />
259 Weston Presidio Capital San Francisco $1,000<br />
260 Freeman Spogli & Co. Los Angeles $1,000<br />
261 Angelo Gordon & Co. New York $1,000<br />
262 Mohr Davidow Ventures Menlo Park $1,000<br />
263 ECI Partners London $993<br />
264 HealthPoint Capital Partners New York $992<br />
265 Alta Partners San Francisco $975<br />
266 H&Q Asia Pacific Palo Alto $956<br />
267 FountainVest Partners Hong Kong $950<br />
268 Caltius Capital Management Los Angeles $949<br />
269 21 Partners Milan $937<br />
270 Lereko Metier Parklands (South Africa) $934<br />
271 Investitori Associati Milan $924<br />
272 ACON Investments Washington DC $923<br />
273 Brait Private Equity Johannesburg $922<br />
274 Daiwa SMBC Capital Tokyo $915<br />
275 Viola Group Herzeliya (Israel) $913<br />
276 Quintana Capital Houston $910<br />
277 Aurora Capital Group Los Angeles $900<br />
278 TSG Consumer Partners San Francisco $900<br />
279 JMI Equity Fund Baltimore $900<br />
280 Institutional Venture Partners Menlo Park $900<br />
281 Sigma Partners Boston $900<br />
282 ICICI Venture Mumbai $892<br />
283 Palamon Capital Partners London $884<br />
284 DCM Menlo Park $880<br />
285 Charles River Ventures Waltham (Massachusetts) $855<br />
286 Eos Partners New York $853<br />
287 Oakley Capital Investments London $851<br />
288 Ventizz Capital Duesseldorf $851<br />
289 Aureos London $850<br />
290 Littlejohn & Co. Greenwich (Connecticut) $850<br />
291 Lightyear Capital New York $850<br />
292 Bay City Capital San Francisco $850<br />
293 Morgenthaler Partners Menlo Park $850<br />
294 Gresham Private Equity London $846<br />
295 GGV Capital Menlo Park $840<br />
296 Accent Equity Partners Stockholm $831<br />
297 HM Capital Dallas $830<br />
298 Quadriga Capital Frankfurt $829<br />
299 Chequers Capital Paris $825<br />
<strong>300</strong> Thoma Bravo Chicago $822<br />
*Notes: “Five years” defined as 1 January 2004 to press time on 15 April <strong>2009</strong><br />
Firms with the same five-year fundraising total are further ranked based on size of largest fund, then most recent closing of fund<br />
All currencies have been converted at a set of standard exchange rates<br />
www.peimedia.com
page 10 <strong>PEI</strong> <strong>300</strong> Executive Summary <strong>2009</strong><br />
Rules of the game<br />
What the <strong>PEI</strong> <strong>300</strong> does and does not measure<br />
Would you believe that ranking <strong>300</strong> private equity firms by size<br />
is not an easy task?<br />
First one needs to define “private equity” and “size”. Then<br />
one needs to gather accurate capital-formation information on<br />
hundreds of firms in what is among the most opaque markets<br />
in the world.<br />
The result of this hard work is the <strong>PEI</strong> <strong>300</strong>, an expansion of<br />
an earlier annual ranking conducted by Private Equity International<br />
called the <strong>PEI</strong> 50. Responding to demand from our readers,<br />
we have simply applied the same rules governing the <strong>PEI</strong> 50<br />
rankings to a much larger population of firms.<br />
In compiling the rankings, we are certain that we missed some<br />
important details, but we are equally certain that we exhausted<br />
every available resource in sourcing the best information. Private<br />
equity remains a non-transparent asset class, but it is getting<br />
more transparent with each passing year. We therefore believe<br />
that the <strong>PEI</strong> <strong>300</strong> will become more and more authoritative<br />
as a guide to the most important investment firms in the global<br />
private equity market.<br />
A firm’s rank among the largest <strong>300</strong> private equity firms in<br />
the world is determined by how much private equity directinvestment<br />
capital that firm has raised over a roughly five-year<br />
window ending at our press date last month.<br />
What is the <strong>PEI</strong> <strong>300</strong>?<br />
The <strong>PEI</strong> <strong>300</strong> is a ranking of private equity firms globally by size.<br />
It is the only apples-to-apples comparison of dedicated, direct-investment<br />
private equity programmes. The rankings began in 2007<br />
as the <strong>PEI</strong> 50 and was expanded to the <strong>PEI</strong> <strong>300</strong> in <strong>2009</strong> due to<br />
demand for more information about private equity firms globally.<br />
The <strong>PEI</strong> <strong>300</strong> is not a performance ranking, nor does it constitute<br />
investment recommendations. The <strong>PEI</strong> <strong>300</strong> includes private<br />
equity firms with varying structures and strategies around the<br />
world. While the list is mostly made up of private equity firms<br />
that manage private equity limited partnerships, it also includes<br />
firms with multiple strategies and business lines, and firms with<br />
publicly traded vehicles.<br />
However, only a defined type of private equity capital is<br />
counted in determining the <strong>PEI</strong> <strong>300</strong> rankings, as described below.<br />
The <strong>PEI</strong> <strong>300</strong> only measures capital raised or formed within<br />
a five-year window spanning from 1 January 2004 until 15 April<br />
<strong>2009</strong>. Last year’s rankings were also drawn from a 64-month<br />
window, but of course last year the window started on 1 January<br />
2003 and ended on 15 April 2008.<br />
Where two firms have raised the same amount of capital over<br />
this time period, the higher <strong>PEI</strong> <strong>300</strong> rank goes to the firm with<br />
the largest active pool of capital raised since 2004 (i.e., the biggest<br />
single fund). If there is still a “tie” after taking into account<br />
size of single fund, we give greater weight to the firm that has<br />
raised the most capital most recently.<br />
In coming up with our key “<strong>2009</strong> <strong>PEI</strong> <strong>300</strong> Five-Year Fundraising<br />
Total” figures, upon which the <strong>PEI</strong> <strong>300</strong> rankings are based,<br />
we rely on the most accurate information available. We give<br />
highest priority to information that we receive from or confirm<br />
with the private equity firms themselves, always on background.<br />
When the private equity firms themselves confirm details, we<br />
still seek to “trust but verify”.<br />
Some details simply cannot be verified by us, and in these cases<br />
we defer to the honour system. In order to encourage cooperation<br />
from private equity firms that might make the <strong>PEI</strong> <strong>300</strong>, we<br />
do not disclose which firms have aided us on background and<br />
which have not. Lacking confirmation of details from the firms<br />
themselves, we seek to corroborate information using any available<br />
resources, including the firms’ own websites, press releases,<br />
news reports, third-party databases, limited partner disclosures,<br />
etc.<br />
Definitions<br />
To help answer this question – how much private equity capital<br />
has the firm raised since 1 January 2004? – we needed to set<br />
some definitions:<br />
“Private equity”: The definition of private equity for the purposes<br />
of the <strong>PEI</strong> <strong>300</strong> means capital raised for a dedicated programme of<br />
investing directly into businesses. This includes equity capital for<br />
diversified private equity, buyouts, growth equity, venture capital,<br />
turnaround or control-oriented distressed investment capital, and<br />
mezzanine debt. Our rankings do not take into account funds of<br />
funds capital, capital raised for primarily real estate strategies,<br />
hedge fund capital, infrastructure and debt capital.<br />
“Capital raised”: This means capital definitively committed to<br />
a private equity direct investment programme. In the case of a<br />
fundraising, it means the fund has had a final or official interim<br />
close after 1 January 2004. We count the full amount of a fund<br />
if it has a close after this date. We also count the full amount<br />
of an interim close that has occurred recently, even if no official<br />
announcement has been made. We also count capital raised<br />
through other means, such as LP co-investment vehicles, dealby-deal<br />
LP co-investment capital, publicly traded vehicles and<br />
earmarked annual contributions from a sponsoring entity, when<br />
we are able to access this information. Where capital is raised in<br />
partnership with an affiliated entity, we take into consideration<br />
the economic relationship between the two entities, as well as<br />
how the fundraising was marketed to investors.<br />
We count mezzanine debt raised by firms that are primarily engaged<br />
in private equity investing. We only count equity raised<br />
for these funds, not the leveraged “buying power”. Mezzanine<br />
debt frequently involves warrants for equity stakes, and has<br />
historically been counted alongside buyout capital by industry<br />
media and data services groups.<br />
www.peimedia.com
<strong>2009</strong> <strong>PEI</strong> <strong>300</strong> Executive Summary page 11<br />
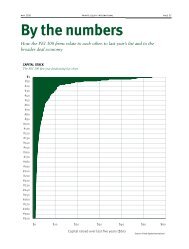
By the numbers<br />
How the <strong>PEI</strong> <strong>300</strong> firms relate to each other, to last year’s list and to the<br />
broader deal economy<br />
Top 50 vs. next 250<br />
Over the past five years, the largest 50 firms in<br />
the world have raised some 55 percent more<br />
equity capital than the next 250 firms<br />
$900<br />
Slowing at the top<br />
The largest 50 firms in the world did not raise<br />
significantly more capital during the five year<br />
window ending last month than during similar<br />
windows ending in the two prior years<br />
$1000<br />
Five-year fundraising total ($bn)<br />
$750<br />
$600<br />
$450<br />
$<strong>300</strong><br />
$150<br />
$813<br />
$524<br />
Five-year fundraising total ($bn)<br />
$800<br />
$600<br />
$400<br />
$200<br />
$551<br />
$810 $813<br />
$0<br />
Top 50 Next 250<br />
0<br />
<strong>PEI</strong> 50 2007 <strong>PEI</strong> 50 2008 <strong>PEI</strong> 50 <strong>2009</strong><br />
Source: Private Equity International<br />
Source: Private Equity International<br />
Where they’re based<br />
Although many of the <strong>PEI</strong> <strong>300</strong> firms are globally<br />
active, a look at their headquarters shows the<br />
continued dominance of North America and the<br />
UK in the private equity industry<br />
Europe ex-UK<br />
11.3%<br />
UK<br />
11.3%<br />
MENA<br />
2.7%<br />
Asia<br />
8%<br />
Africa<br />
1% Latin America<br />
0.7%<br />
North America<br />
65%<br />
www.peimedia.com<br />
Two years of climbing<br />
These top 50 firms have advanced in our rankings<br />
for two consecutive years<br />
TPG<br />
Apollo Global Management<br />
Bain Capital<br />
Warburg Pincus<br />
American Capital<br />
Fortress Investment Group<br />
Clayton Dubilier & Rice<br />
JC Flowers & Co.<br />
WL Ross & Co.<br />
Bridgepoint<br />
Out of the 50<br />
These firms appeared in last year’s top 50 but not<br />
in this year’s top 50<br />
Barclays Private Equity<br />
EnCap Investments<br />
New Mountain Capital<br />
Eurazeo<br />
TA Associates<br />
Doughty Hanson<br />
AIG Investments
$2.5<br />
2.0<br />
$1.81<br />
page 12 <strong>PEI</strong> <strong>300</strong> Executive Summary <strong>2009</strong><br />
<strong>PEI</strong> 50 outperforms rest of the pack<br />
According to State Street Private Edge (SSPE), the <strong>PEI</strong> 50 outperformed the next 250 largest firms and the<br />
$0.5<br />
industry as a whole, tracked by the SSPE Index. Non-US <strong>PEI</strong> 50 firms lead by a clear margin<br />
<strong>PEI</strong> 50 irr pei <strong>300</strong> irr $0.0sspe Index IRR<br />
Pooled average 13.45% 13.38%<br />
<strong>PEI</strong> <strong>300</strong><br />
12.92%<br />
Deal value ($tr)<br />
$1.5<br />
$1.0<br />
By investment focus<br />
Buyout 13.50% 13.29% 13.38%<br />
$1.5<br />
Venture $2.5 capital 14.13% 12.87% 12.01%<br />
Mezzanine and others 12.69% 13.55% $1.19 10.60%<br />
2.0<br />
$1.2<br />
$1.81<br />
By geography<br />
US $1.5<br />
13.36% 13.31%<br />
$0.9<br />
12.47%<br />
Deal value ($tr)<br />
Non-US 15.67% 15.48% 15.61%<br />
$1.0<br />
$0.6<br />
Notes: Based on data compiled from 1437 private equity funds, including fully liquidated partnerships, formed between 1990 to 2008 Q3. IRR: Pooled Average IRR is net<br />
of fees, expenses and carried interest. Pooled average IRR treats sample funds as a single “fund” by adding together all cash flows and net asset values. Rather than<br />
averaging returns for each sample fund, returns are calculated on the underlying “pooled” portfolio.<br />
$0.5<br />
$0.3<br />
Source: State Street Private Edge<br />
Deal value ($tr)<br />
$1.39<br />
$0.0<br />
<strong>PEI</strong> <strong>300</strong><br />
Slowing deals for the top 50<br />
The largest 50 firms did fewer deals during the five year<br />
window ending April <strong>2009</strong> than the previous period<br />
$0.0<br />
<strong>PEI</strong> 50 2007 <strong>PEI</strong> 50 2008 PE<br />
<strong>PEI</strong> <strong>300</strong> deals vs. the world<br />
According to Dealogic, <strong>PEI</strong> <strong>300</strong> firms spoke for more<br />
than 10 percent of global M&A over the past five years<br />
$1.5<br />
$1.2<br />
$1.19<br />
$1.39 $1.37<br />
$20<br />
$15<br />
$17.41<br />
Deal value ($tr)<br />
$0.9<br />
$0.6<br />
$0.3<br />
Deal value ($tr)<br />
$10<br />
$5<br />
$1.81<br />
$2.08<br />
$0.0<br />
<strong>PEI</strong> 50 2007 <strong>PEI</strong> 50 2008 <strong>PEI</strong> 50 <strong>2009</strong><br />
Notes: Excludes real estate and infrastructure deals<br />
Source: Dealogic<br />
$0<br />
<strong>PEI</strong> <strong>300</strong><br />
All PE<br />
Notes: Excludes real estate and infrastructure deals<br />
All M&A<br />
Source: Dealogic<br />
$1.81<br />
<strong>PEI</strong> <strong>300</strong><br />
How they spent it<br />
$17.41<br />
The <strong>PEI</strong> <strong>300</strong> invested $1.81 trillion in a broad array<br />
of industries around the world since 1 January 2004<br />
$2.08<br />
All PE<br />
Professional<br />
services<br />
All 9.0% M&A<br />
Finance<br />
10%<br />
Notes: Excludes real estate<br />
and infrastructure deals<br />
Dining<br />
& lodging<br />
7.9%<br />
Utility &<br />
energy<br />
11.3%<br />
Transportation<br />
6.5%<br />
Finance<br />
10%<br />
Dining<br />
& lodging<br />
Telecommunications<br />
7.9%<br />
Telecommunications<br />
17.6%<br />
17.6%<br />
Professional<br />
services<br />
9.0%<br />
Transportation<br />
6.5%<br />
Healthcare<br />
13.8%<br />
Computers &<br />
Utility electronics<br />
&<br />
12.4%<br />
Retailenergy<br />
Retail<br />
11.5% 11.3%<br />
11.5%<br />
Healthcare<br />
13.8%<br />
Computers &<br />
electronics<br />
12.4%<br />
Source: Dealogic<br />
WHERE they spent it<br />
The <strong>PEI</strong> <strong>300</strong> have invested in diverse locations<br />
around the world since 1 January 2004<br />
Europe<br />
34.9%<br />
Latin America<br />
0.7%<br />
Asia<br />
5.1%<br />
Notes: Excludes real estate<br />
and infrastructure deals<br />
Africa Latin America Africa<br />
0.6% 0.7% Middle East<br />
0.6% Middle East<br />
0.2%<br />
0.2%<br />
Asia<br />
5.1%<br />
Europe<br />
34.9%<br />
North America<br />
58.5%<br />
North America<br />
58.5%<br />
Source: Dealogic<br />
www.peimedia.com
PRIVATE EQUITY MATHEMATICS<br />
Are company valuations playing on your mind?<br />
Private Equity Mathematics<br />
will help you to:<br />
• Understand the nuances of private<br />
equity performance<br />
• Learn about PE cash flows with<br />
different models<br />
• Assess the inherent risk of PE fund<br />
investments<br />
• Discover how to measure PE<br />
performance in detail<br />
• Find out how you can actually estimate<br />
alpha in a PE portfolio<br />
Price: $665<br />
ISBN: 978-1-904696-60-5<br />
• See how valuations are calculated in<br />
buyouts and venture<br />
• Appreciate how management fees and<br />
carried interest work<br />
ORDER YOUR COPY NOW:<br />
London: +44 20 7566 5444 • New York: +1 212 645 1919<br />
+44 20 7566 5455 fran.h@peimedia.com www.peimedia.com/mathematics<br />
www.peimedia.com/mathematics<br />
A PRIVATE EQUITY INTERNATIONAL PUBLICATION