Evaluation of Corneal Shape and Biomechanics Before ... - Pentacam
Evaluation of Corneal Shape and Biomechanics Before ... - Pentacam
Evaluation of Corneal Shape and Biomechanics Before ... - Pentacam

Create successful ePaper yourself
Turn your PDF publications into a flip-book with our unique Google optimized e-Paper software.
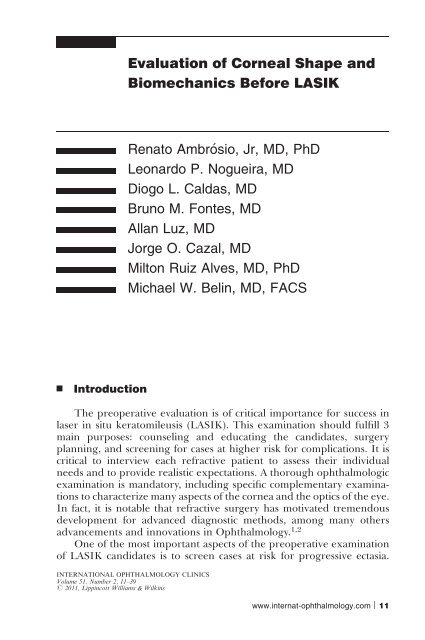
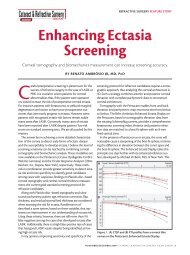
<strong>Evaluation</strong> <strong>of</strong> <strong>Corneal</strong> <strong>Shape</strong> <strong>and</strong><br />
<strong>Biomechanics</strong> <strong>Before</strong> LASIK<br />
Renato Ambrósio, Jr, MD, PhD<br />
Leonardo P. Nogueira, MD<br />
Diogo L. Caldas, MD<br />
Bruno M. Fontes, MD<br />
Allan Luz, MD<br />
Jorge O. Cazal, MD<br />
Milton Ruiz Alves, MD, PhD<br />
Michael W. Belin, MD, FACS<br />
’ Introduction<br />
The preoperative evaluation is <strong>of</strong> critical importance for success in<br />
laser in situ keratomileusis (LASIK). This examination should fulfill 3<br />
main purposes: counseling <strong>and</strong> educating the c<strong>and</strong>idates, surgery<br />
planning, <strong>and</strong> screening for cases at higher risk for complications. It is<br />
critical to interview each refractive patient to assess their individual<br />
needs <strong>and</strong> to provide realistic expectations. A thorough ophthalmologic<br />
examination is m<strong>and</strong>atory, including specific complementary examinations<br />
to characterize many aspects <strong>of</strong> the cornea <strong>and</strong> the optics <strong>of</strong> the eye.<br />
In fact, it is notable that refractive surgery has motivated tremendous<br />
development for advanced diagnostic methods, among many others<br />
advancements <strong>and</strong> innovations in Ophthalmology. 1,2<br />
One <strong>of</strong> the most important aspects <strong>of</strong> the preoperative examination<br />
<strong>of</strong> LASIK c<strong>and</strong>idates is to screen cases at risk for progressive ectasia.<br />
INTERNATIONAL OPHTHALMOLOGY CLINICS<br />
Volume 51, Number 2, 11–39<br />
r 2011, Lippincott Williams & Wilkins<br />
www.internat-ophthalmology.com | 11
12 ’ Ambrósio et al<br />
Keratectasia has emerged as a rare but very severe complication <strong>of</strong><br />
LASIK, which is a leading cause <strong>of</strong> litigation. 3,4 In post-LASIK ectasia,<br />
the lamellar cut <strong>and</strong> excimer laser ablation lead to a state <strong>of</strong> biomechanical<br />
failure with an inability to support the continuous stresses<br />
caused by intraocular pressure (IOP), extraocular muscle action,<br />
blinking, eye rubbing, <strong>and</strong> other forces. 5 The corneal stroma undergoes<br />
a 2-step process <strong>of</strong> delamination <strong>and</strong> interfibril fracture, which is<br />
clinically characterized by thinning <strong>and</strong> bulging <strong>of</strong> the cornea. This<br />
causes mild-to-severe irregular astigmatism, a myopic shift, <strong>and</strong> typically<br />
reduces uncorrected <strong>and</strong> best spectacle-corrected visual acuity. 4<br />
Considering the severity <strong>of</strong> such complication, prevention is the best<br />
approach.<br />
Refractive surgeons routinely face the challenges <strong>of</strong> identifying <strong>and</strong><br />
properly addressing cases at higher risk for ectasia. Clinical decisions<br />
should be taken based not only on scientific evidence 6 but also should<br />
include individual practice experience <strong>and</strong> judgment. Much has been<br />
written about the role <strong>of</strong> corneal topography <strong>and</strong> central corneal<br />
thickness (CCT), 7–9 as the st<strong>and</strong>ard methods for screening refractive<br />
patients. Considering such classic criteria, the ectasia risk scoring system<br />
(ERSS) was developed by R<strong>and</strong>leman et al. 10 The ERSS was developed<br />
based on a retrospective case-control study, which evaluated Placido discbased<br />
corneal topography, CCT, the level <strong>of</strong> correction, residual stromal<br />
bed (RSB), <strong>and</strong> patient’s age. In this study, abnormal preoperative<br />
topography <strong>and</strong> age were the most significant predictive variables. The<br />
scoring method was validated by a second study with an incidence <strong>of</strong> 6%<br />
<strong>of</strong> false positives, if considering each eye as an isolated c<strong>and</strong>idate. 11<br />
However, if we consider that if one eye is excluded, then both eyes from<br />
the same patient would be excluded, the correct false positive ratio<br />
would be 11.6%. This may be conservatively acceptable for most<br />
surgeons, considering the severe nature <strong>of</strong> keratectasia. However, the<br />
most important limitation <strong>of</strong> the ERSS is related to the lack <strong>of</strong> proper<br />
sensitivity. The ERSS had 4% to 8% <strong>of</strong> false negatives in the original<br />
studies, 10,11 <strong>and</strong> a separate retrospective study involving 36 cases with<br />
ectasia after LASIK found 9 eyes (25%) classified as low risk <strong>and</strong> 7 eyes<br />
(19%) as moderate risk. 12 In addition, a much higher incidence <strong>of</strong> false<br />
positives may be encountered, mostly if a younger population <strong>of</strong> LASIK<br />
c<strong>and</strong>idates with normal topographies is evaluated. 13,14 The relatively<br />
high incidence <strong>of</strong> false negatives on the ERSS goes in agreement with<br />
other reported cases <strong>of</strong> ectasia after LASIK in the absence <strong>of</strong> apparent<br />
risk factors. 15–18<br />
Considering the limitations <strong>of</strong> the st<strong>and</strong>ard screening methodology,<br />
there is an unquestionable need for novel diagnostic tools that will<br />
complement front surface curvature map (topography) <strong>and</strong> CCT for<br />
developing a more sensitive <strong>and</strong> specific approach for identifying ectasia<br />
risk among refractive c<strong>and</strong>idates. 19<br />
www.internat-ophthalmology.com
<strong>Evaluation</strong> <strong>of</strong> <strong>Corneal</strong> <strong>Shape</strong> <strong>and</strong> <strong>Biomechanics</strong> ’ 13<br />
’ The Concept <strong>of</strong> Enhanced Screening for Detecting<br />
Ectasia Susceptibility<br />
The best predictor for the development <strong>of</strong> ectasia after LASIK is the<br />
presence <strong>of</strong> an overlooked ectatic disorder preoperatively, 4,12,20,21 in<br />
which LASIK is an aggravating factor for the acceleration <strong>of</strong> the ectatic<br />
process. However, ectasia may also occur in an otherwise healthy cornea<br />
if there is significant weakening caused by the surgery. 5 This can be<br />
related to a thick flap <strong>and</strong>/or excessive tissue removal because <strong>of</strong> high<br />
corrections 22 or retreatments. 23 In either situation, biomechanical failure<br />
occurs because the RSB is not enough for maintaining corneal<br />
strength after the procedure. A lower limit RSB <strong>of</strong> 250 mm has been<br />
commonly deemed acceptable, 6,24 but a limit <strong>of</strong> half <strong>of</strong> corneal central<br />
thickness seems more appropriate. 9 However, there are cases with RSB<br />
higher than 250 mm that developed ectasia, 17,25,26 whereas there are<br />
cases with RSB even lower than 200 mm that remained stable with long<br />
follow-up. 27 In addition, ectasia can also occur after surface ablation<br />
procedures, 28,29 although the biomechanical impact <strong>of</strong> the ablation on<br />
the anterior stroma is much less pronounced if there is no lamellar cut. 30<br />
Interestingly, a series <strong>of</strong> ultrathin corneas after therapeutic surface<br />
ablation with long-term stability was described by Vinciguerra et al. 31<br />
Thereby, the limits for a safe <strong>and</strong> stable RSB vary significantly among<br />
each individual cornea. The individualized level <strong>of</strong> susceptibility or<br />
predisposition for developing ectasia should be the ultimate goal when<br />
screening LASIK c<strong>and</strong>idates. Since 2004, we have routinely performed<br />
3-dimensional corneal tomography <strong>and</strong> biomechanical analysis using the<br />
<strong>Pentacam</strong> <strong>Corneal</strong> Tomographer (Oculus GmbH, Wetzlar, Germany)<br />
<strong>and</strong> the Ocular Response Analyzer (ORA, Reichert Ophthalmic Instruments,<br />
Buffalo, NY), respectively, for screening refractive c<strong>and</strong>idates<br />
(Ambrósio Jr R et al Clinical Evidence <strong>of</strong> the Enhanced Sensitivity <strong>and</strong><br />
Specificity <strong>of</strong> <strong>Corneal</strong> Tomography <strong>and</strong> <strong>Biomechanics</strong> for Screening<br />
Ectasia in Refractive C<strong>and</strong>idates ePoster ASCRS 2009. http://ascrs2009.<br />
abstractsnet.com/acover.wcs?entryid=000161).<br />
’ A Critical Revision on ‘‘Topospeaking’’<br />
‘‘Topography’’ derives from Greek words ‘‘to place’’ (topo) <strong>and</strong> ‘‘to<br />
write’’ (graphein), which means to describe a place. The term ‘‘corneal<br />
topography’’ has been classically used for the reconstruction <strong>of</strong> the front<br />
(anterior) corneal surface, which is commonly achieved by reflective,<br />
Placido disc-based systems. <strong>Corneal</strong> topography represented a true<br />
revolution in the diagnosis <strong>and</strong> management <strong>of</strong> corneal disease 1 <strong>and</strong> has<br />
a recognized role in the development <strong>of</strong> refractive surgery. 7,32,33<br />
The term ‘‘tomography’’ was also derived from the Greek, as the<br />
combination <strong>of</strong> ‘‘to cut or section’’ (tomos) <strong>and</strong> ‘‘to write’’ (graphein).<br />
www.internat-ophthalmology.com
14 ’ Ambrósio et al<br />
<strong>Corneal</strong> tomography is related to a 3-dimensional reconstruction <strong>of</strong> the<br />
cornea<strong>and</strong>shouldbeusedforthecharacterization<strong>of</strong>theelevation<strong>of</strong>the<br />
front <strong>and</strong> back surfaces <strong>of</strong> the cornea, along with pachymetric mapping.<br />
Different technologies such as horizontal slit scanning, rotational Scheimpflug,<br />
arc scanning with very high-frequency ultrasound, <strong>and</strong> optical<br />
coherence tomography are available in many commercial instruments. 34<br />
<strong>Corneal</strong> topography was found to be sensitive for detecting subtle<br />
(subclinical) changes on the anterior corneal surface secondary to ectatic<br />
disorders before loss <strong>of</strong> best spectacle-corrected visual acuity <strong>and</strong> the<br />
development <strong>of</strong> typical slit-lamp biomicroscopy findings (Figs. 1–3—<br />
OD). 35,36 The occurrence <strong>of</strong> subclinical cases <strong>of</strong> keratoconus represent<br />
an unquestionable argument for topography to be considered as a critical<br />
test before any refractive procedure. However, there are cases with<br />
topographic similarities <strong>of</strong> ectasia on the curvature map that may not<br />
represent true ectatic disease, which may be related to abnormal<br />
ocular surface such as in anterior basement membrane dystrophy<br />
(Fig. 4), contact-lens warpage, 37 or simply a rare variation <strong>of</strong> normality. 38<br />
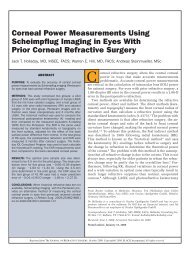
Figure 1. Axial curvature map <strong>and</strong> photokeratoscopic image from Placido disk-based corneal<br />
topography acquired from ATLAS (Zeiss Humphrey, San Le<strong>and</strong>ro, CA) taken for a 20-years-old<br />
male patient with very asymmetric keratoconus. UCVA was 20/100 in OD <strong>and</strong> 20/200 in OS.<br />
BSCVA is 20/20-1 in OD <strong>and</strong> 20/15 in OS with + 0.25 -3.25 791 in the right eye <strong>and</strong> -1.00 -<br />
0.50 1261 in the left eye. Slit-lamp corneal examination was unremarkably normal unless for more<br />
evident corneal nerves in the mid stroma in both eyes. (same eyes as in Figs. 2, 3)<br />
www.internat-ophthalmology.com
<strong>Evaluation</strong> <strong>of</strong> <strong>Corneal</strong> <strong>Shape</strong> <strong>and</strong> <strong>Biomechanics</strong> ’ 15<br />
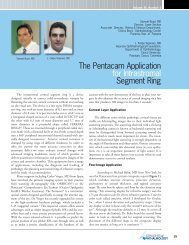
Figure 2. <strong>Corneal</strong> curvature (sagittal or axial) taken from the <strong>Pentacam</strong> HR (Oculus) from the<br />
same eye as in Figure 1 <strong>and</strong> 3. The topometric artificial intelligence based on front surface curvature<br />
data at 8 mm indicates KC 1 to 2 in OD <strong>and</strong> normal pattern in OS. The corneal thickness spatial<br />
pr<strong>of</strong>ile <strong>and</strong> percentage thickness increase graphs show an abnormal thickness pr<strong>of</strong>ile despite normal<br />
central corneal thickness <strong>of</strong> 510 <strong>and</strong> 531 mm in OD <strong>and</strong> OS, respectively. Note the Ambrósio<br />
relational thickness maximal <strong>of</strong> 268 mm [thinnest point (TP) = 500; pachymetric progression index<br />
(PPI) Max = 1.9] in OD <strong>and</strong> 262 mm (TP = 524; PPI Max = 2) in OS.<br />
Other cases with mild irregularities, which do not meet the criteria for<br />
keratoconus, are defined as keratoconus suspects (KCS) (Fig. 5A).<br />
Compared with topography (anterior curvature), tomographic analysis<br />
has proven effective for enhancing specificity among such cases (Fig. 5B).<br />
www.internat-ophthalmology.com
16 ’ Ambrósio et al<br />
Figure 3. Axial Curvature Map, photokeratoscopic image, <strong>and</strong> artificial intelligence system (Nidek<br />
<strong>Corneal</strong> Navigator) acquired from Nidek Magellan (Gamagori, Japan). Note similar findings as in<br />
Figures 1 <strong>and</strong> 2. OD has 94.5% similarity with KC (KSI 6.6%), whereas OS has 45% <strong>of</strong> similarity<br />
with a normal pattern <strong>and</strong> 54% <strong>of</strong> similarity with unspecific pattern.<br />
More importantly, there are circumstances in which the ectatic change is<br />
not yet present on the front surface, so that corneal topography seems to<br />
be normal despite subtle disease. Such special groups <strong>of</strong> cases include the<br />
www.internat-ophthalmology.com
<strong>Evaluation</strong> <strong>of</strong> <strong>Corneal</strong> <strong>Shape</strong> <strong>and</strong> <strong>Biomechanics</strong> ’ 17<br />
Figure 4. A, <strong>Corneal</strong> Topography from a case with false ectasia because <strong>of</strong> irregular surface. Note<br />
the central area with more than 50 D, which coincides with the irregular photokeratoscopic reflex. B,<br />
Slit-lamp biomicroscopy showing classic fingerprinting on the epithelium related to anterior basement<br />
membrane dystrophy.<br />
www.internat-ophthalmology.com
18 ’ Ambrósio et al<br />
Figure 5. A, <strong>Corneal</strong> topography findings from Nidek Magellan <strong>and</strong> (B) Belin-Ambrósio<br />
Enhanced Ectasia Display from Oculus <strong>Pentacam</strong> <strong>of</strong> a case with inferior steepening but no evidence<br />
<strong>of</strong> ectasia on clinical examination. Note 90.1% <strong>of</strong> similarity with a KCS pattern at the Nidek <strong>Corneal</strong><br />
Navigator, while the tomographic data show a thick cornea (central corneal thickness = 591 mm) with<br />
normal pachymetric distribution <strong>and</strong> normal elevation findings from the front <strong>and</strong> back corneal<br />
surfaces. Same eye as in Figure 16, which shows normal biomechanical properties.<br />
www.internat-ophthalmology.com
<strong>Evaluation</strong> <strong>of</strong> <strong>Corneal</strong> <strong>Shape</strong> <strong>and</strong> <strong>Biomechanics</strong> ’ 19<br />
Figure 6. Sagittal (A) <strong>and</strong> Tangential (B) curvature maps from the <strong>Pentacam</strong> using the Ambrósio-<br />
2 scale. Note the tangential map evidences more irregularity pattern, but there is no definitive<br />
evidence <strong>of</strong> abnormality. The contralateral eye <strong>of</strong> this patient has clinical keratoconus.<br />
contralateral eyes with normal topographies from patients with very asymmetric<br />
(not truly unilateral) keratoconus (Figs 1–3—OS, Fig. 7), 39–43 <strong>and</strong><br />
cases with natural progression <strong>of</strong> keratoconus which have been documen-<br />
Figure 7. Belin-Ambrósio enhanced ectasia display from Oculus <strong>Pentacam</strong> <strong>of</strong> the same eye as in<br />
Figures 1 <strong>and</strong> 2. Note the final D value <strong>of</strong> 1.86, Ambrósio relational thickness maximal <strong>of</strong> 327 mm<br />
(thinnest point = 483; pachymetric progression index Max = 1.47), which is consistent with high<br />
ectasia susceptibility. Clinical examination was unremarkable <strong>and</strong> BSCVA was 20/15 with mild<br />
myopic astigmatism.<br />
www.internat-ophthalmology.com
20 ’ Ambrósio et al<br />
Figure 8. Noninvasive break-up timb (BUT) display from the Oculus Keratograph. Note the<br />
localization <strong>of</strong> the area with faster BUT (
<strong>Evaluation</strong> <strong>of</strong> <strong>Corneal</strong> <strong>Shape</strong> <strong>and</strong> <strong>Biomechanics</strong> ’ 21<br />
Figure 9.<br />
<strong>Pentacam</strong> quality score display.<br />
’ Guidelines for the <strong>Evaluation</strong> <strong>of</strong> <strong>Corneal</strong> <strong>Shape</strong><br />
Appropriate interpretation <strong>of</strong> color-coded topographic <strong>and</strong> tomographic<br />
maps is a relatively complex task that may be difficult <strong>and</strong><br />
confusing for many clinicians. There are important considerations that<br />
should be taken for a correct interpretation <strong>of</strong> the data obtained from<br />
such examinations. The first critical point is that any map should be<br />
considered valid only if the raw data on which it is based is confirmed as<br />
reliable. For example, in Placido disc-based examinations, it is important<br />
to evaluate the videokeratoscope image, so that proper centration is<br />
evaluated along with the quality <strong>of</strong> the mires (Figs. 1,3, Fig. 5A). In some<br />
instruments, such as the <strong>Pentacam</strong>, a quality score was developed (Fig.<br />
9), so that the clinician can immediately determine, objectively, whether<br />
the examination is reliable.<br />
The clinician should also recognize the type <strong>of</strong> map that is evaluated<br />
along with the color-coded scale. The number <strong>of</strong> colors, the steps<br />
between each color, the highest <strong>and</strong> lowest colors, <strong>and</strong> the grading<br />
change between each color are the main characteristic to be considered.<br />
Normalized or variable scales adjust to each examined eye, which, in<br />
conjunction with a smaller step between each color, would increase the<br />
sensitivity for detecting irregularities. Absolute fixed scales <strong>of</strong>fer the<br />
advantage <strong>of</strong> st<strong>and</strong>ardizing color recognition for particular values. 49,50<br />
Thereby, this is critical that each examiner knowingly decides which<br />
www.internat-ophthalmology.com
22 ’ Ambrósio et al<br />
Figure 10.<br />
Ambrósio-2 color scale for pachymetric <strong>and</strong> curvature maps.<br />
www.internat-ophthalmology.com
<strong>Evaluation</strong> <strong>of</strong> <strong>Corneal</strong> <strong>Shape</strong> <strong>and</strong> <strong>Biomechanics</strong> ’ 23<br />
color-coded scale will be used so that proper interpretation will be<br />
facilitated.<br />
An absolute scale has been developed for curvature <strong>and</strong> pachymetric<br />
maps (Fig. 10). This scale, named ‘‘Ambrósio 2,’’ is available on the<br />
<strong>Pentacam</strong> s<strong>of</strong>tware. This scale should always be used with 61 colors <strong>and</strong><br />
absolute values, as the values obtained will be in accordance with studies<br />
comprising 226 normal corneas, 34 corneas with Fuchs endothelial<br />
dystrophy, <strong>and</strong> 88 keratoconic corneas (Ambrósio, Caiado, <strong>and</strong> Bonfadini,<br />
unpublished data 2009). For sagittal curvature maps, in a normal<br />
population, the average central keratometry (K) was 43.1 ± 1.43 D (SD)<br />
<strong>and</strong> the average for highest K (KMax) was 44.6 ± 3.4 D (SD). These<br />
values were included on the range <strong>of</strong> green to green-blue on the colorcoded<br />
scale. Interestingly, the best cut<strong>of</strong>f value for KMax in the receiver<br />
operating characteristic (ROC) curve was 47.9 D (sensitivity <strong>of</strong> 97.7%<br />
<strong>and</strong> specificity <strong>of</strong> 96.9%), so that 48 D was set for the orange to red<br />
transition. Considering thickness maps, mean thinnest point (TP) value<br />
in the normal population was approximately 550 mm <strong>and</strong> st<strong>and</strong>ard<br />
deviation (SD) <strong>of</strong> 30 mm. Then, the green color was centered on the 550<br />
<strong>and</strong> the shades <strong>of</strong> darker <strong>and</strong> lighter green were calculated to be within 1<br />
SD. The best cut<strong>of</strong>f value in the ROC curve for keratoconus <strong>and</strong> normals<br />
was around 500 mm (sensitivity <strong>of</strong> 87% <strong>and</strong> specificity <strong>of</strong> 90%), which<br />
was set for the yellow threshold. On the thicker side, mean TP value for<br />
Fuchs corneas <strong>and</strong> the best cut<strong>of</strong>f value in the ROC curve was 625 mm<br />
(sensitivity <strong>of</strong> 82% <strong>and</strong> specificity <strong>of</strong> 91%), which was set for the<br />
threshold <strong>of</strong> green to blue.<br />
Curvature Maps<br />
It is also critical that the examiner underst<strong>and</strong>s the fundamentals for<br />
the reconstruction <strong>of</strong> the maps. Many algorithms can be used for curvature,<br />
refractive, <strong>and</strong> power keratometric maps. Basically, there are 2 types <strong>of</strong><br />
maps that are commonly used in curvature maps that are relevant for<br />
ectasia screening: sagittal (or axial) maps <strong>and</strong> tangential (or instantaneous)<br />
maps.Insagittalmaps[Figs.1–3,Fig. 5A, Fig. 6A (left map), Fig. 7A (left<br />
map)], corneal curvature is determined at each measured points at a<br />
normal (90 degrees) angle to its surface, referenced to the mid line or<br />
measurement axis. Tangential maps evaluate the local radius <strong>of</strong> curvature<br />
at each measured point, which is more sensitive to detect irregularities [Fig.<br />
6A, Fig. 7A (right maps)]. Importantly, classic screening systems such as the<br />
Rabinowitz-McDonnell were developed based on axial maps. These indices<br />
are based on the steepness <strong>of</strong> the cornea (suspicious when higher than<br />
47.2 D), <strong>and</strong> superior-inferior asymmetry (suspicious when higher than<br />
1.4 D). 51 Topographic indices <strong>and</strong> artificial intelligence systems have been<br />
developed to facilitate clinical interpretation (Fig. 2A, Fig. 3, Fig. 5A), 52,53<br />
but this is very important for the clinician to underst<strong>and</strong> their basics <strong>and</strong><br />
www.internat-ophthalmology.com
24 ’ Ambrósio et al<br />
limitations <strong>and</strong> to be able to identify the normal curvature patterns 38 <strong>and</strong><br />
the ones described in ectatic diseases. 51,54–58<br />
Elevation Maps<br />
The first critical consideration for elevation maps is to underst<strong>and</strong><br />
that these maps represent the difference from the examined corneal<br />
surface (anterior or posterior) compared with a chosen reference body. 59<br />
Typically, the reference is calculated to have more coincident points (best<br />
fit) with the examined surface. Float <strong>and</strong> shift optimization functions are<br />
also used to improve the number <strong>of</strong> coincident points <strong>of</strong> the selected<br />
reference <strong>and</strong> the examined surface. Different areas <strong>of</strong> the examined<br />
corneal surface can be considered for the calculation, producing<br />
different best-fit references. For example, in a normal prolate cornea<br />
(steeper in the center <strong>and</strong> flatter in the periphery), if a larger area is<br />
considered for calculating the best-fit sphere (BFS), a flatter reference<br />
would be chosen, which would exaggerates elevation values (Fig. 11).<br />
For practical purposes, our preference for screening for ectasia is to fix<br />
to the 8 mm zone for calculating the BFS, as this zone is available for the<br />
majority <strong>of</strong> examined eyes. The shape <strong>and</strong> the values on elevation maps<br />
should be evaluated in conjunction. 59 The elevation values at the apex,<br />
at the TP, 60 <strong>and</strong> the maximum value above the BFS within the central<br />
area 61 can be used.<br />
Different geometric bodies can be used for serving as reference for<br />
the elevation map, such as spheres, ellipsoids, <strong>and</strong> toric ellipsoids. It<br />
is important that the examiner underst<strong>and</strong>s the impact <strong>of</strong> selecting<br />
different geometric bodies along with the zone diameter to calculate the<br />
Figure 11. Impact <strong>of</strong> the zone diameter for calculating the best-fit sphere (BFS) in a normal<br />
cornea. Note the normal pattern with the BFS for the 8-mm zone (A) <strong>and</strong> the protrusion appearance<br />
because <strong>of</strong> the flatter BFS (8.2 mm) with the 12-mm zone (B).<br />
www.internat-ophthalmology.com
<strong>Evaluation</strong> <strong>of</strong> <strong>Corneal</strong> <strong>Shape</strong> <strong>and</strong> <strong>Biomechanics</strong> ’ 25<br />
best fit. For example, the BFS allows for the identification <strong>of</strong> astigmatism,<br />
whereas the best-fit toric ellipsoid (BFTE) facilitates the evaluation <strong>of</strong><br />
higher order astigmatism. Interestingly, we found similar performances<br />
for the elevation values at the TP <strong>of</strong> the posterior surface using BFS <strong>and</strong><br />
BFTE (8-mm zone) in a study comprising 100 normal corneas (50<br />
patients) <strong>and</strong> 60 keratoconic corneas (30 patients). The best cut<strong>of</strong>f for<br />
the BFS was 19 mm with an area under the ROC (AUROC) <strong>of</strong> 0.98; for<br />
BFTE, the best cut<strong>of</strong>f was 12 with AUROC <strong>of</strong> 0.97 (Canedo, Louzada,<br />
Belin, <strong>and</strong> Ambrósio, unpublished data 2009).<br />
The Belin Intuitive Scale with 61 colors <strong>and</strong> 2.5 mm step (Fig. 12) has<br />
been found to be the most reliable for elevation maps. For example, in<br />
normal eyes, average elevation value at the TP using a floated BFS for<br />
8.0 mm is 3.6 ± 4.7 mm, 55,60 so that the yellow value <strong>of</strong> + 15 at the TP<br />
indicates this is suspicious <strong>and</strong> would occur in less than 1% <strong>of</strong> normal<br />
corneas.<br />
The ‘‘enhanced reference surface’’ concept was introduced by<br />
Michael W. Belin, MD. This approach was designed to highlight the<br />
ectatic area on the elevation map by excluding an area centered on the<br />
thinnest portion <strong>of</strong> the cornea from the BFS calculation. If the excluded<br />
area is more protruded, the resultant BFS would be flatter <strong>and</strong> the cone<br />
or ectatic region would be more pronounced. Different exclusion zone<br />
diameters <strong>and</strong> centers were tested in a preliminary study (Salomão,<br />
Ambrósio, Belin, unpublished data 2008). The most reliable enhanced<br />
reference was computed by determining the BFS for the 8.0-mm zone<br />
after excluding all the data from a 3.5-mm zone centered on the TP <strong>of</strong><br />
the cornea. The subtraction map <strong>of</strong> the st<strong>and</strong>ard BFS elevation from the<br />
‘‘enhanced elevation’’ detects <strong>and</strong> highlights the protrusion area <strong>and</strong> has<br />
been shown to be a key differentiator between normal <strong>and</strong> ectatic<br />
corneas. This approach is used for the anterior (front) <strong>and</strong> posterior<br />
(back) elevation. Normal population studies were carried out, serving as<br />
the basis for the ‘‘green-yellow-red’’ color thresholds that are encountered<br />
on the Belin-Ambrósio enhanced ectasia display (BAD) on the<br />
<strong>Pentacam</strong> s<strong>of</strong>tware.<br />
Thickness Maps<br />
<strong>Corneal</strong> tomography provides data for the reconstruction <strong>of</strong> the<br />
pachymetric map. Along with the determination <strong>of</strong> the true TP value<br />
<strong>and</strong> its location in relation to the center <strong>of</strong> the cornea, thickness<br />
distribution throughout the entire cornea can be characterized. We<br />
have previously developed <strong>and</strong> described the graphical concept <strong>of</strong> a<br />
corneal thickness spatial pr<strong>of</strong>ile (CTSP) <strong>and</strong> percentage thickness<br />
increase (PTI). 62–64 Starting from the TP outward, the CTSP describes<br />
the rate <strong>of</strong> increase <strong>of</strong> corneal thickness using the average <strong>of</strong> pachymetric<br />
values within annular rings concentric to the TP separated by 0.1 mm<br />
www.internat-ophthalmology.com
26 ’ Ambrósio et al<br />
Figure 12.<br />
Belin intuitive elevation scale.<br />
www.internat-ophthalmology.com
<strong>Evaluation</strong> <strong>of</strong> <strong>Corneal</strong> <strong>Shape</strong> <strong>and</strong> <strong>Biomechanics</strong> ’ 27<br />
steps. The PTI involves a similar measuring process centered on the TP,<br />
but it takes the percentage <strong>of</strong> thickness increase from the TP for the<br />
average along each ring. The <strong>Pentacam</strong> (Oculus GmbH) s<strong>of</strong>tware<br />
reports CTSP <strong>and</strong> PTI <strong>of</strong> the examined cornea in graphs along with<br />
the data <strong>of</strong> the mean <strong>and</strong> 2 st<strong>and</strong>ard deviations <strong>of</strong> a normal population<br />
(Fig. 13). From these data, pachymetric progression indexes (PPIs) are<br />
calculated for all hemimeridia over the entire 360 degrees <strong>of</strong> the cornea,<br />
starting from the TP. The average <strong>of</strong> all meridia is noted as the<br />
pachymetric progression average (PPI Ave) <strong>and</strong> the meridians with<br />
maximal (PPI Max) <strong>and</strong> minimal (PPI Min) pachymetric increase<br />
are noted along with their axes (Fig. 13, progression index box). In<br />
a normal population, the averages <strong>and</strong> SD <strong>of</strong> PPI <strong>of</strong> the minimal<br />
meridians, maximal meridians, <strong>and</strong> average <strong>of</strong> all meridians are<br />
0.58 ± 0.3, 0.85 ± 0.18, <strong>and</strong> 0.13 ± 0.33, respectively. The pachymetric<br />
index will be higher if the cornea gets thicker in a more accelerated<br />
pattern from the TP out to the periphery (PTI <strong>and</strong> CTSP graphs falling<br />
down).<br />
The best parameter for diagnosing keratoconus is the ‘‘relational’’<br />
thickness, which is the thinnest pachymetric value divided by the<br />
pachymetric progression. The‘‘Ambrósio relational thickness’’ (ART)<br />
may be calculated for the minimal (ART-Min), average (ART-Mid), <strong>and</strong><br />
Figure 13.<br />
thickness.<br />
<strong>Pentacam</strong> pachymetric display <strong>of</strong> a normal cornea with average central corneal<br />
www.internat-ophthalmology.com
28 ’ Ambrósio et al<br />
Figure 14. <strong>Corneal</strong> thickness spatial pr<strong>of</strong>ile <strong>and</strong> percentage thickness increase graphs <strong>of</strong> a normal<br />
thin cornea (A) <strong>and</strong> one with keratoconus with normal central thickness (B). Central corneal<br />
thickness <strong>and</strong> thinnest point for the normal thin cornea are 458 <strong>and</strong> 457 mm <strong>and</strong> for the keratoconic<br />
cornea, 536 <strong>and</strong> 545 mm. Ambrósio relational thickness maximal is 431 mm for the normal thin<br />
cornea <strong>and</strong> 245 mm <strong>of</strong> the keratoconic cornea.<br />
maximal values (ART-Max). The ART-Mid <strong>and</strong> ART-Max have AUROC<br />
<strong>of</strong> 0.98 <strong>and</strong> 0.99, with cut<strong>of</strong>fs <strong>of</strong> 426 <strong>and</strong> 339 mm, respectively, for<br />
diagnosing keratoconus (n = 88) from normals (n = 226) (Ambrósio,<br />
Guerra, Caiado, <strong>and</strong> Belin, unpublished data 2010). This approach<br />
enables the recognition <strong>of</strong> a normal thin cornea (Fig. 14A) <strong>and</strong> one with<br />
keratoconus with relatively normal CCT (Fig. 14B).<br />
The Belin-Ambrósio Enhanced Ectasia Display<br />
The BAD combines elevation-based <strong>and</strong> pachymetric evaluations in<br />
1 comprehensive display to give the clinician a global view <strong>of</strong> the<br />
tomographic structure <strong>of</strong> the cornea. Deviation <strong>of</strong> normality values were<br />
implemented for the front (df) <strong>and</strong> back (db) enhanced elevations, thinnest<br />
value (dt), pachymetric distribution (dp), <strong>and</strong> vertical displacement <strong>of</strong> the<br />
thinnest in relation to the apex (dy) (Figs. 5B, 6B, 7B). The ‘‘d’’ values are<br />
calculated so that a value <strong>of</strong> zero represents the average <strong>of</strong> the normal<br />
population <strong>and</strong> 1 represents the value is one st<strong>and</strong>ard deviation toward the<br />
disease (ectasia) value. A final ‘‘D’’ is calculated from a regression analysis<br />
that weights differently each parameter. Each parameter is indicated in<br />
yellow (suspicious) when it is Z1.6 SD from the mean <strong>and</strong> turns red<br />
(abnormal) at Z2.6 SD from the mean. Values below 1.6 SD are reported<br />
in white <strong>and</strong> are viewed as within the normal range.<br />
In a study comprising 25 patients with very asymmetric keratoconus,<br />
BAD was sensitive to detect abnormalities in 24 <strong>of</strong> 25 (94%) <strong>of</strong> the<br />
contralateral eyes with no keratoconus pattern detected by corneal<br />
topography (anterior curvature). The final D was the best parameter<br />
with a cut<strong>of</strong>f <strong>of</strong> 1.27, followed by ART-Max with a cut<strong>of</strong>f <strong>of</strong> 391 mm.<br />
www.internat-ophthalmology.com
<strong>Evaluation</strong> <strong>of</strong> <strong>Corneal</strong> <strong>Shape</strong> <strong>and</strong> <strong>Biomechanics</strong> ’ 29<br />
These values are in agreement with other cases with ectatic progression<br />
after LASIK despite no detectable risk factors.<br />
’ <strong>Corneal</strong> <strong>Biomechanics</strong><br />
The need for an advanced underst<strong>and</strong>ing <strong>of</strong> corneal biomechanical<br />
properties is further highlighted by cases <strong>of</strong> ectasia despite what are<br />
normal preoperative examinations. The relevance <strong>of</strong> corneal biomechanics<br />
for refractive surgery goes beyond ectasia prevention, however, as<br />
this variable also has the potential to improve outcomes in refractive<br />
surgery, 65 not to mention the ability to correctly evaluate IOP which is<br />
severely affected by corneal surgery. 66 The January, 2005 (Volume 31,<br />
Issue 1) special issue on corneal biomechanics <strong>of</strong> the Journal <strong>of</strong> Cataract<br />
<strong>and</strong> Refractive Surgery, guest edited by Dr Cynthia Roberts, PhD,<br />
introduced the concept <strong>of</strong> ‘‘Biomechanical customization’’ in refractive<br />
surgery. 67<br />
However, until the commercial introduction <strong>of</strong> the Ocular Response<br />
Analyzer 66 (ORA, Reichert Inc., Depew, NY) in the 2005 European<br />
Society <strong>of</strong> Cataract <strong>and</strong> Refractive Surgery meeting (Lisbon, Portugal),<br />
corneal biomechanical evaluations were limited to laboratory in vitro<br />
studies <strong>and</strong> to virtual mathematical corneal finite element models. 68,69<br />
The ORA is a noncontact tonometry, which was designed to provide a<br />
more accurate measurement <strong>of</strong> IOP through the underst<strong>and</strong>ing <strong>of</strong><br />
corneal properties. The ORA has a precisely metered collimated air<br />
pulse <strong>and</strong> a quantitative electro-optical system that monitors the<br />
deformation <strong>of</strong> the cornea through the corneal reflex <strong>of</strong> an infrared<br />
light. The measurement takes approximately 20 milliseconds. After<br />
autoalignment to corneal apex, the air puff starts. The air pump is<br />
controlled accordingly to the first applanation signal, when there is an<br />
internal comm<strong>and</strong> on the instrument for the air pump to shut <strong>of</strong>f so that<br />
the decrease phase is symmetric to the increase phase. The air pressure<br />
forces the cornea to deform inward, passing first applanation, when the<br />
pressure (P1) is registered. The cornea goes into a slight concavity until<br />
the air pump shuts <strong>of</strong>f so that the cornea will gradually recover to its<br />
normal configuration, passing through a second applanation (P2) state.<br />
The applanation events are registered by a peak on the corneal reflex<br />
signal (red curve, Fig. 15), so that two independent pressure values are<br />
registered. The pressure measurements (P1 <strong>and</strong> P2) serve as the basis<br />
for the variables reported by the original ORA s<strong>of</strong>tware (Table 1). The<br />
difference between the 2 pressures is called corneal hysteresis (CH),<br />
which was the new concept introduced to the Ophthalmic community. 70<br />
The term hysteresis is derived from the Greek word meaning ‘‘lagging<br />
behind’’ (http://en.wikipedia.org/wiki/Hysteresis). CH <strong>and</strong> corneal resistance<br />
factor (CRF) have a positive statistically significant relation with<br />
www.internat-ophthalmology.com
30 ’ Ambrósio et al<br />
Figure 15. Ocular response analyzer findings from the same case as in Figures 1 to 3. Note corneal<br />
resistance factor <strong>of</strong> 7.0 <strong>and</strong> 8.2 mm Hg in OD <strong>and</strong> OS, respectively.<br />
CCT (CH, r = 0.4655; CRF, r = 0.5760). 66,71 CH <strong>and</strong> CRF are also<br />
statistically lower in keratoconus (Table 1) 40,72,73 <strong>and</strong> also decreased after<br />
LASIK <strong>and</strong> surface ablation procedures. 74–77 No associations were found<br />
between CRF nor CH <strong>and</strong> simulated keratometry, anterior chamber<br />
depth or spherical equivalent refraction. 71 Paradoxically there is a<br />
negative correlation between CH <strong>and</strong> CRF <strong>and</strong> age, 71 while there is an<br />
expected considerable increase in the values <strong>of</strong> the modulus <strong>of</strong> elasticity<br />
<strong>and</strong> age accordingly to human corneal inflation studies. 78<br />
In a study comprising 226 normals <strong>and</strong> 88 keratoconic eyes, the ROC<br />
curves for CH <strong>and</strong> CRF found cut<strong>of</strong>fs <strong>of</strong> 9.4 mm Hg <strong>and</strong> 8.1 mm Hg,<br />
respectively. However, there is a significant overlap for the distribution<br />
<strong>of</strong> these metrics in normal cases <strong>and</strong> keratoconus cases. For CH, the<br />
sensitivity <strong>and</strong> specificity were 0.816 <strong>and</strong> 0.721, respectively, whereas for<br />
CRF the sensitivity <strong>and</strong> specificity were 0.79 <strong>and</strong> 0.854, respectively<br />
(Ambrósio, Fontes, Bonfadim, <strong>and</strong> Canedo, unpublished data 2009).<br />
www.internat-ophthalmology.com
<strong>Evaluation</strong> <strong>of</strong> <strong>Corneal</strong> <strong>Shape</strong> <strong>and</strong> <strong>Biomechanics</strong> ’ 31<br />
Table 1. Original Reichert Ocular Response Analyzer Parameters (Canedo, Bonfadin,<br />
Fontes, <strong>and</strong> Ambrósio, Unpublished Data 2009)<br />
Variables (all<br />
Measurements<br />
in mm Hg)<br />
‘‘Gold st<strong>and</strong>ard’’<br />
calibrated IOP<br />
<strong>Corneal</strong><br />
compensated IOP<br />
Formula<br />
Mean in<br />
Normal<br />
(n = 226) SD<br />
Mean in<br />
Keratoconus<br />
(n = 88) SD<br />
Mann-<br />
Whitney<br />
Test<br />
(P1+ P2)/2 14.82 3.56 11.20 6.41
32 ’ Ambrósio et al<br />
Figure 17. Advanced ocular response analyzer analysis <strong>of</strong> a mild keratoconus (same eye as in Fig.<br />
14B). Note the lower peaks in the waveform signal <strong>and</strong> the higher percentage <strong>of</strong> a keratoconic<br />
pattern.<br />
Figure 18. Dynamic Scheimpflug images taken from the CorVis ST <strong>of</strong> a normal eye. Note the<br />
complete visualization <strong>of</strong> the deformation process in relation to the time frame. Examination takes less<br />
than 20 min.<br />
www.internat-ophthalmology.com
<strong>Evaluation</strong> <strong>of</strong> <strong>Corneal</strong> <strong>Shape</strong> <strong>and</strong> <strong>Biomechanics</strong> ’ 33<br />
Interestingly, ‘‘gold st<strong>and</strong>ard’’ IOP but not corneal compensated IOP was<br />
found statistically different among keratoconus <strong>and</strong> normals (Table 1).<br />
In addition to the ‘‘classic’’ ORA parameters, CH <strong>and</strong> CRF, a new set<br />
<strong>of</strong> 36 new waveform-derived parameters were studied. These parameters<br />
are basically related to specific waveform characteristics, such as<br />
the width, peak, area, <strong>and</strong> height <strong>of</strong> the peaks (signal during applanation<br />
moments), <strong>and</strong> general morphology <strong>of</strong> the waveforms (Luce, unpublished<br />
data 2008). Interestingly, there are cases with the same CH <strong>and</strong><br />
highly different waveform signals <strong>and</strong> clinical characteristics. In fact,<br />
Kerautret <strong>and</strong> colleagues 79 reported a case <strong>of</strong> unilateral corneal ectasia<br />
after bilateral LASIK, in which CH <strong>and</strong> CRF were almost equal in both<br />
eyes while significant between-eye differences in the waveforms were<br />
Figure 19.<br />
CorVis ST display from a mild keratoconic cornea. Deformation amplitude is 1.15 mm<br />
www.internat-ophthalmology.com
34 ’ Ambrósio et al<br />
noted, most prominently in the lower amplitude <strong>of</strong> the applanation<br />
peaks in the ectatic eye. In fact, we have learned to adopt such subjective<br />
analysis when evaluating the ORA signals in daily clinics. However, it is<br />
critical to provide objective metrics from these new parameters. It was<br />
found that a combination <strong>of</strong> the most relevant waveform-derived<br />
parameters would provide a better performance on the ROC curve.<br />
The new ORA display includes a table with all indices that are displayed<br />
as the deviation from normality <strong>and</strong> the keratoconus percentage<br />
similarity score (Figs. 16, 17). This approach has the potential to increase<br />
specificity <strong>of</strong> identifying a normal biomechanical signal in a case with<br />
a topographic KCS finding (Fig. 16), <strong>and</strong> confirming abnormal biomechanics<br />
in a mild keratoconus (Fig. 17).<br />
Figure 20.<br />
CorVis ST display from a normal cornea. Deformation amplitude <strong>of</strong> 0.81 mm.<br />
www.internat-ophthalmology.com
<strong>Evaluation</strong> <strong>of</strong> <strong>Corneal</strong> <strong>Shape</strong> <strong>and</strong> <strong>Biomechanics</strong> ’ 35<br />
A new noncontact tonometry system integrated with an ultra-high<br />
speed Scheimpflug camera was introduced by Oculus in 2010. The<br />
CorVis ST (Scheimpflug Technology) takes 4330 frames/sec covering<br />
8 mm horizontally to monitor corneal response to a metered collimated<br />
air pulse with symmetrical configuration <strong>and</strong> fixed maximal internal<br />
pump pressure <strong>of</strong> 25 kPa. The addition <strong>of</strong> an ultra-high speed<br />
Scheimpflug camera allows dynamic inspection <strong>of</strong> the actual deformation<br />
process (Fig. 18), which has an enormous potential to provide<br />
further detailing for biomechanical characterization <strong>of</strong> the cornea <strong>and</strong><br />
correct IOP readings. Preliminary results have found a statistically<br />
significant difference among keratoconic corneas <strong>and</strong> normals for many<br />
parameters, such as corneal speed during deformation, corneal applanation<br />
length, <strong>and</strong> deformation amplitude (highest displacement <strong>of</strong> the<br />
apex in the highest concavity momentum), which are important<br />
measures <strong>of</strong> corneal viscoelastic properties <strong>and</strong> stiffness (Figs. 19, 20).<br />
Current studies are being conducted for testing the performance <strong>of</strong> such<br />
parameters for assessing ectasia susceptibility among refractive c<strong>and</strong>idates<br />
<strong>and</strong> to underst<strong>and</strong> the impact <strong>of</strong> IOP on corneal deformation.<br />
’ Conclusions<br />
Screening for ectasia risk among LASIK c<strong>and</strong>idates is one <strong>of</strong> the<br />
most important steps before LASIK. It is important to note that the goal<br />
is not only to identify cases with mild ectasia, but to characterize each<br />
cornea in terms <strong>of</strong> their risk or susceptibility to undergo biomechanical<br />
failure <strong>and</strong> ectasia. The st<strong>and</strong>ard screening criteria, based on corneal<br />
topography <strong>and</strong> CCT, has important limitations regarding sensitivity<br />
<strong>and</strong> specificity. 19 New technologies are needed <strong>and</strong> have already shown<br />
the potential for improving the sensitivity 46 <strong>and</strong> specificity 80 for<br />
detecting ectasia risk. However, there is still a need for retrospective<br />
case-control studies <strong>and</strong>, most importantly, prospective controlled<br />
studies which are being conducted.<br />
’ References<br />
1. Wilson SE, Ambrósio R. Computerized corneal topography <strong>and</strong> its importance to<br />
wavefront technology. Cornea. 2001;20:441–454.<br />
2. Belin MW, Khachikian SS, McGhee CN, et al. New technology in corneal imaging.<br />
Int Ophthalmol Clin. 2010;50:177–189.<br />
3. Seiler T, Quurke AW. Iatrogenic keratectasia after LASIK in a case <strong>of</strong> forme fruste<br />
keratoconus. J Cataract Refract Surg. 1998;24:1007–1009.<br />
4. Binder PS, Lindstrom RL, Stulting RD, et al. Keratoconus <strong>and</strong> corneal ectasia after<br />
LASIK. J Refract Surg. 2005;21:749–752.<br />
5. Dawson DG, R<strong>and</strong>leman JB, Grossniklaus HE, et al. <strong>Corneal</strong> ectasia after excimer<br />
laser keratorefractive surgery: histopathology, ultrastructure, <strong>and</strong> pathophysiology.<br />
Ophthalmology. 2008;115:2181–2191e1.<br />
www.internat-ophthalmology.com
36 ’ Ambrósio et al<br />
6. Vinciguerra P, Camesasca FI. Prevention <strong>of</strong> corneal ectasia in laser in situ<br />
keratomileusis. J Refract Surg. 2001;17(2 suppl):S187–S189.<br />
7. Ambrósio R Jr, Klyce SD, Wilson SE. <strong>Corneal</strong> topographic <strong>and</strong> pachymetric screening<br />
<strong>of</strong> keratorefractive patients. J Refract Surg. 2003;19:24–29.<br />
8. Oshika T, Klyce SD. <strong>Corneal</strong> topography in LASIK. Semin Ophthalmol. 1998;13:<br />
64–70.<br />
9. Ambrósio R Jr, Wilson SE. Complications <strong>of</strong> laser in situ keratomileusis: etiology,<br />
prevention, <strong>and</strong> treatment. J Refract Surg. 2001;17:350–379.<br />
10. R<strong>and</strong>leman JB, Woodward M, Lynn MJ, et al. Risk assessment for ectasia after corneal<br />
refractive surgery. Ophthalmology. 2008;115:37–50.<br />
11. R<strong>and</strong>leman JB, Trattler WB, Stulting RD. Validation <strong>of</strong> the ectasia risk score system for<br />
preoperative laser in situ keratomileusis screening. Am J Ophthalmol. 2008;145:813–818.<br />
12. Chan CC, Hodge C, Sutton G. External analysis <strong>of</strong> the R<strong>and</strong>leman ectasia risk factor<br />
score system: a review <strong>of</strong> 36 cases <strong>of</strong> post LASIK ectasia. Clin Experiment Ophthalmol.<br />
2010;38:335–340.<br />
13. Binder PS, Trattler WB. <strong>Evaluation</strong> <strong>of</strong> a risk factor scoring system for corneal ectasia<br />
after LASIK in eyes with normal topography. J Refract Surg. 2010;26:241–250.<br />
14. Duffey RJ, Hardten DR, Lindstrom RL, et al. Ectasia after refractive surgery.<br />
Ophthalmology. 2008;115:1849. [author reply 49–50].<br />
15. Klein SR, Epstein RJ, R<strong>and</strong>leman JB, et al. <strong>Corneal</strong> ectasia after laser in situ<br />
keratomileusis in patients without apparent preoperative risk factors. Cornea.<br />
2006;25:388–403.<br />
16. Amoils SP, Deist MB, Gous P, et al. Iatrogenic keratectasia after laser in situ<br />
keratomileusis for less than – 4.0 to – 7.0 diopters <strong>of</strong> myopia. J Cataract Refract Surg.<br />
2000;26:967--977.<br />
17. Ambrósio R Jr, Dawson DG, Salomão M, et al. <strong>Corneal</strong> ectasia after LASIK despite low<br />
preoperative risk: tomographic <strong>and</strong> biomechanical findings in the unoperated, stable,<br />
fellow eye. J Refract Surg. 2010;26:906–911.<br />
18. Tabbara KF, Kotb AA. Risk factors for corneal ectasia after LASIK. Ophthalmology.<br />
2006;113:1618–1622.<br />
19. Belin MW, Ambrósio R Jr. <strong>Corneal</strong> ectasia risk score: statistical validity <strong>and</strong> clinical<br />
relevance. J Refract Surg. 2010;26:238–240.<br />
20. R<strong>and</strong>leman JB, Russell B, Ward MA, et al. Risk factors <strong>and</strong> prognosis for corneal<br />
ectasia after LASIK. Ophthalmology. 2003;110:267–275.<br />
21. Condon PI. 2005 ESCRS Ridley Medal Lecture: will keratectasia be a major complication<br />
for LASIK in the long term?. J Cataract Refract Surg. 2006;32:2124–2132.<br />
22. Condon PI, O’Keefe M, Binder PS. Long-term results <strong>of</strong> laser in situ keratomileusis<br />
for high myopia: risk for ectasia. J Cataract Refract Surg 2007;33:583–590.<br />
23. Geggel HS, Talley AR. Delayed onset keratectasia following laser in situ keratomileusis.<br />
J Cataract Refract Surg. 1999;25:582–586.<br />
24. Probst LE, Machat JJ. Mathematics <strong>of</strong> laser in situ keratomileusis for high myopia.<br />
J Cataract Refract Surg. 1998;24:190–195.<br />
25. Ou RJ, Shaw EL, Glasgow BJ. Keratectasia after laser in situ keratomileusis (LASIK):<br />
evaluation <strong>of</strong> the calculated residual stromal bed thickness. Am J Ophthalmol.<br />
2002;134:771–773.<br />
26. Tuli SS, Iyer S. Delayed ectasia following LASIK with no risk factors: is a 300-microm<br />
stromal bed enough? J Refract Surg. 2007;23:620–622.<br />
27. Binder PS. Analysis <strong>of</strong> ectasia after laser in situ keratomileusis: risk factors. J Cataract<br />
Refract Surg. 2007;33:1530–1538.<br />
28. Kim H, Choi JS, Joo CK. <strong>Corneal</strong> ectasia after PRK: clinicopathologic case report.<br />
Cornea. 2006;25:845–848.<br />
29. R<strong>and</strong>leman JB, Stulting RD. Ectasia after photorefractive keratectomy. Ophthalmology.<br />
2007;114:396. [author reply 96–97].<br />
www.internat-ophthalmology.com
<strong>Evaluation</strong> <strong>of</strong> <strong>Corneal</strong> <strong>Shape</strong> <strong>and</strong> <strong>Biomechanics</strong> ’ 37<br />
30. Mohammadpour M. <strong>Corneal</strong> ectasia after LASIK in one eye <strong>and</strong> uneventful PRK in<br />
the fellow eye. J Cataract Refract Surg. 2007;33:1677. [author reply 77–78].<br />
31. Vinciguerra P, Munoz MI, Camesasca FI, et al. Long-term follow-up <strong>of</strong> ultrathin<br />
corneas after surface retreatment with phototherapeutic keratectomy. J Cataract<br />
Refract Surg. 2005;31:82–87.<br />
32. Wilson SE, Klyce SD. Advances in the analysis <strong>of</strong> corneal topography. Surv Ophthalmol.<br />
1991;35:269–277.<br />
33. Klyce SD. <strong>Corneal</strong> topography <strong>and</strong> the new wave. Cornea. 2000;19:723–729.<br />
34. Salomao MQ, Esposito A, Dupps WJ Jr. Advances in anterior segment imaging <strong>and</strong><br />
analysis. Curr Opin Ophthalmol. 2009;20:324–332.<br />
35. Maguire LJ, Bourne WM. <strong>Corneal</strong> topography <strong>of</strong> early keratoconus. Am J Ophthalmol.<br />
1989;108:107–112.<br />
36. Maeda N, Klyce SD, Tano Y. Detection <strong>and</strong> classification <strong>of</strong> mild irregular astigmatism<br />
in patients with good visual acuity. Surv Ophthalmol. 1998;43:53–58.<br />
37. Wilson SE, Lin DT, Klyce SD, et al. Topographic changes in contact lens-induced<br />
corneal warpage. Ophthalmology. 1990;97:734–744.<br />
38. Rabinowitz YS, Yang H, Brickman Y, et al. Videokeratography database <strong>of</strong> normal<br />
human corneas. Br J Ophthalmol. 1996;80:610–616.<br />
39. Klyce SD. Chasing the suspect: keratoconus. Br J Ophthalmol. 2009;93:845–847.<br />
40. Fontes BM, Ambrósio R Jr, Salomao M, et al. Biomechanical <strong>and</strong> tomographic analysis<br />
<strong>of</strong> unilateral keratoconus. J Refract Surg. 2010;26:677–681.<br />
41. Li X, Rabinowitz YS, Rasheed K, et al. Longitudinal study <strong>of</strong> the normal eyes in<br />
unilateral keratoconus patients. Ophthalmology. 2004;111:440–446.<br />
42. Saad A, Gatinel D. Topographic <strong>and</strong> tomographic properties <strong>of</strong> forme fruste<br />
keratoconus corneas. Invest Ophthalmol Vis Sci. 2010;51:5546–5555.<br />
43. Saad A, Lteif Y, Azan E, et al. Biomechanical properties <strong>of</strong> keratoconus suspect eyes.<br />
Invest Ophthalmol Vis Sci. 2010;51:2912–2916.<br />
44. Amsler M. The ‘‘forme fruste’’ <strong>of</strong> keratoconus. Wien Klin Wochenschr. 1961;73:842–843.<br />
45. Schweitzer C, Roberts CJ, Mahmoud AM, et al. Screening <strong>of</strong> forme fruste keratoconus<br />
with the ocular response analyzer. Invest Ophthalmol Vis Sci. 2010;51:2403–2410.<br />
46. Ambrósio R Jr, Dawson DG, Salomao M, et al. <strong>Corneal</strong> ectasia after LASIK despite low<br />
preoperative risk: tomographic <strong>and</strong> biomechanical findings in the unoperated, stable,<br />
fellow eye. J Refract Surg. 2010;26:906–911.<br />
47. Ambrósio R Jr, Belin MW. Imaging <strong>of</strong> the cornea: topography versus tomography.<br />
J Refract Surg. 2010;26:847–849.<br />
48. Ambrósio R Jr, Tervo T, Wilson SE. LASIK-associated dry eye <strong>and</strong> neurotrophic<br />
epitheliopathy: pathophysiology <strong>and</strong> strategies for prevention <strong>and</strong> treatment.<br />
J Refract Surg. 2008;24:396–407.<br />
49. Smolek MK, Klyce SD, Hovis JK. The Universal St<strong>and</strong>ard Scale: proposed<br />
improvements to the American National St<strong>and</strong>ards Institute (ANSI) scale for corneal<br />
topography. Ophthalmology. 2002;109:361–369.<br />
50. Wilson SE, Klyce SD, Husseini ZM. St<strong>and</strong>ardized color-coded maps for corneal<br />
topography. Ophthalmology. 1993;100:1723–1727.<br />
51. Rabinowitz YS, McDonnell PJ. Computer-assisted corneal topography in keratoconus.<br />
Refract <strong>Corneal</strong> Surg. 1989;5:400–408.<br />
52. Rabinowitz YS, Rasheed K. KISA% index: a quantitative videokeratography<br />
algorithm embodying minimal topographic criteria for diagnosing keratoconus.<br />
J Cataract Refract Surg. 1999;25:1327–1335.<br />
53. Klyce SD, Karon MD, Smolek MK. Screening patients with the corneal navigator.<br />
J Refract Surg. 2005;21(5 suppl):S617–S622.<br />
54. Maeda N, Klyce SD, Smolek MK, et al. Automated keratoconus screening with<br />
corneal topography analysis. Invest Ophthalmol Vis Sci. 1994;35:2749–2757.<br />
www.internat-ophthalmology.com
38 ’ Ambrósio et al<br />
55. Abad JC, Rubinfeld RS, Del Valle M, et al. Vertical D: a novel topographic pattern in<br />
some keratoconus suspects. Ophthalmology. 2007;114:1020–1026.<br />
56. Lee BW, Jurkunas UV, Harissi-Dagher M, et al. Ectatic disorders associated<br />
with a claw-shaped pattern on corneal topography. Am J Ophthalmol. 2007;144:<br />
154–156.<br />
57. Holladay JT. Keratoconus detection using corneal topography. J Refract Surg.<br />
2009;25(10 suppl):S958–S962.<br />
58. Li X, Yang H, Rabinowitz YS. Keratoconus: classification scheme based on<br />
videokeratography <strong>and</strong> clinical signs. J Cataract Refract Surg. 2009;35:1597–1603.<br />
59. Belin MW, Khachikian SS. An introduction to underst<strong>and</strong>ing elevation-based<br />
topography: how elevation data are displayed-a review. Clin Experiment Ophthalmol.<br />
2009;37:14–29.<br />
60. Khachikian SS, Belin MW. Posterior elevation in keratoconus. Ophthalmology.<br />
2009;116:816. [16 e1 author reply 16–17].<br />
61. De Sanctis U, Loiacono C, Richiardi L, et al. Sensitivity <strong>and</strong> specificity <strong>of</strong> posterior<br />
corneal elevation measured by <strong>Pentacam</strong> in discriminating keratoconus/subclinical<br />
keratoconus. Ophthalmology. 2008;115:1534–1539.<br />
62. Ambrósio R Jr. Percentage thickness increase <strong>and</strong> absolute difference from<br />
thinnest to describe thickness pr<strong>of</strong>ile. J Refract Surg. 2010;26:84–86. [author reply<br />
86–87].<br />
63. Ambrósio R Jr, Alonso RS, Luz A, et al. <strong>Corneal</strong>-thickness spatial pr<strong>of</strong>ile <strong>and</strong> cornealvolume<br />
distribution: tomographic indices to detect keratoconus. J Cataract Refract<br />
Surg 2006;32:1851–1859.<br />
64. Luz A, Ursulio M, Castaneda D, et al. <strong>Corneal</strong> thickness progression from the thinnest<br />
point to the limbus: study based on a normal <strong>and</strong> a keratoconus population to create<br />
reference values. Arq Bras Oftalmol. 2006;69:579–583.<br />
65. Roberts C. The cornea is not a piece <strong>of</strong> plastic. J Refract Surg. 2000;16:407–413.<br />
66. Luce DA. Determining in vivo biomechanical properties <strong>of</strong> the cornea with an ocular<br />
response analyzer. J Cataract Refract Surg. 2005;31:156–162.<br />
67. Roberts C. Biomechanical customization: the next generation <strong>of</strong> laser refractive<br />
surgery. J Cataract Refract Surg. 2005;31:2–5.<br />
68. Dupps WJ Jr, Wilson SE. <strong>Biomechanics</strong> <strong>and</strong> wound healing in the cornea. Exp Eye Res.<br />
2006;83:709–720.<br />
69. Dupps WJ Jr. Biomechanical modeling <strong>of</strong> corneal ectasia. J Refract Surg. 2005;21:<br />
186–190.<br />
70. Dupps WJ Jr. Hysteresis: new mechanospeak for the ophthalmologist. J Cataract<br />
Refract Surg. 2007;33:1499–1501.<br />
71. Fontes BM, Ambrósio R Jr, Alonso RS, et al. <strong>Corneal</strong> biomechanical metrics in eyes<br />
with refraction <strong>of</strong> – 19.00 to + 9.00 D in healthy Brazilian patients. J Refract Surg.<br />
2008;24:941--945.<br />
72. Fontes BM, Ambrósio R Jr, Jardim D, et al. <strong>Corneal</strong> biomechanical metrics<br />
<strong>and</strong> anterior segment parameters in mild keratoconus. Ophthalmology. 2010;117:<br />
673–679.<br />
73. Shah S, Laiquzzaman M, Bhojwani R, et al. Assessment <strong>of</strong> the biomechanical<br />
properties <strong>of</strong> the cornea with the ocular response analyzer in normal <strong>and</strong> keratoconic<br />
eyes. Invest Ophthalmol Vis Sci. 2007;48:3026–3031.<br />
74. Pepose JS, Feigenbaum SK, Qazi MA, et al. Changes in corneal biomechanics <strong>and</strong><br />
intraocular pressure following LASIK using static, dynamic, <strong>and</strong> noncontact tonometry.<br />
Am J Ophthalmol. 2007;143:39–47.<br />
75. Ortiz D, Pinero D, Shabayek MH, et al. <strong>Corneal</strong> biomechanical properties in normal,<br />
post-laser in situ keratomileusis, <strong>and</strong> keratoconic eyes. J Cataract Refract Surg.<br />
2007;33:1371–1375.<br />
www.internat-ophthalmology.com
<strong>Evaluation</strong> <strong>of</strong> <strong>Corneal</strong> <strong>Shape</strong> <strong>and</strong> <strong>Biomechanics</strong> ’ 39<br />
76. Shah S, Laiquzzaman M, Yeung I, et al. The use <strong>of</strong> the ocular response analyser to<br />
determine corneal hysteresis in eyes before <strong>and</strong> after excimer laser refractive surgery.<br />
Cont Lens Anterior Eye. 2009;32:123–128.<br />
77. Shah S, Laiquzzaman M. Comparison <strong>of</strong> corneal biomechanics in pre <strong>and</strong> postrefractive<br />
surgery <strong>and</strong> keratoconic eyes by ocular response analyser. Cont Lens Anterior<br />
Eye. 2009;32:129–132. [quiz 51].<br />
78. Elsheikh A, Wang D, Pye D. Determination <strong>of</strong> the modulus <strong>of</strong> elasticity <strong>of</strong> the human<br />
cornea. J Refract Surg. 2007;23:808–818.<br />
79. Kerautret J, Colin J, Touboul D, et al. Biomechanical characteristics <strong>of</strong> the ectatic<br />
cornea. J Cataract Refract Surg. 2008;34:510–513.<br />
80. Reinstein DZ, Archer TJ, Gobbe M. Stability <strong>of</strong> LASIK in topographically suspect<br />
keratoconus confirmed non-keratoconic by Artemis VHF digital ultrasound epithelial<br />
thickness mapping: 1-year follow-up. J Refract Surg. 2009;25:569–577.<br />
www.internat-ophthalmology.com


![Topography and Scheimpflug Imaging [112 KB] - Oculus](https://img.yumpu.com/22885820/1/190x255/topography-and-scheimpflug-imaging-112-kb-oculus.jpg?quality=85)