Conclusion Get more connected.
Conclusion Get more connected.
Conclusion Get more connected.

You also want an ePaper? Increase the reach of your titles
YUMPU automatically turns print PDFs into web optimized ePapers that Google loves.
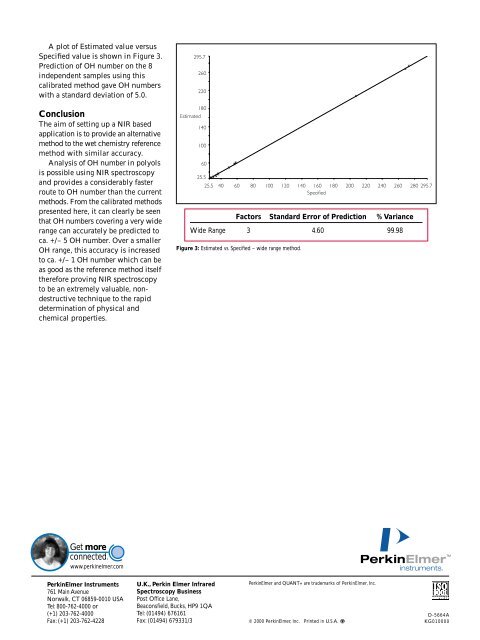
A plot of Estimated value versus<br />
Specified value is shown in Figure 3.<br />
Prediction of OH number on the 8<br />
independent samples using this<br />
calibrated method gave OH numbers<br />
with a standard deviation of 5.0.<br />
<strong>Conclusion</strong><br />
The aim of setting up a NIR based<br />
application is to provide an alternative<br />
method to the wet chemistry reference<br />
method with similar accuracy.<br />
Analysis of OH number in polyols<br />
is possible using NIR spectroscopy<br />
and provides a considerably faster<br />
route to OH number than the current<br />
methods. From the calibrated methods<br />
presented here, it can clearly be seen<br />
that OH numbers covering a very wide<br />
range can accurately be predicted to<br />
ca. +/– 5 OH number. Over a smaller<br />
OH range, this accuracy is increased<br />
to ca. +/– 1 OH number which can be<br />
as good as the reference method itself<br />
therefore proving NIR spectroscopy<br />
to be an extremely valuable, nondestructive<br />
technique to the rapid<br />
determination of physical and<br />
chemical properties.<br />
Factors Standard Error of Prediction % Variance<br />
Wide Range 3 4.60 99.98<br />
Figure 3: Estimated vs. Specified – wide range method.<br />
<strong>Get</strong> <strong>more</strong><br />
<strong>connected</strong>.<br />
www.perkinelmer.com<br />
PerkinElmer Instruments<br />
761 Main Avenue<br />
Norwalk, CT 06859-0010 USA<br />
Tel: 800-762-4000 or<br />
(+1) 203-762-4000<br />
Fax: (+1) 203-762-4228<br />
U.K., Perkin Elmer Infrared<br />
PerkinElmer and QUANT+ are trademarks of PerkinElmer, Inc.<br />
Spectroscopy Business<br />
Post Office Lane,<br />
Beaconsfield, Bucks, HP9 1QA<br />
Tel: (01494) 676161<br />
Fax: (01494) 679331/3 © 2000 PerkinElmer, Inc. Printed in U.S.A.<br />
D-5664A<br />
KG010000
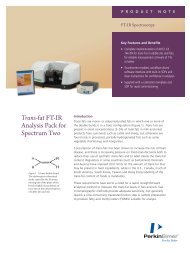
FT-NIR SPECTROSCOPY<br />
application note<br />
The Determination of OH Number in<br />
Polyols Using FT-NIR Spectroscopy<br />
Summary<br />
NIR spectroscopy is an invaluable tool<br />
for the quantitative analysis of a wide<br />
range of chemical compounds. In<br />
combination with a number of<br />
chemometric methods, the technique<br />
provides a fast, non-destructive route<br />
to the determination of physical and<br />
chemical properties.<br />
This note describes the use of<br />
FT-NIR spectroscopy in a typical<br />
polyol analysis with an outline of<br />
the development of the quantitative<br />
method used for the application.<br />
Introduction<br />
Polyols are long-chain polymers<br />
which contain alcohol functional<br />
groups and are produced via<br />
reactions involving organic oxides,<br />
acids and multi-functional alcohols.<br />
A wide range of products<br />
including, surfactants, foams, paint<br />
additives, and adhesives are<br />
manufactured using polyols. The<br />
production of polyurethanes, for<br />
instance, involves polyol<br />
intermediates.<br />
Polyol products are typically<br />
produced via batch reactor processes<br />
held at high temperatures (>250˚C).<br />
Current analysis of the polyols<br />
produced normally take the form of<br />
back titrations. The resultant OH<br />
number is an average value over a<br />
number of titrations.<br />
This analysis generally takes<br />
place in an off-site laboratory, often<br />
far removed from the conditions<br />
present at the production site. The<br />
sample is extracted from the bulk,<br />
and the production process halted<br />
while the analysis is completed; a<br />
process that can take several hours.<br />
Care must be taken in handling the<br />
chemicals involved, especially when<br />
analyzing samples at elevated<br />
temperatures. The possibility of<br />
moisture being absorbed from the air<br />
is highly detrimental to the analysis<br />
of the OH value. A system whereby<br />
the sample must be heated is applied<br />
if the sample is a solid or highly<br />
viscous liquid. Even when all these<br />
factors have been minimized or<br />
taken into account, the process still<br />
depends on the analyst. The current<br />
method for determining OH number<br />
is expensive, time consuming, and<br />
prone to human error.<br />
A typical NIR based application<br />
is faster, <strong>more</strong> precise and reliable<br />
than other methods. It also reduces<br />
the need to handle potentially<br />
hazardous substances. The bands in<br />
the NIR region (ca. 15000 – 3000<br />
cm-1, 667 – 3333 nm) are primarily<br />
overtones and combination bands<br />
normally associated with C-H, N-H<br />
and O-H bonds. Since organic<br />
polymers are composed of carbon,<br />
hydrogen, nitrogen and oxygen<br />
atoms, the NIR spectra of polymers<br />
feature sharp, strong absorbance<br />
bands.<br />
Polymer manufacturers can use<br />
NIR spectroscopy to perform<br />
analyses on the production site.<br />
This has obvious advantages in the<br />
area of quality assurance. NIR<br />
analysis is also capable of process<br />
control as the analysis of<br />
intermediates occurs in real-time.<br />
Since many polyol reactions are<br />
irreversible, the analysis of such<br />
intermediates by NIR spectroscopy<br />
provides a commercially valuable<br />
tool.<br />
A typical NIR method<br />
development for OH determination<br />
consists of first assembling a set of<br />
preanalyzed samples which must<br />
span the OH range for which the<br />
calibration is intended. The number<br />
of samples used depends on the OH<br />
range and accuracy required, but for<br />
most applications in the range ca.<br />
20 – 200 OH approximately 20<br />
samples are adequate for calibration.
Once a set of reference samples is<br />
obtained, it is advisable to divide these<br />
into two sets; a set for calibration, and<br />
a set to test the calibration often<br />
referred to as the validation set. The<br />
suitability of the samples used in the<br />
calibration set is particularly important<br />
since it must closely match the<br />
product being manufactured at the<br />
production site. A calibration set must<br />
contain enough samples to enable the<br />
estimation of the calibration constants,<br />
and the range of the samples should<br />
be representative of the range of<br />
future samples.<br />
A calibration, based on ‘ideal’<br />
samples prepared in a completely<br />
stable environment, may give very<br />
small errors when used for similar<br />
samples. However, when the<br />
calibration is used to produce a value<br />
for a real product, the accuracy is<br />
often degraded. Further<strong>more</strong>, a tradeoff<br />
exists between calibration sets<br />
covering a very wide range of OH<br />
number and the accuracy with which<br />
OH number can be predicted.<br />
Therefore, it has been found that the<br />
accuracy increases when using a<br />
method calibrated over a <strong>more</strong><br />
restricted (ca. 50) OH range.<br />
The PLS (Partial Least Squares)<br />
method available in the Perkin-Elmer<br />
QUANT+ TM software uses the NIR<br />
spectra recorded to derive a<br />
calibration. This equation is then<br />
used to predict the value of the<br />
constituent of interest of future<br />
samples using their NIR spectra. An<br />
application that is analyzed by using<br />
spectroscopy is <strong>more</strong> precise than<br />
when measured by other methods.<br />
However, the accuracy of the method<br />
in predicting the true value of the<br />
future samples is dependant upon<br />
the accuracy of the reference method.<br />
It is therefore important to stress<br />
that the steps involved in setting up<br />
the calibration are crucial to the<br />
success of the NIR application. This<br />
is particularly true for the collection<br />
of suitable calibration standards,<br />
and the analysis of the calibration<br />
set by titration. This step should be<br />
carried out with an objective of<br />
producing the greatest possible<br />
accuracy.<br />
A suggestion for achieving this<br />
accuracy is to perform the titration<br />
in duplicate or triplicate. However,<br />
it is <strong>more</strong> important to have as many<br />
samples in the calibration set as<br />
possible. In comparison, it is better<br />
to collect twice as many calibration<br />
samples than it is to perform the<br />
reference analysis of the original<br />
calibration standards in duplicate.<br />
The most ideal, though costly and<br />
time consuming, situation would<br />
allow for the inclusion of a large set<br />
of calibration standards, with each<br />
sample analyzed in duplicate or<br />
triplicate.<br />
QUANT+ software was used to<br />
derive a calibration matrix between<br />
the calibration spectra and their<br />
Figure 1: Extremes of calibration set.<br />
reference OH values. The technique<br />
of PLS extracts those spectral<br />
contributions which are correlated<br />
with OH value, and eliminates the<br />
need to select specific wavelengths<br />
for the calibration.<br />
As previously stated, the near<br />
infrared region consists of many<br />
overlapping bands that contain<br />
overtone and combination bands<br />
involving the absorptions of mainly<br />
OH, NH and CH bonds. The bands<br />
of interest in the determination of<br />
OH value are due to the OH first<br />
overtone at 7150 – 6670 cm-1<br />
(1399 – 1499 nm), the OH<br />
combination bands of 5260 – 4760<br />
cm-1 (1900 – 2100 nm), and<br />
moisture content changes: ~5155<br />
cm-1 (1940 nm).<br />
Experimental<br />
Fourteen standards of known OH<br />
value were supplied to serve as a<br />
calibration set. A further eight<br />
samples were also supplied to act as<br />
an independent validation set. These<br />
were used to compare the reference<br />
values with those values predicted by<br />
the calibration equation. All samples<br />
had been analyzed previously in<br />
triplicate by the reference ‘wet’<br />
chemistry method (titration).<br />
The infrared spectra of all samples<br />
were recorded on a PerkinElmer<br />
FT-NIR Spectrometer. The samples<br />
were scanned in an NIR quartz<br />
transmission cell through a range<br />
of 10000 – 4000 cm -1 at a resolution<br />
of 8 cm -1 and strong apodization.<br />
All spectra were recorded in ratio<br />
mode using the shuttle accessory.<br />
The shuttle automatically collects<br />
alternate background and sample<br />
scans to eliminate the effects of<br />
water vapor in the air. A pathlength<br />
of 5 mm was considered to provide<br />
useful absorbance values. The<br />
cuvettes were cleaned with acetone<br />
and dried before refilling with the<br />
next sample.<br />
Two calibrated methods were<br />
built using the reference data and<br />
the spectra collected from the<br />
FT-NIR Spectrometer. These were<br />
setup using the QUANT+ software.<br />
Both methods used the range 9000 –<br />
4528 cm -1 with an upper threshold of<br />
1.5 A. The offset option was<br />
employed to minimize baseline drift
effects. The number of factors was<br />
set between 2 and 6. The validation<br />
option was set to Full Cross<br />
Validation (see later), and the Expert<br />
Assist (see later) was selected for the<br />
calibration. The first method was built<br />
using the full range (20 – 270 OH<br />
number) of samples. However, the<br />
second method was built covering a<br />
much smaller range of OH number<br />
(25 – 60). The second method was<br />
able to predict <strong>more</strong> accurately<br />
values within its low OH range. The<br />
first method however, was able to<br />
predict values better for the samples<br />
lying higher in the range, but was not<br />
as accurate for the mid-range values.<br />
Results and discussion<br />
The absorbance spectra for the<br />
polyol standards and the unknowns<br />
were collected and two examples,<br />
representing extremes of OH number,<br />
are shown in Figure 1. The spectral<br />
variations at approximately 7200 –<br />
6670 and 5300 – 4760 cm -1 (1389 –<br />
1499 and 1887 – 2100 nm) clearly<br />
show differing OH number, and<br />
correspond to polymeric O-H first<br />
overtone and O-H combination bands<br />
respectively. Temperature variation is<br />
important to consider in the analysis<br />
of polyols and other NIR applications.<br />
This application did not require<br />
temperature control, and heating<br />
was not necessary as all the samples<br />
were liquid at room temperature.<br />
However, care was taken to ensure<br />
that the sample temperatures were<br />
allowed to equilibrate and the<br />
samples were left in the beam for the<br />
same length of time before each<br />
measurement was made.<br />
The QUANT+ software is capable<br />
of modeling the concentrations in<br />
terms of the spectral contributions<br />
relevant to OH determination. This<br />
algorithm can extract the factors in<br />
the calibration that are not responsible<br />
for the specific OH value (the<br />
chemical constituent of interest)<br />
by eliminating the corresponding<br />
dimensions (spectral absorptions)<br />
from the model.<br />
The error present in an OH<br />
evaluation due to hydroxyl band of<br />
moisture absorbed in the sample can<br />
then therefore be minimized by<br />
Factors Standard Error of Prediction % Variance<br />
Limited Range 2 0.91 99.86<br />
Figure 2: Estimated vs. Specified – limited range method.<br />
digitally separating the different OH<br />
bands using this feature of the<br />
software. The calibration equation is<br />
modeled to exclude irrelevant bands<br />
from the analysis, and minimize the<br />
error in the prediction results.<br />
The Full Cross Validation feature<br />
used in this application further<br />
improves the reliability of results.<br />
The software drops one sample from<br />
the calibration set and performs an<br />
entire calibration with the remaining<br />
samples, then makes a prediction for<br />
the sample left. In normal<br />
applications the sample being<br />
predicted is not present in the<br />
calibration set, this gives a <strong>more</strong><br />
realistic if less accurate result. The<br />
Expert Assist option in the software<br />
makes intelligent decisions<br />
regarding the spectra in the<br />
calibration set. The Expert will<br />
decide whether to reject any spectra<br />
or specific regions of spectra in the<br />
calibration set, or disregard any<br />
property values on the basis of a set<br />
of rules developed for IR quantitative<br />
analysis. It will also identify any<br />
outliers in the set. Once these<br />
decisions have been made to exclude<br />
some data in the set, the software<br />
will decide whether or not the<br />
calibration needs to be repeated.<br />
The procedure continues iteratively<br />
until all the rules are satisfied.<br />
The method built over the narrow<br />
range of OH number was used to<br />
predict the samples of OH value<br />
ranging from 20 to 50. The error<br />
estimates are considerably better<br />
than the results obtained using the<br />
full calibration set. By looking at the<br />
results tabulated in the table in Figure<br />
2, 99.86 % of the data can be<br />
explained using 2 factors with a<br />
standard estimate of prediction (SEP)<br />
of 0.91 OH number. Figure 2 illustrates<br />
the accuracy of the method in the<br />
form of an Estimated value versus<br />
Specified value plot. Prediction of<br />
OH number on the 8 independent<br />
samples using this calibrated method<br />
gave OH numbers that were found to<br />
lie within ca. +/– 1 OH number of<br />
the value obtained from the<br />
reference method (titration).<br />
The full range method uses a larger<br />
calibration set to predict OH number<br />
over a much wider range (20 – 275).<br />
The values recorded in the table in<br />
Figure 3 show that in this method,<br />
99.98% of the data can be explained<br />
using three factors in this analysis.<br />
The SEP is much larger in this<br />
method (4.60 OH number) and was<br />
found to be better at predicting<br />
OH number of the higher valued<br />
unknowns.