Determination of Cell Cycle Phase using the Operetta - PerkinElmer
Determination of Cell Cycle Phase using the Operetta - PerkinElmer
Determination of Cell Cycle Phase using the Operetta - PerkinElmer

You also want an ePaper? Increase the reach of your titles
YUMPU automatically turns print PDFs into web optimized ePapers that Google loves.
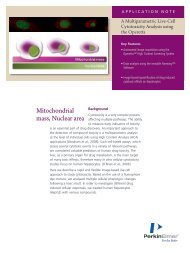
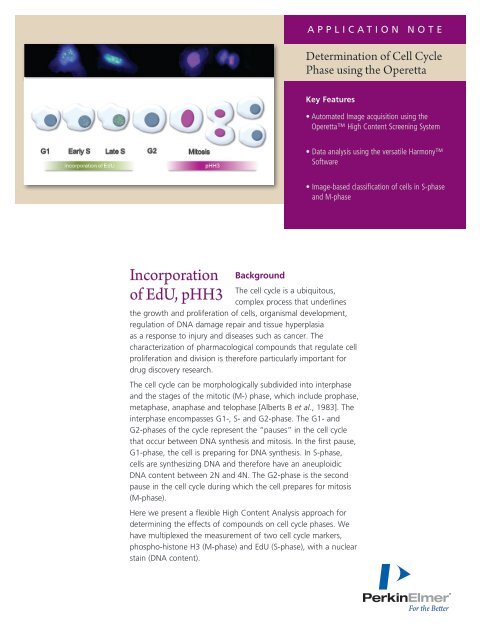
application Note<br />
<strong>Determination</strong> <strong>of</strong> <strong>Cell</strong> <strong>Cycle</strong><br />
<strong>Phase</strong> <strong>using</strong> <strong>the</strong> <strong>Operetta</strong><br />
Key Features<br />
• Automated Image acquisition <strong>using</strong> <strong>the</strong><br />
<strong>Operetta</strong> High Content Screening System<br />
• Data analysis <strong>using</strong> <strong>the</strong> versatile Harmony<br />
S<strong>of</strong>tware<br />
• Image-based classification <strong>of</strong> cells in S-phase<br />
and M-phase<br />
Incorporation<br />
<strong>of</strong> EdU, pHH3<br />
Background<br />
The cell cycle is a ubiquitous,<br />
complex process that underlines<br />
<strong>the</strong> growth and proliferation <strong>of</strong> cells, organismal development,<br />
regulation <strong>of</strong> DNA damage repair and tissue hyperplasia<br />
as a response to injury and diseases such as cancer. The<br />
characterization <strong>of</strong> pharmacological compounds that regulate cell<br />
proliferation and division is <strong>the</strong>refore particularly important for<br />
drug discovery research.<br />
The cell cycle can be morphologically subdivided into interphase<br />
and <strong>the</strong> stages <strong>of</strong> <strong>the</strong> mitotic (M-) phase, which include prophase,<br />
metaphase, anaphase and telophase [Alberts B et al., 1983]. The<br />
interphase encompasses G1-, S- and G2-phase. The G1- and<br />
G2-phases <strong>of</strong> <strong>the</strong> cycle represent <strong>the</strong> “pauses” in <strong>the</strong> cell cycle<br />
that occur between DNA syn<strong>the</strong>sis and mitosis. In <strong>the</strong> first pause,<br />
G1-phase, <strong>the</strong> cell is preparing for DNA syn<strong>the</strong>sis. In S-phase,<br />
cells are syn<strong>the</strong>sizing DNA and <strong>the</strong>refore have an aneuploidic<br />
DNA content between 2N and 4N. The G2-phase is <strong>the</strong> second<br />
pause in <strong>the</strong> cell cycle during which <strong>the</strong> cell prepares for mitosis<br />
(M-phase).<br />
Here we present a flexible High Content Analysis approach for<br />
determining <strong>the</strong> effects <strong>of</strong> compounds on cell cycle phases. We<br />
have multiplexed <strong>the</strong> measurement <strong>of</strong> two cell cycle markers,<br />
phospho-histone H3 (M-phase) and EdU (S-phase), with a nuclear<br />
stain (DNA content).
Application<br />
In this application we present a simple, image-based, validated<br />
and ready-to-use strategy for <strong>the</strong> characterisation <strong>of</strong><br />
compounds which modulate <strong>the</strong> cell cycle. HeLa (human<br />
cervix carcinoma) cells were seeded at a density <strong>of</strong> 2500 cells<br />
per well into a 384 <strong>Cell</strong>Carrier microtiter plate, and were<br />
cultured over night. After an 18 h incubation with various<br />
concentrations <strong>of</strong> Thymidine 1 and Nocodazole 2 cells were<br />
fixed with 3.7 % formaldehyde. The DNA content was<br />
calculated by staining nuclei with Hoechst 33342. The<br />
compound induced inhibition <strong>of</strong> cell proliferation could be<br />
followed <strong>using</strong> <strong>the</strong> Click-iT EdU Alexa Fluor® 488 Kit.<br />
Fur<strong>the</strong>rmore, a specific M-phase marker, pHH3, was used in<br />
combination with <strong>the</strong> Alexa Fluor® 647 antibody. Images were<br />
recorded on <strong>the</strong> <strong>Operetta</strong> <strong>using</strong> <strong>the</strong> 20x LWD objective and<br />
were analyzed with <strong>the</strong> Harmony “<strong>Cell</strong> <strong>Cycle</strong>-1” module<br />
selected from <strong>the</strong> Ready-Made Solution collection.<br />
In order to classify cells according to <strong>the</strong>ir DNA content, we<br />
calculated <strong>the</strong> integrated fluorescent intensity <strong>of</strong> <strong>the</strong> nuclear<br />
stain. <strong>Cell</strong>s passing a defined intensity threshold, for example<br />
2 x 10 6 represent cells in mid S-phase and G2/M-phase<br />
(yellow labeled cells, Figure 1 A). Using a similar approach,<br />
we sorted cells, treated with different compounds, into three<br />
subpopulations: 2N (G1-phase), 2N - 4N (S-phase), and 4N<br />
(G2-/M-phase) (Figure 1 B).<br />
For fur<strong>the</strong>r verification <strong>of</strong> two cell populations, <strong>the</strong> mitotic<br />
cells and <strong>the</strong> S-phase cells, we introduced cell cycle specific<br />
markers into <strong>the</strong> assay. For fine discrimination <strong>of</strong> compound<br />
effects on <strong>the</strong> cell cycle, <strong>the</strong> use <strong>of</strong> EdU and pHH3 labeling<br />
allowed us to evaluate <strong>the</strong> proliferation and mitotic indices,<br />
respectively (Figure 2 A).<br />
Fur<strong>the</strong>rmore, we calculated EC 50<br />
values for Thymidine (G1/S<br />
arrest) and Nocodazole (G2/M arrest) treatments <strong>using</strong><br />
numerical data from <strong>the</strong> Harmony s<strong>of</strong>tware (Figure 2 B).<br />
A<br />
Nuclei detection<br />
Control<br />
30 μM Thymidine<br />
1 μM Nocodazole<br />
Select population<br />
<strong>of</strong> nuclei with high<br />
DNA content<br />
B<br />
Control 30 μM Thymidine 1 μM Nocodazole<br />
Figure 1. Image analysis strategy used to classify cells according <strong>the</strong>ir DNA content, <strong>using</strong> a nuclear stain only.<br />
A | Top | Hoechst stained nuclei after an 18 h incubation with ei<strong>the</strong>r Thymidine or Nocodazole. Bottom | <strong>Cell</strong>s with a defined threshold <strong>of</strong> 2 x 10 6 integrated DNA<br />
fluorescence intensity are highlighted in yellow. All o<strong>the</strong>r cells are highlighted in blue.<br />
B | Histograms. Left | Non-treated cells (control). Middle | The increased number <strong>of</strong> cells in G1-phase after Thymidine treatment compared to untreated cells indicates<br />
a compound induced arrest in G1-phase. Right | After treatment with Nocodazole, <strong>the</strong> number <strong>of</strong> G1 cells decreases whereas <strong>the</strong> number <strong>of</strong> M-phase cells increases. This<br />
indicates an inhibition <strong>of</strong> cell division after Nocadazole treatment. To generate <strong>the</strong> histograms, <strong>the</strong> numerical data corresponding to single cells, from <strong>the</strong> 1000 cells<br />
analyzed per compound, were transferred into Excel®.<br />
2
Hoechst channel Alexa Fluor® 488<br />
channel<br />
A<br />
Alexa Fluor® 647<br />
channel<br />
False color overlay <strong>of</strong><br />
<strong>of</strong> all channels<br />
Control<br />
30 μM Thymidine<br />
1 μM Nocodazole<br />
B<br />
Positive cells [%]<br />
Figure 2. Image analysis strategy for quantifying <strong>the</strong> fluorescence signal <strong>of</strong><br />
EdU (Alexa Fluor® 488) and pHH3 (Alexa Fluor®647) in cell nuclei.<br />
A | Images <strong>of</strong> Hoechst stained DNA (Hoechst channel), Alexa Fluor® 488<br />
labeled EdU (Alexa Fluor® 488 channel), Alexa Fluor® 647 labeled pHH3<br />
(Alexa Fluor® 647 channel) and a false color overlay <strong>of</strong> all 3 channels (DNA:<br />
blue, EdU: green and pHH3: red) after an 18 h incubation with ei<strong>the</strong>r<br />
Thymidine or Nocodazole. In order to classify cells as being positive for EdU<br />
(S-phase) or pHH3 (M-phase), mean intensity thresholds were defined; In<br />
this particular example <strong>the</strong>se were 2000 and 200 respectively. The thresholds<br />
were adapted from a significant increase in <strong>the</strong> fluorescence intensity <strong>of</strong> <strong>the</strong><br />
respective marker within a cell population.<br />
Log Thymidine [μM]<br />
EdU Positive cells EC 50<br />
37.57<br />
pHH3 Positive cells<br />
B | Compound-generated dose-response curves for Thymidine (Top) and<br />
Nocodazole (Bottom). The percentage <strong>of</strong> cells positive for EdU (representing<br />
S-phase cells) is shown in gray, and <strong>the</strong> percentage <strong>of</strong> cells positive for<br />
pHH3 (representing M-phase cells) in red. When cells were treated with<br />
Thymidine, a significant decrease in <strong>the</strong> EdU signal was observed. Treatment<br />
<strong>of</strong> cells with Nocodazole however, led to a clear increase in <strong>the</strong> pHH3 signal<br />
due to its inhibitory effect during cell division (M-phase). EC 50<br />
values for<br />
Thymidine (37.57 μM) and Nocodazole (0.11 μM) were calculated <strong>using</strong> <strong>the</strong><br />
Prism s<strong>of</strong>tware. N = 3 wells.<br />
Positive cells [%]<br />
Conclusions<br />
We have presented a robust cell-based application that can<br />
be used in a High Content Screening approach to investigate<br />
<strong>the</strong> effects <strong>of</strong> anti-proliferative drugs. We show that by<br />
multiplexing <strong>the</strong> analysis <strong>of</strong> DNA content with an S- and<br />
M-phase specific marker, a precise classification <strong>of</strong> cells into<br />
<strong>the</strong> three main sub-populations (G1, S and G2/M) can be<br />
achieved.<br />
Log Nocodazole [μM]<br />
EdU Positive cells<br />
pHH3 Positive cells EC 50<br />
0.11<br />
3
1 Thymidine (deoxythymidine) is a nucleoside composed <strong>of</strong> deoxyribose (a pentose sugar),<br />
joined to <strong>the</strong> base thymine. An excess <strong>of</strong> Thymidine leads to allosteric inhibition <strong>of</strong> <strong>the</strong><br />
ribonucleotide reductase, which consequently<br />
prevents DNA syn<strong>the</strong>sis (G1/S blocker).<br />
2 Nocodazole is an anti-mitotic agent that blocks microtubule formation by binding to<br />
ß-tubulin, thus preventing nuclear and cell division (G2/M blocker).<br />
References<br />
Alberts BR, Bray DE, Lewis JU, Raff MA, Roberts KE, Watson JA<br />
(1983), Molecular Biology <strong>of</strong> <strong>the</strong> <strong>Cell</strong>, Garland, New York, NY,<br />
Alderborn.<br />
Authors<br />
Stefan Letzsch<br />
Eleni Mumtsidu<br />
<strong>PerkinElmer</strong><br />
<strong>Cell</strong>ular Technologies Germany GmbH<br />
<strong>Cell</strong>ular Imaging & Analysis<br />
Hamburg, DE<br />
<strong>PerkinElmer</strong>, Inc.<br />
940 Winter Street<br />
Waltham, MA 02451 USA<br />
P: (800) 762-4000 or<br />
(+1) 203-925-4602<br />
www.perkinelmer.com<br />
For a complete listing <strong>of</strong> our global <strong>of</strong>fices, visit www.perkinelmer.com/ContactUs<br />
Copyright © 2009 <strong>PerkinElmer</strong>, Inc. All rights reserved. <strong>PerkinElmer</strong> is a registered trademark <strong>of</strong> <strong>PerkinElmer</strong>, Inc. Harmony and <strong>Operetta</strong> are trademarks <strong>of</strong> <strong>PerkinElmer</strong>, Inc. Hoechst 33342 is a trademark <strong>of</strong> Invitrogen Corporation. ClickiT<br />
is a trademark and Alexa Fluor is a registered trademark <strong>of</strong> Molecular Probes, Inc. Excel is a registered trademark <strong>of</strong> Micros<strong>of</strong>t Corporation. Prism s<strong>of</strong>tware is released under <strong>the</strong> GNU General Public License. All trademarks not owned<br />
by <strong>PerkinElmer</strong>, Inc. or its subsidiaries that are depicted herein are <strong>the</strong> property <strong>of</strong> <strong>the</strong>ir respective owners. <strong>PerkinElmer</strong> reserves <strong>the</strong> right to change this document at any time without notice and disclaims liability for editorial, pictorial or<br />
typographical errors.<br />
008605_03