2010 FERC Form 1 - Pacific Gas and Electric Company
2010 FERC Form 1 - Pacific Gas and Electric Company
2010 FERC Form 1 - Pacific Gas and Electric Company

Create successful ePaper yourself
Turn your PDF publications into a flip-book with our unique Google optimized e-Paper software.
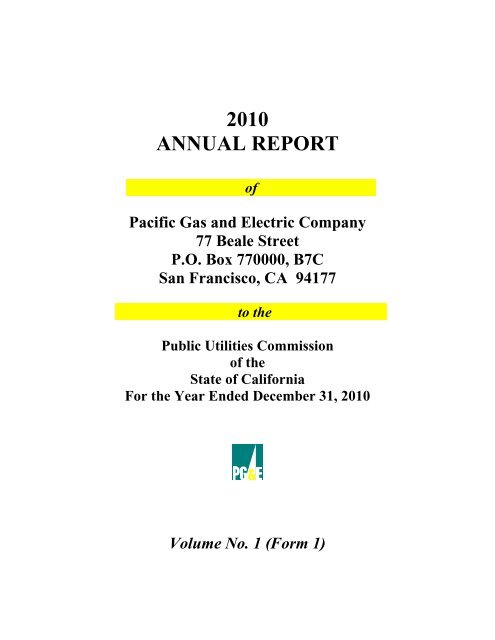
<strong>2010</strong><br />
ANNUAL REPORT<br />
of<br />
<strong>Pacific</strong> <strong>Gas</strong> <strong>and</strong> <strong>Electric</strong> <strong>Company</strong><br />
77 Beale Street<br />
P.O. Box 770000, B7C<br />
San Francisco, CA 94177<br />
to the<br />
Public Utilities Commission<br />
of the<br />
State of California<br />
For the Year Ended December 31, <strong>2010</strong><br />
Volume No. 1 (<strong>Form</strong> 1)
Name of Respondent<br />
PACIFIC GAS AND ELECTRIC COMPANY<br />
This Report Is:<br />
Date of Report<br />
(1) X An Original<br />
(Mo, Da, Yr)<br />
(2) A Resubmission<br />
04/08/2011<br />
LIST OF SCHEDULES (<strong>Electric</strong> Utility)<br />
Year/Period of Report<br />
End of <strong>2010</strong>/Q4<br />
Enter in column (c) the terms "none," "not applicable," or "NA," as appropriate, where no information or amounts have been reported for<br />
certain pages. Omit pages where the respondents are "none," "not applicable," or "NA".<br />
Line<br />
No.<br />
Title of Schedule<br />
(a)<br />
Reference<br />
Page No.<br />
(b)<br />
Remarks<br />
(c)<br />
1<br />
General Information<br />
101<br />
2<br />
Control Over Respondent<br />
102<br />
3<br />
Corporations Controlled by Respondent<br />
103<br />
4<br />
Officers<br />
104<br />
5<br />
Directors<br />
105<br />
6<br />
Information on <strong>Form</strong>ula Rates<br />
106(a)(b)<br />
7<br />
Important Changes During the Year<br />
108-109<br />
8<br />
Comparative Balance Sheet<br />
110-113<br />
9<br />
Statement of Income for the Year<br />
114-117<br />
10<br />
Statement of Retained Earnings for the Year<br />
118-119<br />
11<br />
Statement of Cash Flows<br />
120-121<br />
12<br />
Notes to Financial Statements<br />
122-123<br />
13<br />
Statement of Accum Comp Income, Comp Income, <strong>and</strong> Hedging Activities<br />
122(a)(b)<br />
14<br />
Summary of Utility Plant & Accumulated Provisions for Dep, Amort & Dep<br />
200-201<br />
15<br />
Nuclear Fuel Materials<br />
202-203<br />
16<br />
<strong>Electric</strong> Plant in Service<br />
204-207<br />
17<br />
<strong>Electric</strong> Plant Leased to Others<br />
213<br />
NONE<br />
18<br />
<strong>Electric</strong> Plant Held for Future Use<br />
214<br />
NONE<br />
19<br />
Construction Work in Progress-<strong>Electric</strong><br />
216<br />
20<br />
Accumulated Provision for Depreciation of <strong>Electric</strong> Utility Plant<br />
219<br />
21<br />
Investment of Subsidiary Companies<br />
224-225<br />
22<br />
Materials <strong>and</strong> Supplies<br />
227<br />
23<br />
Allowances<br />
228(ab)-229(ab)<br />
24<br />
Extraordinary Property Losses<br />
230<br />
NONE<br />
25<br />
Unrecovered Plant <strong>and</strong> Regulatory Study Costs<br />
230<br />
NONE<br />
26<br />
Transmission Service <strong>and</strong> Generation Interconnection Study Costs<br />
231<br />
27<br />
Other Regulatory Assets<br />
232<br />
28<br />
Miscellaneous Deferred Debits<br />
233<br />
29<br />
Accumulated Deferred Income Taxes<br />
234<br />
30<br />
Capital Stock<br />
250-251<br />
31<br />
Other Paid-in Capital<br />
253<br />
32<br />
Capital Stock Expense<br />
254<br />
33<br />
Long-Term Debt<br />
256-257<br />
34<br />
Reconciliation of Reported Net Income with Taxable Inc for Fed Inc Tax<br />
261<br />
35<br />
Taxes Accrued, Prepaid <strong>and</strong> Charged During the Year<br />
262-263<br />
36<br />
Accumulated Deferred Investment Tax Credits<br />
266-267<br />
<strong>FERC</strong> FORM NO. 1 (ED. 12-96) Page 2
Name of Respondent<br />
PACIFIC GAS AND ELECTRIC COMPANY<br />
This Report Is:<br />
Date of Report<br />
(1) X An Original<br />
(Mo, Da, Yr)<br />
(2) A Resubmission<br />
04/08/2011<br />
LIST OF SCHEDULES (<strong>Electric</strong> Utility) (continued)<br />
Year/Period of Report<br />
End of <strong>2010</strong>/Q4<br />
Enter in column (c) the terms "none," "not applicable," or "NA," as appropriate, where no information or amounts have been reported for<br />
certain pages. Omit pages where the respondents are "none," "not applicable," or "NA".<br />
Line<br />
No.<br />
Title of Schedule<br />
(a)<br />
Reference<br />
Page No.<br />
(b)<br />
Remarks<br />
(c)<br />
37<br />
Other Deferred Credits<br />
269<br />
38<br />
Accumulated Deferred Income Taxes-Accelerated Amortization Property<br />
272-273<br />
39<br />
Accumulated Deferred Income Taxes-Other Property<br />
274-275<br />
40<br />
Accumulated Deferred Income Taxes-Other<br />
276-277<br />
41<br />
Other Regulatory Liabilities<br />
278<br />
42<br />
<strong>Electric</strong> Operating Revenues<br />
300-301<br />
43<br />
Sales of <strong>Electric</strong>ity by Rate Schedules<br />
304<br />
44<br />
Sales for Resale<br />
310-311<br />
45<br />
<strong>Electric</strong> Operation <strong>and</strong> Maintenance Expenses<br />
320-323<br />
46<br />
Purchased Power<br />
326-327<br />
47<br />
Transmission of <strong>Electric</strong>ity for Others<br />
328-330<br />
48<br />
Transmission of <strong>Electric</strong>ity by ISO/RTOs<br />
331<br />
NOT APPLICABLE<br />
49<br />
Transmission of <strong>Electric</strong>ity by Others<br />
332<br />
50<br />
Miscellaneous General Expenses-<strong>Electric</strong><br />
335<br />
51<br />
Depreciation <strong>and</strong> Amortization of <strong>Electric</strong> Plant<br />
336-337<br />
52<br />
Regulatory Commission Expenses<br />
350-351<br />
53<br />
Research, Development <strong>and</strong> Demonstration Activities<br />
352-353<br />
NONE<br />
54<br />
Distribution of Salaries <strong>and</strong> Wages<br />
354-355<br />
55<br />
Common Utility Plant <strong>and</strong> Expenses<br />
356<br />
56<br />
Amounts included in ISO/RTO Settlement Statements<br />
397<br />
57<br />
Purchase <strong>and</strong> Sale of Ancillary Services<br />
398<br />
58<br />
Monthly Transmission System Peak Load<br />
400<br />
59<br />
Monthly ISO/RTO Transmission System Peak Load<br />
400a<br />
NOT APPLICABLE<br />
60<br />
<strong>Electric</strong> Energy Account<br />
401<br />
61<br />
Monthly Peaks <strong>and</strong> Output<br />
401<br />
62<br />
Steam <strong>Electric</strong> Generating Plant Statistics<br />
402-403<br />
63<br />
Hydroelectric Generating Plant Statistics<br />
406-407<br />
64<br />
Pumped Storage Generating Plant Statistics<br />
408-409<br />
65<br />
Generating Plant Statistics Pages<br />
410-411<br />
66<br />
Transmission Line Statistics Pages<br />
422-423<br />
<strong>FERC</strong> FORM NO. 1 (ED. 12-96) Page 3
Name of Respondent<br />
PACIFIC GAS AND ELECTRIC COMPANY<br />
This Report Is:<br />
Date of Report<br />
(1) X An Original<br />
(Mo, Da, Yr)<br />
(2) A Resubmission<br />
04/08/2011<br />
LIST OF SCHEDULES (<strong>Electric</strong> Utility) (continued)<br />
Year/Period of Report<br />
End of <strong>2010</strong>/Q4<br />
Enter in column (c) the terms "none," "not applicable," or "NA," as appropriate, where no information or amounts have been reported for<br />
certain pages. Omit pages where the respondents are "none," "not applicable," or "NA".<br />
Line<br />
No.<br />
Title of Schedule<br />
(a)<br />
Reference<br />
Page No.<br />
(b)<br />
Remarks<br />
(c)<br />
67<br />
Transmission Lines Added During the Year<br />
424-425<br />
68<br />
Substations<br />
426-427<br />
69<br />
Transactions with Associated (Affiliated) Companies<br />
429<br />
70<br />
Footnote Data<br />
450<br />
Stockholders' Reports Check appropriate box:<br />
X Two copies will be submitted<br />
No annual report to stockholders is prepared<br />
<strong>FERC</strong> FORM NO. 1 (ED. 12-96) Page 4
Name of Respondent<br />
PACIFIC GAS AND ELECTRIC COMPANY<br />
This Report Is:<br />
(1) X An Original<br />
(2) A Resubmission<br />
Date of Report<br />
(Mo, Da, Yr)<br />
04/08/2011<br />
Year/Period of Report<br />
End of<br />
<strong>2010</strong>/Q4<br />
Dinyar Mistry, Vice President <strong>and</strong> Controller<br />
77 Beale Street, B7A<br />
San Francisco, California 94105<br />
GENERAL INFORMATION<br />
1. Provide name <strong>and</strong> title of officer having custody of the general corporate books of account <strong>and</strong> address of<br />
office where the general corporate books are kept, <strong>and</strong> address of office where any other corporate books of account<br />
are kept, if different from that where the general corporate books are kept.<br />
2. Provide the name of the State under the laws of which respondent is incorporated, <strong>and</strong> date of incorporation.<br />
If incorporated under a special law, give reference to such law. If not incorporated, state that fact <strong>and</strong> give the type<br />
of organization <strong>and</strong> the date organized.<br />
California - October 10, 1905<br />
3. If at any time during the year the property of respondent was held by a receiver or trustee, give (a) name of<br />
receiver or trustee, (b) date such receiver or trustee took possession, (c) the authority by which the receivership or<br />
trusteeship was created, <strong>and</strong> (d) date when possession by receiver or trustee ceased.<br />
Not Applicable.<br />
4. State the classes or utility <strong>and</strong> other services furnished by respondent during the year in each State in which<br />
the respondent operated.<br />
<strong>Electric</strong>ity <strong>and</strong> natural gas distribution, electricity generation, procurement, <strong>and</strong> transmission, <strong>and</strong><br />
natural gas procurement, transportation, <strong>and</strong> storage.<br />
State of California only.<br />
5. Have you engaged as the principal accountant to audit your financial statements an accountant who is not<br />
the principal accountant for your previous year's certified financial statements?<br />
(1) Yes...Enter the date when such independent accountant was initially engaged:<br />
(2) X No<br />
<strong>FERC</strong> FORM No.1 (ED. 12-87) PAGE 101
Name of Respondent<br />
PACIFIC GAS AND ELECTRIC COMPANY<br />
This Report Is:<br />
(1) X An Original<br />
(2) A Resubmission<br />
Date of Report<br />
(Mo, Da, Yr)<br />
04/08/2011<br />
Year/Period of Report<br />
End of<br />
<strong>2010</strong>/Q4<br />
CONTROL OVER RESPONDENT<br />
1. If any corporation, business trust, or similar organization or a combination of such organizations jointly held<br />
control over the repondent at the end of the year, state name of controlling corporation or organization, manner in<br />
which control was held, <strong>and</strong> extent of control. If control was in a holding company organization, show the chain<br />
of ownership or control to the main parent company or organization. If control was held by a trustee(s), state<br />
name of trustee(s), name of beneficiary or beneficiearies for whom trust was maintained, <strong>and</strong> purpose of the trust.<br />
Effective January 1, 1997, PG&E Corporation became the holding company of <strong>Pacific</strong> <strong>Gas</strong> <strong>and</strong> <strong>Electric</strong> <strong>Company</strong>.<br />
<strong>FERC</strong> FORM NO. 1 (ED. 12-96)<br />
Page 102
Name of Respondent<br />
PACIFIC GAS AND ELECTRIC COMPANY<br />
This Report Is:<br />
Date of Report<br />
(1) X An Original<br />
(Mo, Da, Yr)<br />
(2) A Resubmission<br />
04/08/2011<br />
CORPORATIONS CONTROLLED BY RESPONDENT<br />
Year/Period of Report<br />
End of <strong>2010</strong>/Q4<br />
1. Report below the names of all corporations, business trusts, <strong>and</strong> similar organizations, controlled directly or indirectly by respondent<br />
at any time during the year. If control ceased prior to end of year, give particulars (details) in a footnote.<br />
2. If control was by other means than a direct holding of voting rights, state in a footnote the manner in which control was held, naming<br />
any intermediaries involved.<br />
3. If control was held jointly with one or more other interests, state the fact in a footnote <strong>and</strong> name the other interests.<br />
Definitions<br />
1. See the Uniform System of Accounts for a definition of control.<br />
2. Direct control is that which is exercised without interposition of an intermediary.<br />
3. Indirect control is that which is exercised by the interposition of an intermediary which exercises direct control.<br />
4. Joint control is that in which neither interest can effectively control or direct action without the consent of the other, as where the<br />
voting control is equally divided between two holders, or each party holds a veto power over the other. Joint control may exist by<br />
mutual agreement or underst<strong>and</strong>ing between two or more parties who together have control within the meaning of the definition of<br />
control in the Uniform System of Accounts, regardless of the relative voting rights of each party.<br />
Line<br />
No.<br />
Name of <strong>Company</strong> Controlled Kind of Business Percent Voting<br />
Stock Owned<br />
(a)<br />
(b)<br />
(c)<br />
1 Calaska Energy <strong>Company</strong><br />
2<br />
3<br />
4<br />
5<br />
6 Eureka Energy <strong>Company</strong><br />
7<br />
8<br />
9<br />
10<br />
11<br />
12<br />
13 Midway Power, LLC<br />
14<br />
15<br />
16<br />
17<br />
18 Natural <strong>Gas</strong> Corporation of California (NGC)<br />
19<br />
20<br />
21<br />
22<br />
23<br />
24 NGC Production <strong>Company</strong><br />
25 (The Utility has an indirect interest in<br />
26 NGC Production <strong>Company</strong> by virtue of its<br />
27 sole ownership of NGC.)<br />
<strong>Form</strong>erly the Utility's 100<br />
representative in the<br />
Alaska Highway<br />
Pipeline Project.<br />
<strong>Form</strong>erly managed 100<br />
the Utility's Utah coal<br />
venture. Currently holds<br />
part of the Marre Ranch<br />
property in San Luis<br />
Obispo County.<br />
<strong>Form</strong>ed to be the ownership 100<br />
entity for real estate <strong>and</strong><br />
licenses for a suspended<br />
development project.<br />
Entity used to amortize 100<br />
remaining <strong>Gas</strong><br />
Exploration <strong>and</strong><br />
Development Account<br />
assets.<br />
A wholly owned subsidiary<br />
of NGC engaged in<br />
financing capital<br />
requirements of NGC.<br />
Footnote<br />
Ref.<br />
(d)<br />
<strong>FERC</strong> FORM NO. 1 (ED. 12-96) Page 103
Name of Respondent<br />
PACIFIC GAS AND ELECTRIC COMPANY<br />
This Report Is:<br />
Date of Report<br />
(1) X An Original<br />
(Mo, Da, Yr)<br />
(2) A Resubmission<br />
04/08/2011<br />
CORPORATIONS CONTROLLED BY RESPONDENT<br />
Year/Period of Report<br />
End of <strong>2010</strong>/Q4<br />
1. Report below the names of all corporations, business trusts, <strong>and</strong> similar organizations, controlled directly or indirectly by respondent<br />
at any time during the year. If control ceased prior to end of year, give particulars (details) in a footnote.<br />
2. If control was by other means than a direct holding of voting rights, state in a footnote the manner in which control was held, naming<br />
any intermediaries involved.<br />
3. If control was held jointly with one or more other interests, state the fact in a footnote <strong>and</strong> name the other interests.<br />
Definitions<br />
1. See the Uniform System of Accounts for a definition of control.<br />
2. Direct control is that which is exercised without interposition of an intermediary.<br />
3. Indirect control is that which is exercised by the interposition of an intermediary which exercises direct control.<br />
4. Joint control is that in which neither interest can effectively control or direct action without the consent of the other, as where the<br />
voting control is equally divided between two holders, or each party holds a veto power over the other. Joint control may exist by<br />
mutual agreement or underst<strong>and</strong>ing between two or more parties who together have control within the meaning of the definition of<br />
control in the Uniform System of Accounts, regardless of the relative voting rights of each party.<br />
Line<br />
No.<br />
1<br />
Name of <strong>Company</strong> Controlled Kind of Business Percent Voting<br />
Stock Owned<br />
(a)<br />
(b)<br />
(c)<br />
2 Newco Energy Corporation<br />
3<br />
4<br />
5<br />
6<br />
7 <strong>Pacific</strong> California <strong>Gas</strong> System, Inc.<br />
8<br />
9<br />
10<br />
11 <strong>Pacific</strong> Conservation Services <strong>Company</strong><br />
12<br />
13<br />
14<br />
15<br />
16<br />
17 <strong>Pacific</strong> Energy Fuels <strong>Company</strong><br />
18<br />
19<br />
20<br />
21<br />
22 <strong>Pacific</strong> <strong>Gas</strong> Properties <strong>Company</strong><br />
23<br />
24<br />
25<br />
26<br />
27<br />
<strong>Form</strong>ed to facilitate 100<br />
implementation of the<br />
Utility's original proposed<br />
plan of reorganization.<br />
<strong>Form</strong>ed to hold the 100<br />
intrastate gas pipeline<br />
operations.<br />
<strong>Form</strong>erly engaged in the 100<br />
borrowing <strong>and</strong> lending<br />
operations required<br />
to fund the Utility's<br />
conservation loan programs.<br />
<strong>Form</strong>ed to own <strong>and</strong> 100<br />
finance the nuclear fuel<br />
inventory previously owned<br />
by <strong>Pacific</strong> Energy Trust.<br />
<strong>Form</strong>ed to hold Alaska 100<br />
<strong>and</strong> California property<br />
interests, previously<br />
intended for LNG projects,<br />
for sale or development.<br />
Footnote<br />
Ref.<br />
(d)<br />
<strong>FERC</strong> FORM NO. 1 (ED. 12-96) Page 103.1
Name of Respondent<br />
PACIFIC GAS AND ELECTRIC COMPANY<br />
This Report Is:<br />
Date of Report<br />
(1) X An Original<br />
(Mo, Da, Yr)<br />
(2) A Resubmission<br />
04/08/2011<br />
CORPORATIONS CONTROLLED BY RESPONDENT<br />
Year/Period of Report<br />
End of <strong>2010</strong>/Q4<br />
1. Report below the names of all corporations, business trusts, <strong>and</strong> similar organizations, controlled directly or indirectly by respondent<br />
at any time during the year. If control ceased prior to end of year, give particulars (details) in a footnote.<br />
2. If control was by other means than a direct holding of voting rights, state in a footnote the manner in which control was held, naming<br />
any intermediaries involved.<br />
3. If control was held jointly with one or more other interests, state the fact in a footnote <strong>and</strong> name the other interests.<br />
Definitions<br />
1. See the Uniform System of Accounts for a definition of control.<br />
2. Direct control is that which is exercised without interposition of an intermediary.<br />
3. Indirect control is that which is exercised by the interposition of an intermediary which exercises direct control.<br />
4. Joint control is that in which neither interest can effectively control or direct action without the consent of the other, as where the<br />
voting control is equally divided between two holders, or each party holds a veto power over the other. Joint control may exist by<br />
mutual agreement or underst<strong>and</strong>ing between two or more parties who together have control within the meaning of the definition of<br />
control in the Uniform System of Accounts, regardless of the relative voting rights of each party.<br />
Line<br />
No.<br />
1 PG&E CalHydro, LLC<br />
2<br />
3<br />
4<br />
5<br />
6<br />
Name of <strong>Company</strong> Controlled Kind of Business Percent Voting<br />
Stock Owned<br />
(a)<br />
(b)<br />
(c)<br />
7 PG&E Energy Recovery Funding LLC<br />
8<br />
9<br />
10<br />
11 St<strong>and</strong>ard <strong>Pacific</strong> <strong>Gas</strong> Line Incorporated<br />
12<br />
13<br />
14<br />
15<br />
16<br />
17<br />
18 PG&E Real Estate, LLC<br />
19<br />
20<br />
21<br />
22<br />
23<br />
24<br />
25<br />
26<br />
27<br />
<strong>Form</strong>ed for the purpose of 100<br />
owning <strong>and</strong> operating a<br />
system of hydroelectric<br />
facilities <strong>and</strong> related<br />
watershed.<br />
<strong>Form</strong>ed to retain ownership 100<br />
of recovery property <strong>and</strong><br />
to issue securities.<br />
Engaged in the transportation 85.71<br />
of natural gas in California.<br />
The Utility owns an 85.71%<br />
interest <strong>and</strong> Chevron Pipe<br />
Line <strong>Company</strong> owns the<br />
remaining 14.29% interest.<br />
A wholly-owned subsidiary of 100<br />
<strong>Pacific</strong> <strong>Gas</strong> <strong>and</strong> <strong>Electric</strong><br />
<strong>Company</strong>, formed to conduct<br />
real estate transactions,<br />
most likely related to<br />
purchase of property rights<br />
of San Bruno incident<br />
Footnote<br />
Ref.<br />
(d)<br />
<strong>FERC</strong> FORM NO. 1 (ED. 12-96) Page 103.2
Name of Respondent<br />
PACIFIC GAS AND ELECTRIC COMPANY<br />
Line<br />
No.<br />
This Report Is:<br />
(1) X An Original<br />
(2) A Resubmission<br />
OFFICERS<br />
Date of Report<br />
(Mo, Da, Yr)<br />
04/08/2011<br />
Year/Period of Report<br />
End of <strong>2010</strong>/Q4<br />
1. Report below the name, title <strong>and</strong> salary for each executive officer whose salary is $50,000 or more. An "executive officer" of a<br />
respondent includes its president, secretary, treasurer, <strong>and</strong> vice president in charge of a principal business unit, division or function<br />
(such as sales, administration or finance), <strong>and</strong> any other person who performs similar policy making functions.<br />
2. If a change was made during the year in the incumbent of any position, show name <strong>and</strong> total remuneration of the previous<br />
incumbent, <strong>and</strong> the date the change in incumbency was made.<br />
1<br />
2<br />
3<br />
4<br />
5<br />
6<br />
7<br />
8<br />
9<br />
10<br />
11<br />
12<br />
13<br />
14<br />
15<br />
16<br />
17<br />
18<br />
19<br />
20<br />
21<br />
22<br />
23<br />
24<br />
25<br />
26<br />
27<br />
28<br />
29<br />
30<br />
31<br />
32<br />
33<br />
34<br />
35<br />
36<br />
37<br />
38<br />
39<br />
40<br />
41<br />
42<br />
43<br />
44<br />
Title Name of Officer Salary<br />
for Year<br />
(a)<br />
(b)<br />
(c)<br />
President Christopher P. Johns<br />
672,500<br />
Senior VP <strong>and</strong> Chief Operating Officer John S. Keenan<br />
616,250<br />
Senior VP, Financial Services Kent M. Harvey<br />
537,500<br />
Senior VP, Energy Supply <strong>and</strong> Chief Nuclear Offcer John T. Conway<br />
486,667<br />
Senior VP, Human Resources John R. Simon<br />
366,972<br />
Senior VP <strong>and</strong> Chief Information Officer Patricia M. Lawicki<br />
360,559<br />
Senior VP, Engineering <strong>and</strong> Operations Edward A. Salas<br />
348,823<br />
Senior VP, Energy Delivery Geisha J. Williams<br />
345,485<br />
Senior VP, Corporate Affairs Greg S. Pruett<br />
336,667<br />
Senior VP, Regulatory Relations Thomas E. Bottorff<br />
334,031<br />
Senior VP <strong>and</strong> Chief Customer Officer Helen A. Burt<br />
320,253<br />
Senior VP, Shared Services <strong>and</strong> Chief Procurement Officer Desmond Bell<br />
317,369<br />
Senior VP, Energy Procurement Fong Wan<br />
316,725<br />
VP <strong>and</strong> Controller Dinyar B.Mistry<br />
315,208<br />
VP, Finance <strong>and</strong> CFO Sara A.Cherry<br />
262,258<br />
VP <strong>and</strong> Controller Stephen J. Cairns<br />
309,000<br />
VP, Finance <strong>and</strong> CFO Barbara L. Barcon<br />
52,620<br />
<strong>FERC</strong> FORM NO. 1 (ED. 12-96) Page 104
Name of Respondent<br />
PACIFIC GAS AND ELECTRIC COMPANY<br />
This Report is:<br />
(1) X An Original<br />
(2) A Resubmission<br />
Date of Report<br />
(Mo, Da, Yr)<br />
04/08/2011<br />
Year/Period of Report<br />
<strong>2010</strong>/Q4<br />
FOOTNOTE DATA<br />
Schedule Page: 104 Line No.: 14 Column: a<br />
(1) Mr. Mistry became VP <strong>and</strong> Controller on March 8, <strong>2010</strong>.<br />
Schedule Page: 104 Line No.: 15 Column: a<br />
Ms. Cherry became VP, Finance <strong>and</strong> CFO on March 1, <strong>2010</strong>.<br />
Schedule Page: 104 Line No.: 16 Column: a<br />
Mr. Cairns served as VP <strong>and</strong> Controller through March 7, <strong>2010</strong>.<br />
Schedule Page: 104 Line No.: 17 Column: a<br />
Ms. Barcon served as VP, Finance <strong>and</strong> CFO through March 1, <strong>2010</strong>.<br />
<strong>FERC</strong> FORM NO. 1 (ED. 12-87) Page 450.1
Name of Respondent<br />
PACIFIC GAS AND ELECTRIC COMPANY<br />
This Report Is:<br />
(1) X An Original<br />
(2) A Resubmission<br />
DIRECTORS<br />
Date of Report<br />
(Mo, Da, Yr)<br />
04/08/2011<br />
Year/Period of Report<br />
End of <strong>2010</strong>/Q4<br />
1. Report below the information called for concerning each director of the respondent who held office at any time during the year. Include in column (a), abbreviated<br />
titles of the directors who are officers of the respondent.<br />
2. Designate members of the Executive Committee by a triple asterisk <strong>and</strong> the Chairman of the Executive Committee by a double asterisk.<br />
Line<br />
No.<br />
Name (<strong>and</strong> Title) of Director<br />
(a)<br />
Principal Business Address<br />
(b)<br />
1 David R. Andrews, Esq. ***<br />
c/o PG&E Corporation<br />
2<br />
One Market, Spear Tower, Suite 2400<br />
3<br />
4<br />
5 Lewis Chew<br />
San Francisco, CA 94105<br />
c/o National Semiconductor Corporation<br />
6<br />
2900 Semiconductor Drive, Mail Stop G3-155<br />
7<br />
8<br />
9 C. Lee Cox ***<br />
Santa Clara, CA 95051<br />
c/o PG&E Corporation<br />
10 Non-Executive Chairman of the Board<br />
One Market, Spear Tower, Suite 2400<br />
11<br />
12<br />
13 Peter A. Darbee **<br />
San Francisco, CA 94105<br />
c/o PG&E Corporation<br />
14<br />
One Market, Spear Tower, Suite 2400<br />
15<br />
16<br />
17 Maryellen C. Herringer ***<br />
San Francisco, CA 94105<br />
c/o PG&E Corporation<br />
18<br />
One Market, Spear Tower, Suite 2400<br />
19<br />
20<br />
21 Roger H. Kimmel<br />
San Francisco, CA 94105<br />
c/o Rothschild Inc.<br />
22<br />
1251 Avenue of the Americas<br />
23<br />
24<br />
25 Richard A. Meserve<br />
New York, NY 10020<br />
c/o Carnegie Institution of Washington<br />
26<br />
1530 P Street, NW<br />
27<br />
28<br />
29 Forrest E. Miller<br />
Washington, DC 20005<br />
c/o AT&T Inc.<br />
30<br />
208 S. Akard Street, Suite 3701<br />
31<br />
32<br />
33 Rosendo G. Parra<br />
Dallas, TX 75202<br />
c/o Daylight Partners<br />
34<br />
3725 Hunterwood Point<br />
35<br />
36<br />
37 Barbara L. Rambo ***<br />
Austin, TX 78746<br />
c/o PG&E Corporation<br />
38<br />
One Market, Spear Tower, Suite 2400<br />
39<br />
40<br />
41 Barry Lawson Williams ***<br />
San Francisco, CA 94105<br />
c/o Williams <strong>Pacific</strong> Ventures, Inc.<br />
42<br />
4 Embarcadero Center, Suite 3700<br />
43<br />
44<br />
45 Christopher P Johns ***<br />
San Francisco, CA 94111<br />
c/o <strong>Pacific</strong> <strong>Gas</strong> <strong>and</strong> <strong>Electric</strong> <strong>Company</strong><br />
46<br />
77 Beale Street, 32nd Floor<br />
47<br />
48<br />
San Francisco, CA 94105<br />
<strong>FERC</strong> FORM NO. 1 (ED. 12-95) Page 105
Name of Respondent<br />
PACIFIC GAS AND ELECTRIC COMPANY<br />
This Report is:<br />
(1) X An Original<br />
(2) A Resubmission<br />
Date of Report<br />
(Mo, Da, Yr)<br />
04/08/2011<br />
Year/Period of Report<br />
<strong>2010</strong>/Q4<br />
FOOTNOTE DATA<br />
Schedule Page: 105 Line No.: 45 Column: a<br />
Christopher P. Johns was elected as President of the Utility on August 1, 2009 <strong>and</strong> as a<br />
director of the Utility on February 17, <strong>2010</strong>.<br />
<strong>FERC</strong> FORM NO. 1 (ED. 12-87) Page 450.1
Name of Respondent<br />
PACIFIC GAS AND ELECTRIC COMPANY<br />
This Report Is:<br />
Date of Report<br />
(1) X An Original<br />
(Mo, Da, Yr)<br />
(2) A Resubmission<br />
04/08/2011<br />
INFORMATION ON FORMULA RATES<br />
<strong>FERC</strong> Rate Schedule/Tariff Number <strong>FERC</strong> Proceeding<br />
Year/Period of Report<br />
End of <strong>2010</strong>/Q4<br />
Does the respondent have formula rates?<br />
Line<br />
No.<br />
<strong>FERC</strong> Rate Schedule or Tariff Number<br />
<strong>FERC</strong> Proceeding<br />
Yes<br />
X No<br />
1. Please list the Commission accepted formula rates including <strong>FERC</strong> Rate Schedule or Tariff Number <strong>and</strong> <strong>FERC</strong> proceeding (i.e. Docket No)<br />
accepting the rate(s) or changes in the accepted rate.<br />
1<br />
2<br />
3<br />
4<br />
5<br />
6<br />
7<br />
8<br />
9<br />
10<br />
11<br />
12<br />
13<br />
14<br />
15<br />
16<br />
17<br />
18<br />
19<br />
20<br />
21<br />
22<br />
23<br />
24<br />
25<br />
26<br />
27<br />
28<br />
29<br />
30<br />
31<br />
32<br />
33<br />
34<br />
35<br />
36<br />
37<br />
38<br />
39<br />
40<br />
41<br />
NOT APPLICABLE<br />
<strong>FERC</strong> FORM NO. 1 (NEW. 12-08) Page 106
Name of Respondent<br />
PACIFIC GAS AND ELECTRIC COMPANY<br />
This Report Is:<br />
Date of Report<br />
(1) X An Original<br />
(Mo, Da, Yr)<br />
(2) A Resubmission<br />
04/08/2011<br />
INFORMATION ON FORMULA RATES<br />
<strong>FERC</strong> Rate Schedule/Tariff Number <strong>FERC</strong> Proceeding<br />
Year/Period of Report<br />
End of <strong>2010</strong>/Q4<br />
Does the respondent file with the Commission annual (or more frequent)<br />
filings containing the inputs to the formula rate(s)?<br />
2. If yes, provide a listing of such filings as contained on the Commission's eLibrary website<br />
X<br />
Yes<br />
No<br />
Line<br />
No.<br />
1<br />
2<br />
3<br />
4<br />
5<br />
6<br />
7<br />
8<br />
9<br />
10<br />
11<br />
12<br />
13<br />
14<br />
15<br />
16<br />
17<br />
18<br />
19<br />
20<br />
21<br />
22<br />
23<br />
24<br />
25<br />
26<br />
27<br />
28<br />
29<br />
30<br />
31<br />
32<br />
33<br />
34<br />
35<br />
36<br />
37<br />
38<br />
39<br />
40<br />
41<br />
42<br />
43<br />
44<br />
45<br />
46<br />
Accession No.<br />
Document Date<br />
\ Filed Date<br />
Docket No.<br />
NOT APPLICABLE<br />
Description<br />
<strong>Form</strong>ula Rate <strong>FERC</strong> Rate<br />
Schedule Number or<br />
Tariff Number<br />
<strong>FERC</strong> FORM NO. 1 (NEW. 12-08)<br />
Page 106a
Name of Respondent<br />
PACIFIC GAS AND ELECTRIC COMPANY<br />
This Report Is:<br />
(1) X An Original<br />
(2) A Resubmission<br />
INFORMATION ON FORMULA RATES<br />
<strong>Form</strong>ula Rate Variances<br />
Date of Report<br />
(Mo, Da, Yr)<br />
04/08/2011<br />
Year/Period of Report<br />
End of <strong>2010</strong>/Q4<br />
1. If a respondent does not submit such filings then indicate in a footnote to the applicable <strong>Form</strong> 1 schedule where formula rate inputs differ from<br />
amounts reported in the <strong>Form</strong> 1.<br />
2. The footnote should provide a narrative description explaining how the "rate" (or billing) was derived if different from the reported amount in the<br />
<strong>Form</strong> 1.<br />
3. The footnote should explain amounts excluded from the ratebase or where labor or other allocation factors, operating expenses, or other items<br />
impacting formula rate inputs differ from amounts reported in <strong>Form</strong> 1 schedule amounts.<br />
4. Where the Commission has provided guidance on formula rate inputs, the specific proceeding should be noted in the footnote.<br />
Line<br />
No. Page No(s). Schedule Column Line No<br />
1<br />
2<br />
3<br />
4<br />
5<br />
6<br />
7<br />
8<br />
9<br />
10<br />
11<br />
12<br />
13<br />
14<br />
15<br />
16<br />
17<br />
18<br />
19<br />
20<br />
21<br />
22<br />
23<br />
24<br />
25<br />
26<br />
27<br />
28<br />
29<br />
30<br />
31<br />
32<br />
33<br />
34<br />
35<br />
36<br />
37<br />
38<br />
39<br />
40<br />
41<br />
42<br />
43<br />
44<br />
NOT APPLICABLE<br />
<strong>FERC</strong> FORM NO. 1 (NEW. 12-08)<br />
Page 106b
Name of Respondent<br />
PACIFIC GAS AND ELECTRIC COMPANY<br />
This<br />
(1)<br />
Report<br />
X<br />
Is:<br />
An Original<br />
(2) A Resubmission<br />
Date of Report<br />
04/08/2011<br />
Year/Period of Report<br />
End of <strong>2010</strong>/Q4<br />
IMPORTANT CHANGES DURING THE QUARTER/YEAR<br />
Give particulars (details) concerning the matters indicated below. Make the statements explicit <strong>and</strong> precise, <strong>and</strong> number them in<br />
accordance with the inquiries. Each inquiry should be answered. Enter "none," "not applicable," or "NA" where applicable. If<br />
information which answers an inquiry is given elsewhere in the report, make a reference to the schedule in which it appears.<br />
1. Changes in <strong>and</strong> important additions to franchise rights: Describe the actual consideration given therefore <strong>and</strong> state from whom the<br />
franchise rights were acquired. If acquired without the payment of consideration, state that fact.<br />
2. Acquisition of ownership in other companies by reorganization, merger, or consolidation with other companies: Give names of<br />
companies involved, particulars concerning the transactions, name of the Commission authorizing the transaction, <strong>and</strong> reference to<br />
Commission authorization.<br />
3. Purchase or sale of an operating unit or system: Give a brief description of the property, <strong>and</strong> of the transactions relating thereto,<br />
<strong>and</strong> reference to Commission authorization, if any was required. Give date journal entries called for by the Uniform System of Accounts<br />
were submitted to the Commission.<br />
4. Important leaseholds (other than leaseholds for natural gas l<strong>and</strong>s) that have been acquired or given, assigned or surrendered: Give<br />
effective dates, lengths of terms, names of parties, rents, <strong>and</strong> other condition. State name of Commission authorizing lease <strong>and</strong> give<br />
reference to such authorization.<br />
5. Important extension or reduction of transmission or distribution system: State territory added or relinquished <strong>and</strong> date operations<br />
began or ceased <strong>and</strong> give reference to Commission authorization, if any was required. State also the approximate number of<br />
customers added or lost <strong>and</strong> approximate annual revenues of each class of service. Each natural gas company must also state major<br />
new continuing sources of gas made available to it from purchases, development, purchase contract or otherwise, giving location <strong>and</strong><br />
approximate total gas volumes available, period of contracts, <strong>and</strong> other parties to any such arrangements, etc.<br />
6. Obligations incurred as a result of issuance of securities or assumption of liabilities or guarantees including issuance of short-term<br />
debt <strong>and</strong> commercial paper having a maturity of one year or less. Give reference to <strong>FERC</strong> or State Commission authorization, as<br />
appropriate, <strong>and</strong> the amount of obligation or guarantee.<br />
7. Changes in articles of incorporation or amendments to charter: Explain the nature <strong>and</strong> purpose of such changes or amendments.<br />
8. State the estimated annual effect <strong>and</strong> nature of any important wage scale changes during the year.<br />
9. State briefly the status of any materially important legal proceedings pending at the end of the year, <strong>and</strong> the results of any such<br />
proceedings culminated during the year.<br />
10. Describe briefly any materially important transactions of the respondent not disclosed elsewhere in this report in which an officer,<br />
director, security holder reported on Page 106, voting trustee, associated company or known associate of any of these persons was a<br />
party or in which any such person had a material interest.<br />
11. (Reserved.)<br />
12. If the important changes during the year relating to the respondent company appearing in the annual report to stockholders are<br />
applicable in every respect <strong>and</strong> furnish the data required by Instructions 1 to 11 above, such notes may be included on this page.<br />
13. Describe fully any changes in officers, directors, major security holders <strong>and</strong> voting powers of the respondent that may have<br />
occurred during the reporting period.<br />
14. In the event that the respondent participates in a cash management program(s) <strong>and</strong> its proprietary capital ratio is less than 30<br />
percent please describe the significant events or transactions causing the proprietary capital ratio to be less than 30 percent, <strong>and</strong> the<br />
extent to which the respondent has amounts loaned or money advanced to its parent, subsidiary, or affiliated companies through a<br />
cash management program(s). Additionally, please describe plans, if any to regain at least a 30 percent proprietary ratio.<br />
PAGE 108 INTENTIONALLY LEFT BLANK<br />
SEE PAGE 109 FOR REQUIRED INFORMATION.<br />
<strong>FERC</strong> FORM NO. 1 (ED. 12-96) Page 108
Name of Respondent<br />
PACIFIC GAS AND ELECTRIC COMPANY<br />
This Report is:<br />
(1) X An Original<br />
(2) A Resubmission<br />
Date of Report<br />
(Mo, Da, Yr)<br />
04/08/2011<br />
Year/Period of Report<br />
<strong>2010</strong>/Q4<br />
IMPORTANT CHANGES DURING THE QUARTER/YEAR (Continued)<br />
1. Changes in <strong>and</strong> important additions to franchise rights:<br />
On February 23, <strong>2010</strong>, the City of San Jose adopted amendments to <strong>Pacific</strong> <strong>Gas</strong> <strong>and</strong><br />
<strong>Electric</strong> <strong>Company</strong>’s (the "Utility") gas <strong>and</strong> electric franchise agreements which<br />
provide for an increase in the franchise fee by three-tenths of one percent (0.3%).<br />
The increase in the franchise fee is collected as a surcharge to customers within the<br />
City of San Jose. The California Public Utilities Commission (“CPUC”) approved the<br />
franchise fee surcharge effective May 5, <strong>2010</strong>.<br />
On May 28, <strong>2010</strong>, the City of Fresno ("City") adopted a new gas franchise for the<br />
Utility, under Ordinance No. <strong>2010</strong>-16, replacing the existing gas franchise that<br />
expired in June, <strong>2010</strong>. The new gas franchise went into effect June 27, <strong>2010</strong> <strong>and</strong> is<br />
for a 50 year term. Under the new franchise, the City receives a total franchise fee<br />
of two (2) percent, of which one (1) percent is collected as a surcharge to customers<br />
within the City. The CPUC approved the franchise fee surcharge on September 16,<br />
<strong>2010</strong>, with an effective date of August 16, <strong>2010</strong>.<br />
2. Acquisition of ownership in other companies by reorganization, merger, or<br />
consolidation with other companies:<br />
None.<br />
3. Purchase or sale of an operating unit or system:<br />
Sale:<br />
Transaction Date Sale To: Equipment Type Location Amount 1<br />
Nov. 11. <strong>2010</strong> TPUD-Hyampom ETP Operating Trinity 761,002<br />
System<br />
County<br />
4. Important leaseholds that have been acquired or given, assigned or surrendered:<br />
Effective<br />
Location Lessor/Lessee Lease Term<br />
Date<br />
(St., City)<br />
Type<br />
Term<br />
Commencement<br />
Date<br />
Annual<br />
Rent<br />
5/3/10 1/1/09 345<br />
Sacramento<br />
St, Auburn<br />
9/30/10 1/1/11 118 S 3rd<br />
Street, King<br />
City<br />
10/15/10 10/15/10 1070 Airport<br />
Blvd, Santa<br />
Rosa<br />
11/1/10 12/1/10 900 Cherry<br />
Ave., 3rd<br />
Floor, San<br />
Bruno<br />
11/8/10 1/5/11 850 Stillwater<br />
Road, West<br />
Sacramento<br />
Twentieth<br />
District<br />
Agricultural<br />
Association<br />
JIM APPLING<br />
Laier <strong>and</strong><br />
Kantock<br />
SFO Business<br />
Centers, Inc.<br />
HARSCH<br />
INVESTMENT<br />
CORP.<br />
Lease<br />
Renewal<br />
Lease<br />
Renewal<br />
Lease<br />
Expansion<br />
(580 sq.<br />
ft.)<br />
36<br />
months<br />
36<br />
months<br />
36<br />
months<br />
New Lease 18<br />
months<br />
Lease<br />
Renewal<br />
12<br />
months<br />
$10,164<br />
$21,967.32<br />
$12,000<br />
$222,240<br />
$1,328,811.<br />
60<br />
11/15/10 12/1/<strong>2010</strong> 2700 Ygnacio,<br />
Suite 210,<br />
Walnut Creek<br />
<strong>Pacific</strong> 2700<br />
Ygnacio<br />
Corporation<br />
New Lease 18<br />
months<br />
$113,011.20<br />
<strong>FERC</strong> FORM NO. 1 (ED. 12-96) Page 109.1
Name of Respondent<br />
PACIFIC GAS AND ELECTRIC COMPANY<br />
This Report is:<br />
(1) X An Original<br />
(2) A Resubmission<br />
Date of Report<br />
(Mo, Da, Yr)<br />
04/08/2011<br />
Year/Period of Report<br />
<strong>2010</strong>/Q4<br />
IMPORTANT CHANGES DURING THE QUARTER/YEAR (Continued)<br />
12/8/10 1/1/11 410 N Main<br />
St, Fort<br />
Bragg<br />
12/10/10 12/15/10 125 Venture<br />
Dr, San Luis<br />
Obispo<br />
12/20/10 3/1/10 375 Fifth St,<br />
Hollister<br />
12/31/10 1/1/08 2570<br />
Cloverdale<br />
Ave., Suites<br />
19 & 20,<br />
Concord<br />
MS CORDELIA<br />
SHAMPANIER<br />
Vachell Lane<br />
Properties<br />
City of<br />
Hollister<br />
THE SCHMIDT<br />
FAMILY TRUST<br />
Lease<br />
Renewal<br />
36<br />
months<br />
New Lease 3<br />
months<br />
New Vacant<br />
L<strong>and</strong> Lease<br />
Lease<br />
Surrender/<br />
Lease<br />
Expiration<br />
120<br />
months<br />
36<br />
months<br />
$11,423.16<br />
$90,000<br />
$3,984<br />
$28,644.36<br />
5. Important extension or reduction of transmission or distribution system:<br />
<strong>Electric</strong>:<br />
On July 16, <strong>2010</strong>, the Gill Ranch <strong>Gas</strong> Storage 115 kV Load Interconnection Project<br />
became operational. Located in Madera, California, PG&E constructed a 10-mile long<br />
overhead tap line from the Dairyl<strong>and</strong>-Mendota 115 kV circuit to the customer-owned<br />
Gill Ranch Substation. Completion of this project enables the Gill Ranch customer to<br />
obtain transmission service from PG&E’s electric grid.<br />
On August 1, <strong>2010</strong>, the Oakl<strong>and</strong> Station C-X No. 3 115 kV Underground Cable Project was<br />
energized for service. This project, located in Alameda County, installed a single<br />
3.7 miles underground cable between Oakl<strong>and</strong> C <strong>and</strong> Oakl<strong>and</strong> X Substations. This<br />
project increases the area transmission capacity, thereby ensures reliable<br />
transmission service for electric customers in North Oakl<strong>and</strong> area.<br />
On August 27, <strong>2010</strong>, PG&E took ownership of the Carberry Switching Substation that was<br />
energized on June 22, <strong>2010</strong>. Located in Shasta County near Burney, California, the<br />
new 230 kV switching station was constructed to interconnect the Hatchet Ridge Wind<br />
Farm with PG&E’s electric grid. The wind farm is owned by a third-party developer,<br />
<strong>and</strong> it has a total output of approximately 100 MW. The new switching station is<br />
equipped with protection, control, <strong>and</strong> communication equipment enabling the existing<br />
230 kV Pit No. 3 to Round Mountain circuit to loop into the station for electric<br />
power delivery.<br />
On November 23, <strong>2010</strong>, the TransBay Cable Project interconnected with PG&E’s electric<br />
grid. This third-party-owned project installed a high-voltage direct-current cable<br />
<strong>and</strong> associated onshore facilities into PG&E’s grid. The 53-mile submarine cable<br />
improves electric transmission reliability to San Francisco by providing 400 MW of<br />
electric power transfer capability from Pittsburg Substation in Contra Costa County,<br />
to Potrero Substation in San Francisco County, California.<br />
On December 1, <strong>2010</strong>, the 7th St<strong>and</strong>ard Substation located in Kern County was released<br />
to Operations. New transmission <strong>and</strong> distribution facilities, including control <strong>and</strong><br />
protection equipment, were installed to provide additional capacity to reliably serve<br />
electric customers in Northwest Bakersfield <strong>and</strong> the surrounding area in Kern County,<br />
California.<br />
On December 22, <strong>2010</strong>, the PG&E-owned Colusa Generating Station interconnected to the<br />
Delevan Switching Substation for commercial operation. Located near Maxwell in<br />
<strong>FERC</strong> FORM NO. 1 (ED. 12-96) Page 109.2
Name of Respondent<br />
PACIFIC GAS AND ELECTRIC COMPANY<br />
This Report is:<br />
(1) X An Original<br />
(2) A Resubmission<br />
Date of Report<br />
(Mo, Da, Yr)<br />
04/08/2011<br />
Year/Period of Report<br />
<strong>2010</strong>/Q4<br />
IMPORTANT CHANGES DURING THE QUARTER/YEAR (Continued)<br />
Colusa County, California, the switching Station was energized on February 3, <strong>2010</strong>.<br />
The switching station has protection, control, <strong>and</strong> communication equipment that<br />
enables power output from the 660 MW generation station be delivered to the<br />
transmission corridor between Cottonwood <strong>and</strong> Vaca Dixon Substations.<br />
6. Obligations incurred as a result of issuance of securities or assumption of liabilities<br />
or guarantees including issuance of short-term debt <strong>and</strong> commercial paper having maturity<br />
of one year or less. Give reference to <strong>FERC</strong> or State Commission authorization, as<br />
appropriate, <strong>and</strong> the amount of obligation or guarantee:<br />
a) Financings:<br />
At December 31, <strong>2010</strong>, the Utility had $10.15 billion of unsecured senior notes<br />
outst<strong>and</strong>ing with various interest rates <strong>and</strong> maturity dates, including the<br />
following issuances made during <strong>2010</strong>.<br />
On April 1, <strong>2010</strong>, the Utility issued $250 million of 30-year unsecured Senior<br />
Notes. The issuance was a re-opening of the 5.80% 30-year Senior Notes issued in<br />
March 2007. In a bond re-opening, all of the terms of the new issue are<br />
identical to that of the original issue including coupon, interest payment dates,<br />
maturity date, etc. The Senior Notes were authorized by the California Public<br />
Utilities Commission (“CPUC”) Decision No. 08-10-013.<br />
On September 15, <strong>2010</strong>, the Utility issued $550 million of unsecured Senior Notes<br />
due October 1, 2020 at a coupon of 3.50%. The Senior Notes were authorized by<br />
the CPUC Decision No. 08-10-013.<br />
On October 12, <strong>2010</strong>, the Utility issued $250 principal amount of Floating Rate<br />
Senior Notes due October 11, 2011. The Senior Notes were authorized by CPUC<br />
Decision No. 04-10-037 as modified by Decision Nos. 05-04-023, 06-11-006 <strong>and</strong><br />
09-05-002.<br />
On November 18, <strong>2010</strong>, the Utility issued $250 million of 10-year unsecured Senior<br />
Notes <strong>and</strong> $250 million 30-year unsecured Senior Notes. Issuances were<br />
re-openings of the 3.50% 10-year Senior Notes <strong>and</strong> the 5.40% 30-year Senior Notes<br />
issued in September 15, <strong>2010</strong> <strong>and</strong> November 18, 2009, respectively. The Senior<br />
Notes were authorized by the CPUC Decision No. 08-10-013.<br />
On April 8, <strong>2010</strong>, the California Infrastructure <strong>and</strong> Economic Development Bank<br />
(I-Bank), issued $50 million of tax-exempt pollution control bond series <strong>2010</strong> E<br />
at a yield of 2.25%, due on November 1, 2026 with a 2-year m<strong>and</strong>atory put. The<br />
proceeds were loaned to the Utility to repurchase pollution control bonds series<br />
2005 E. The pollution control bonds were authorized by the CPUC Decision No.<br />
08-10-013.<br />
Refer to Note 4, Debt, of the Notes to Financial Statements on page 123 of the<br />
<strong>FERC</strong> <strong>Form</strong> 3-Q.<br />
b) Bank Credit Facilities:<br />
On June 8, <strong>2010</strong>, the Utility entered into a $750 million revolving credit<br />
facility agreement. This credit facility will expire on February 26, 2012 <strong>and</strong><br />
does not support the letters of credit program. At December 31, <strong>2010</strong>, the<br />
Utility had nothing outst<strong>and</strong>ing under this revolving credit facility.<br />
At December 31, <strong>2010</strong>, the Utility had $329 million of letters of credit<br />
outst<strong>and</strong>ing under the Utility’s $1.94 billion revolving credit facility.<br />
<strong>FERC</strong> FORM NO. 1 (ED. 12-96) Page 109.3
Name of Respondent<br />
PACIFIC GAS AND ELECTRIC COMPANY<br />
This Report is:<br />
(1) X An Original<br />
(2) A Resubmission<br />
Date of Report<br />
(Mo, Da, Yr)<br />
04/08/2011<br />
Year/Period of Report<br />
<strong>2010</strong>/Q4<br />
IMPORTANT CHANGES DURING THE QUARTER/YEAR (Continued)<br />
The revolving credit facility also provides liquidity support for commercial<br />
paper offerings. At December 31, <strong>2010</strong>, the Utility had $603 million of<br />
commercial paper outst<strong>and</strong>ing. The short-term borrowings are authorized by CPUC<br />
Decision No. 04-10-037 as modified by Decision Nos. 05-04-023, 06-11-006 <strong>and</strong><br />
09-05-002.<br />
Refer to Note 4, Debt, of the Notes to Financial Statements on page 123 of the<br />
<strong>FERC</strong> <strong>Form</strong> 3-Q.<br />
c) Surety Bonds <strong>and</strong> Financial Guarantees Backed by Insurance:<br />
From October 1, <strong>2010</strong> through December 31, <strong>2010</strong>, $865,000 in surety bonds was<br />
authorized by CPUC Decision No. 08-10-013. At December 31, <strong>2010</strong>, there was<br />
$11,959,000 in long-term surety bond obligations outst<strong>and</strong>ing.<br />
d) Capital Support:<br />
CCPUC Decision No. 91-12-057 (as modified by Decision No. 99-04-068) authorized<br />
the Utility to provide capital support to regulated <strong>and</strong> unregulated subsidiaries.<br />
At December 31, <strong>2010</strong>, the Utility has no outst<strong>and</strong>ing future capital commitments<br />
to unregulated subsidiaries <strong>and</strong> affiliates.<br />
e) Preferred repayments: None<br />
7. Changes in articles of incorporation or amendments to charter. Explain the nature<br />
<strong>and</strong> purpose of such changes or amendments:<br />
None.<br />
8. State the estimated annual effect <strong>and</strong> nature of any important wage scale changes<br />
during the period:<br />
As provided for in labor agreements with the International Brotherhood of <strong>Electric</strong>al<br />
Workers (“IBEW”), Local 1245, representing a majority of the Utility’s employees in<br />
physical <strong>and</strong> clerical classifications; the Engineers <strong>and</strong> Scientists of California<br />
(“ESC”), representing certain Utility employees in the technical <strong>and</strong> engineering<br />
classifications; <strong>and</strong>, the Service Employees International Union (“SEIU”),<br />
representing certain Utility security officers at Diablo Canyon Nuclear Power Plant,<br />
the following general wage increases were granted effective January 1, <strong>2010</strong>:<br />
IBEW Physical <strong>and</strong> Clerical classifications 3.75%<br />
ESC classifications 3.75%<br />
SEIU classifications 4.50%<br />
The full annual cost of the above general wage increases is approximately $40.3<br />
million.<br />
9. State briefly the status of any materially important legal proceedings pending at the<br />
end of the period <strong>and</strong> the results of any such proceedings culminated during the<br />
period:<br />
Refer to Note 15 of the Notes to Financial Statements on page 123, which discusses<br />
materially important pending legal matters.<br />
<strong>FERC</strong> FORM NO. 1 (ED. 12-96) Page 109.4
Name of Respondent<br />
PACIFIC GAS AND ELECTRIC COMPANY<br />
This Report is:<br />
(1) X An Original<br />
(2) A Resubmission<br />
Date of Report<br />
(Mo, Da, Yr)<br />
04/08/2011<br />
Year/Period of Report<br />
<strong>2010</strong>/Q4<br />
IMPORTANT CHANGES DURING THE QUARTER/YEAR (Continued)<br />
Further, refer to Part I, Item 3 in PG&E Corporation's <strong>and</strong> the Utility’s combined<br />
Annual Report on <strong>Form</strong> 10-K for the year ended December 31, <strong>2010</strong>, which describes<br />
certain legal proceedings pursuant to Item 103 of Regulation S-K of the Securities<br />
Exchange Act of 1934, as amended. Four copies of the <strong>Form</strong> 10—K report are filed in<br />
accordance with Instruction III(b) of Instructions For Filing the <strong>FERC</strong> <strong>Form</strong> No. 1.<br />
10. Describe briefly any material important transactions of the respondent not disclosed<br />
elsewhere in this report in which an officer, director, security holder reported in<br />
the last Annual Report <strong>FERC</strong> <strong>Form</strong> 1, 1-F, 2 or 2-A, voting trustee, associated company<br />
or known associate of any of these persons was a party or in which such person had a<br />
material interest:<br />
Refer to the PG&E Corporation <strong>and</strong> <strong>Pacific</strong> <strong>Gas</strong> <strong>and</strong> <strong>Electric</strong> <strong>Company</strong> Joint Proxy<br />
Statement dated March 30, 2011 which describes certain related person transactions<br />
pursuant to Item 7 of Schedule 14A under the Securities Exchange Act of 1934, as<br />
amended <strong>and</strong> to Note 14 of the Notes to Financial Statements on page 123 of the <strong>FERC</strong><br />
<strong>Form</strong> 1, which describes certain material related party agreements <strong>and</strong> transactions.<br />
A copy of the proxy statement is attached.<br />
11. Reserved<br />
12. If the important changes during the year relating to the respondent company appearing<br />
in the annual report to stockholders are applicable in every respect <strong>and</strong> furnish the<br />
data required by instructions to 1 to 11 above, such notes may be included on this<br />
page.<br />
Four copies of PG&E Corporation’s <strong>and</strong> <strong>Pacific</strong> <strong>Gas</strong> <strong>and</strong> <strong>Electric</strong> <strong>Company</strong>’s combined<br />
Annual Report on <strong>Form</strong> 10-K for the year ended December 31, <strong>2010</strong>, <strong>and</strong> four copies of<br />
PG&E Corporation <strong>and</strong> <strong>Pacific</strong> <strong>Gas</strong> <strong>and</strong> <strong>Electric</strong> <strong>Company</strong>’s joint <strong>2010</strong> Annual Report To<br />
Shareholders have been filed in accordance with Instruction III(b) of the<br />
Instructions for Filing the <strong>FERC</strong> <strong>Form</strong> No. 1.<br />
13. Describe fully any changes in officers, directors, major security holders <strong>and</strong> voting<br />
powers of the respondent that may have occurred during the reporting period:<br />
Directors<br />
The following individual was elected as a director of the Utility:<br />
• Christopher P. Johns<br />
Officers<br />
The following individuals were elected as officers of the Utility:<br />
• Sara A. Cherry, Vice President, Finance <strong>and</strong> Chief Financial Officer<br />
• Anil K. Suri, Vice President <strong>and</strong> Chief Risk <strong>and</strong> Audit Officer<br />
• M. Kirk Johnson, Vice President, <strong>Gas</strong> Engineering <strong>and</strong> Operations<br />
• Janet C. Loduca, Vice President, Corporate Relations<br />
The following officers’ titles changed:<br />
• Stephen J. Cairns, Vice President, Internal Audit <strong>and</strong> Compliance (formerly Vice<br />
President <strong>and</strong> Controller)<br />
• William D. Hayes, Vice President, <strong>Gas</strong> Maintenance <strong>and</strong> Construction (formerly Vice<br />
President, Maintenance <strong>and</strong> Construction)<br />
• Dinyar B. Mistry, Vice President <strong>and</strong> Controller (formerly Vice President <strong>and</strong> Chief<br />
<strong>FERC</strong> FORM NO. 1 (ED. 12-96) Page 109.5
Name of Respondent<br />
PACIFIC GAS AND ELECTRIC COMPANY<br />
This Report is:<br />
(1) X An Original<br />
(2) A Resubmission<br />
Date of Report<br />
(Mo, Da, Yr)<br />
04/08/2011<br />
Year/Period of Report<br />
<strong>2010</strong>/Q4<br />
IMPORTANT CHANGES DURING THE QUARTER/YEAR (Continued)<br />
Risk <strong>and</strong> Audit Officer)<br />
• Mark S. Johnson, Vice President, <strong>Electric</strong> Transmission, Planning <strong>and</strong> Engineering<br />
(formerly Vice President, <strong>Electric</strong> Operations <strong>and</strong> Engineering)<br />
• R<strong>and</strong>al S. Livingston, Vice President, <strong>Gas</strong> Transmission Programs (formerly Vice<br />
President, Power Generation)<br />
• Placido J. Martinez, Vice President, <strong>Electric</strong> Distribution, Planning <strong>and</strong><br />
Engineering (formerly Vice President, Engineering)<br />
• Gregory K. Kiraly, Vice President, SmartMeter Operations (formerly Vice President,<br />
<strong>Electric</strong> Maintenance <strong>and</strong> Construction)<br />
The following individual is no longer an officer of the Utility:<br />
• Barbara L. Barcon, Vice President, Finance <strong>and</strong> Chief Financial Officer<br />
Major Security Holders<br />
Changes to the major holders of the Utility’s First Preferred Stock are as follows:<br />
• Cede & Co., P.O. Box 20, Bowling Green Station, New York, NY 10004-9998, increased<br />
its share ownership from 9,113,478 shares as of September 30, <strong>2010</strong> to 9,142,905<br />
shares as of December 31, <strong>2010</strong> (approximately 89% of the total preferred shares<br />
outst<strong>and</strong>ing).<br />
• John R Vaughn & Shirley M Vaughn TR UA Oct 18 93 John & Shirley Vaughn Living<br />
Trust, Box 1125, Grovel<strong>and</strong>, CA 95321-1125 are major shareholders with 12,000<br />
shares of preferred stock.<br />
• Elena E. Skidmore, 2826 N. Ridge Rd Lot 24, Perry, OH 44081-9524, is no longer a<br />
major shareholder.<br />
Dividend Payments<br />
Refer to Note 6, Common Stock, of the Notes to Financial Statements on page 123 of<br />
the <strong>FERC</strong> <strong>Form</strong> 1.<br />
14. If respondent participates in a cash management program, describe the significant<br />
events or transactions causing the proprietary capital to be less than 30 percent,<br />
<strong>and</strong> the extent to which respondent has amounts loaned or money advanced to its<br />
parent, subsidiary, or affiliated companies. Also, describe any plans to regain at<br />
least a 30 percent proprietary ratio:<br />
Not applicable.<br />
<strong>FERC</strong> FORM NO. 1 (ED. 12-96) Page 109.6
Name of Respondent<br />
This Report Is:<br />
Date of Report Year/Period of Report<br />
(1) X An Original<br />
(Mo, Da, Yr)<br />
PACIFIC GAS AND ELECTRIC COMPANY<br />
(2) A Resubmission<br />
04/08/2011 End of <strong>2010</strong>/Q4<br />
COMPARATIVE BALANCE SHEET (ASSETS AND OTHER DEBITS)<br />
Line<br />
No.<br />
1<br />
2<br />
3<br />
4<br />
5<br />
6<br />
7<br />
8<br />
9<br />
10<br />
11<br />
12<br />
13<br />
14<br />
15<br />
16<br />
17<br />
18<br />
19<br />
20<br />
21<br />
22<br />
23<br />
24<br />
25<br />
26<br />
27<br />
28<br />
29<br />
30<br />
31<br />
32<br />
33<br />
34<br />
35<br />
36<br />
37<br />
38<br />
39<br />
40<br />
41<br />
42<br />
43<br />
44<br />
45<br />
46<br />
47<br />
48<br />
49<br />
50<br />
51<br />
52<br />
Title of Account<br />
(a)<br />
UTILITY PLANT<br />
Utility Plant (101-106, 114)<br />
Construction Work in Progress (107)<br />
TOTAL Utility Plant (Enter Total of lines 2 <strong>and</strong> 3)<br />
(Less) Accum. Prov. for Depr. Amort. Depl. (108, 110, 111, 115)<br />
Net Utility Plant (Enter Total of line 4 less 5)<br />
Nuclear Fuel in Process of Ref., Conv.,Enrich., <strong>and</strong> Fab. (120.1)<br />
Nuclear Fuel Materials <strong>and</strong> Assemblies-Stock Account (120.2)<br />
Nuclear Fuel Assemblies in Reactor (120.3)<br />
Spent Nuclear Fuel (120.4)<br />
Nuclear Fuel Under Capital Leases (120.6)<br />
(Less) Accum. Prov. for Amort. of Nucl. Fuel Assemblies (120.5)<br />
Net Nuclear Fuel (Enter Total of lines 7-11 less 12)<br />
Net Utility Plant (Enter Total of lines 6 <strong>and</strong> 13)<br />
Utility Plant Adjustments (116)<br />
<strong>Gas</strong> Stored Underground - Noncurrent (117)<br />
OTHER PROPERTY AND INVESTMENTS<br />
Nonutility Property (121)<br />
(Less) Accum. Prov. for Depr. <strong>and</strong> Amort. (122)<br />
Investments in Associated Companies (123)<br />
Investment in Subsidiary Companies (123.1)<br />
(For Cost of Account 123.1, See Footnote Page 224, line 42)<br />
Noncurrent Portion of Allowances<br />
Other Investments (124)<br />
Sinking Funds (125)<br />
Depreciation Fund (126)<br />
Amortization Fund - Federal (127)<br />
Other Special Funds (128)<br />
Special Funds (Non Major Only) (129)<br />
Long-Term Portion of Derivative Assets (175)<br />
Long-Term Portion of Derivative Assets – Hedges (176)<br />
TOTAL Other Property <strong>and</strong> Investments (Lines 18-21 <strong>and</strong> 23-31)<br />
CURRENT AND ACCRUED ASSETS<br />
Cash <strong>and</strong> Working Funds (Non-major Only) (130)<br />
Cash (131)<br />
Special Deposits (132-134)<br />
Working Fund (135)<br />
Temporary Cash Investments (136)<br />
Notes Receivable (141)<br />
Customer Accounts Receivable (142)<br />
Other Accounts Receivable (143)<br />
(Less) Accum. Prov. for Uncollectible Acct.-Credit (144)<br />
Notes Receivable from Associated Companies (145)<br />
Accounts Receivable from Assoc. Companies (146)<br />
Fuel Stock (151)<br />
Fuel Stock Expenses Undistributed (152)<br />
Residuals (Elec) <strong>and</strong> Extracted Products (153)<br />
Plant Materials <strong>and</strong> Operating Supplies (154)<br />
Merch<strong>and</strong>ise (155)<br />
Other Materials <strong>and</strong> Supplies (156)<br />
Nuclear Materials Held for Sale (157)<br />
Allowances (158.1 <strong>and</strong> 158.2)<br />
Ref.<br />
Page No.<br />
(b)<br />
200-201<br />
200-201<br />
200-201<br />
202-203<br />
202-203<br />
224-225<br />
228-229<br />
227<br />
227<br />
227<br />
227<br />
227<br />
227<br />
202-203/227<br />
228-229<br />
Current Year<br />
End of Quarter/Year<br />
Balance<br />
(c)<br />
Prior Year<br />
End Balance<br />
12/31<br />
(d)<br />
51,551,661,569 47,904,159,113<br />
1,377,023,361 1,880,810,974<br />
52,928,684,930 49,784,970,087<br />
25,060,388,172 24,183,592,649<br />
27,868,296,758 25,601,377,438<br />
281,347,356 213,404,552<br />
0 0<br />
301,814,427 282,637,283<br />
1,570,143,594 1,499,757,195<br />
0 0<br />
1,697,958,450 1,612,579,237<br />
455,346,927 383,219,793<br />
28,323,643,685 25,984,597,231<br />
0 0<br />
55,601,557 54,824,273<br />
24,587,641 25,011,186<br />
0 0<br />
0 0<br />
115,151,066 133,708,094<br />
0 0<br />
3,488,597 3,602,527<br />
0 0<br />
0 0<br />
0 0<br />
2,009,045,545 1,899,001,318<br />
0 0<br />
67,059,253 59,405,376<br />
1,390,062 4,767,170<br />
2,220,722,164 2,125,495,671<br />
0 0<br />
44,435,787 49,676,271<br />
524,476,356 594,263,154<br />
126,030 144,255<br />
3,800,000 281,238,152<br />
0 0<br />
1,118,498,245 1,057,146,098<br />
1,358,186,666 1,370,842,175<br />
80,956,900 67,653,038<br />
0 0<br />
105,193,991 40,082,030<br />
1,143,343 403,420<br />
0 0<br />
0 0<br />
205,202,946 199,534,201<br />
0 0<br />
0 0<br />
0 0<br />
0 0<br />
<strong>FERC</strong> FORM NO. 1 (REV. 12-03) Page 110
Name of Respondent<br />
This Report Is:<br />
Date of Report Year/Period of Report<br />
(1) X An Original<br />
(Mo, Da, Yr)<br />
PACIFIC GAS AND ELECTRIC COMPANY<br />
(2) A Resubmission<br />
04/08/2011 End of <strong>2010</strong>/Q4<br />
COMPARATIVE BALANCE SHEET (ASSETS AND OTHER DEBITS) (Continued)<br />
Line<br />
No.<br />
53<br />
54<br />
55<br />
56<br />
57<br />
58<br />
59<br />
60<br />
61<br />
62<br />
63<br />
64<br />
65<br />
66<br />
67<br />
68<br />
69<br />
70<br />
71<br />
72<br />
73<br />
74<br />
75<br />
76<br />
77<br />
78<br />
79<br />
80<br />
81<br />
82<br />
83<br />
84<br />
85<br />
Title of Account<br />
(a)<br />
(Less) Noncurrent Portion of Allowances<br />
Stores Expense Undistributed (163)<br />
<strong>Gas</strong> Stored Underground - Current (164.1)<br />
Liquefied Natural <strong>Gas</strong> Stored <strong>and</strong> Held for Processing (164.2-164.3)<br />
Prepayments (165)<br />
Advances for <strong>Gas</strong> (166-167)<br />
Interest <strong>and</strong> Dividends Receivable (171)<br />
Rents Receivable (172)<br />
Accrued Utility Revenues (173)<br />
Miscellaneous Current <strong>and</strong> Accrued Assets (174)<br />
Derivative Instrument Assets (175)<br />
(Less) Long-Term Portion of Derivative Instrument Assets (175)<br />
Derivative Instrument Assets - Hedges (176)<br />
(Less) Long-Term Portion of Derivative Instrument Assets - Hedges (176<br />
Total Current <strong>and</strong> Accrued Assets (Lines 34 through 66)<br />
DEFERRED DEBITS<br />
Unamortized Debt Expenses (181)<br />
Extraordinary Property Losses (182.1)<br />
Unrecovered Plant <strong>and</strong> Regulatory Study Costs (182.2)<br />
Other Regulatory Assets (182.3)<br />
Prelim. Survey <strong>and</strong> Investigation Charges (<strong>Electric</strong>) (183)<br />
Preliminary Natural <strong>Gas</strong> Survey <strong>and</strong> Investigation Charges 183.1)<br />
Other Preliminary Survey <strong>and</strong> Investigation Charges (183.2)<br />
Clearing Accounts (184)<br />
Temporary Facilities (185)<br />
Miscellaneous Deferred Debits (186)<br />
Def. Losses from Disposition of Utility Plt. (187)<br />
Research, Devel. <strong>and</strong> Demonstration Expend. (188)<br />
Unamortized Loss on Reaquired Debt (189)<br />
Accumulated Deferred Income Taxes (190)<br />
Unrecovered Purchased <strong>Gas</strong> Costs (191)<br />
Total Deferred Debits (lines 69 through 83)<br />
TOTAL ASSETS (lines 14-16, 32, 67, <strong>and</strong> 84)<br />
Ref.<br />
Page No.<br />
(b)<br />
227<br />
230a<br />
230b<br />
232<br />
233<br />
352-353<br />
234<br />
Current Year<br />
End of Quarter/Year<br />
Balance<br />
(c)<br />
Prior Year<br />
End Balance<br />
12/31<br />
(d)<br />
0 0<br />
0 0<br />
151,139,525 113,638,846<br />
0 0<br />
70,557,735 71,115,771<br />
0 0<br />
1,779 27,166<br />
0 0<br />
649,179,020 671,230,961<br />
446,253,293 201,593,062<br />
109,356,761 133,371,719<br />
67,059,253 59,405,376<br />
2,032,074 6,988,870<br />
1,390,062 4,767,170<br />
4,640,177,336 4,659,470,567<br />
82,785,690 77,037,490<br />
0 0<br />
0 0<br />
6,898,245,621 6,500,673,291<br />
0 0<br />
0 0<br />
0 0<br />
-42,884 0<br />
0 0<br />
36,607,942 25,012,656<br />
0 0<br />
0 0<br />
205,785,774 229,138,517<br />
1,204,703,785 798,521,555<br />
0 0<br />
8,428,085,928 7,630,383,509<br />
43,668,230,670 40,454,771,251<br />
<strong>FERC</strong> FORM NO. 1 (REV. 12-03) Page 111
Name of Respondent<br />
PACIFIC GAS AND ELECTRIC COMPANY<br />
This Report is:<br />
(1) X An Original<br />
(2) A Resubmission<br />
Date of Report<br />
(Mo, Da, Yr)<br />
04/08/2011<br />
Year/Period of Report<br />
<strong>2010</strong>/Q4<br />
FOOTNOTE DATA<br />
Schedule Page: 110 Line No.: 2 Column: c<br />
Consistent with prior periods, the amounts shown for Utility Plant in Line 2 <strong>and</strong><br />
Accumulated Depreciation in Line 5, columns c <strong>and</strong> d, are reported on a regulatory basis of<br />
accounting. They do not reflect accounting entries in the Utility’s <strong>2010</strong> <strong>and</strong> 2009 Annual<br />
Report to Stockholders in accordance with generally accepted accounting principles<br />
("GAAP"). These entries totaling $7,091,071,387 for column c <strong>and</strong> $7,085,436,368 for column<br />
d reduced in equal amounts Utility Plant <strong>and</strong> Accumulated Depreciation for the impairment<br />
of Diablo Canyon, Helms, <strong>and</strong> South Yuba generation facilities.<br />
Schedule Page: 110 Line No.: 2 Column: d<br />
Refer to the footnote for Line 2, column c.<br />
Schedule Page: 110 Line No.: 5 Column: c<br />
This line is reported on a regulatory basis of accounting as described in the footnote for<br />
Line 2. Further, it does not reflect accounting entries in the Utility’s <strong>2010</strong> Annual<br />
Report to Stockholders in accordance with GAAP, which reduced accumulated depreciation by<br />
$3,114,186,964 <strong>and</strong> increased regulatory liabilities by $3,228,952,134 <strong>and</strong> regulatory<br />
assets by $114,765,170 for removal costs that are collected or will be collected in rates<br />
through depreciation in accordance with regulatory treatment. These amounts do not<br />
represent SFAS No. 143 asset retirement obligations. Historically, these removal costs had<br />
been recorded in accumulated depreciation. However, as a result of guidance from the SEC,<br />
the Utility reclassified this obligation to a regulatory liability in its balance sheet in<br />
accordance with GAAP.<br />
Schedule Page: 110 Line No.: 5 Column: d<br />
This line is reported on a regulatory basis of accounting as described in the footnote for<br />
Line 2. Further, it does not reflect accounting entries in the Utility’s 2009 Annual<br />
Report to Stockholders in accordance with GAAP, which reduced accumulated depreciation by<br />
$2,898,850,137 <strong>and</strong> increased regulatory liabilities by $2,932,544,412 <strong>and</strong> regulatory<br />
assets by $33,694,275 for removal costs that are collected or will be collected in rates<br />
through depreciation in accordance with regulatory treatment. These amounts do not<br />
represent SFAS No. 143 asset retirement obligations. Historically, these removal costs had<br />
been recorded in accumulated depreciation. However, as a result of a guidance from the<br />
SEC, the Utility reclassified this obligation to a regulatory liability in its balance<br />
sheet in accordance with GAAP.<br />
Schedule Page: 110 Line No.: 72 Column: c<br />
Refer to the footnote for Line 5, column c on page 110.<br />
Schedule Page: 110 Line No.: 72 Column: d<br />
Refer to the footnote for Line 5, column d on page 110.<br />
<strong>FERC</strong> FORM NO. 1 (ED. 12-87) Page 450.1
Name of Respondent<br />
PACIFIC GAS AND ELECTRIC COMPANY<br />
Line<br />
No.<br />
Title of Account<br />
(a)<br />
This Report is:<br />
(1) x An Original<br />
(2) A Resubmission<br />
COMPARATIVE BALANCE SHEET (LIABILITIES AND OTHER CREDITS)<br />
Date of Report Year/Period of Report<br />
(mo, da, yr)<br />
04/08/2011 end of <strong>2010</strong>/Q4<br />
Ref.<br />
Page No.<br />
(b)<br />
1 PROPRIETARY CAPITAL<br />
2 Common Stock Issued (201)<br />
250-251<br />
3 Preferred Stock Issued (204)<br />
250-251<br />
4 Capital Stock Subscribed (202, 205)<br />
5 Stock Liability for Conversion (203, 206)<br />
6 Premium on Capital Stock (207)<br />
7 Other Paid-In Capital (208-211)<br />
253<br />
8 Installments Received on Capital Stock (212)<br />
252<br />
9 (Less) Discount on Capital Stock (213)<br />
254<br />
10 (Less) Capital Stock Expense (214)<br />
254b<br />
11 Retained Earnings (215, 215.1, 216)<br />
118-119<br />
12 Unappropriated Undistributed Subsidiary Earnings (216.1)<br />
118-119<br />
13 (Less) Reaquired Capital Stock (217)<br />
250-251<br />
14 Noncorporate Proprietorship (Non-major only) (218)<br />
15 Accumulated Other Comprehensive Income (219)<br />
122(a)(b)<br />
16 Total Proprietary Capital (lines 2 through 15)<br />
17 LONG-TERM DEBT<br />
18 Bonds (221)<br />
256-257<br />
19 (Less) Reaquired Bonds (222)<br />
256-257<br />
20 Advances from Associated Companies (223)<br />
256-257<br />
21 Other Long-Term Debt (224)<br />
256-257<br />
22 Unamortized Premium on Long-Term Debt (225)<br />
23 (Less) Unamortized Discount on Long-Term Debt-Debit (226)<br />
24 Total Long-Term Debt (lines 18 through 23)<br />
25 OTHER NONCURRENT LIABILITIES<br />
26 Obligations Under Capital Leases - Noncurrent (227)<br />
27 Accumulated Provision for Property Insurance (228.1)<br />
28 Accumulated Provision for Injuries <strong>and</strong> Damages (228.2)<br />
29 Accumulated Provision for Pensions <strong>and</strong> Benefits (228.3)<br />
30 Accumulated Miscellaneous Operating Provisions (228.4)<br />
31 Accumulated Provision for Rate Refunds (229)<br />
32 Long-Term Portion of Derivative Instrument Liabilities<br />
33 Long-Term Portion of Derivative Instrument Liabilities - Hedges<br />
34 Asset Retirement Obligations (230)<br />
35 Total Other Noncurrent Liabilities (lines 26 through 34)<br />
36 CURRENT AND ACCRUED LIABILITIES<br />
37 Notes Payable (231)<br />
38 Accounts Payable (232)<br />
39 Notes Payable to Associated Companies (233)<br />
40 Accounts Payable to Associated Companies (234)<br />
41 Customer Deposits (235)<br />
42 Taxes Accrued (236)<br />
262-263<br />
43 Interest Accrued (237)<br />
44 Dividends Declared (238)<br />
45 Matured Long-Term Debt (239)<br />
Current Year<br />
End of Quarter/Year<br />
Balance<br />
(c)<br />
1,321,874,045<br />
257,994,575<br />
0<br />
0<br />
1,805,194,230<br />
1,471,315,126<br />
0<br />
6,916,899<br />
28,951,886<br />
7,152,022,210<br />
-56,446,867<br />
0<br />
0<br />
-194,989,625<br />
11,721,094,909<br />
11,574,970,000<br />
157,870,000<br />
835,423,939<br />
0<br />
9,231,288<br />
60,352,757<br />
12,201,402,470<br />
248,172,000<br />
0<br />
551,806,111<br />
2,174,470,892<br />
698,843,330<br />
0<br />
478,132,160<br />
0<br />
1,585,815,096<br />
5,737,239,589<br />
853,033,000<br />
2,247,948,817<br />
0<br />
27,299,951<br />
208,541,524<br />
139,808,619<br />
865,519,911<br />
2,319,386<br />
0<br />
Prior Year<br />
End Balance<br />
12/31<br />
(d)<br />
1,321,874,045<br />
257,994,575<br />
0<br />
0<br />
1,805,194,230<br />
1,285,216,984<br />
0<br />
6,916,899<br />
28,951,886<br />
6,742,267,017<br />
-37,749,013<br />
0<br />
0<br />
-153,509,857<br />
11,185,419,196<br />
10,292,870,000<br />
130,770,000<br />
1,228,658,740<br />
0<br />
10,451,757<br />
44,288,280<br />
11,356,922,217<br />
282,061,868<br />
0<br />
346,971,093<br />
1,717,471,821<br />
699,130,593<br />
0<br />
390,940,892<br />
0<br />
1,593,221,421<br />
5,029,797,688<br />
833,000,000<br />
2,104,495,952<br />
0<br />
28,497,220<br />
232,465,911<br />
239,620,508<br />
823,404,848<br />
2,319,386<br />
0<br />
<strong>FERC</strong> FORM NO. 1 (rev. 12-03) Page 112
Name of Respondent<br />
PACIFIC GAS AND ELECTRIC COMPANY<br />
Line<br />
No.<br />
Title of Account<br />
(a)<br />
This Report is:<br />
(1) x An Original<br />
(2) A Resubmission<br />
Date of Report Year/Period of Report<br />
(mo, da, yr)<br />
04/08/2011 end of <strong>2010</strong>/Q4<br />
COMPARATIVE BALANCE SHEET (LIABILITIES AND OTHER CREDITS) (continued)<br />
Ref.<br />
Page No.<br />
(b)<br />
46 Matured Interest (240)<br />
47 Tax Collections Payable (241)<br />
48 Miscellaneous Current <strong>and</strong> Accrued Liabilities (242)<br />
49 Obligations Under Capital Leases-Current (243)<br />
50 Derivative Instrument Liabilities (244)<br />
51 (Less) Long-Term Portion of Derivative Instrument Liabilities<br />
52 Derivative Instrument Liabilities - Hedges (245)<br />
53 (Less) Long-Term Portion of Derivative Instrument Liabilities-Hedges<br />
54 Total Current <strong>and</strong> Accrued Liabilities (lines 37 through 53)<br />
55 DEFERRED CREDITS<br />
56 Customer Advances for Construction (252)<br />
57 Accumulated Deferred Investment Tax Credits (255)<br />
266-267<br />
58 Deferred Gains from Disposition of Utility Plant (256)<br />
59 Other Deferred Credits (253)<br />
269<br />
60 Other Regulatory Liabilities (254)<br />
278<br />
61 Unamortized Gain on Reaquired Debt (257)<br />
62 Accum. Deferred Income Taxes-Accel. Amort.(281)<br />
272-277<br />
63 Accum. Deferred Income Taxes-Other Property (282)<br />
64 Accum. Deferred Income Taxes-Other (283)<br />
65 Total Deferred Credits (lines 56 through 64)<br />
66 TOTAL LIABILITIES AND STOCKHOLDER EQUITY (lines 16, 24, 35, 54 <strong>and</strong> 65)<br />
Current Year<br />
End of Quarter/Year<br />
Balance<br />
(c)<br />
0<br />
33,810,228<br />
386,287,937<br />
33,889,732<br />
853,743,310<br />
478,132,160<br />
0<br />
0<br />
5,174,070,255<br />
174,590,245<br />
86,901,904<br />
0<br />
291,224,347<br />
1,297,388,735<br />
2,118,462<br />
1,114,030,466<br />
5,747,788,152<br />
120,381,136<br />
8,834,423,447<br />
43,668,230,670<br />
Prior Year<br />
End Balance<br />
12/31<br />
(d)<br />
0<br />
27,824,887<br />
501,942,009<br />
31,976,884<br />
622,506,229<br />
390,940,892<br />
0<br />
0<br />
5,057,112,942<br />
187,490,351<br />
88,731,266<br />
0<br />
350,483,973<br />
1,299,060,254<br />
2,357,210<br />
1,105,025,558<br />
4,458,577,370<br />
333,793,226<br />
7,825,519,208<br />
40,454,771,251<br />
<strong>FERC</strong> FORM NO. 1 (rev. 12-03) Page 113
Name of Respondent<br />
PACIFIC GAS AND ELECTRIC COMPANY<br />
This Report is:<br />
(1) X An Original<br />
(2) A Resubmission<br />
Date of Report<br />
(Mo, Da, Yr)<br />
04/08/2011<br />
Year/Period of Report<br />
<strong>2010</strong>/Q4<br />
FOOTNOTE DATA<br />
Schedule Page: 112 Line No.: 38 Column: c<br />
Includes pre-petition Accounts Payable of $745,225,951 <strong>and</strong> $772,750,084 for columns c <strong>and</strong><br />
d, respectively, which are classified as Accounts Payable - Disputed claims <strong>and</strong> customer<br />
refunds in the Utility's balance sheet prepared on a GAAP basis of accounting.<br />
Schedule Page: 112 Line No.: 38 Column: d<br />
Refer to the footnote for Line 38, column c.<br />
Schedule Page: 112 Line No.: 60 Column: c<br />
Refer to the footnote for Line 5, column c on page 110.<br />
Schedule Page: 112 Line No.: 60 Column: d<br />
Refer to the footnote for Line 5, column d on page 110.<br />
<strong>FERC</strong> FORM NO. 1 (ED. 12-87) Page 450.1
Name of Respondent<br />
PACIFIC GAS AND ELECTRIC COMPANY<br />
Line<br />
No.<br />
Title of Account<br />
(a)<br />
UTILITY OPERATING INCOME<br />
This Report Is:<br />
(1) X An Original<br />
(2) A Resubmission<br />
STATEMENT OF INCOME<br />
(Ref.)<br />
Page No.<br />
(b)<br />
Total<br />
Current Year to<br />
Date Balance for<br />
Quarter/Year<br />
(c)<br />
Date of Report<br />
(Mo, Da, Yr)<br />
04/08/2011<br />
Total<br />
Prior Year to<br />
Date Balance for<br />
Quarter/Year<br />
(d)<br />
Year/Period of Report<br />
End of <strong>2010</strong>/Q4<br />
Quarterly<br />
1. Report in column (c) the current year to date balance. Column (c) equals the total of adding the data in column (g) plus the data in column (i) plus the<br />
data in column (k). Report in column (d) similar data for the previous year. This information is reported in the annual filing only.<br />
2. Enter in column (e) the balance for the reporting quarter <strong>and</strong> in column (f) the balance for the same three month period for the prior year.<br />
3. Report in column (g) the quarter to date amounts for electric utility function; in column (i) the quarter to date amounts for gas utility, <strong>and</strong> in column (k)<br />
the quarter to date amounts for other utility function for the current year quarter.<br />
4. Report in column (h) the quarter to date amounts for electric utility function; in column (j) the quarter to date amounts for gas utility, <strong>and</strong> in column (l)<br />
the quarter to date amounts for other utility function for the prior year quarter.<br />
5. If additional columns are needed, place them in a footnote.<br />
Annual or Quarterly if applicable<br />
5. Do not report fourth quarter data in columns (e) <strong>and</strong> (f)<br />
6. Report amounts for accounts 412 <strong>and</strong> 413, Revenues <strong>and</strong> Expenses from Utility Plant Leased to Others, in another utility columnin a similar manner to<br />
a utility department. Spread the amount(s) over lines 2 thru 26 as appropriate. Include these amounts in columns (c) <strong>and</strong> (d) totals.<br />
7. Report amounts in account 414, Other Utility Operating Income, in the same manner as accounts 412 <strong>and</strong> 413 above.<br />
1<br />
2<br />
3<br />
Operating Revenues (400)<br />
Operating Expenses<br />
4 Operation Expenses (401)<br />
5 Maintenance Expenses (402)<br />
6 Depreciation Expense (403)<br />
7 Depreciation Expense for Asset Retirement Costs (403.1)<br />
8 Amort. & Depl. of Utility Plant (404-405)<br />
9 Amort. of Utility Plant Acq. Adj. (406)<br />
10<br />
Amort. Property Losses, Unrecov Plant <strong>and</strong> Regulatory Study Costs (407)<br />
11 Amort. of Conversion Expenses (407)<br />
12 Regulatory Debits (407.3)<br />
13 (Less) Regulatory Credits (407.4)<br />
14 Taxes Other Than Income Taxes (408.1)<br />
15 Income Taxes - Federal (409.1)<br />
16 - Other (409.1)<br />
17 Provision for Deferred Income Taxes (410.1)<br />
18 (Less) Provision for Deferred Income Taxes-Cr. (411.1)<br />
19 Investment Tax Credit Adj. - Net (411.4)<br />
20 (Less) Gains from Disp. of Utility Plant (411.6)<br />
21 Losses from Disp. of Utility Plant (411.7)<br />
22 (Less) Gains from Disposition of Allowances (411.8)<br />
23<br />
Losses from Disposition of Allowances (411.9)<br />
24 Accretion Expense (411.10)<br />
25 TOTAL Utility Operating Expenses (Enter Total of lines 4 thru 24)<br />
26 Net Util Oper Inc (Enter Tot line 2 less 25) Carry to Pg117,line 27<br />
300-301<br />
320-323<br />
320-323<br />
336-337<br />
336-337<br />
336-337<br />
336-337<br />
262-263<br />
262-263<br />
262-263<br />
234, 272-277<br />
234, 272-277<br />
266<br />
14,047,926,654 13,581,518,250<br />
8,565,389,378 8,304,949,297<br />
741,807,721 779,586,105<br />
1,340,829,045 1,235,452,361<br />
168,490,264 153,068,563<br />
396,651,034 352,745,485<br />
-63 339,809<br />
364,857,677 357,636,341<br />
-28,506,846 -583,723,565<br />
138,182,731 -35,256,248<br />
1,412,672,694 -194,984,540<br />
885,198,948 -1,422,763,922<br />
1,541,206 114,142<br />
17,916 333,738<br />
12,213,615,691 11,791,450,032<br />
1,834,310,963 1,790,068,218<br />
Current 3 Months<br />
Ended<br />
Quarterly Only<br />
No 4th Quarter<br />
(e)<br />
Prior 3 Months<br />
Ended<br />
Quarterly Only<br />
No 4th Quarter<br />
(f)<br />
<strong>FERC</strong> FORM NO. 1/3-Q (REV. 02-04) Page 114
Name of Respondent<br />
PACIFIC GAS AND ELECTRIC COMPANY<br />
This Report Is:<br />
Date of Report<br />
(1) X An Original<br />
(Mo, Da, Yr)<br />
(2) A Resubmission<br />
04/08/2011<br />
STATEMENT OF INCOME FOR THE YEAR (Continued)<br />
Year/Period of Report<br />
End of <strong>2010</strong>/Q4<br />
9. Use page 122 for important notes regarding the statement of income for any account thereof.<br />
10. Give concise explanations concerning unsettled rate proceedings where a contingency exists such that refunds of a material amount may need to be<br />
made to the utility's customers or which may result in material refund to the utility with respect to power or gas purchases. State for each year effected<br />
the gross revenues or costs to which the contingency relates <strong>and</strong> the tax effects together with an explanation of the major factors which affect the rights<br />
of the utility to retain such revenues or recover amounts paid with respect to power or gas purchases.<br />
11 Give concise explanations concerning significant amounts of any refunds made or received during the year resulting from settlement of any rate<br />
proceeding affecting revenues received or costs incurred for power or gas purches, <strong>and</strong> a summary of the adjustments made to balance sheet, income,<br />
<strong>and</strong> expense accounts.<br />
12. If any notes appearing in the report to stokholders are applicable to the Statement of Income, such notes may be included at page 122.<br />
13. Enter on page 122 a concise explanation of only those changes in accounting methods made during the year which had an effect on net income,<br />
including the basis of allocations <strong>and</strong> apportionments from those used in the preceding year. Also, give the appropriate dollar effect of such changes.<br />
14. Explain in a footnote if the previous year's/quarter's figures are different from that reported in prior reports.<br />
15. If the columns are insufficient for reporting additional utility departments, supply the appropriate account titles report the information in a footnote to<br />
this schedule.<br />
ELECTRIC UTILITY<br />
GAS UTILITY<br />
OTHER UTILITY<br />
Current Year to Date Previous Year to Date Current Year to Date Previous Year to Date Current Year to Date Previous Year to Date Line<br />
(in dollars)<br />
(in dollars)<br />
(in dollars)<br />
(in dollars)<br />
(in dollars)<br />
(in dollars)<br />
No.<br />
(g)<br />
(h)<br />
(i)<br />
(j)<br />
(k)<br />
(l)<br />
1<br />
10,706,164,801 10,307,526,947 3,341,761,853 3,273,991,303<br />
2<br />
3<br />
6,183,144,147 6,121,031,886 2,382,245,231 2,183,917,411<br />
4<br />
600,193,101 611,428,529 141,614,620<br />
168,157,576<br />
5<br />
1,003,132,970 917,938,487 337,696,075<br />
317,513,874<br />
6<br />
7<br />
135,064,742 123,405,745 33,425,522<br />
29,662,818<br />
8<br />
9<br />
10<br />
11<br />
395,409,117 352,745,485 1,241,917<br />
12<br />
-63 339,809 13<br />
286,256,380 277,589,276 78,601,297<br />
80,047,065<br />
14<br />
-17,814,651 -493,161,635 -10,692,195<br />
-90,561,930<br />
15<br />
40,969,983 -4,636,442 97,212,748<br />
-30,619,806<br />
16<br />
1,017,479,838 -96,156,146 395,192,856<br />
-98,828,394<br />
17<br />
505,776,896 -1,067,776,232 379,422,052<br />
-354,987,690<br />
18<br />
19<br />
1,190,142 114,142 351,064<br />
20<br />
21<br />
17,916 333,738 22<br />
23<br />
24<br />
9,136,850,736 8,877,173,728 3,076,764,955 2,914,276,304<br />
25<br />
1,569,314,065 1,430,353,219 264,996,898<br />
359,714,999<br />
26<br />
<strong>FERC</strong> FORM NO. 1 (ED. 12-96) Page 115
Name of Respondent<br />
PACIFIC GAS AND ELECTRIC COMPANY<br />
Line<br />
No.<br />
Title of Account<br />
(a)<br />
This Report Is:<br />
(1) X An Original<br />
Date of Report<br />
(Mo, Da, Yr)<br />
(2) A Resubmission<br />
04/08/2011<br />
STATEMENT OF INCOME FOR THE YEAR (continued)<br />
TOTAL<br />
(Ref.)<br />
Page No. Current Year Previous Year<br />
(b)<br />
(c)<br />
(d)<br />
Year/Period of Report<br />
End of <strong>2010</strong>/Q4<br />
Current 3 Months<br />
Ended<br />
Quarterly Only<br />
No 4th Quarter<br />
(e)<br />
Prior 3 Months<br />
Ended<br />
Quarterly Only<br />
No 4th Quarter<br />
(f)<br />
27<br />
28<br />
29<br />
30<br />
31<br />
32<br />
33<br />
34<br />
35<br />
36<br />
37<br />
38<br />
39<br />
40<br />
41<br />
42<br />
43<br />
44<br />
45<br />
46<br />
47<br />
48<br />
49<br />
50<br />
51<br />
52<br />
53<br />
54<br />
55<br />
56<br />
57<br />
58<br />
59<br />
60<br />
61<br />
62<br />
63<br />
64<br />
65<br />
66<br />
67<br />
68<br />
69<br />
70<br />
71<br />
72<br />
73<br />
74<br />
75<br />
76<br />
77<br />
78<br />
Net Utility Operating Income (Carried forward from page 114)<br />
Other Income <strong>and</strong> Deductions<br />
Other Income<br />
Nonutilty Operating Income<br />
Revenues From Merch<strong>and</strong>ising, Jobbing <strong>and</strong> Contract Work (415)<br />
(Less) Costs <strong>and</strong> Exp. of Merch<strong>and</strong>ising, Job. & Contract Work (416)<br />
Revenues From Nonutility Operations (417)<br />
(Less) Expenses of Nonutility Operations (417.1)<br />
Nonoperating Rental Income (418)<br />
Equity in Earnings of Subsidiary Companies (418.1)<br />
Interest <strong>and</strong> Dividend Income (419)<br />
Allowance for Other Funds Used During Construction (419.1)<br />
Miscellaneous Nonoperating Income (421)<br />
Gain on Disposition of Property (421.1)<br />
TOTAL Other Income (Enter Total of lines 31 thru 40)<br />
Other Income Deductions<br />
Loss on Disposition of Property (421.2)<br />
Miscellaneous Amortization (425)<br />
Donations (426.1)<br />
Life Insurance (426.2)<br />
Penalties (426.3)<br />
Exp. for Certain Civic, Political & Related Activities (426.4)<br />
Other Deductions (426.5)<br />
TOTAL Other Income Deductions (Total of lines 43 thru 49)<br />
Taxes Applic. to Other Income <strong>and</strong> Deductions<br />
Taxes Other Than Income Taxes (408.2)<br />
Income Taxes-Federal (409.2)<br />
Income Taxes-Other (409.2)<br />
Provision for Deferred Inc. Taxes (410.2)<br />
(Less) Provision for Deferred Income Taxes-Cr. (411.2)<br />
Investment Tax Credit Adj.-Net (411.5)<br />
(Less) Investment Tax Credits (420)<br />
TOTAL Taxes on Other Income <strong>and</strong> Deductions (Total of lines 52-58)<br />
Net Other Income <strong>and</strong> Deductions (Total of lines 41, 50, 59)<br />
Interest Charges<br />
Interest on Long-Term Debt (427)<br />
Amort. of Debt Disc. <strong>and</strong> Expense (428)<br />
Amortization of Loss on Reaquired Debt (428.1)<br />
(Less) Amort. of Premium on Debt-Credit (429)<br />
(Less) Amortization of Gain on Reaquired Debt-Credit (429.1)<br />
Interest on Debt to Assoc. Companies (430)<br />
Other Interest Expense (431)<br />
(Less) Allowance for Borrowed Funds Used During Construction-Cr. (432)<br />
Net Interest Charges (Total of lines 62 thru 69)<br />
Income Before Extraordinary Items (Total of lines 27, 60 <strong>and</strong> 70)<br />
Extraordinary Items<br />
Extraordinary Income (434)<br />
(Less) Extraordinary Deductions (435)<br />
Net Extraordinary Items (Total of line 73 less line 74)<br />
Income Taxes-Federal <strong>and</strong> Other (409.3)<br />
Extraordinary Items After Taxes (line 75 less line 76)<br />
Net Income (Total of line 71 <strong>and</strong> 77)<br />
119<br />
262-263<br />
262-263<br />
262-263<br />
234, 272-277<br />
234, 272-277<br />
262-263<br />
1,834,310,963 1,790,068,218<br />
754,262 433,416<br />
2,559,093 2,559,093<br />
-17,426,049 -8,444,978<br />
8,529,707 32,170,116<br />
109,912,938 95,257,573<br />
27,550,069 40,384,368<br />
4,522,526 235,971<br />
134,894,022 161,728,727<br />
144,635 144,635<br />
26,394,691 21,013,586<br />
8,874,433 37,355<br />
61,104,624 13,999,980<br />
170,887,068 133,665,739<br />
267,405,451 168,861,295<br />
307,415 278,058<br />
-4,780,586 19,975,159<br />
-4,297,798 -9,695,357<br />
-18,948,658 -1,534,209<br />
8,534,545 -1,789,810<br />
-4,664,829 -4,932,000<br />
-40,919,001 5,881,461<br />
-91,592,428 -13,014,029<br />
563,459,250 515,739,699<br />
25,683,948 24,341,572<br />
24,097,306 25,622,330<br />
1,220,470 1,220,470<br />
238,748 238,748<br />
44,740,932 66,008,284<br />
15,413,510 -59,564,513<br />
50,190,897 43,637,633<br />
621,744,831 527,050,521<br />
1,120,973,704 1,250,003,668<br />
1,120,973,704 1,250,003,668<br />
<strong>FERC</strong> FORM NO. 1/3-Q (REV. 02-04) Page 117
Name of Respondent<br />
PACIFIC GAS AND ELECTRIC COMPANY<br />
This Report is:<br />
(1) X An Original<br />
(2) A Resubmission<br />
Date of Report<br />
(Mo, Da, Yr)<br />
04/08/2011<br />
Year/Period of Report<br />
<strong>2010</strong>/Q4<br />
FOOTNOTE DATA<br />
Schedule Page: 114 Line No.: 2 Column: c<br />
Includes interdepartmental operating revenues in Line 2 <strong>and</strong> operations expenses in Line 4<br />
from electric <strong>and</strong> gas operations:<br />
Twelve Months Ended<br />
Twelve Months Ended<br />
December 31, <strong>2010</strong> December 31, 2009<br />
Revenues Expenses Revenues Expenses<br />
<strong>Electric</strong> $ 22,540,420 $123,351,684 $ 18,740,759 $120,463,882<br />
<strong>Gas</strong> 122,014,454 21,203,190 119,824,594 18,101,471<br />
------------ ------------ ------------ ------------<br />
Total $144,554,874 $144,554,874 $138,565,353 $138,565,353<br />
=========== ============ ============ ============<br />
Schedule Page: 114 Line No.: 4 Column: c<br />
Refer to the footnote for Line 2, column c.<br />
<strong>FERC</strong> FORM NO. 1 (ED. 12-87) Page 450.1
Name of Respondent<br />
PACIFIC GAS AND ELECTRIC COMPANY<br />
This Report Is:<br />
Date of Report<br />
(1) X An Original<br />
(Mo, Da, Yr)<br />
(2) A Resubmission<br />
04/08/2011<br />
STATEMENT OF RETAINED EARNINGS<br />
Year/Period of Report<br />
End of<br />
<strong>2010</strong>/Q4<br />
1. Do not report Lines 49-53 on the quarterly version.<br />
2. Report all changes in appropriated retained earnings, unappropriated retained earnings, year to date, <strong>and</strong> unappropriated<br />
undistributed subsidiary earnings for the year.<br />
3. Each credit <strong>and</strong> debit during the year should be identified as to the retained earnings account in which recorded (Accounts 433, 436<br />
- 439 inclusive). Show the contra primary account affected in column (b)<br />
4. State the purpose <strong>and</strong> amount of each reservation or appropriation of retained earnings.<br />
5. List first account 439, Adjustments to Retained Earnings, reflecting adjustments to the opening balance of retained earnings. Follow<br />
by credit, then debit items in that order.<br />
6. Show dividends for each class <strong>and</strong> series of capital stock.<br />
7. Show separately the State <strong>and</strong> Federal income tax effect of items shown in account 439, Adjustments to Retained Earnings.<br />
8. Explain in a footnote the basis for determining the amount reserved or appropriated. If such reservation or appropriation is to be<br />
recurrent, state the number <strong>and</strong> annual amounts to be reserved or appropriated as well as the totals eventually to be accumulated.<br />
9. If any notes appearing in the report to stockholders are applicable to this statement, include them on pages 122-123.<br />
Line<br />
No.<br />
Item<br />
(a)<br />
Contra Primary<br />
Account Affected<br />
(b)<br />
Current<br />
Quarter/Year<br />
Year to Date<br />
Balance<br />
(c)<br />
Previous<br />
Quarter/Year<br />
Year to Date<br />
Balance<br />
(d)<br />
UNAPPROPRIATED RETAINED EARNINGS (Account 216)<br />
1 Balance-Beginning of Period<br />
2 Changes<br />
3 Adjustments to Retained Earnings (Account 439)<br />
4<br />
5<br />
6<br />
7<br />
8<br />
9 TOTAL Credits to Retained Earnings (Acct. 439)<br />
10<br />
11<br />
12<br />
13<br />
14<br />
15 TOTAL Debits to Retained Earnings (Acct. 439)<br />
16 Balance Transferred from Income (Account 433 less Account 418.1)<br />
17 Appropriations of Retained Earnings (Acct. 436)<br />
18 Reserves for excess earnings on <strong>FERC</strong> hydroelectric project<br />
19 licenses pursuant to Federal Power Act Section 10(d)<br />
20<br />
21<br />
22 TOTAL Appropriations of Retained Earnings (Acct. 436)<br />
23 Dividends Declared-Preferred Stock (Account 437)<br />
24 Preferred Dividend<br />
25<br />
26<br />
27<br />
28<br />
29 TOTAL Dividends Declared-Preferred Stock (Acct. 437)<br />
30 Dividends Declared-Common Stock (Account 438)<br />
31 Common Stock Dividend<br />
32<br />
33<br />
34<br />
35<br />
36 TOTAL Dividends Declared-Common Stock (Acct. 438)<br />
37 Transfers from Acct 216.1, Unapprop. Undistrib. Subsidiary Earnings<br />
38 Balance - End of Period (Total 1,9,15,16,22,29,36,37)<br />
APPROPRIATED RETAINED EARNINGS (Account 215)<br />
39 Reserves for excess earnings on <strong>FERC</strong> hydroelectric project<br />
40 licenses pursuant to Federal Power Act Section 10(d)<br />
215<br />
6,613,952,832<br />
1,138,399,753<br />
-16,651,398<br />
-16,651,398<br />
-13,916,365<br />
-13,916,365<br />
-716,000,000<br />
-716,000,000<br />
1,271,805<br />
7,007,056,627<br />
16,651,398<br />
6,002,116,305<br />
1,258,448,646<br />
( 13,332,724)<br />
( 13,332,724)<br />
( 13,916,369)<br />
( 13,916,369)<br />
( 624,000,000)<br />
( 624,000,000)<br />
4,636,975<br />
6,613,952,833<br />
13,332,724<br />
<strong>FERC</strong> FORM NO. 1/3-Q (REV. 02-04) Page 118
Name of Respondent<br />
PACIFIC GAS AND ELECTRIC COMPANY<br />
This Report Is:<br />
Date of Report<br />
(1) X An Original<br />
(Mo, Da, Yr)<br />
(2) A Resubmission<br />
04/08/2011<br />
STATEMENT OF RETAINED EARNINGS<br />
Year/Period of Report<br />
End of<br />
<strong>2010</strong>/Q4<br />
1. Do not report Lines 49-53 on the quarterly version.<br />
2. Report all changes in appropriated retained earnings, unappropriated retained earnings, year to date, <strong>and</strong> unappropriated<br />
undistributed subsidiary earnings for the year.<br />
3. Each credit <strong>and</strong> debit during the year should be identified as to the retained earnings account in which recorded (Accounts 433, 436<br />
- 439 inclusive). Show the contra primary account affected in column (b)<br />
4. State the purpose <strong>and</strong> amount of each reservation or appropriation of retained earnings.<br />
5. List first account 439, Adjustments to Retained Earnings, reflecting adjustments to the opening balance of retained earnings. Follow<br />
by credit, then debit items in that order.<br />
6. Show dividends for each class <strong>and</strong> series of capital stock.<br />
7. Show separately the State <strong>and</strong> Federal income tax effect of items shown in account 439, Adjustments to Retained Earnings.<br />
8. Explain in a footnote the basis for determining the amount reserved or appropriated. If such reservation or appropriation is to be<br />
recurrent, state the number <strong>and</strong> annual amounts to be reserved or appropriated as well as the totals eventually to be accumulated.<br />
9. If any notes appearing in the report to stockholders are applicable to this statement, include them on pages 122-123.<br />
Line<br />
No.<br />
Item<br />
(a)<br />
Contra Primary<br />
Account Affected<br />
(b)<br />
Current<br />
Quarter/Year<br />
Year to Date<br />
Balance<br />
(c)<br />
Previous<br />
Quarter/Year<br />
Year to Date<br />
Balance<br />
(d)<br />
41<br />
42<br />
43<br />
44<br />
45 TOTAL Appropriated Retained Earnings (Account 215)<br />
APPROP. RETAINED EARNINGS - AMORT. Reserve, Federal (Account 215.1)<br />
46 TOTAL Approp. Retained Earnings-Amort. Reserve, Federal (Acct. 215.1)<br />
47 TOTAL Approp. Retained Earnings (Acct. 215, 215.1) (Total 45,46)<br />
48 TOTAL Retained Earnings (Acct. 215, 215.1, 216) (Total 38, 47) (216.1)<br />
UNAPPROPRIATED UNDISTRIBUTED SUBSIDIARY EARNINGS (Account<br />
Report only on an Annual Basis, no Quarterly<br />
49 Balance-Beginning of Year (Debit or Credit)<br />
50 Equity in Earnings for Year (Credit) (Account 418.1)<br />
51 (Less) Dividends Received (Debit)<br />
52 Other adjustments<br />
53 Balance-End of Year (Total lines 49 thru 52)<br />
16,651,398<br />
128,314,185<br />
144,965,583<br />
7,152,022,210<br />
-37,749,013<br />
-17,426,049<br />
-1,271,805<br />
-56,446,867<br />
13,332,724<br />
114,981,460<br />
128,314,184<br />
6,742,267,017<br />
( 24,667,060)<br />
( 8,444,978)<br />
( 4,636,975)<br />
( 37,749,013)<br />
<strong>FERC</strong> FORM NO. 1/3-Q (REV. 02-04) Page 119
Name of Respondent<br />
PACIFIC GAS AND ELECTRIC COMPANY<br />
This Report is:<br />
(1) X An Original<br />
(2) A Resubmission<br />
Date of Report<br />
(Mo, Da, Yr)<br />
04/08/2011<br />
Year/Period of Report<br />
<strong>2010</strong>/Q4<br />
FOOTNOTE DATA<br />
Schedule Page: 118 Line No.: 29 Column: c<br />
The following is the detail of dividends declared on First Preferred Stocks for the period<br />
ended December 31, <strong>2010</strong>:<br />
No. of Dividends Total<br />
Class of Stock Shares Per Share Declared<br />
6.00% Cumulative, Redeemable 4,211,662 $1.500 $ 6,317,514<br />
5.50% Cumulative, Redeemable 1,173,163 1.375 1,613,108<br />
5.00% Cumulative, Redeemable 400,000 1.250 500,002<br />
5.00% Cumulative, Redeemable 1,778,172 1.250 2,222,719<br />
5.00% Cumulative, Redeemable - Series A 934,322 1.250 1,167,909<br />
4.80% Cumulative, Redeemable 793,031 1.200 951,637<br />
4.50% Cumulative, Redeemable 611,142 1.125 687,538<br />
4.36% Cumulative, Redeemable 418,291 1.090 455,938<br />
-----------<br />
Total $13,916,365<br />
===========<br />
Schedule Page: 118 Line No.: 29 Column: d<br />
The following is the detail of dividends declared on First Preferred Stocks for the period<br />
ended December 31, 2009:<br />
No. of Dividends Total<br />
Class of Stock Shares Per Share Declared<br />
6.00% Cumulative, Redeemable 4,211,662 $1.500 $ 6,317,516<br />
5.50% Cumulative, Redeemable 1,173,163 1.375 1,613,109<br />
5.00% Cumulative, Redeemable 400,000 1.250 500,002<br />
5.00% Cumulative, Redeemable 1,778,172 1.250 2,222,719<br />
5.00% Cumulative, Redeemable - Series A 934,322 1.250 1,167,909<br />
4.80% Cumulative, Redeemable 793,031 1.200 951,637<br />
4.50% Cumulative, Redeemable 611,142 1.125 687,538<br />
4.36% Cumulative, Redeemable 418,291 1.090 455,939<br />
-----------<br />
Total $13,916,369<br />
===========<br />
Schedule Page: 118 Line No.: 31 Column: c<br />
This represents dividends declared on Common Stock to PG&E Corporation.<br />
Schedule Page: 118 Line No.: 31 Column: d<br />
This represents dividends declared on Common Stock to PG&E Corporation.<br />
Schedule Page: 118 Line No.: 40 Column: a<br />
The contra primary account affected is account 216. The <strong>FERC</strong> software does not allow<br />
entry on this Line 40, column b.<br />
Schedule Page: 118 Line No.: 52 Column: c<br />
This is comprised of the following:<br />
<strong>2010</strong> 2009<br />
Utility subsidiary earnings reflected in<br />
operations <strong>and</strong> maintenance accounts ($ 1,271,805) ($994,220)<br />
Reclassification to Account 216 of<br />
equity of dissolved subsidiaries - (3,642,746)<br />
Other - ( 9)<br />
---------- ----------<br />
Total ($1,271,805) ($4,636,975)<br />
============ ==========<br />
Schedule Page: 118 Line No.: 52 Column: d<br />
Refer to the footnote for line 52, column c.<br />
<strong>FERC</strong> FORM NO. 1 (ED. 12-87) Page 450.1
Name of Respondent<br />
PACIFIC GAS AND ELECTRIC COMPANY<br />
This Report Is:<br />
(1) X An Original<br />
(2) A Resubmission<br />
STATEMENT OF CASH FLOWS<br />
Date of Report<br />
(Mo, Da, Yr)<br />
04/08/2011<br />
Year/Period of Report<br />
End of <strong>2010</strong>/Q4<br />
(1) Codes to be used:(a) Net Proceeds or Payments;(b)Bonds, debentures <strong>and</strong> other long-term debt; (c) Include commercial paper; <strong>and</strong> (d) Identify separately such items as<br />
investments, fixed assets, intangibles, etc.<br />
(2) Information about noncash investing <strong>and</strong> financing activities must be provided in the Notes to the Financial statements. Also provide a reconciliation between "Cash <strong>and</strong> Cash<br />
Equivalents at End of Period" with related amounts on the Balance Sheet.<br />
(3) Operating Activities - Other: Include gains <strong>and</strong> losses pertaining to operating activities only. Gains <strong>and</strong> losses pertaining to investing <strong>and</strong> financing activities should be reported<br />
in those activities. Show in the Notes to the Financials the amounts of interest paid (net of amount capitalized) <strong>and</strong> income taxes paid.<br />
(4) Investing Activities: Include at Other (line 31) net cash outflow to acquire other companies. Provide a reconciliation of assets acquired with liabilities assumed in the Notes to<br />
the Financial Statements. Do not include on this statement the dollar amount of leases capitalized per the USofA General Instruction 20; instead provide a reconciliation of the<br />
dollar amount of leases capitalized with the plant cost.<br />
Line<br />
Description (See Instruction No. 1 for Explanation of Codes)<br />
No.<br />
(a)<br />
1 Net Cash Flow from Operating Activities:<br />
2 Net Income (Line 78(c) on page 117)<br />
3 Noncash Charges (Credits) to Income:<br />
4 Depreciation <strong>and</strong> Depletion<br />
5 Amortization of<br />
6 Unamortized Loss or Gain on Reacquired Debt<br />
7 Expenses, Discount <strong>and</strong> Premium - Long Term Debt<br />
8 Deferred Income Taxes (Net)<br />
9 Investment Tax Credit Adjustment (Net)<br />
10 Net (Increase) Decrease in Receivables<br />
11 Net (Increase) Decrease in Inventory<br />
12 Net (Increase) Decrease in Allowances Inventory<br />
13 Net Increase (Decrease) in Payables <strong>and</strong> Accrued Expenses<br />
14 Net (Increase) Decrease in Other Regulatory Assets<br />
15 Net Increase (Decrease) in Other Regulatory Liabilities<br />
16 (Less) Allowance for Other Funds Used During Construction<br />
17 (Less) Undistributed Earnings from Subsidiary Companies<br />
18 Other (provide details in footnote):<br />
19<br />
20<br />
21<br />
22 Net Cash Provided by (Used in) Operating Activities (Total 2 thru 21)<br />
23<br />
24 Cash Flows from Investment Activities:<br />
25 Construction <strong>and</strong> Acquisition of Plant (including l<strong>and</strong>):<br />
26 Gross Additions to Utility Plant (less nuclear fuel)<br />
27 Gross Additions to Nuclear Fuel<br />
28 Gross Additions to Common Utility Plant<br />
29 Gross Additions to Nonutility Plant<br />
30 (Less) Allowance for Other Funds Used During Construction<br />
31 Other (provide details in footnote):<br />
32 Purchases of nuclear decommissioning trust investments<br />
33 Other<br />
34 Cash Outflows for Plant (Total of lines 26 thru 33)<br />
35<br />
36 Acquisition of Other Noncurrent Assets (d)<br />
37 Proceeds from Disposal of Noncurrent Assets (d)<br />
38<br />
39 Investments in <strong>and</strong> Advances to Assoc. <strong>and</strong> Subsidiary Companies<br />
40 Contributions <strong>and</strong> Advances from Assoc. <strong>and</strong> Subsidiary Companies<br />
41 Disposition of Investments in (<strong>and</strong> Advances to)<br />
42 Associated <strong>and</strong> Subsidiary Companies<br />
43 Payments to Advances by Assoc. <strong>and</strong> Subsidiary Companies<br />
44 Purchase of Investment Securities (a)<br />
45 Proceeds from Sales of Investment Securities (a)<br />
Current Year to Date<br />
Quarter/Year<br />
(b)<br />
1,120,973,704<br />
1,515,281,004<br />
23,858,558<br />
14,812,402<br />
761,481,591<br />
-4,664,829<br />
-49,827,400<br />
-43,909,347<br />
-40,309,068<br />
366,236<br />
25,318,130<br />
109,912,938<br />
-18,557,028<br />
56,285,941<br />
3,288,311,012<br />
-3,766,201,897<br />
-144,436,347<br />
-109,912,938<br />
-1,456,220,929<br />
-353,739<br />
-5,257,299,974<br />
21,591,000<br />
-441,933,314<br />
Previous Year to Date<br />
Quarter/Year<br />
(c)<br />
1,250,003,668<br />
1,388,520,924<br />
25,383,583<br />
16,553,588<br />
791,854,460<br />
-4,932,000<br />
-592,355,717<br />
109,764,592<br />
-54,908,630<br />
-32,491,883<br />
48,293,640<br />
95,257,573<br />
-14,835,924<br />
102,558,139<br />
2,967,822,715<br />
-3,921,706,484<br />
-132,244,860<br />
-95,257,573<br />
-1,414,275,940<br />
-378,883<br />
-5,373,348,594<br />
11,269,000<br />
-771,429<br />
-430,049,578<br />
<strong>FERC</strong> FORM NO. 1 (ED. 12-96) Page 120
Name of Respondent<br />
PACIFIC GAS AND ELECTRIC COMPANY<br />
This Report Is:<br />
(1) X An Original<br />
(2) A Resubmission<br />
STATEMENT OF CASH FLOWS<br />
Date of Report<br />
(Mo, Da, Yr)<br />
04/08/2011<br />
Year/Period of Report<br />
End of <strong>2010</strong>/Q4<br />
(1) Codes to be used:(a) Net Proceeds or Payments;(b)Bonds, debentures <strong>and</strong> other long-term debt; (c) Include commercial paper; <strong>and</strong> (d) Identify separately such items as<br />
investments, fixed assets, intangibles, etc.<br />
(2) Information about noncash investing <strong>and</strong> financing activities must be provided in the Notes to the Financial statements. Also provide a reconciliation between "Cash <strong>and</strong> Cash<br />
Equivalents at End of Period" with related amounts on the Balance Sheet.<br />
(3) Operating Activities - Other: Include gains <strong>and</strong> losses pertaining to operating activities only. Gains <strong>and</strong> losses pertaining to investing <strong>and</strong> financing activities should be reported<br />
in those activities. Show in the Notes to the Financials the amounts of interest paid (net of amount capitalized) <strong>and</strong> income taxes paid.<br />
(4) Investing Activities: Include at Other (line 31) net cash outflow to acquire other companies. Provide a reconciliation of assets acquired with liabilities assumed in the Notes to<br />
the Financial Statements. Do not include on this statement the dollar amount of leases capitalized per the USofA General Instruction 20; instead provide a reconciliation of the<br />
dollar amount of leases capitalized with the plant cost.<br />
Line<br />
Description (See Instruction No. 1 for Explanation of Codes)<br />
No.<br />
(a)<br />
46 Loans Made or Purchased<br />
47 Collections on Loans<br />
48 Net (Increase) Decrease in Restricted Cash<br />
49 Net (Increase) Decrease in Receivables<br />
50 Net (Increase ) Decrease in Inventory<br />
51 Net (Increase) Decrease in Allowances Held for Speculation<br />
52 Net Increase (Decrease) in Payables <strong>and</strong> Accrued Expenses<br />
53 Other (provide details in footnote):<br />
54 Proceeds from nuclear decommissioning trust sales<br />
55 Other<br />
56 Net Cash Provided by (Used in) Investing Activities<br />
57 Total of lines 34 thru 55)<br />
58<br />
59 Cash Flows from Financing Activities:<br />
60 Proceeds from Issuance of:<br />
61 Long-Term Debt (b)<br />
62 Preferred Stock<br />
63 Common Stock<br />
64 Other (provide details in footnote):<br />
65<br />
66 Net Increase in Short-Term Debt (c)<br />
67 Other (provide details in footnote):<br />
68 Equity infusion from PG&E Corporation<br />
69<br />
70 Cash Provided by Outside Sources (Total 61 thru 69)<br />
71<br />
72 Payments for Retirement of:<br />
73 Long-term Debt (b)<br />
74 Preferred Stock<br />
75 Common Stock<br />
76 Other (provide details in footnote):<br />
77 Customer Advances for Construction<br />
78 Net Decrease in Short-Term Debt (c)<br />
79 Other<br />
80 Dividends on Preferred Stock<br />
81 Dividends on Common Stock<br />
82 Net Cash Provided by (Used in) Financing Activities<br />
83 (Total of lines 70 thru 81)<br />
84<br />
85 Net Increase (Decrease) in Cash <strong>and</strong> Cash Equivalents<br />
86 (Total of lines 22,57 <strong>and</strong> 83)<br />
87<br />
88 Cash <strong>and</strong> Cash Equivalents at Beginning of Period<br />
89<br />
90 Cash <strong>and</strong> Cash Equivalents at End of period<br />
Current Year to Date<br />
Quarter/Year<br />
(b)<br />
69,786,798<br />
1,405,022,499<br />
-3,656,565<br />
-4,206,489,556<br />
1,327,370,233<br />
16,671,570<br />
190,000,000<br />
1,534,041,803<br />
-95,000,000<br />
-14,938,478<br />
-58,705,277<br />
-13,916,365<br />
-716,000,000<br />
635,481,683<br />
-282,696,861<br />
331,058,678<br />
48,361,817<br />
Previous Year to Date<br />
Quarter/Year<br />
(c)<br />
657,221,132<br />
1,351,000,000<br />
197,747<br />
-3,784,481,722<br />
1,384,745,000<br />
542,281,831<br />
718,000,000<br />
2,645,026,831<br />
-909,000,000<br />
1,582,462<br />
3,660,856<br />
-13,916,369<br />
-624,000,000<br />
1,103,353,780<br />
286,694,773<br />
44,363,905<br />
331,058,678<br />
<strong>FERC</strong> FORM NO. 1 (ED. 12-96) Page 121
Name of Respondent<br />
PACIFIC GAS AND ELECTRIC COMPANY<br />
This Report is:<br />
(1) X An Original<br />
(2) A Resubmission<br />
Date of Report<br />
(Mo, Da, Yr)<br />
04/08/2011<br />
Year/Period of Report<br />
<strong>2010</strong>/Q4<br />
FOOTNOTE DATA<br />
Schedule Page: 120 Line No.: 18 Column: b<br />
This consists of the following:<br />
<strong>2010</strong> 2009<br />
(Increase) Decrease in Other Working Capital $ (346,309,904) $ 273,643,456<br />
Increase (Decrease) in Other Noncurrent<br />
Assets <strong>and</strong> Liabilities 259,081,549 (214,388,127)<br />
Others<br />
Nuclear Fuel Lease Amortization 85,379,213 72,716,944<br />
Other-net 58,135,083 (29,414,134)<br />
-------------- --------------<br />
Total $ 56,285,941 $ 102,558,139<br />
============== ==============<br />
Schedule Page: 120 Line No.: 18 Column: c<br />
Refer to the footnote on Line 18, column b<br />
Schedule Page: 120 Line No.: 90 Column: b<br />
This consists of the following:<br />
<strong>2010</strong> 2009<br />
Cash (131) $ 44,435,787 $ 49,676,271<br />
Working Funds (135) 126,030 144,255<br />
Temporary Cash Investments (136) 3,800,000 281,238,152<br />
-------------- --------------<br />
Total $ 48,361,817 $ 331,058,678<br />
============== ==============<br />
Supplemental disclosures of cash flow information<br />
(in millions):<br />
Cash paid for:<br />
Interest (net of amounts capitalized) $ (546) $ (578)<br />
Income taxes paid (refunded), net (171) 170<br />
Supplemental disclosures of noncash<br />
investing <strong>and</strong> financing activities:<br />
Capital expenditures financed through<br />
accounts payable 364 273<br />
Schedule Page: 120 Line No.: 90 Column: c<br />
Refer to the footnote on Line 90, column b<br />
<strong>FERC</strong> FORM NO. 1 (ED. 12-87) Page 450.1
Name of Respondent<br />
PACIFIC GAS AND ELECTRIC COMPANY<br />
This<br />
(1)<br />
Report<br />
X<br />
Is:<br />
An Original<br />
(2) A Resubmission<br />
Date of Report<br />
04/08/2011<br />
Year/Period of Report<br />
End of <strong>2010</strong>/Q4<br />
NOTES TO FINANCIAL STATEMENTS<br />
1. Use the space below for important notes regarding the Balance Sheet, Statement of Income for the year, Statement of Retained<br />
Earnings for the year, <strong>and</strong> Statement of Cash Flows, or any account thereof. Classify the notes according to each basic statement,<br />
providing a subheading for each statement except where a note is applicable to more than one statement.<br />
2. Furnish particulars (details) as to any significant contingent assets or liabilities existing at end of year, including a brief explanation of<br />
any action initiated by the Internal Revenue Service involving possible assessment of additional income taxes of material amount, or of<br />
a claim for refund of income taxes of a material amount initiated by the utility. Give also a brief explanation of any dividends in arrears<br />
on cumulative preferred stock.<br />
3. For Account 116, Utility Plant Adjustments, explain the origin of such amount, debits <strong>and</strong> credits during the year, <strong>and</strong> plan of<br />
disposition contemplated, giving references to Cormmission orders or other authorizations respecting classification of amounts as plant<br />
adjustments <strong>and</strong> requirements as to disposition thereof.<br />
4. Where Accounts 189, Unamortized Loss on Reacquired Debt, <strong>and</strong> 257, Unamortized Gain on Reacquired Debt, are not used, give<br />
an explanation, providing the rate treatment given these items. See General Instruction 17 of the Uniform System of Accounts.<br />
5. Give a concise explanation of any retained earnings restrictions <strong>and</strong> state the amount of retained earnings affected by such<br />
restrictions.<br />
6. If the notes to financial statements relating to the respondent company appearing in the annual report to the stockholders are<br />
applicable <strong>and</strong> furnish the data required by instructions above <strong>and</strong> on pages 114-121, such notes may be included herein.<br />
7. For the 3Q disclosures, respondent must provide in the notes sufficient disclosures so as to make the interim information not<br />
misleading. Disclosures which would substantially duplicate the disclosures contained in the most recent <strong>FERC</strong> Annual Report may be<br />
omitted.<br />
8. For the 3Q disclosures, the disclosures shall be provided where events subsequent to the end of the most recent year have occurred<br />
which have a material effect on the respondent. Respondent must include in the notes significant changes since the most recently<br />
completed year in such items as: accounting principles <strong>and</strong> practices; estimates inherent in the preparation of the financial statements;<br />
status of long-term contracts; capitalization including significant new borrowings or modifications of existing financing agreements; <strong>and</strong><br />
changes resulting from business combinations or dispositions. However were material contingencies exist, the disclosure of such<br />
matters shall be provided even though a significant change since year end may not have occurred.<br />
9. Finally, if the notes to the financial statements relating to the respondent appearing in the annual report to the stockholders are<br />
applicable <strong>and</strong> furnish the data required by the above instructions, such notes may be included herein.<br />
PAGE 122 INTENTIONALLY LEFT BLANK<br />
SEE PAGE 123 FOR REQUIRED INFORMATION.<br />
<strong>FERC</strong> FORM NO. 1 (ED. 12-96) Page 122
Name of Respondent<br />
PACIFIC GAS AND ELECTRIC COMPANY<br />
This Report is:<br />
(1) X An Original<br />
(2) A Resubmission<br />
Date of Report<br />
(Mo, Da, Yr)<br />
04/08/2011<br />
Year/Period of Report<br />
<strong>2010</strong>/Q4<br />
NOTES TO FINANCIAL STATEMENTS (Continued)<br />
Introduction:<br />
The accompanying financial statements on pages 110 through 121 of this <strong>Form</strong> 1 report of <strong>Pacific</strong> <strong>Gas</strong> <strong>and</strong> <strong>Electric</strong> <strong>Company</strong><br />
(the “Utility”) were prepared in accordance with the accounting requirements of the Federal Energy Regulatory Commission (“<strong>FERC</strong>”)<br />
as set forth in its applicable Uniform System of Accounts <strong>and</strong> published accounting releases, which is a comprehensive basis of<br />
accounting other than accounting principles generally accepted in the United States of America (“GAAP”). The primary differences<br />
from the Utility’s GAAP-basis financial statements as presented in the <strong>Form</strong> 1 are that (1) subsidiaries are not consolidated <strong>and</strong> are<br />
shown under the equity method of accounting, (2) deferred income tax assets <strong>and</strong> liabilities are not offset against each other but are<br />
shown as separate items on the balance sheet <strong>and</strong> are long-term, (3) cost of removal is reported in accumulated depreciation for <strong>FERC</strong><br />
reporting purposes (GAAP requires that cost of removal be classified as a regulatory liability), (4) there is no current liability<br />
classification of the current portion of long-term debt for <strong>FERC</strong> reporting, (5) there is no reclassification of negative balances of<br />
balancing accounts from current assets to current liabilities for <strong>FERC</strong> reporting, (6) there is no reclassification of price risk<br />
management activities relating to the offsetting of financial assets <strong>and</strong> financial liabilities in the balance sheet for <strong>FERC</strong> reporting, <strong>and</strong><br />
(7) interdepartmental revenues <strong>and</strong> expenses between electric <strong>and</strong> gas operations of the Utility are not eliminated for <strong>FERC</strong> reporting .<br />
The notes below are excerpts from PG&E Corporation <strong>and</strong> the Utility’s combined Annual Report on <strong>Form</strong> 10-K for the year<br />
ended December 31, <strong>2010</strong>, as filed with the Securities <strong>and</strong> Exchange Commission (“SEC”) on February 17, 2011. The following<br />
disclosures contain information in accordance with SEC reporting requirements. As such, due to the differences between <strong>FERC</strong> <strong>and</strong><br />
SEC reporting requirements, certain amounts disclosed in the following notes may not agree to balances in the <strong>FERC</strong> financial<br />
statements.<br />
PG&E CORPORATION AND PACIFIC GAS AND ELECTRIC COMPANY<br />
NOTES TO THE CONDENSED CONSOLIDATED FINANCIAL STATEMENTS<br />
FOR THE YEAR ENDED DECEMBER 31, <strong>2010</strong><br />
NOTE 1: ORGANIZATION AND BASIS OF PRESENTATION<br />
PG&E Corporation is a holding company whose primary purpose is to hold interests in energy-based businesses. PG&E<br />
Corporation conducts its business principally through <strong>Pacific</strong> <strong>Gas</strong> <strong>and</strong> <strong>Electric</strong> <strong>Company</strong> (“Utility”), a public utility operating in<br />
northern <strong>and</strong> central California. The Utility generates revenues mainly through the sale <strong>and</strong> delivery of electricity <strong>and</strong> natural gas to<br />
customers. The Utility is regulated by the California Public Utilities Commission (“CPUC”) <strong>and</strong> the Federal Energy Regulatory<br />
Commission (“<strong>FERC</strong>”). The Utility’s accounts for electric <strong>and</strong> gas operations are maintained in accordance with the Uniform System<br />
of Accounts prescribed by the <strong>FERC</strong>.<br />
This is a combined annual report of PG&E Corporation <strong>and</strong> the Utility. The Notes to the Consolidated Financial Statements<br />
apply to both PG&E Corporation <strong>and</strong> the Utility. PG&E Corporation’s Consolidated Financial Statements include the accounts of<br />
PG&E Corporation, the Utility, <strong>and</strong> other wholly owned <strong>and</strong> controlled subsidiaries. The Utility’s Consolidated Financial Statements<br />
include the accounts of the Utility <strong>and</strong> its wholly owned <strong>and</strong> controlled subsidiaries. All intercompany transactions have been<br />
eliminated from the Consolidated Financial Statements.<br />
The accompanying Consolidated Financial Statements have been prepared in accordance with accounting principles generally<br />
accepted in the United States of America (“GAAP”) for annual financial statements <strong>and</strong> in accordance with the instructions to <strong>Form</strong><br />
10-K <strong>and</strong> Regulation S-X promulgated by the Securities <strong>and</strong> Exchange Commission (“SEC”). The preparation of financial statements<br />
in conformity with GAAP requires management to make estimates <strong>and</strong> assumptions based on a wide range of factors, including future<br />
regulatory decisions <strong>and</strong> economic conditions that are difficult to predict. Some of the more critical estimates <strong>and</strong> assumptions relate<br />
to the Utility’s regulatory assets <strong>and</strong> liabilities, environmental remediation liabilities, asset retirement obligations (“ARO”), <strong>and</strong><br />
pension plan <strong>and</strong> other postretirement plan obligations. In addition, management has made significant estimates <strong>and</strong> assumptions for<br />
accruals related to the rupture of a natural gas transmission pipeline owned <strong>and</strong> operated by the Utility in the City of San Bruno,<br />
California on September 9, <strong>2010</strong>, as well as accruals for various legal matters. (See Note 15 below.) Management believes that its<br />
estimates <strong>and</strong> assumptions reflected in the Consolidated Financial Statements are appropriate <strong>and</strong> reasonable. Actual results could<br />
<strong>FERC</strong> FORM NO. 1 (ED. 12-88) Page 123.1
Name of Respondent<br />
PACIFIC GAS AND ELECTRIC COMPANY<br />
This Report is:<br />
(1) X An Original<br />
(2) A Resubmission<br />
Date of Report<br />
(Mo, Da, Yr)<br />
04/08/2011<br />
Year/Period of Report<br />
<strong>2010</strong>/Q4<br />
NOTES TO FINANCIAL STATEMENTS (Continued)<br />
differ materially from those estimates.<br />
NOTE 2: SUMMARY OF SIGNIFICANT ACCOUNTING POLICIES<br />
Cash <strong>and</strong> Cash Equivalents<br />
Cash equivalents consist of short-term, highly liquid investments with original maturities of three months or less. Cash<br />
equivalents are stated at cost, which approximates fair value. PG&E Corporation <strong>and</strong> the Utility invest their cash primarily in money<br />
market funds.<br />
Restricted Cash<br />
Restricted cash consists primarily of the Utility’s cash held in escrow pending the resolution of the remaining disputed claims<br />
made by electricity suppliers in the Utility’s proceeding under Chapter 11 of the U.S. Bankruptcy Code (“Chapter 11”). (See Note 13<br />
below.) Restricted cash also includes the Utility’s deposits of cash <strong>and</strong> cash equivalents made under certain third-party agreements.<br />
Allowance for Doubtful Accounts Receivable<br />
PG&E Corporation <strong>and</strong> the Utility recognize an allowance for doubtful accounts to record accounts receivable at estimated<br />
net realizable value. The allowance is determined based upon a variety of factors, including historical write-off experience, aging of<br />
receivables, current economic conditions, <strong>and</strong> assessment of customer collectability.<br />
Inventories<br />
Inventories are carried at weighted average cost <strong>and</strong> are valued at the lower of weighted-average cost or market. Inventories<br />
include materials, supplies, <strong>and</strong> natural gas stored underground. Materials <strong>and</strong> supplies are charged to inventory when purchased <strong>and</strong><br />
then expensed or capitalized to plant, as appropriate, when consumed or installed. Natural gas stored underground represents<br />
purchases that are injected into inventory <strong>and</strong> then expensed at average cost when withdrawn <strong>and</strong> distributed to customers or used in<br />
electric generation.<br />
Property, Plant, <strong>and</strong> Equipment<br />
Property, plant, <strong>and</strong> equipment are reported at their original cost. These original costs include labor <strong>and</strong> materials,<br />
construction overhead, <strong>and</strong> allowance for funds used during construction (“AFUDC”).<br />
(in millions)<br />
The Utility’s balances at December 31, <strong>2010</strong> are as follows:<br />
Gross Plant as of<br />
December 31, <strong>2010</strong><br />
Accumulated<br />
Depreciation as of<br />
December 31, <strong>2010</strong><br />
Net Plant as of<br />
December 31, <strong>2010</strong><br />
<strong>Electric</strong>ity generating facilities (1) $ 6,012 $ (1,404) $ 4,608<br />
<strong>Electric</strong>ity distribution facilities 20,991 (7,161) 13,830<br />
<strong>Electric</strong>ity transmission 6,505 (1,829) 4,676<br />
Natural gas distribution facilities 7,443 (2,819) 4,624<br />
Natural gas transportation <strong>and</strong> storage 3,939 (1,613) 2,326<br />
Construction work in progress 1,384 - 1,384<br />
Total $ 46,274 $ (14,826) $ 31,448<br />
(1) Balance includes nuclear fuel inventories. Stored nuclear fuel inventory is stated at weighted average cost. Nuclear fuel<br />
in the reactor is expensed as it is used based on the amount of energy output. (See Note 15 below.)<br />
The Utility’s balances at December 31, 2009 are as follows:<br />
<strong>FERC</strong> FORM NO. 1 (ED. 12-88) Page 123.2
Name of Respondent<br />
PACIFIC GAS AND ELECTRIC COMPANY<br />
This Report is:<br />
(1) X An Original<br />
(2) A Resubmission<br />
Date of Report<br />
(Mo, Da, Yr)<br />
04/08/2011<br />
Year/Period of Report<br />
<strong>2010</strong>/Q4<br />
NOTES TO FINANCIAL STATEMENTS (Continued)<br />
(in millions)<br />
Gross Plant as of<br />
December 31, 2009<br />
Accumulated<br />
Depreciation as of<br />
December 31, 2009<br />
Net Plant as of<br />
December 31, 2009<br />
<strong>Electric</strong>ity generating facilities (1) $ 4,777 $ (1,279) $ 3,498<br />
<strong>Electric</strong>ity distribution facilities 19,924 (6,924) 13,000<br />
<strong>Electric</strong>ity transmission 5,780 (1,751) 4,029<br />
Natural gas distribution facilities 7,069 (2,667) 4,402<br />
Natural gas transportation <strong>and</strong> storage 3,628 (1,554) 2,074<br />
Construction work in progress 1,888 - 1,888<br />
Total $ 43,066 $ (14,175) $ 28,891<br />
(1) Balance includes nuclear fuel inventories. Stored nuclear fuel inventory is stated at weighted average cost. Nuclear fuel<br />
in the reactor is expensed as it is used based on the amount of energy output. (See Note 15 below.)<br />
AFUDC<br />
AFUDC is a method used to compensate the Utility for the estimated cost of debt (interest) <strong>and</strong> equity funds used to finance<br />
regulated plant additions <strong>and</strong> is capitalized as part of the cost of construction projects. AFUDC is recoverable from customers through<br />
rates over the life of the related property once the property is placed in service. The portion of AFUDC related to the cost of debt is<br />
recorded as a reduction to interest expense. AFUDC related to the cost of equity is recorded in other income. The Utility recorded<br />
AFUDC of $110 million <strong>and</strong> $50 million during <strong>2010</strong>, $95 million <strong>and</strong> $44 million during 2009, $70 million <strong>and</strong> $44 million during<br />
2008, related to equity <strong>and</strong> debt, respectively.<br />
Depreciation<br />
The Utility depreciates property, plant, <strong>and</strong> equipment on a straight-line basis over the estimated useful lives. The composite,<br />
or group, method of depreciation is used, in which a single depreciation rate is applied to the gross investment in a particular class of<br />
property. The Utility’s composite depreciation rate was 3.38% in <strong>2010</strong>, 3.43% in 2009, <strong>and</strong> 3.38% in 2008.<br />
<strong>Electric</strong>ity generating facilities<br />
<strong>Electric</strong>ity distribution facilities<br />
<strong>Electric</strong>ity transmission<br />
Natural gas distribution facilities<br />
Natural gas transportation <strong>and</strong> storage<br />
Estimated Useful Lives<br />
4 to 37 years<br />
16 to 58 years<br />
40 to 70 years<br />
24 to 52 years<br />
25 to 48 years<br />
The useful lives of the Utility’s property, plant, <strong>and</strong> equipment are authorized by the CPUC <strong>and</strong> the <strong>FERC</strong>, <strong>and</strong> the<br />
depreciation expense is recovered through rates charged to customers. Depreciation expense includes a component for the original<br />
cost of assets <strong>and</strong> a component for estimated cost of future removal, net of any salvage value at retirement. Upon retirement, the<br />
original cost of the retired assets, net of salvage value, is charged to accumulated depreciation. The cost of repairs <strong>and</strong> maintenance,<br />
including planned major maintenance activities <strong>and</strong> minor replacements of property, is charged to operating <strong>and</strong> maintenance expense<br />
as incurred.<br />
Capitalized Software Costs<br />
PG&E Corporation <strong>and</strong> the Utility capitalize costs incurred during the application development stage of internal use software<br />
projects to property, plant, <strong>and</strong> equipment. PG&E Corporation <strong>and</strong> the Utility amortize capitalized software costs ratably over the<br />
expected lives of the software, ranging from 3 to 15 years <strong>and</strong> commencing upon operational use. Capitalized software costs totaled<br />
$580 million at December 31, <strong>2010</strong> <strong>and</strong> $562 million at December 31, 2009, net of accumulated amortization of $386 million at<br />
December 31, <strong>2010</strong> <strong>and</strong> $315 million at December 31, 2009. Amortization expense for capitalized software was $94 million in <strong>2010</strong>,<br />
$37 million in 2009, <strong>and</strong> $73 million in 2008. Amortization expense is estimated to be approximately $120 million annually for 2011<br />
<strong>FERC</strong> FORM NO. 1 (ED. 12-88) Page 123.3
Name of Respondent<br />
PACIFIC GAS AND ELECTRIC COMPANY<br />
This Report is:<br />
(1) X An Original<br />
(2) A Resubmission<br />
Date of Report<br />
(Mo, Da, Yr)<br />
04/08/2011<br />
Year/Period of Report<br />
<strong>2010</strong>/Q4<br />
NOTES TO FINANCIAL STATEMENTS (Continued)<br />
through 2015.<br />
Regulation <strong>and</strong> Regulated Operations<br />
As a regulated entity, the Utility’s rates are designed to recover the costs of providing service. The Utility capitalizes <strong>and</strong><br />
records, as a regulatory asset, costs that would otherwise be charged to expense if it is probable that the incurred costs will be<br />
recovered in future rates. Regulatory assets are amortized over the future periods that the costs are recovered. If costs expected to be<br />
incurred in the future are currently being recovered through rates, the Utility records those expected future costs as regulatory<br />
liabilities. In addition, amounts that are probable of being credited or refunded to customers in the future are recorded as regulatory<br />
liabilities.<br />
The Utility uses regulatory balancing accounts to accumulate differences between actual billed <strong>and</strong> unbilled revenues <strong>and</strong> the<br />
Utility’s authorized revenue requirements for the period. The Utility also uses regulatory balancing accounts to accumulate differences<br />
between incurred costs <strong>and</strong> actual billed <strong>and</strong> unbilled revenues, as well as differences between incurred costs <strong>and</strong> authorized revenue<br />
meant to recover those costs. Under-collections that are probable of recovery through regulated rates are recorded as regulatory<br />
balancing account assets. Over-collections that are probable of being refunded to customers are recorded as regulatory balancing<br />
account liabilities. For further discussion please see “Revenue Recognition” below.<br />
To the extent that portions of the Utility’s operations cease to be subject to cost-of-service rate regulation, or recovery is no<br />
longer probable as a result of changes in regulation or other reasons, the related regulatory assets <strong>and</strong> liabilities are written off.<br />
Intangible Assets<br />
Intangible assets primarily consist of hydroelectric facility licenses with lives ranging from 19 to 40 years. The gross carrying<br />
amount of the hydroelectric facility licenses <strong>and</strong> other agreements was $112 million at December 31, <strong>2010</strong> <strong>and</strong> $110 million at<br />
December 31, 2009. The accumulated amortization was $44 million at December 31, <strong>2010</strong> <strong>and</strong> $40 million at December 31, 2009.<br />
The Utility’s amortization expense related to intangible assets was $4 million in <strong>2010</strong>, 2009, <strong>and</strong> 2008. The estimated annual<br />
amortization expense for 2011 through 2015 based on the December 31, <strong>2010</strong> intangible assets balance is $3 million. Intangible assets<br />
are recorded to other noncurrent assets – other in the Consolidated Balance Sheets.<br />
Asset Retirement Obligations<br />
PG&E Corporation <strong>and</strong> the Utility record an ARO at fair value in the period in which the obligation is incurred if the fair<br />
value can be reasonably estimated. In the same period, the associated asset retirement costs are capitalized as part of the carrying<br />
amount of the related long-lived asset. In each subsequent period, the liability is accreted to its present value, <strong>and</strong> the capitalized cost<br />
is depreciated over the useful life of the long-lived asset. PG&E Corporation <strong>and</strong> the Utility also record a liability if a legal obligation<br />
to perform an asset retirement exists <strong>and</strong> can be reasonably estimated, but performance is conditional upon a future event. The Utility<br />
recognizes regulatory assets or liabilities as a result of timing differences between the recognition of costs <strong>and</strong> the costs recovered<br />
through the ratemaking process.<br />
The Utility has an ARO for its nuclear generation <strong>and</strong> certain fossil fueled generation facilities. The Utility has also identified<br />
AROs related to asbestos contamination in buildings, potential site restoration at certain hydroelectric facilities, fuel storage tanks, <strong>and</strong><br />
contractual obligations to restore leased property to pre-lease condition. Additionally, the Utility has recorded AROs related to gas<br />
distribution, gas transmission, electric distribution, <strong>and</strong> electric transmission system assets.<br />
Detailed studies of the cost to decommission the Utility’s nuclear power plants are conducted every three years in conjunction<br />
with the Nuclear Decommissioning Cost Triennial Proceedings (“NDCTP”) conducted by the CPUC. The decommissioning cost<br />
estimates are based on the plant location <strong>and</strong> cost characteristics for the Utility's nuclear power plants. Actual decommissioning costs<br />
may vary from these estimates as a result of changes in assumptions such as decommissioning dates; regulatory requirements;<br />
technology; <strong>and</strong> costs of labor, materials, <strong>and</strong> equipment. Estimated cash flows were revised as a result of the studies completed in the<br />
first quarter of 2009.<br />
<strong>FERC</strong> FORM NO. 1 (ED. 12-88) Page 123.4
Name of Respondent<br />
PACIFIC GAS AND ELECTRIC COMPANY<br />
This Report is:<br />
(1) X An Original<br />
(2) A Resubmission<br />
Date of Report<br />
(Mo, Da, Yr)<br />
04/08/2011<br />
Year/Period of Report<br />
<strong>2010</strong>/Q4<br />
NOTES TO FINANCIAL STATEMENTS (Continued)<br />
For GAAP purposes, the Utility adjusts its nuclear decommissioning obligation to reflect changes in the estimate of<br />
decommissioning its nuclear power facilities <strong>and</strong> records this as an adjustment to ARO on its Consolidated Balance Sheets. The total<br />
nuclear decommissioning obligation accrued in accordance with GAAP was $1.2 billion at December 31, <strong>2010</strong> <strong>and</strong> $1.4 billion at<br />
December 31, 2009. For regulatory purposes, the estimated undiscounted nuclear decommissioning cost for the Utility’s nuclear<br />
power plants was approximately $2.3 billion at December 31, <strong>2010</strong> <strong>and</strong> 2009 (or approximately $4.4 billion <strong>and</strong> $4.6 billion in future<br />
dollars, respectively). These estimates are based on the 2009 decommissioning cost studies, prepared in accordance with CPUC<br />
requirements.<br />
Differences between amounts collected in rates for decommissioning the Utility’s nuclear power facilities <strong>and</strong> the<br />
decommissioning obligation recorded in accordance with GAAP are reflected as a regulatory liability. (See Note 3 below.)<br />
A reconciliation of the changes in the ARO liability is as follows:<br />
(in millions)<br />
ARO liability at December 31, 2008 $ 1,684<br />
Revision in estimated cash flows (129)<br />
Accretion 98<br />
Liabilities settled (60)<br />
ARO liability at December 31, 2009 1,593<br />
Revision in estimated cash flows (23)<br />
Accretion 93<br />
Liabilities settled (77)<br />
ARO liability at December 31, <strong>2010</strong> $ 1,586<br />
The Utility has identified additional ARO for which a reasonable estimate of fair value could not be made. The Utility has not<br />
recognized a liability related to these additional obligations, which include obligations to restore l<strong>and</strong> to its pre-use condition under the<br />
terms of certain l<strong>and</strong> rights agreements, removal <strong>and</strong> proper disposal of lead-based paint contained in some Utility facilities, removal<br />
of certain communications equipment from leased property, <strong>and</strong> retirement activities associated with substation <strong>and</strong> certain<br />
hydroelectric facilities. The Utility was not able to reasonably estimate the ARO associated with these assets because the settlement<br />
date of the obligation was indeterminate <strong>and</strong> information sufficient to reasonably estimate the settlement date or range of settlement<br />
dates does not exist. L<strong>and</strong> rights, communications equipment leases, <strong>and</strong> substation facilities will be maintained for the foreseeable<br />
future, <strong>and</strong> therefore, the Utility cannot reasonably estimate the settlement date or range of settlement dates for the obligations<br />
associated with these assets. The Utility does not have information available that specifies which facilities contain lead-based paint<br />
<strong>and</strong>, therefore, cannot reasonably estimate the settlement date(s) associated with the obligation. The Utility will maintain <strong>and</strong> continue<br />
to operate its hydroelectric facilities until the operation of a facility becomes uneconomical. The operation of the majority of the<br />
Utility’s hydroelectric facilities is currently, <strong>and</strong> for the foreseeable future, economically beneficial. Therefore, the settlement date<br />
cannot be determined at this time.<br />
Impairment of Long-Lived Assets<br />
PG&E Corporation <strong>and</strong> the Utility evaluate the carrying amounts of long-lived assets for impairment, based on projections of<br />
undiscounted future cash flows, whenever events occur or circumstances change that may affect the recoverability or the estimated life<br />
of long-lived assets. If this evaluation indicates that such cash flows are not expected to fully recover the assets, the assets are written<br />
down to their estimated fair value. No significant impairments were recorded in <strong>2010</strong>, 2009, or 2008.<br />
Gains <strong>and</strong> Losses on Debt Extinguishments<br />
Gains <strong>and</strong> losses on debt extinguishments associated with regulated operations are deferred <strong>and</strong> amortized over the remaining<br />
original amortization period of the debt reacquired, consistent with recovery of costs through regulated rates. PG&E Corporation <strong>and</strong><br />
the Utility recorded unamortized loss on debt extinguishments, net of gain, of $204 million <strong>and</strong> $227 million at December 31, <strong>2010</strong><br />
<strong>FERC</strong> FORM NO. 1 (ED. 12-88) Page 123.5
Name of Respondent<br />
PACIFIC GAS AND ELECTRIC COMPANY<br />
This Report is:<br />
(1) X An Original<br />
(2) A Resubmission<br />
Date of Report<br />
(Mo, Da, Yr)<br />
04/08/2011<br />
Year/Period of Report<br />
<strong>2010</strong>/Q4<br />
NOTES TO FINANCIAL STATEMENTS (Continued)<br />
<strong>and</strong> 2009, respectively. The amortization expense related to this loss was $23 million in <strong>2010</strong>, $25 million in 2009, <strong>and</strong> $26 million in<br />
2008. Deferred gains <strong>and</strong> losses on debt extinguishments are recorded to other <strong>and</strong> other noncurrent assets – regulatory assets in the<br />
Consolidated Balance Sheets.<br />
Gains <strong>and</strong> losses on debt extinguishments associated with unregulated operations are fully recognized at the time such debt is<br />
reacquired <strong>and</strong> are reported as a component of interest expense.<br />
Accumulated Other Comprehensive Income (Loss)<br />
Accumulated other comprehensive income (loss) reports a measure for accumulated changes in equity of an enterprise that<br />
result from transactions <strong>and</strong> other economic events, other than transactions with shareholders. The following table sets forth the<br />
after-tax changes in each component of accumulated other comprehensive income (loss):<br />
Employee Benefit Plans – Accumulated Other Comprehensive<br />
Income (Loss)<br />
(in millions) <strong>2010</strong> 2009 2008<br />
Balance at beginning of year $ (160) $ (221) $ 10<br />
Period change in pension benefits <strong>and</strong><br />
other benefits:<br />
Unrecognized prior service cost (1) (29) (1) 37<br />
Unrecognized net gain (loss) (2) (110) 363 (1,583)<br />
Unrecognized net transition<br />
obligation (3) 15 15 15<br />
Transfer to regulatory account (4)<br />
(5) 82 (316) 1,300<br />
Balance at end of year $ (202) $ (160) $ (221)<br />
(1) Net of income tax benefit (expense) of $20 million, $1 million, $(27) million for December 31, <strong>2010</strong>, 2009, <strong>and</strong> 2008,<br />
respectively.<br />
(2) Net of income tax benefit (expense) of $73 million, $(216) million, $1,088 million for December 31, <strong>2010</strong>, 2009, <strong>and</strong> 2008,<br />
respectively.<br />
(3) Net of income tax benefit (expense) of $(11) million for December 31, <strong>2010</strong>, 2009, <strong>and</strong> 2008.<br />
(4) Net of income tax benefit (expense) of $(57) million, $218 million, $(894) million for December 31, <strong>2010</strong>, 2009, <strong>and</strong> 2008,<br />
respectively.<br />
(5) Amounts transferred to the pension regulatory asset are probable of recovery from customers in future rates.<br />
There was no material difference between PG&E Corporation’s <strong>and</strong> the Utility’s accumulated other comprehensive income<br />
(loss) for the periods presented above.<br />
Revenue Recognition<br />
The Utility recognizes revenues after persuasive evidence of an arrangement exists, delivery has occurred, or services have<br />
been rendered; the price to the customer is fixed or determinable <strong>and</strong> collectability is reasonably assured. Revenues meet these criteria<br />
as the electricity <strong>and</strong> natural gas services are delivered, <strong>and</strong> include amounts for services rendered but not yet billed at the end of the<br />
period.<br />
The Utility recognizes revenues after the CPUC or the <strong>FERC</strong> has authorized rate recovery, amounts are objectively<br />
determinable <strong>and</strong> probable of recovery, <strong>and</strong> amounts will be collected within 24 months. (See Note 3 below.)<br />
The CPUC authorizes most of the Utility’s revenue requirements in its general rate case (“GRC”), which generally occurs<br />
<strong>FERC</strong> FORM NO. 1 (ED. 12-88) Page 123.6
Name of Respondent<br />
PACIFIC GAS AND ELECTRIC COMPANY<br />
This Report is:<br />
(1) X An Original<br />
(2) A Resubmission<br />
Date of Report<br />
(Mo, Da, Yr)<br />
04/08/2011<br />
Year/Period of Report<br />
<strong>2010</strong>/Q4<br />
NOTES TO FINANCIAL STATEMENTS (Continued)<br />
every three years. The Utility’s ability to recover revenue requirements authorized by the CPUC in the GRC does not depend on the<br />
volume of the Utility’s sales of electricity <strong>and</strong> natural gas services. Generally, the revenue recognition criteria are met ratably over the<br />
year.<br />
The CPUC also has authorized the Utility to collect additional revenue requirements to recover certain costs that the Utility<br />
has been authorized to pass on to customers, including costs to purchase electricity <strong>and</strong> natural gas; to fund public purpose, dem<strong>and</strong><br />
response, <strong>and</strong> customer energy efficiency programs; <strong>and</strong> to recover certain capital expenditures. Generally, the revenue recognition<br />
criteria for pass through costs billed to customers are met at the time the costs are incurred.<br />
The Utility’s revenues <strong>and</strong> earnings also are affected by incentive ratemaking mechanisms that adjust rates depending on the<br />
extent the Utility meets certain performance criteria. (See Note 15 below.)<br />
The <strong>FERC</strong> authorizes the Utility’s revenue requirements in annual transmission owner rate cases. The Utility’s ability to<br />
recover revenue requirements authorized by the <strong>FERC</strong> is dependent on the volume of the Utility’s electricity sales, <strong>and</strong> revenue is<br />
recognized only for amounts billed <strong>and</strong> unbilled.<br />
In determining whether revenue transactions should be presented net of the related expenses, the Utility considers various<br />
factors, including whether the Utility takes title to the product being delivered, has latitude in establishing price for the product, <strong>and</strong> is<br />
subject to the customer credit risk. In January 2001, the California Department of Water Resources (“DWR”) began purchasing<br />
electricity to meet the portion of dem<strong>and</strong> of the California investor-owned electric utilities that was not being satisfied from the<br />
utilities’ own generation facilities <strong>and</strong> existing electricity contracts. The Utility acts as a billing <strong>and</strong> collection agent on behalf of the<br />
DWR <strong>and</strong> does not have any authority to set prices for the energy delivered. The Utility does not assume customer credit risk nor take<br />
title to the electricity being delivered to the customer. Therefore, the Utility presents the electricity revenues for amounts delivered to<br />
customers net of the cost of electricity delivered by the DWR.<br />
Income Taxes<br />
PG&E Corporation <strong>and</strong> the Utility use the liability method of accounting for income taxes. Income tax provision (benefit)<br />
includes current <strong>and</strong> deferred income taxes resulting from operations during the year. Investment tax credits are deferred <strong>and</strong><br />
amortized to income over time. The Utility amortizes its investment tax credits over the life of the related property in accordance with<br />
regulatory treatment. PG&E Corporation amortizes its investment tax credits over the projected investment recovery period or the life<br />
of the arrangement for its tax equity arrangements. (See Note 9 below.)<br />
PG&E Corporation <strong>and</strong> the Utility recognize a tax benefit if it is more likely than not that a tax position taken or expected to<br />
be taken in a tax return will be sustained upon examination by taxing authorities based on the merits of the position. The tax benefit<br />
recognized in the financial statements is measured based on the largest amount of benefit that is greater than 50% likely of being<br />
realized upon settlement. The difference between a tax position taken or expected to be taken in a tax return <strong>and</strong> the benefit<br />
recognized <strong>and</strong> measured pursuant to this guidance represents an unrecognized tax benefit.<br />
PG&E Corporation files a consolidated U.S. federal income tax return that includes domestic subsidiaries in which its<br />
ownership is 80% or more. In addition, PG&E Corporation files a combined state income tax return in California. PG&E Corporation<br />
<strong>and</strong> the Utility are parties to a tax-sharing agreement under which the Utility determines its income tax provision (benefit) on a<br />
st<strong>and</strong>-alone basis.<br />
Nuclear Decommissioning Trusts<br />
The Utility’s nuclear power facilities consist of two units at Diablo Canyon <strong>and</strong> the retired facility at Humboldt Bay. Nuclear<br />
decommissioning requires the safe removal of nuclear facilities from service <strong>and</strong> the reduction of residual radioactivity to a level that<br />
permits termination of the Nuclear Regulatory Commission (“NRC”) license <strong>and</strong> release of the property for unrestricted use. The<br />
Utility's nuclear decommissioning costs are recovered from customers through rates.<br />
The Utility classifies its investments held in the nuclear decommissioning trust as “available-for-sale.” As the Utility’s<br />
<strong>FERC</strong> FORM NO. 1 (ED. 12-88) Page 123.7
Name of Respondent<br />
PACIFIC GAS AND ELECTRIC COMPANY<br />
This Report is:<br />
(1) X An Original<br />
(2) A Resubmission<br />
Date of Report<br />
(Mo, Da, Yr)<br />
04/08/2011<br />
Year/Period of Report<br />
<strong>2010</strong>/Q4<br />
NOTES TO FINANCIAL STATEMENTS (Continued)<br />
nuclear decommissioning trust assets are managed by external investment managers, the Utility does not have the ability to sell its<br />
investments at their discretion. Therefore, all unrealized losses are considered other-than-temporary impairments. Gains or losses on<br />
the nuclear decommissioning trust investments are refundable or recoverable, respectively, from customers. Therefore, trust earnings<br />
are deferred <strong>and</strong> included in the regulatory liability for recoveries in excess of the ARO. There is no impact on the Utility’s earnings<br />
or accumulated other comprehensive income. The cost of debt <strong>and</strong> equity securities sold is determined by specific identification.<br />
Accounting for Derivatives <strong>and</strong> Hedging Activities<br />
Derivative instruments are recorded in PG&E Corporation’s <strong>and</strong> the Utility’s Consolidated Balance Sheets at fair value,<br />
unless they qualify for the normal purchase <strong>and</strong> sales exception. Changes in the fair value of derivative instruments are recorded in<br />
earnings or, to the extent that they are recoverable through regulated rates, are deferred <strong>and</strong> recorded in regulatory accounts.<br />
Derivative instruments may be designated as cash flow hedges when they are entered into in order to hedge variable price risk<br />
associated with the purchase of commodities. For cash flow hedges, fair value changes are deferred in accumulated other<br />
comprehensive income <strong>and</strong> recognized in earnings as the hedged transactions occur, unless they are recovered in rates, in which case<br />
they are recorded in regulatory accounts.<br />
As of September 30, 2009, the Utility de-designated all cash flow hedge relationships. Due to the regulatory accounting<br />
treatment described above, the de-designation of cash flow hedge relationships had no impact on net income or the Consolidated<br />
Balance Sheets.<br />
The normal purchase <strong>and</strong> sales exception to derivative accounting requires, among other things, physical delivery of<br />
quantities expected to be used or sold over a reasonable period in the normal course of business. Transactions for which the normal<br />
purchase <strong>and</strong> sales exception is elected are not reflected in the Consolidated Balance Sheets at fair value. They are accounted for<br />
under the accrual method of accounting. Therefore, expenses are recognized as incurred.<br />
PG&E Corporation <strong>and</strong> the Utility offset the cash collateral paid or cash collateral received against the fair value amounts<br />
recognized for derivative instruments executed with the same counterparty under a master netting arrangement where the right of offset<br />
exists <strong>and</strong> where PG&E Corporation <strong>and</strong> the Utility intends to set off. (See Note 10 below.)<br />
Fair Value Measurements<br />
PG&E Corporation <strong>and</strong> the Utility determine the fair value of certain assets <strong>and</strong> liabilities based on assumptions that market<br />
participants would use in pricing the assets or liabilities. Fair value is defined as the price that would be received to sell an asset or<br />
paid to transfer a liability in an orderly transaction between market participants at the measurement date, or the “exit price.” PG&E<br />
Corporation <strong>and</strong> the Utility utilize a fair value hierarchy that prioritizes the inputs to valuation techniques used to measure fair value<br />
<strong>and</strong> give precedence to observable inputs in determining fair value. An instrument’s level within the hierarchy is based on the lowest<br />
level of any significant input to the fair value measurement. The hierarchy gives the highest priority to unadjusted quoted prices in<br />
active markets for identical assets or liabilities (Level 1 measurements) <strong>and</strong> the lowest priority to unobservable inputs (Level 3<br />
measurements). (See Note 11 below.)<br />
Adoption of New Accounting Pronouncements<br />
Improvements to Financial Reporting by Enterprises Involved with Variable Interest Entities<br />
On January 1, <strong>2010</strong>, PG&E Corporation <strong>and</strong> the Utility adopted an accounting st<strong>and</strong>ards update that changes when <strong>and</strong> how<br />
to determine, or re-determine, whether an entity is a variable interest entity (“VIE”), which could require consolidation. In addition,<br />
the accounting st<strong>and</strong>ards update replaces the quantitative approach for determining who has a controlling financial interest in a VIE<br />
with a qualitative approach <strong>and</strong> requires ongoing assessments of whether an entity is the primary beneficiary of a VIE. The adoption<br />
of the accounting st<strong>and</strong>ards update did not have a material impact on PG&E Corporation’s or the Utility’s Consolidated Financial<br />
Statements.<br />
PG&E Corporation <strong>and</strong> the Utility are required to consolidate any entities that they control. In most cases, control can be<br />
<strong>FERC</strong> FORM NO. 1 (ED. 12-88) Page 123.8
Name of Respondent<br />
PACIFIC GAS AND ELECTRIC COMPANY<br />
This Report is:<br />
(1) X An Original<br />
(2) A Resubmission<br />
Date of Report<br />
(Mo, Da, Yr)<br />
04/08/2011<br />
Year/Period of Report<br />
<strong>2010</strong>/Q4<br />
NOTES TO FINANCIAL STATEMENTS (Continued)<br />
determined based on majority ownership or voting interests. However, for certain entities, control is difficult to discern based on<br />
ownership or voting interests alone. These entities are referred to as VIEs. A VIE is an entity that does not have sufficient equity at<br />
risk to finance its activities without additional subordinated financial support from other parties, or whose equity investors lack any<br />
characteristics of a controlling financial interest. An enterprise has a controlling financial interest if it has the obligation to absorb<br />
expected losses or receive expected gains that could potentially be significant to a VIE <strong>and</strong> the power to direct the activities that are<br />
most significant to a VIE’s economic performance. An enterprise that has a controlling financial interest is known as the VIE’s<br />
primary beneficiary <strong>and</strong> is required to consolidate the VIE.<br />
Some of the counterparties to the Utility’s power purchase agreements are considered VIEs. In determining whether the<br />
Utility has a controlling financial interest in a VIE, the Utility must first assess whether it absorbs any of the VIE’s expected losses or<br />
receives any portion of the VIE’s expected residual returns, as a result of power purchase agreements. This assessment includes an<br />
evaluation of how the risks <strong>and</strong> rewards associated with the power plant’s activities are absorbed by variable interest holders. These<br />
VIEs are typically exposed to credit risk, production risk, commodity price risk, <strong>and</strong> any applicable tax incentive risks, among others.<br />
The Utility analyzes the variability in the VIE’s gross margin <strong>and</strong> the impact of power purchase agreements on the gross margin to<br />
determine whether the Utility absorbs variability, resulting in a variable interest. Factors that may be considered when assessing the<br />
impact of a power purchase agreement on the VIE’s gross margin include the pricing structure of the power purchase agreement <strong>and</strong><br />
the cost of inputs <strong>and</strong> production, which depend on the technology of the power plant.<br />
For each variable interest, the Utility must also assess whether it has the power to direct the activities of the power plant that<br />
most directly impact the VIE’s economic performance. This assessment considers any decision-making rights associated with<br />
designing the VIE, any dispatch rights, any operating <strong>and</strong> maintenance activities, <strong>and</strong> any re-marketing activities of the power plant<br />
after the end of the power purchase agreement with the Utility.<br />
The Utility held a variable interest in several entities that own power plants that generate electricity for sale to the Utility<br />
under power purchase agreements. Each of these VIEs was designed to own a power plant that would generate electricity for sale to<br />
the Utility utilizing various technologies such as natural gas, wind, solar photovoltaic, solar thermal, <strong>and</strong> hydroelectric. Under each of<br />
these power purchase agreements, the Utility is obligated to purchase electricity or capacity, or both, from the VIE. The Utility did not<br />
provide any other support to these VIEs, <strong>and</strong> the Utility’s financial exposure is limited to the amount it pays for delivered electricity<br />
<strong>and</strong> capacity. (See Note 15 below.) The Utility does not have the power to direct the activities that are most significant to these VIE’s<br />
economic performance. As a result, the Utility does not have a controlling financial interest in any of these VIEs. Therefore, at<br />
December 31, <strong>2010</strong>, the Utility was not the primary beneficiary of, <strong>and</strong> did not consolidate, any of these VIEs.<br />
The Utility continued to consolidate PG&E Energy Recovery Funding LLC (“PERF”) at December 31, <strong>2010</strong>, as the Utility is<br />
the primary beneficiary of PERF. The Utility has a controlling financial interest in PERF since the Utility is exposed to PERF’s losses<br />
<strong>and</strong> returns through the Utility’s 100% equity investment in PERF <strong>and</strong> the Utility was involved in the design of PERF, which was an<br />
activity that was significant to PERF’s economic performance. The assets of PERF were $897 million at December 31, <strong>2010</strong> <strong>and</strong><br />
primarily consisted of assets related to energy recovery bonds (“ERBs”), which are included in other noncurrent assets – regulatory<br />
assets in the Consolidated Balance Sheets. The liabilities of PERF were $827 million at December 31, <strong>2010</strong> <strong>and</strong> consisted of energy<br />
recovery bonds, which are included in current <strong>and</strong> noncurrent liabilities in the Consolidated Balance Sheets. (See Note 5 below.) The<br />
assets of PERF are only available to settle the liabilities of PERF.<br />
As of December 31, <strong>2010</strong>, PG&E Corporation’s affiliates had entered into four tax equity agreements with privately held<br />
companies to fund residential <strong>and</strong> commercial retail solar energy installations. Under these agreements, PG&E Corporation will<br />
provide payments of up to $300 million to these companies, <strong>and</strong> in return, receive the benefits from local rebates, federal investment<br />
tax credits or grants, <strong>and</strong> a share of these companies’ customer payments. PG&E Corporation could be required to pay up to an<br />
additional $41 million in the event that its ownership interests are liquidated when in a deficit position. However, PG&E<br />
Corporation’s financial exposure from these agreements is generally limited to its lease payments <strong>and</strong> investment contributions to these<br />
companies. As of December 31, <strong>2010</strong>, PG&E Corporation had made total payments of $149 million under these agreements primarily<br />
related to its lease payments <strong>and</strong> investment contributions to these companies. These amounts are recorded in other noncurrent assets<br />
– other in PG&E Corporation’s Consolidated Balance Sheet. PG&E Corporation holds a variable interest in these companies as a<br />
result of these agreements. When determining whether PG&E Corporation is the primary beneficiary of these companies, it evaluated<br />
which party has control over their significant economic activities such as designing the companies, vendor selection, construction,<br />
<strong>FERC</strong> FORM NO. 1 (ED. 12-88) Page 123.9
Name of Respondent<br />
PACIFIC GAS AND ELECTRIC COMPANY<br />
This Report is:<br />
(1) X An Original<br />
(2) A Resubmission<br />
Date of Report<br />
(Mo, Da, Yr)<br />
04/08/2011<br />
Year/Period of Report<br />
<strong>2010</strong>/Q4<br />
NOTES TO FINANCIAL STATEMENTS (Continued)<br />
customer selection, <strong>and</strong> re-marketing activities at the end of customer leases. As these activities are under the control of these<br />
companies, PG&E Corporation was not the primary beneficiary of, <strong>and</strong> did not consolidate, any of these companies at December 31,<br />
<strong>2010</strong>.<br />
NOTE 3: REGULATORY ASSETS, LIABILITIES, AND BALANCING ACCOUNTS<br />
Regulatory Assets<br />
Current Regulatory Assets<br />
At December 31, <strong>2010</strong> <strong>and</strong> 2009, the Utility had current regulatory assets of $599 million <strong>and</strong> $427 million, respectively,<br />
consisting primarily of price risk management regulatory assets. The current portion of price risk management regulatory assets<br />
represents the deferral of unrealized losses related to price risk management derivative instruments with terms of one year or less. (See<br />
Note 10 below.)<br />
Long-Term Regulatory Assets<br />
Long-term regulatory assets are composed of the following:<br />
Balance at December 31,<br />
(in millions) <strong>2010</strong> 2009<br />
Pension benefits $ 1,759 $ 1,386<br />
Deferred income taxes 1,250 1,027<br />
Energy recovery bonds 735 1,124<br />
Utility retained generation 666 737<br />
Environmental compliance costs 450 408<br />
Price risk management 424 346<br />
Unamortized loss, net of gain, on reacquired debt 181 203<br />
Other 381 291<br />
Total long-term regulatory assets $ 5,846 $ 5,522<br />
The regulatory asset for pension benefits represents the cumulative differences between amounts recognized for ratemaking<br />
purposes <strong>and</strong> amounts recognized in accordance with GAAP, which also includes amounts that otherwise would be fully recorded to<br />
accumulated other comprehensive loss in the Consolidated Balance Sheets. (See Note 12 below.)<br />
The regulatory assets for deferred income taxes represent deferred income tax benefits previously passed through to<br />
customers. The CPUC requires the Utility to pass through certain tax benefits to customers by reducing rates, thereby ignoring the<br />
effect of deferred taxes on rates. Based on current regulatory ratemaking <strong>and</strong> income tax laws, the Utility expects to recover these<br />
regulatory assets over average plant depreciation lives of 1 to 45 years.<br />
The regulatory asset for ERBs represents the refinancing of the regulatory asset provided for in the settlement agreement<br />
entered into between PG&E Corporation, the Utility, <strong>and</strong> the CPUC in 2003 to resolve the Utility’s proceeding under Chapter 11 of the<br />
U.S. Bankruptcy Code (“Chapter 11 Settlement Agreement”). (See Note 5 below.) The regulatory asset is amortized over the life of<br />
the bonds, consistent with the period over which the related revenues <strong>and</strong> bond-related expenses are recognized. The Utility expects to<br />
fully recover this asset by the end of 2012 when the ERBs mature.<br />
In connection with the Chapter 11 Settlement Agreement, the CPUC authorized the Utility to recover $1.2 billion of costs<br />
related to the Utility’s retained generation assets. The individual components of these regulatory assets are being amortized over the<br />
respective lives of the underlying generation facilities, consistent with the period over which the related revenues are recognized. The<br />
weighted average remaining life of the assets is 13 years.<br />
The regulatory assets for environmental compliance costs represent the portion of estimated environmental remediation costs<br />
<strong>FERC</strong> FORM NO. 1 (ED. 12-88) Page 123.10
Name of Respondent<br />
PACIFIC GAS AND ELECTRIC COMPANY<br />
This Report is:<br />
(1) X An Original<br />
(2) A Resubmission<br />
Date of Report<br />
(Mo, Da, Yr)<br />
04/08/2011<br />
Year/Period of Report<br />
<strong>2010</strong>/Q4<br />
NOTES TO FINANCIAL STATEMENTS (Continued)<br />
that the Utility expects to recover in future rates as actual remediation costs are incurred. The Utility expects to recover these costs<br />
over the next 32 years. (See Note 15 below.)<br />
Price risk management regulatory assets represent the deferral of unrealized losses related to price risk management derivative<br />
instruments with terms in excess of one year. (See Note 10 below.)<br />
The regulatory assets for unamortized loss, net of gain, on reacquired debt represent costs related to debt reacquired or<br />
redeemed prior to maturity with associated discount <strong>and</strong> debt issuance costs. These costs are expected to be recovered over the next<br />
16 years, which is the remaining amortization period of the reacquired debt. The Utility expects to fully recover these costs by 2026.<br />
At December 31, <strong>2010</strong> <strong>and</strong> 2009, “other” primarily consisted of regulatory assets relating to ARO expenses for<br />
decommissioning of the Utility’s fossil-fuel generation facilities that are probable of future recovery through the ratemaking process;<br />
costs that the Utility incurred in terminating a 30-year power purchase agreement which are being amortized <strong>and</strong> collected in rates<br />
through September 2014; <strong>and</strong> costs incurred in relation to the Utility’s plan of reorganization under Chapter 11 that became effective<br />
in April 2004. Additionally, at December 31, <strong>2010</strong>, “other” included removal costs associated with the replacement of old<br />
electromechanical meters with SmartMeter devices.<br />
In general, the Utility does not earn a return on regulatory assets if the related costs do not accrue interest. Accordingly, the<br />
Utility earns a return only on its retained generation regulatory assets <strong>and</strong> regulatory assets for unamortized loss, net of gain, on<br />
reacquired debt.<br />
Regulatory Liabilities<br />
Current Regulatory Liabilities<br />
At December 31, <strong>2010</strong> <strong>and</strong> 2009, the Utility had current regulatory liabilities of $81 million <strong>and</strong> $163 million, respectively,<br />
primarily consisting of amounts that the Utility expects to refund to customers for over-collected electric transmission rates <strong>and</strong><br />
amounts that the Utility expects to refund to electric transmission customers for their portion of settlements the Utility entered into with<br />
various electricity suppliers to resolve certain remaining Chapter 11 disputed claims. Current regulatory liabilities are included in<br />
current liabilities – other in the Consolidated Balance Sheets.<br />
Long-Term Regulatory Liabilities<br />
Long-term regulatory liabilities are composed of the following:<br />
Balance at December 31,<br />
(in millions) <strong>2010</strong> 2009<br />
Cost of removal obligation $ 3,229 $ 2,933<br />
Recoveries in excess of ARO 600 488<br />
Public purpose programs 573 508<br />
Other 123 196<br />
Total long-term regulatory liabilities $ 4,525 $ 4,125<br />
The regulatory liability for the Utility’s cost of removal obligations represents differences between amounts collected in rates<br />
for asset removal costs <strong>and</strong> the asset removal costs recorded in accordance with GAAP.<br />
The regulatory liability for recoveries in excess of ARO represents differences between amounts collected in rates for<br />
decommissioning the Utility’s nuclear power facilities <strong>and</strong> the ARO expenses recorded in accordance with GAAP. Decommissioning<br />
costs recovered in rates are placed in nuclear decommissioning trusts. The regulatory liability for recoveries in excess of ARO also<br />
represents the deferral of realized <strong>and</strong> unrealized gains <strong>and</strong> losses on those nuclear decommissioning trust assets.<br />
The regulatory liability for public purpose programs represents amounts received from customers designated for public<br />
<strong>FERC</strong> FORM NO. 1 (ED. 12-88) Page 123.11
Name of Respondent<br />
PACIFIC GAS AND ELECTRIC COMPANY<br />
This Report is:<br />
(1) X An Original<br />
(2) A Resubmission<br />
Date of Report<br />
(Mo, Da, Yr)<br />
04/08/2011<br />
Year/Period of Report<br />
<strong>2010</strong>/Q4<br />
NOTES TO FINANCIAL STATEMENTS (Continued)<br />
purpose programs costs that are expected to be incurred in the future. The public purpose programs regulatory liabilities primarily<br />
consist of revenues collected from customers to pay for costs that the Utility expects to incur in the future under energy efficiency<br />
programs designed to encourage the manufacture, design, distribution, <strong>and</strong> customer use of energy efficient appliances <strong>and</strong> other<br />
energy-using products; under the California Solar Initiative program to promote the use of solar energy in residential homes <strong>and</strong><br />
commercial, industrial, <strong>and</strong> agricultural properties; <strong>and</strong> under the Self-Generation Incentive program to promote distributed generation<br />
technologies installed on the customer’s side of the Utility meter that provide electricity <strong>and</strong> gas for all or a portion of that customer’s<br />
load.<br />
“Other” at December 31, <strong>2010</strong> <strong>and</strong> 2009 primarily consisted of regulatory liabilities related to the gain associated with the<br />
Utility’s acquisition of the permits <strong>and</strong> other assets related to the Gateway Generating Station as part of a settlement that the Utility<br />
entered into with Mirant Corporation <strong>and</strong> insurance recoveries for hazardous substance remediation.<br />
Regulatory Balancing Accounts<br />
The Utility’s current regulatory balancing accounts represent the amounts expected to be received from or refunded to the<br />
Utility’s customers through authorized rate adjustments within the next 12 months. Regulatory balancing accounts that the Utility does<br />
not expect to collect or refund in the next 12 months are included in other noncurrent assets – regulatory assets <strong>and</strong> noncurrent<br />
liabilities – regulatory liabilities in the Consolidated Balance Sheets.<br />
Current Regulatory Balancing Accounts, net<br />
Receivable (Payable)<br />
Balance at December 31,<br />
(in millions) <strong>2010</strong> 2009<br />
Utility generation $ 303 $ 355<br />
Public purpose programs 164 83<br />
Distribution revenue adjustment mechanism 145 152<br />
<strong>Gas</strong> fixed cost 56 93<br />
Hazardous substance 38 30<br />
Other 143 115<br />
Total regulatory balancing accounts, net $ 849 $ 828<br />
The utility generation balancing account is used to record <strong>and</strong> recover the authorized revenue requirements associated with<br />
Utility-owned electric generation, including capital <strong>and</strong> related non-fuel operating <strong>and</strong> maintenance expenses. The distribution revenue<br />
adjustment mechanism balancing account is used to record <strong>and</strong> recover the authorized electric distribution revenue requirements <strong>and</strong><br />
certain other electric distribution-related authorized costs. The Utility’s recovery of these revenue requirements is independent, or<br />
“decoupled,” from the volume of sales; therefore, the Utility recognizes revenue evenly over the year, even though the level of cash<br />
collected from customers will fluctuate depending on the volume of electricity sales. During periods of more temperate weather, there<br />
is generally an under-collection in this balancing account due to lower electricity sales <strong>and</strong> lower rates. During the warmer months of<br />
summer, there is generally an over-collection due to higher rates <strong>and</strong> electric usage that cause an increase in generation billings.<br />
The public purpose programs balancing accounts primarily track the recovery of the authorized public purpose program<br />
revenue requirements <strong>and</strong> incentive awards earned by the Utility for implementing customer energy efficiency programs. The public<br />
purpose programs primarily consist of the energy efficiency programs; low-income energy efficiency programs; research, development,<br />
<strong>and</strong> demonstration programs; <strong>and</strong> renewable energy programs.<br />
The gas fixed cost balancing account is used to track the recovery of CPUC-authorized gas distribution revenue requirements<br />
<strong>and</strong> certain other gas distribution-related costs. The under-collected or over-collected position of this account is dependent on<br />
seasonality <strong>and</strong> volatility in gas volumes.<br />
<strong>FERC</strong> FORM NO. 1 (ED. 12-88) Page 123.12
Name of Respondent<br />
PACIFIC GAS AND ELECTRIC COMPANY<br />
This Report is:<br />
(1) X An Original<br />
(2) A Resubmission<br />
Date of Report<br />
(Mo, Da, Yr)<br />
04/08/2011<br />
Year/Period of Report<br />
<strong>2010</strong>/Q4<br />
NOTES TO FINANCIAL STATEMENTS (Continued)<br />
The hazardous substance balancing accounts are used to track recoverable hazardous substance clean up costs through the<br />
CPUC-approved ratemaking mechanism that authorizes the Utility to recover 90% of hazardous waste remediation costs. The current<br />
balance represents eligible remediation costs incurred by the Utility during 2009 that will be recovered through an annual true-up filing<br />
with the CPUC in January 2011. (See Note 15 below.)<br />
At December 31, <strong>2010</strong> <strong>and</strong> 2009, “other” primarily consisted of balancing accounts that track recovery of the authorized<br />
revenue requirements <strong>and</strong> costs related to the SmartMeterTM advanced metering project.<br />
NOTE 4: DEBT<br />
Long-Term Debt<br />
The following table summarizes PG&E Corporation’s <strong>and</strong> the Utility’s long-term debt:<br />
December 31,<br />
(in millions) <strong>2010</strong> 2009<br />
PG&E Corporation<br />
Convertible subordinated notes, 9.50%, due <strong>2010</strong> $ - $ 247<br />
Less: current portion - (247)<br />
Total convertible subordinated notes - -<br />
Senior notes, 5.75%, due 2014 350 350<br />
Unamortized discount (1) (2)<br />
Total senior notes 349 348<br />
Total PG&E Corporation long-term debt, net of current portion 349 348<br />
Utility<br />
Senior notes:<br />
4.20% due 2011 500 500<br />
6.25% due 2013 400 400<br />
4.80% due 2014 1,000 1,000<br />
5.625% due 2017 700 700<br />
8.25% due 2018 800 800<br />
3.50% due 2020 800 -<br />
6.05% due 2034 3,000 3,000<br />
5.80% due 2037 950 700<br />
6.35% due 2038 400 400<br />
6.25% due 2039 550 550<br />
5.40% due 2040 800 550<br />
Less: current portion (500) -<br />
Unamortized discount, net of premium (52) (35)<br />
Total senior notes 9,348 8,565<br />
Pollution control bonds:<br />
Series 1996 C, E, F, 1997 B, variable rates (1), due 2026 (2) 614 614<br />
Series 1996 A, 5.35%, due 2016 (3) 200 200<br />
Series 2004 A-D, 4.75%, due 2023 (3) 345 345<br />
Series 2008 G <strong>and</strong> F, 3.75% (4), due 2018 <strong>and</strong> 2026 - 95<br />
Series 2009 A-D, variable rates (5), due 2016 <strong>and</strong> 2026 (6) 309 309<br />
Series <strong>2010</strong> E, 2.25%, due 2026 (7) 50 -<br />
Less: current portion (309) (95)<br />
Total pollution control bonds 1,209 1,468<br />
<strong>FERC</strong> FORM NO. 1 (ED. 12-88) Page 123.13
Name of Respondent<br />
PACIFIC GAS AND ELECTRIC COMPANY<br />
This Report is:<br />
(1) X An Original<br />
(2) A Resubmission<br />
Date of Report<br />
(Mo, Da, Yr)<br />
04/08/2011<br />
Year/Period of Report<br />
<strong>2010</strong>/Q4<br />
NOTES TO FINANCIAL STATEMENTS (Continued)<br />
Total Utility long-term debt, net of current portion 10,557 10,033<br />
Total consolidated long-term debt, net of current portion $ 10,906 $ 10,381<br />
(1) At December 31, <strong>2010</strong>, interest rates on these bonds <strong>and</strong> the related loans ranged from 0.26% to 0.31%.<br />
(2) Each series of these bonds is supported by a separate direct-pay letter of credit that expires on February 26, 2012. Although the stated maturity<br />
date is 2026, each series will remain outst<strong>and</strong>ing only if the Utility extends or replaces the letter of credit related to the series or otherwise obtains a<br />
consent from the issuer to the continuation of the series without a credit facility.<br />
(3) The Utility has obtained credit support from insurance companies for these bonds.<br />
(4) These bonds bore interest at 3.75% per year through September 19, <strong>2010</strong>, <strong>and</strong> were subject to m<strong>and</strong>atory tender on September 20, <strong>2010</strong>. The<br />
Utility repurchased these bonds on September 20, <strong>2010</strong>.<br />
(5) At December 31, <strong>2010</strong>, interest rates on these bonds <strong>and</strong> the related loans ranged from 0.22% to 0.29%.<br />
(6) Each series of these bonds is supported by a separate direct-pay letter of credit that expires on October 29, 2011. The Utility may choose to<br />
provide a substitute letter of credit for any series of these bonds, subject to a rating requirement.<br />
(7) These bonds bear interest at 2.25% per year through April 1, 2012, are subject to m<strong>and</strong>atory tender on April 2, 2012, <strong>and</strong> may be remarketed in a<br />
fixed or variable rate mode.<br />
PG&E Corporation<br />
Convertible Subordinated Notes<br />
PG&E Corporation issued 16,370,779 shares of common stock upon conversion of the $247 million principal amount of<br />
PG&E Corporation’s 9.5% Convertible Subordinated Notes at a conversion price of $15.09 per share between June 23 <strong>and</strong> June 29,<br />
<strong>2010</strong>. These notes were no longer outst<strong>and</strong>ing as of December 31, <strong>2010</strong>.<br />
Utility<br />
Senior Notes<br />
On April 1, <strong>2010</strong>, the Utility issued $250 million principal amount of 5.8% Senior Notes due March 1, 2037.<br />
On September 15, <strong>2010</strong>, the Utility issued $550 million principal amount of 3.5% Senior Notes due October 1, 2020.<br />
On November 18, <strong>2010</strong>, the Utility issued $250 million principal amount of 3.5% Senior Notes due October 1, 2020 <strong>and</strong> $250<br />
million of 5.4% Senior Notes due January 15, 2040.<br />
Pollution Control Bonds<br />
The California Pollution Control Financing Authority <strong>and</strong> the California Infrastructure <strong>and</strong> Economic Development Bank<br />
have issued various series of fixed rate <strong>and</strong> multi-modal tax-exempt pollution control bonds for the benefit of the Utility. Under the<br />
pollution control bond loan agreements related to the Series 1996 A bonds, the Series 2004 A–D bonds, <strong>and</strong> the Series <strong>2010</strong> E bonds,<br />
the Utility is obligated to pay on the due dates an amount equal to the principal; premium, if any; <strong>and</strong> interest on these bonds to the<br />
trustees for these bonds. With respect to the Series 1996 C, E, <strong>and</strong> F bonds; the Series 1997 B bonds; <strong>and</strong> the Series 2009 A–D bonds<br />
which currently bear interest at variable rates, the Utility reimburses the letter of credit providers for their payments to the trustee for<br />
these bonds, or if a letter of credit provider fails to pay under its respective letter of credit, the Utility is obligated to pay the principal;<br />
premium, if any; <strong>and</strong> interest on those bonds. All payments on the Series 1996 C, E, <strong>and</strong> F bonds; the Series 1997 B bonds; <strong>and</strong> the<br />
Series 2009 A–D bonds are made through draws on separate direct-pay letters of credit for each series issued by a financial institution.<br />
The Utility has obtained credit support from insurance companies for the Series 1996 A bonds <strong>and</strong> the Series 2004 A–D<br />
bonds such that if the Utility does not pay the principal <strong>and</strong> interest on any series of these insured bonds, the bond insurer for that<br />
series will pay the principal <strong>and</strong> interest.<br />
<strong>FERC</strong> FORM NO. 1 (ED. 12-88) Page 123.14
Name of Respondent<br />
PACIFIC GAS AND ELECTRIC COMPANY<br />
This Report is:<br />
(1) X An Original<br />
(2) A Resubmission<br />
Date of Report<br />
(Mo, Da, Yr)<br />
04/08/2011<br />
Year/Period of Report<br />
<strong>2010</strong>/Q4<br />
NOTES TO FINANCIAL STATEMENTS (Continued)<br />
On April 8, <strong>2010</strong>, the California Infrastructure <strong>and</strong> Economic Development Bank issued $50 million of tax-exempt pollution<br />
control bonds Series <strong>2010</strong> E due November 1, 2026 <strong>and</strong> loaned the proceeds to the Utility. The proceeds were used to refund the<br />
corresponding related series of pollution control bonds issued in 2005 which were repurchased by the Utility in 2008. The Series <strong>2010</strong><br />
E bonds bear interest at 2.25% per year through April 1, 2012 <strong>and</strong> are subject to m<strong>and</strong>atory tender on April 2, 2012 at a price of 100%<br />
of the principal amount plus accrued interest. Thereafter, this series of bonds may be remarketed in a fixed or variable rate mode.<br />
Interest is currently payable semi-annually in arrears on April 1 <strong>and</strong> October 1.<br />
On September 20, <strong>2010</strong>, the Utility repurchased $50 million principal amount of pollution control bonds Series 2008 F <strong>and</strong><br />
$45 million principal amount of pollution control bonds Series 2008 G that were subject to m<strong>and</strong>atory tender on the same date. The<br />
Utility, as bondholder, will be both the payer <strong>and</strong> the recipient of principal <strong>and</strong> interest payments until the bonds are remarketed to the<br />
public. As of December 31, <strong>2010</strong>, the bonds have not been remarketed to the public.<br />
All of the pollution control bonds were used to finance or refinance pollution control <strong>and</strong> sewage <strong>and</strong> solid waste disposal<br />
facilities at the Geysers geothermal power plant or at the Utility’s Diablo Canyon nuclear power plant <strong>and</strong> were issued as “exempt<br />
facility bonds” within the meaning of the Internal Revenue Code of 1954, as amended. In 1999, the Utility sold the Geysers<br />
geothermal power plant to Geysers Power <strong>Company</strong>, LLC pursuant to purchase <strong>and</strong> sale agreements stating that Geysers Power<br />
<strong>Company</strong>, LLC will use the bond-financed facilities solely as pollution control facilities. The Utility has no knowledge that Geysers<br />
Power <strong>Company</strong>, LLC intends to cease using the bond-financed facilities solely as pollution control facilities.<br />
Repayment Schedule<br />
PG&E Corporation’s <strong>and</strong> the Utility’s combined aggregate principal repayment amounts of long-term debt at December 31,<br />
<strong>2010</strong> are reflected in the table below:<br />
(in millions, except interest rates) 2011 2012 2013 2014 2015 Thereafter Total<br />
Long-term debt:<br />
PG&E Corporation<br />
Average fixed interest rate - - - 5.75% - - 5.75%<br />
Fixed rate obligations $ - $ - $ - $ 350 $ - $ - $ 350<br />
Utility<br />
Average fixed interest rate 4.20% 2.25% 6.25% 4.80% - 5.85% 5.67%<br />
Fixed rate obligations $ 500 $ 50(2) $ 400 $ 1,000 $ - $ 8,545 $ 10,495<br />
Variable interest rate as of December 31, <strong>2010</strong> 0.27% 0.28% - - - - 0.28%<br />
Variable rate obligations $ 309(1) $ 614(3) $ - $ - $ - $ - $ 923<br />
Less: current portion (809) - - - - - (809)<br />
Total consolidated long-term debt $ - $ 664 $ 400 $ 1,350 $ - $ 8,545 $ 10,959<br />
(1) These bonds, due from 2016 through 2026, are backed by direct-pay letters of credit that expire on October 29, 2011. The bonds will be subject to a<br />
m<strong>and</strong>atory redemption unless the letter of credit is extended or replaced or the issuer consents to the continuation of these series without a credit facility.<br />
Accordingly, the bonds have been classified for repayment purposes in 2011.<br />
(2) These bonds, due in 2026, are subject to m<strong>and</strong>atory tender on April 2, 2012 <strong>and</strong> may be remarketed in a fixed or variable rate mode. Accordingly, the<br />
bonds have been classified for repayment purposes in 2012.<br />
(3) These bonds, due in 2026, are backed by direct-pay letters of credit that expire on February 26, 2012. The bonds will be subject to a m<strong>and</strong>atory<br />
redemption unless the letters of credit are extended or replaced. Accordingly, the bonds have been classified for repayment purposes in 2012.<br />
Credit Facilities <strong>and</strong> Short-Term Borrowings<br />
The following table summarizes PG&E Corporation’s <strong>and</strong> the Utility’s borrowings on outst<strong>and</strong>ing credit facilities at<br />
<strong>FERC</strong> FORM NO. 1 (ED. 12-88) Page 123.15
Name of Respondent<br />
PACIFIC GAS AND ELECTRIC COMPANY<br />
This Report is:<br />
(1) X An Original<br />
(2) A Resubmission<br />
Date of Report<br />
(Mo, Da, Yr)<br />
04/08/2011<br />
Year/Period of Report<br />
<strong>2010</strong>/Q4<br />
NOTES TO FINANCIAL STATEMENTS (Continued)<br />
December 31, <strong>2010</strong>:<br />
Letters of<br />
Commercial<br />
Termination Facility Credit Out- Cash Paper<br />
(in millions) Date Limit st<strong>and</strong>ing Borrowings Backup Availability<br />
PG&E Corporation February 2012 $ 187 (1) $ - $ - N/A $ 187<br />
Utility February 2012 1,940 (2) 329 - $ 603 1,008<br />
Utility February 2012 750 (3) N/A - - 750<br />
Total credit facilities $ 2,877 $ 329 $ - $ 603 $ 1,945<br />
(1) Includes a $87 million sublimit for letters of credit <strong>and</strong> a $100 million commitment for “swingline” loans, defined as loans that are made available on<br />
a same-day basis <strong>and</strong> are repayable in full within 30 days.<br />
(2) Includes a $921 million sublimit for letters of credit <strong>and</strong> a $200 million commitment for swingline loans.<br />
(3) Includes a $75 million commitment for swingline loans.<br />
PG&E Corporation<br />
Revolving credit facility<br />
PG&E Corporation has a $187 million revolving credit facility with a syndicate of lenders that expires on February 26, 2012.<br />
Borrowings under the revolving credit facility <strong>and</strong> letters of credit may be used for working capital <strong>and</strong> other corporate purposes.<br />
PG&E Corporation can, at any time, repay amounts outst<strong>and</strong>ing in whole or in part. At PG&E Corporation’s request <strong>and</strong> at the sole<br />
discretion of each lender, the revolving credit facility may be extended for additional periods. PG&E Corporation has the right to<br />
increase, in one or more requests given no more than once a year, the aggregate facility by up to $100 million provided that certain<br />
conditions are met. The fees <strong>and</strong> interest rates that PG&E Corporation pays under the revolving credit facility vary depending on the<br />
Utility’s unsecured debt ratings issued by St<strong>and</strong>ard & Poor’s (“S&P”) ratings service <strong>and</strong> Moody’s Investors Service (“Moody’s”).<br />
The revolving credit facility includes usual <strong>and</strong> customary covenants for credit facilities of this type, including covenants<br />
limiting liens, mergers, sales of all or substantially all of PG&E Corporation’s assets, <strong>and</strong> other fundamental changes. In general, the<br />
covenants, representations, <strong>and</strong> events of default mirror those in the Utility’s revolving credit facility, discussed below. In addition, the<br />
revolving credit facility requires that PG&E Corporation maintain a ratio of total consolidated debt to total consolidated capitalization<br />
of at most 65% <strong>and</strong> that PG&E Corporation own, directly or indirectly, at least 80% of the common stock <strong>and</strong> at least 70% of the<br />
voting securities of the Utility. At December 31, <strong>2010</strong>, PG&E Corporation met both of these tests.<br />
Utility<br />
Revolving credit facilities<br />
The Utility has a $1.9 billion revolving credit facility with a syndicate of lenders that expires on February 26, 2012.<br />
Borrowings under the revolving credit facility <strong>and</strong> letters of credit are used primarily for liquidity <strong>and</strong> to provide credit enhancements<br />
to counterparties for natural gas <strong>and</strong> energy procurement transactions.<br />
On June 8, <strong>2010</strong>, the Utility entered into a $750 million unsecured revolving credit agreement with a syndicate of lenders. Of<br />
the total credit capacity, $500 million was used to replace the $500 million Floating Rate Senior Notes that matured on June 10, <strong>2010</strong>.<br />
The aggregate facility of $750 million includes a $75 million commitment for swingline loans, or loans that are made available on a<br />
same-day basis <strong>and</strong> are repayable in full within 30 days. The Utility can, at any time, repay amounts outst<strong>and</strong>ing in whole or in part.<br />
The credit agreement expires on February 26, 2012, unless extended for additional periods at the Utility’s request <strong>and</strong> at the sole<br />
discretion of each lender.<br />
Borrowings under the credit agreement (other than swingline loans) will bear interest based, at the Utility’s election, at (1)<br />
London Interbank Offered Rate (“LIBOR”) plus an applicable margin or (2) the base rate, which will equal the higher of the (i)<br />
<strong>FERC</strong> FORM NO. 1 (ED. 12-88) Page 123.16
Name of Respondent<br />
PACIFIC GAS AND ELECTRIC COMPANY<br />
This Report is:<br />
(1) X An Original<br />
(2) A Resubmission<br />
Date of Report<br />
(Mo, Da, Yr)<br />
04/08/2011<br />
Year/Period of Report<br />
<strong>2010</strong>/Q4<br />
NOTES TO FINANCIAL STATEMENTS (Continued)<br />
administrative agent’s announced base rate, (ii) 0.5% above the federal funds rate, or (iii) the one-month LIBOR plus an applicable<br />
margin. Interest is payable quarterly in arrears, or earlier for loans with shorter interest periods. The Utility also will pay a facility fee<br />
on the total commitments of the lenders under the credit agreement. The applicable margin for LIBOR loans <strong>and</strong> the facility fee will<br />
be based on the Utility’s senior unsecured, non-credit enhanced debt ratings issued by S&P <strong>and</strong> Moody’s. Facility fees are payable<br />
quarterly in arrears.<br />
The Utility treats the amount of its outst<strong>and</strong>ing commercial paper as a reduction to the amount available under its revolving<br />
credit facilities so that liquidity from the revolving credit facility is available to repay outst<strong>and</strong>ing commercial paper.<br />
The revolving credit facilities include usual <strong>and</strong> customary covenants for credit facilities of this type, including covenants<br />
limiting liens to those permitted under the senior note indenture, mergers, sales of all or substantially all of the Utility’s assets, <strong>and</strong><br />
other fundamental changes. Both the $750 million <strong>and</strong> $1.9 billion revolving credit facilities require that the Utility maintain a ratio of<br />
total consolidated debt to total consolidated capitalization of, at most, 65% as of the end of each fiscal quarter. At December 31,<br />
<strong>2010</strong>, the Utility met this ratio test.<br />
Commercial Paper Program<br />
The Utility has a $1.75 billion commercial paper program, the borrowings from which are used primarily to cover fluctuations<br />
in cash flow requirements. Liquidity support for these borrowings is provided by available capacity under the Utility’s revolving credit<br />
facilities, as described above. The commercial paper may have maturities up to 365 days <strong>and</strong> ranks equally with the Utility’s other<br />
unsubordinated <strong>and</strong> unsecured indebtedness. Commercial paper notes are sold at an interest rate dictated by the market at the time of<br />
issuance. At December 31, <strong>2010</strong>, the average yield was 0.51%.<br />
Other Short-term Borrowings<br />
On October 12, <strong>2010</strong>, the Utility issued $250 million principal amount of Floating Rate Senior Notes due October 11, 2011.<br />
The interest rate for the Floating Rate Senior Notes is equal to the three-month LIBOR plus 0.58% <strong>and</strong> will reset quarterly beginning<br />
on January 11, 2011. At December 31, <strong>2010</strong>, the interest rate on the Floating Rate Senior Notes was 0.87%. On January 11, 2011, the<br />
interest rate was reset to 0.88%.<br />
NOTE 5: ENERGY RECOVERY BONDS<br />
In 2005, PERF issued two separate series of ERBs in the aggregate amount of $2.7 billion to refinance a regulatory asset that<br />
the Utility recorded in connection with the Chapter 11 Settlement Agreement. The proceeds of the ERBs were used by PERF to<br />
purchase from the Utility the right, known as “recovery property,” to be paid a specified amount from a dedicated rate component<br />
(“DRC”) to be collected from the Utility’s electricity customers. DRC charges are authorized by the CPUC under state legislation <strong>and</strong><br />
will be paid by the Utility’s electricity customers until the ERBs are fully retired. Under the terms of a recovery property servicing<br />
agreement, DRC charges are collected by the Utility <strong>and</strong> remitted to PERF for payment of principal, interest, <strong>and</strong> miscellaneous<br />
expenses associated with the bonds.<br />
The first series of ERBs issued on February 10, 2005 included five classes aggregating to a $1.9 billion principal amount with<br />
scheduled maturities ranging from September 25, 2006 to December 25, 2012. Interest rates on the remaining two outst<strong>and</strong>ing classes<br />
are 4.37% for the earlier maturing class <strong>and</strong> 4.47% for the later maturing class. The proceeds of the first series of ERBs were paid by<br />
PERF to the Utility <strong>and</strong> were used by the Utility to refinance the remaining unamortized after-tax balance of the settlement regulatory<br />
asset. The second series of ERBs, issued on November 9, 2005, included three classes aggregating to an $844 million principal<br />
amount, with scheduled maturities ranging from June 25, 2009 to December 25, 2012. Interest rates on the remaining two classes are<br />
5.03% for the earlier maturing class <strong>and</strong> 5.12% for the later maturing class. The proceeds of the second series of ERBs were paid by<br />
PERF to the Utility to pre-fund the Utility’s tax liability that will be due as the Utility collects the DRC charges from customers.<br />
The total amount of ERB principal outst<strong>and</strong>ing was $827 million at December 31, <strong>2010</strong> <strong>and</strong> $1.2 billion at December 31,<br />
2009. The scheduled principal repayments for ERBs are reflected in the table below:<br />
<strong>FERC</strong> FORM NO. 1 (ED. 12-88) Page 123.17
Name of Respondent<br />
PACIFIC GAS AND ELECTRIC COMPANY<br />
This Report is:<br />
(1) X An Original<br />
(2) A Resubmission<br />
Date of Report<br />
(Mo, Da, Yr)<br />
04/08/2011<br />
Year/Period of Report<br />
<strong>2010</strong>/Q4<br />
NOTES TO FINANCIAL STATEMENTS (Continued)<br />
(in millions) 2011 2012 Total<br />
Utility<br />
Average fixed interest rate 4.59% 4.66% 4.63%<br />
Energy recovery bonds $ 404 $ 423 $ 827<br />
While PERF is a wholly owned consolidated subsidiary of the Utility, it is legally separate from the Utility. The assets<br />
(including the recovery property) of PERF are not available to creditors of the Utility or PG&E Corporation, <strong>and</strong> the recovery property<br />
is not legally an asset of the Utility or PG&E Corporation.<br />
NOTE 6: COMMON STOCK AND SHARE-BASED COMPENSATION<br />
PG&E Corporation<br />
Of the 395,227,205 shares of PG&E Corporation common stock outst<strong>and</strong>ing at December 31, <strong>2010</strong>, 475,880 shares were<br />
granted as restricted stock under the PG&E Corporation Long-Term Incentive Program <strong>and</strong> the 2006 Long-Term Incentive Plan<br />
(“2006 LTIP”) <strong>and</strong> 5,105,505 shares were issued for the accounts of participants in PG&E Corporation’s 401(k) plan <strong>and</strong> Dividend<br />
Reinvestment <strong>and</strong> Stock Purchase Plan (“DRSPP”). In addition, between June 23 <strong>and</strong> June 29, <strong>2010</strong>, PG&E Corporation issued<br />
16,370,779 shares of common stock upon conversion of the $247 million principal amount of Convertible Subordinated Notes. (See<br />
Note 4 above.)<br />
On November 4, <strong>2010</strong>, PG&E Corporation entered into an Equity Distribution Agreement pursuant to which PG&E<br />
Corporation's sales agents may offer <strong>and</strong> sell, from time to time, PG&E Corporation common stock having an aggregate gross offering<br />
price of up to $400 million. Sales of the shares are made by means of ordinary brokers’ transactions on the New York Stock<br />
Exchange, or in such other transactions as agreed upon by PG&E Corporation <strong>and</strong> the sales agents <strong>and</strong> in conformance with applicable<br />
securities laws. As of December 31, <strong>2010</strong>, PG&E Corporation had issued 2,357,796 shares of its common stock pursuant to the Equity<br />
Distribution Agreement for cash proceeds of $110 million, net of fees <strong>and</strong> commissions paid of $1 million.<br />
Utility<br />
Dividends<br />
As of December 31, <strong>2010</strong>, PG&E Corporation held all of the Utility’s outst<strong>and</strong>ing common stock.<br />
The Boards of Directors of PG&E Corporation <strong>and</strong> the Utility have each adopted a dividend policy. Under the Utility’s<br />
Articles of Incorporation, the Utility cannot pay common stock dividends unless all cumulative preferred dividends on the Utility’s<br />
preferred stock have been paid.<br />
PG&E Corporation <strong>and</strong> the Utility each have revolving credit facilities that require the company to maintain a ratio of<br />
consolidated total debt to consolidated capitalization of at most 65%. This covenant, along with the CPUC’s requirement for the<br />
Utility to maintain the 52% equity component of its capital structure, are considered to be restrictions on the payment of dividends.<br />
Based on the calculation of these ratios for each company, no amount of PG&E Corporation’s retained earnings <strong>and</strong> $5.3 billion of the<br />
Utility’s retained earnings were restricted at December 31, <strong>2010</strong>.<br />
In addition, the Utility was required to maintain at least $9.7 billion of its net assets as equity in order to maintain the capital<br />
structure of at least 52% equity at December 31, <strong>2010</strong>. As a result, $9.7 billion of the Utility’s net assets are restricted <strong>and</strong> may not be<br />
transferred to PG&E Corporation in the form of cash dividends.<br />
The Boards of Directors of PG&E Corporation <strong>and</strong> the Utility declare dividends quarterly. On December 15, <strong>2010</strong>, the<br />
Board of Directors of PG&E Corporation declared a quarterly dividend of $0.455 per share, totaling $183 million, which was paid on<br />
January 15, 2011 to shareholders of record on December 31, <strong>2010</strong>.<br />
Long-Term Incentive Plan<br />
<strong>FERC</strong> FORM NO. 1 (ED. 12-88) Page 123.18
Name of Respondent<br />
PACIFIC GAS AND ELECTRIC COMPANY<br />
This Report is:<br />
(1) X An Original<br />
(2) A Resubmission<br />
Date of Report<br />
(Mo, Da, Yr)<br />
04/08/2011<br />
Year/Period of Report<br />
<strong>2010</strong>/Q4<br />
NOTES TO FINANCIAL STATEMENTS (Continued)<br />
The 2006 LTIP permits the award of various forms of incentive awards, including stock options, stock appreciation rights,<br />
restricted stock awards, restricted stock units, performance shares, deferred compensation awards, <strong>and</strong> other stock-based awards, to<br />
eligible employees of PG&E Corporation <strong>and</strong> its subsidiaries. Non-employee directors of PG&E Corporation are also eligible to<br />
receive restricted stock <strong>and</strong> either stock options or restricted stock units under the formula grant provisions of the 2006 LTIP. A<br />
maximum of 12 million shares of PG&E Corporation common stock (subject to adjustment for changes in capital structure, stock<br />
dividends, or other similar events) has been reserved for issuance under the 2006 LTIP, of which 7,856,348 shares were available for<br />
award at December 31, <strong>2010</strong>.<br />
Awards made under the PG&E Corporation LTIP before December 31, 2005 <strong>and</strong> still outst<strong>and</strong>ing continue to be governed by<br />
the terms <strong>and</strong> conditions of the PG&E Corporation LTIP.<br />
PG&E Corporation <strong>and</strong> the Utility use an estimated annual forfeiture rate of 2.5% for stock options <strong>and</strong> restricted stock <strong>and</strong><br />
2% for performance shares, based on historic forfeiture rates, for purposes of determining compensation expense for share-based<br />
incentive awards. The following table provides a summary of total compensation expense for PG&E Corporation <strong>and</strong> the Utility for<br />
share-based incentive awards for <strong>2010</strong>, 2009, <strong>and</strong> 2008:<br />
(in millions) <strong>2010</strong> 2009 2008<br />
Stock Options $ - $ - $ 2<br />
Restricted Stock 14 9 22<br />
Restricted Stock Units 9 11 -<br />
Performance Shares:<br />
Liability Awards 22 37 33<br />
Equity Awards 11 - -<br />
Total Compensation Expense (pre-tax) $ 56 $ 57 $ 57<br />
Total Compensation Expense (after-tax) $ 33 $ 34 $ 34<br />
There were no significant stock-based compensation costs capitalized during <strong>2010</strong>, 2009 <strong>and</strong> 2008. There was no material<br />
difference between PG&E Corporation <strong>and</strong> the Utility for the information disclosed above.<br />
Stock Options<br />
The exercise price of stock options granted under the 2006 LTIP <strong>and</strong> all other outst<strong>and</strong>ing stock options is equal to the market<br />
price of PG&E Corporation’s common stock on the date of grant. Stock options generally have a 10-year term <strong>and</strong> vest over four<br />
years of continuous service, subject to accelerated vesting in certain circumstances.<br />
The following table summarizes total intrinsic value (fair market value of PG&E Corporation’s common stock less exercise<br />
price) of options exercised:<br />
PG&E Corporation<br />
(in millions) <strong>2010</strong> 2009 2008<br />
Intrinsic value of options exercised $ 15 $ 18 $ 13<br />
The tax benefit from stock options exercised totaled $0.5 million, $6 million, <strong>and</strong> $4 million for <strong>2010</strong>, 2009, <strong>and</strong> 2008<br />
respectively.<br />
The following table summarizes stock option activity for <strong>2010</strong>:<br />
<strong>FERC</strong> FORM NO. 1 (ED. 12-88) Page 123.19<br />
Weighted<br />
Average<br />
Remaining
Name of Respondent<br />
PACIFIC GAS AND ELECTRIC COMPANY<br />
This Report is:<br />
(1) X An Original<br />
(2) A Resubmission<br />
Date of Report<br />
(Mo, Da, Yr)<br />
04/08/2011<br />
Year/Period of Report<br />
<strong>2010</strong>/Q4<br />
NOTES TO FINANCIAL STATEMENTS (Continued)<br />
Weighted Average Contractual Aggregate<br />
Options Shares Exercise Price Term Intrinsic Value<br />
Outst<strong>and</strong>ing at January 1 1,975,341 $ 23.99<br />
Granted 1,742 42.97<br />
Exercised (605,585) 22.67<br />
Forfeited or expired (1,587) 30.13<br />
Outst<strong>and</strong>ing at December 31 1,369,911 25.16 2.76 $ 31,068,628<br />
Expected to vest at December 31 21,401 37.77 7.89 $ 215,584<br />
Exercisable at December 31 1,348,510 $ 24.96 2.68 $ 30,853,045<br />
As of December 31, <strong>2010</strong>, there was less than $1 million of total unrecognized compensation cost related to outst<strong>and</strong>ing<br />
stock options.<br />
Restricted Stock<br />
During <strong>2010</strong>, PG&E Corporation awarded 10,540 shares of restricted common stock to eligible participants under the 2006<br />
LTIP. The terms of the restricted stock award agreements provide that the shares will vest over a five year period. Although the<br />
recipients of restricted stock possess voting rights, they may not sell or transfer their shares until the shares vest.<br />
Prior to <strong>2010</strong>, PG&E Corporation also awarded restricted stock to eligible employees under the 2006 LTIP. The terms of<br />
these restricted stock award agreements provide that 60% of the shares will vest over a period of three years at the rate of 20% per<br />
year. If PG&E Corporation’s annual total shareholder return (“TSR”) is in the top quartile of its comparator group, as measured for<br />
the three immediately preceding calendar years, the restrictions on the remaining 40% of the shares will lapse in the third year. If<br />
PG&E Corporation’s TSR is not in the top quartile for that period, then the restrictions on the remaining 40% of the shares will lapse<br />
in the fifth year. Compensation expense related to the portion of the restricted stock award that is subject to conditions based on TSR<br />
is recognized over the shorter of the requisite service period <strong>and</strong> three years. Dividends declared on restricted stock are paid to<br />
recipients only when the restricted stock vests.<br />
The weighted average grant-date fair value per-share of restricted stock granted during <strong>2010</strong>, 2009, <strong>and</strong> 2008 was $42.97,<br />
$35.53, <strong>and</strong> $37.91, respectively. The total fair value of restricted stock that vested during <strong>2010</strong>, 2009, <strong>and</strong> 2008 was $8 million, $24<br />
million, <strong>and</strong> $19 million, respectively. The tax benefit from restricted stock that vested during <strong>2010</strong>, 2009, <strong>and</strong> 2008 was not material.<br />
The following table summarizes restricted stock activity for <strong>2010</strong>:<br />
Number of Shares of<br />
Weighted Average Grant-<br />
Restricted Stock<br />
Date Fair Value<br />
Nonvested at January 1 670,552 $ 41.11<br />
Granted 10,540 $ 42.97<br />
Vested (189,976) $ 41.70<br />
Forfeited (15,236) $ 42.52<br />
Nonvested at December 31 475,880 $ 40.87<br />
As of December 31, <strong>2010</strong>, there was less than $1 million of total unrecognized compensation cost relating to restricted stock.<br />
Restricted Stock Units<br />
Beginning January 1, 2009, PG&E Corporation primarily awarded restricted stock units (“RSU”) instead of restricted stock as<br />
permitted by the 2006 LTIP. RSUs are hypothetical shares of stock that will generally vest in 20% increments on the first business day<br />
of March in year one, two, <strong>and</strong> three, with the remaining 40% vesting on the first business day of March in year four. Each vested<br />
RSU is settled for one share of PG&E Corporation common stock. Additionally, upon settlement, RSU recipients receive payment for<br />
<strong>FERC</strong> FORM NO. 1 (ED. 12-88) Page 123.20
Name of Respondent<br />
PACIFIC GAS AND ELECTRIC COMPANY<br />
This Report is:<br />
(1) X An Original<br />
(2) A Resubmission<br />
Date of Report<br />
(Mo, Da, Yr)<br />
04/08/2011<br />
Year/Period of Report<br />
<strong>2010</strong>/Q4<br />
NOTES TO FINANCIAL STATEMENTS (Continued)<br />
the amount of dividend equivalents associated with the vested RSUs that have accrued since the date of grant.<br />
The weighted average grant-date fair value per RSU granted during <strong>2010</strong> <strong>and</strong> 2009 was $42.97 <strong>and</strong> $35.53, respectively. The<br />
total fair value of RSUs that vested during <strong>2010</strong> <strong>and</strong> 2009 was $5 million <strong>and</strong> less than $1 million, respectively. As of December 31,<br />
<strong>2010</strong>, $21 million of total unrecognized compensation costs related to nonvested RSUs are expected to be recognized over the<br />
remaining weighted average period of 2.70 years.<br />
The following table summarizes RSU activity for <strong>2010</strong>:<br />
Number of<br />
Weighted Average Grant-<br />
Restricted Stock Units<br />
Date Fair Value<br />
Nonvested at January 1 664,992 $ 35.78<br />
Granted 640,060 $ 42.97<br />
Vested (125,651) $ 35.60<br />
Forfeited (25,005) $ 37.61<br />
Nonvested at December 31 1,154,396 $ 39.74<br />
Performance Shares<br />
On March 10, <strong>2010</strong>, PG&E Corporation granted 605,275 contingent performance shares to eligible employees under the 2006<br />
LTIP. Unlike performance shares awarded in prior periods (see below), which settle in cash, <strong>2010</strong> grants will be settled in PG&E<br />
Corporation common stock <strong>and</strong> are classified as share-based equity awards. Performance shares granted <strong>and</strong> outst<strong>and</strong>ing prior to <strong>2010</strong><br />
will not be modified <strong>and</strong> will continue to be paid <strong>and</strong> settled in cash. The vesting of the performance shares granted in <strong>2010</strong> is<br />
dependent upon three years of continuous service. Additionally the amount of common stock that recipients are entitled to receive, if<br />
any, will be determined based on PG&E Corporation’s TSR relative to the performance of a specified group of peer companies for the<br />
applicable three year performance period. Total compensation expense for these shares is based on the grant-date fair value, which is<br />
determined using a Monte Carlo simulation valuation model. Performance share expense is recognized ratably over the requisite<br />
service period based on the fair values determined, except for the expense attributable to awards granted to retirement-eligible<br />
participants, which is recognized on the date of grant. Dividend equivalents on equity-classified awards, if any, will be paid in cash<br />
upon vesting date based on the amount of common stock awarded.<br />
For performance shares classified as equity awards, the following table summarizes activity for <strong>2010</strong>:<br />
Number of<br />
Weighted Average Grant-<br />
Performance Shares<br />
Date Fair Value<br />
Nonvested at January 1 -<br />
Granted 616,990 $ 35.60<br />
Vested -<br />
Forfeited (7,020) $ 35.60<br />
Nonvested at December 31 609,970 $ 35.60<br />
As of December 31, <strong>2010</strong>, $10 million of total unrecognized compensation costs related to nonvested performance shares are<br />
expected to be recognized over the remaining weighted-average period of 1.22 years.<br />
Prior to <strong>2010</strong>, PG&E Corporation awarded performance shares to eligible participants under the 2006 LTIP as hypothetical<br />
shares of common stock that vest at the end of a three-year period <strong>and</strong> are settled in cash based on the performance of PG&E<br />
Corporation’s TSR. Upon vesting, the amount of cash that recipients are entitled to receive, if any, is determined by multiplying the<br />
number of vested performance shares by the average closing price of PG&E Corporation common stock for the last 30 calendar days in<br />
the three-year performance period. This result is then adjusted based on PG&E Corporation’s TSR relative to the performance of a<br />
specified group of peer companies for the applicable three-year performance period. These outst<strong>and</strong>ing performance shares are<br />
classified as a liability because the performance shares can only be settled in cash. During each reporting period compensation<br />
<strong>FERC</strong> FORM NO. 1 (ED. 12-88) Page 123.21
Name of Respondent<br />
PACIFIC GAS AND ELECTRIC COMPANY<br />
This Report is:<br />
(1) X An Original<br />
(2) A Resubmission<br />
Date of Report<br />
(Mo, Da, Yr)<br />
04/08/2011<br />
Year/Period of Report<br />
<strong>2010</strong>/Q4<br />
NOTES TO FINANCIAL STATEMENTS (Continued)<br />
expense recognized for performance shares will fluctuate based on PG&E Corporation’s common stock price <strong>and</strong> its TSR relative to its<br />
comparator group. As of December 31, <strong>2010</strong> <strong>and</strong> 2009, $68 million <strong>and</strong> $63 million, respectively, had been accrued as the<br />
performance share liability for PG&E Corporation.<br />
For performance shares classified as liability awards, the following table summarizes activity for <strong>2010</strong>:<br />
Number of<br />
Weighted Average Fair<br />
Performance Shares<br />
Value<br />
Nonvested at January 1 1,547,598 $ 55.98<br />
Granted -<br />
Vested (387,019) $ 43.06<br />
Forfeited (23,089) $ 56.18<br />
Nonvested at December 31 1,137,490 $ 60.37<br />
For performance shares classified as liability awards, the total intrinsic value of amounts settled during <strong>2010</strong>, 2009, <strong>and</strong> 2008<br />
was $17 million, $21 million, <strong>and</strong> $7 million, respectively.<br />
NOTE 7: PREFERRED STOCK<br />
PG&E Corporation<br />
PG&E Corporation has authorized 80 million shares of no par value preferred stock <strong>and</strong> 5 million shares of $100 par value<br />
preferred stock, which may be issued as redeemable or nonredeemable preferred stock. No preferred stock of PG&E Corporation has<br />
been issued to date.<br />
Utility<br />
The Utility has authorized 75 million shares of $25 par value preferred stock <strong>and</strong> 10 million shares of $100 par value<br />
preferred stock. The Utility specifies that 5,784,825 shares of the $25 par value preferred stock authorized are designated as<br />
nonredeemable preferred stock without m<strong>and</strong>atory redemption provisions. All remaining shares of preferred stock may be issued as<br />
redeemable or nonredeemable preferred stock.<br />
The following table summarizes the Utility’s outst<strong>and</strong>ing preferred stock without m<strong>and</strong>atory redemption provisions at<br />
December 31, <strong>2010</strong> <strong>and</strong> 2009:<br />
(in millions, except share amounts, redemption<br />
price, <strong>and</strong> par value) Shares Outst<strong>and</strong>ing Redemption Price Balance<br />
Nonredeemable $25 par value preferred stock<br />
5.00% Series 400,000 N/A $ 10<br />
5.50% Series 1,173,163 N/A 30<br />
6.00% Series 4,211,662 N/A 105<br />
Total nonredeemable preferred stock 5,784,825 $ 145<br />
Redeemable $25 par value preferred stock<br />
4.36% Series 418,291 $ 25.75 $ 11<br />
4.50% Series 611,142 26.00 15<br />
4.80% Series 793,031 27.25 20<br />
5.00% Series 1,778,172 26.75 44<br />
5.00% Series A 934,322 26.75 23<br />
Total redeemable preferred stock 4,534,958 $ 113<br />
<strong>FERC</strong> FORM NO. 1 (ED. 12-88) Page 123.22
Name of Respondent<br />
PACIFIC GAS AND ELECTRIC COMPANY<br />
This Report is:<br />
(1) X An Original<br />
(2) A Resubmission<br />
Date of Report<br />
(Mo, Da, Yr)<br />
04/08/2011<br />
Year/Period of Report<br />
<strong>2010</strong>/Q4<br />
NOTES TO FINANCIAL STATEMENTS (Continued)<br />
Preferred stock $ 258<br />
Holders of the Utility’s nonredeemable preferred stock have rights to annual dividends ranging from $1.25 to $1.50 per share.<br />
The Utility’s redeemable preferred stock is subject to redemption at the Utility’s option, in whole or in part, if the Utility pays the<br />
specified redemption price plus accumulated <strong>and</strong> unpaid dividends through the redemption date. At December 31, <strong>2010</strong>, annual<br />
dividends on redeemable preferred stock ranged from $1.09 to $1.25 per share.<br />
Dividends on all Utility preferred stock are cumulative. All shares of preferred stock have voting rights <strong>and</strong> an equal<br />
preference in dividend <strong>and</strong> liquidation rights. Upon liquidation or dissolution of the Utility, holders of preferred stock would be<br />
entitled to the par value of such shares plus all accumulated <strong>and</strong> unpaid dividends, as specified for the class <strong>and</strong> series. During each of<br />
<strong>2010</strong>, 2009, <strong>and</strong> 2008, the Utility paid $14 million of dividends on preferred stock. On December 15, <strong>2010</strong>, the Board of Directors of<br />
the Utility declared a cash dividend on its outst<strong>and</strong>ing series of preferred stock totaling $4 million that was paid on February 15, 2011<br />
to preferred shareholders of record on January 31, 2011. On February 16, 2011, the Board of Directors of the Utility declared a cash<br />
dividend on its outst<strong>and</strong>ing series of preferred stock, payable on May 15, 2011, to shareholders of record on April 29, 2011.<br />
NOTE 8: EARNINGS PER SHARE<br />
PG&E Corporation’s earnings per common share (“EPS”) is calculated utilizing the “two-class” method by dividing the sum<br />
of distributed earnings to common shareholders <strong>and</strong> undistributed earnings allocated to common shareholders by the weighted average<br />
number of common shares outst<strong>and</strong>ing during the period. In applying the two-class method, undistributed earnings are allocated to<br />
both common shares <strong>and</strong> participating securities. PG&E Corporation’s Convertible Subordinated Notes met the criteria of<br />
participating securities as the holders were entitled to receive dividends similar to holders of common stock.<br />
As of June 29, <strong>2010</strong>, all of PG&E Corporation’s Convertible Subordinated Notes had been converted into common stock.<br />
Therefore, there were no participating securities outst<strong>and</strong>ing at December 31, <strong>2010</strong>. (See Note 4 above.)<br />
The following is a reconciliation of PG&E Corporation’s income available for common shareholders <strong>and</strong> weighted average<br />
shares of common stock outst<strong>and</strong>ing for calculating basic EPS:<br />
Year Ended December 31,<br />
(in millions, except per share amounts) <strong>2010</strong> 2009 2008<br />
Basic<br />
Income available for common shareholders $ 1,099 $ 1,220 $ 1,338<br />
Less: distributed earnings to common shareholders 706 621 560<br />
Undistributed earnings 393 599 778<br />
Less: undistributed earnings from discontinued operations - - 154<br />
Undistributed earnings from continuing operations $ 393 $ 599 $ 624<br />
Allocation of undistributed earnings to common<br />
shareholders<br />
Distributed earnings to common shareholders $ 706 $ 621 $ 560<br />
Undistributed earnings allocated to common shareholders –<br />
continuing operations 385 573 592<br />
Undistributed earnings allocated to common shareholders –<br />
discontinued operations - - 146<br />
Total common shareholders earnings $ 1,091 $ 1,194 $ 1,298<br />
Weighted average common shares outst<strong>and</strong>ing, basic 382 368 357<br />
Convertible subordinated notes 8 17 19<br />
Weighted average common shares outst<strong>and</strong>ing <strong>and</strong><br />
participating securities 390 385 376<br />
Net earnings per common share, basic<br />
<strong>FERC</strong> FORM NO. 1 (ED. 12-88) Page 123.23
Name of Respondent<br />
PACIFIC GAS AND ELECTRIC COMPANY<br />
This Report is:<br />
(1) X An Original<br />
(2) A Resubmission<br />
Date of Report<br />
(Mo, Da, Yr)<br />
04/08/2011<br />
Year/Period of Report<br />
<strong>2010</strong>/Q4<br />
NOTES TO FINANCIAL STATEMENTS (Continued)<br />
Distributed earnings, basic (1) $ 1.85 $ 1.69 $ 1.57<br />
Undistributed earnings – continuing operations, basic 1.01 1.56 1.66<br />
Undistributed earnings – discontinued operations, basic - - 0.41<br />
Total $ 2.86 $ 3.25 $ 3.64<br />
(1) Distributed earnings, basic may differ from actual per share amounts paid as dividends, as the EPS computation under GAAP requires the use of the weighted<br />
average, rather than the actual, number of shares outst<strong>and</strong>ing.<br />
In calculating diluted EPS during the period PG&E Corporation’s Convertible Subordinated Notes were outst<strong>and</strong>ing, PG&E<br />
Corporation applied the “if-converted” method to reflect the dilutive effect of the Convertible Subordinated Notes to the extent that the<br />
impact is dilutive when compared to basic EPS. In addition, PG&E Corporation applies the treasury stock method of reflecting the<br />
dilutive effect of outst<strong>and</strong>ing stock-based compensation in the calculation of diluted EPS.<br />
The following is a reconciliation of PG&E Corporation’s income available for common shareholders <strong>and</strong> weighted average<br />
shares of common stock outst<strong>and</strong>ing for calculating diluted EPS:<br />
Year ended<br />
December 31,<br />
(in millions, except per share amounts) <strong>2010</strong> 2009<br />
Diluted<br />
Income available for common shareholders $ 1,099 $ 1,220<br />
Add earnings impact of assumed conversion of participating securities:<br />
Interest expense on convertible subordinated notes, net of tax 8 15<br />
Unrealized loss on embedded derivative, net of tax - 2<br />
Income available for common shareholders <strong>and</strong> assumed conversion $ 1,107 $ 1,237<br />
Weighted average common shares outst<strong>and</strong>ing, basic 382 368<br />
Add incremental shares from assumed conversions:<br />
Convertible subordinated notes 8 17<br />
Employee share-based compensation 2 1<br />
Weighted average common shares outst<strong>and</strong>ing, diluted 392 386<br />
Total earnings per common share, diluted $ 2.82 $ 3.20<br />
The following is a reconciliation of PG&E Corporation’s income available for common shareholders <strong>and</strong> weighted average<br />
shares of common stock outst<strong>and</strong>ing for calculating diluted EPS:<br />
Year ended<br />
December 31,<br />
(in millions, except per share amounts) 2008<br />
Diluted<br />
Income available for common shareholders $ 1,338<br />
Less: distributed earnings to common shareholders 560<br />
Undistributed earnings 778<br />
Less: undistributed earnings from discontinued operations 154<br />
Undistributed earnings from continuing operations $ 624<br />
Allocation of undistributed earnings to common shareholders<br />
Distributed earnings to common shareholders $ 560<br />
Undistributed earnings allocated to common shareholders –<br />
continuing operations 593<br />
<strong>FERC</strong> FORM NO. 1 (ED. 12-88) Page 123.24
Name of Respondent<br />
PACIFIC GAS AND ELECTRIC COMPANY<br />
This Report is:<br />
(1) X An Original<br />
(2) A Resubmission<br />
Date of Report<br />
(Mo, Da, Yr)<br />
04/08/2011<br />
Year/Period of Report<br />
<strong>2010</strong>/Q4<br />
NOTES TO FINANCIAL STATEMENTS (Continued)<br />
Undistributed earnings allocated to common shareholders –<br />
discontinued operations 146<br />
Total common shareholders earnings $ 1,299<br />
Weighted average common shares outst<strong>and</strong>ing, basic 357<br />
Convertible subordinated notes 19<br />
Weighted average common shares outst<strong>and</strong>ing <strong>and</strong> participating<br />
securities, basic 376<br />
Weighted average common shares outst<strong>and</strong>ing, basic 357<br />
Employee share-based compensation 1<br />
Weighted average common shares outst<strong>and</strong>ing, diluted 358<br />
Convertible subordinated notes 19<br />
Weighted average common shares outst<strong>and</strong>ing <strong>and</strong> participating<br />
securities, diluted 377<br />
Net earnings per common share, diluted<br />
Distributed earnings, diluted $ 1.56<br />
Undistributed earnings – continuing operations, diluted 1.66<br />
Undistributed earnings – discontinued operations, diluted 0.41<br />
Total earnings per common share, diluted $ 3.63<br />
For each of the periods presented above, the calculation of outst<strong>and</strong>ing shares on a diluted basis excluded an insignificant<br />
amount of options <strong>and</strong> securities that were antidilutive.<br />
NOTE 9: INCOME TAXES<br />
The significant components of income tax provision (benefit) for continuing operations were as follows:<br />
PG&E Corporation<br />
Utility<br />
Year Ended December 31,<br />
<strong>2010</strong> 2009 2008 <strong>2010</strong> 2009 2008<br />
(in millions)<br />
Current:<br />
Federal $ (12) $ (747) $ (268) $ (54) $ (696) $ (188)<br />
State 130 (41) 33 134 (45) 24<br />
Deferred:<br />
Federal 525 1,161 604 589 1,139 596<br />
State (91) 92 62 (90) 89 62<br />
Tax credits (5) (5) (6) (5) (5) (6)<br />
Income tax provision $ 547 $ 460 $ 425 $ 574 $ 482 $ 488<br />
The following describes net deferred income tax liabilities:<br />
PG&E Corporation<br />
Utility<br />
Year Ended December 31,<br />
<strong>2010</strong> 2009 <strong>2010</strong> 2009<br />
(in millions)<br />
Deferred income tax assets:<br />
Reserve for damages $ 222 $ 138 $ 222 $ 138<br />
Environmental reserve 242 227 242 227<br />
Compensation 345 338 305 304<br />
<strong>FERC</strong> FORM NO. 1 (ED. 12-88) Page 123.25
Name of Respondent<br />
PACIFIC GAS AND ELECTRIC COMPANY<br />
This Report is:<br />
(1) X An Original<br />
(2) A Resubmission<br />
Date of Report<br />
(Mo, Da, Yr)<br />
04/08/2011<br />
Year/Period of Report<br />
<strong>2010</strong>/Q4<br />
NOTES TO FINANCIAL STATEMENTS (Continued)<br />
Net operating loss carry forward 327 - 270 -<br />
Other 207 184 178 180<br />
Total deferred income tax assets $ 1,343 $ 887 $ 1,217 $ 849<br />
Deferred income tax liabilities:<br />
Regulatory balancing accounts $ 1,116 $ 1,340 $ 1,116 $ 1,340<br />
Property related basis differences 5,236 4,036 5,234 4,032<br />
Income tax regulatory asset 509 418 509 418<br />
Other 142 157 135 157<br />
Total deferred income tax liabilities $ 7,003 $ 5,951 $ 6,994 $ 5,947<br />
Total net deferred income tax liabilities $ 5,660 $ 5,064 $ 5,777 $ 5,098<br />
Classification of net deferred income tax liabilities:<br />
Included in current liabilities $ 113 $ 332 $ 118 $ 334<br />
Included in noncurrent liabilities 5,547 4,732 5,659 4,764<br />
Total net deferred income tax liabilities $ 5,660 $ 5,064 $ 5,777 $ 5,098<br />
The differences between income taxes <strong>and</strong> amounts calculated by applying the federal statutory rate to income before income<br />
tax expense for continuing operations were as follows:<br />
PG&E Corporation<br />
Utility<br />
Year Ended December 31,<br />
<strong>2010</strong> 2009 2008 <strong>2010</strong> 2009 2008<br />
Federal statutory income tax rate 35.0 % 35.0 % 35.0 % 35.0 % 35.0 % 35.0 %<br />
Increase (decrease) in income<br />
tax rate resulting from:<br />
State income tax (net of<br />
federal benefit) 0.7 1.6 3.1 1.0 1.4 3.3<br />
Effect of regulatory treatment<br />
of fixed asset differences (3.1) (2.7) (3.2) (3.0) (2.6) (3.1)<br />
Tax credits (0.4) (0.5) (0.5) (0.4) (0.5) (0.5)<br />
IRS audit settlements 0.1 (4.5) (7.1) (0.2) (4.2) (4.1)<br />
Other, net 0.9 (1.5) (0.9) 1.5 (1.3) (1.7)<br />
Effective tax rate 33.2 % 27.4 % 26.4 % 33.9 % 27.8 % 28.9 %<br />
Unrecognized tax benefits<br />
The following table reconciles the changes in unrecognized tax benefits:<br />
PG&E Corporation<br />
Utility<br />
<strong>2010</strong> 2009 2008 <strong>2010</strong> 2009 2008<br />
(in millions)<br />
Balance at beginning of year $ 673 $ 75 $ 209 $ 652 $ 37 $ 94<br />
Additions for tax position<br />
taken during a prior year 27 4 - 27 4 -<br />
Additions for tax position<br />
taken during the current year 89 624 43 87 623 20<br />
Settlements (55) (27) (177) (54) (12) (77)<br />
Reductions for tax position<br />
taken during a prior year (20) (3) - - - -<br />
<strong>FERC</strong> FORM NO. 1 (ED. 12-88) Page 123.26
Name of Respondent<br />
PACIFIC GAS AND ELECTRIC COMPANY<br />
This Report is:<br />
(1) X An Original<br />
(2) A Resubmission<br />
Date of Report<br />
(Mo, Da, Yr)<br />
04/08/2011<br />
Year/Period of Report<br />
<strong>2010</strong>/Q4<br />
NOTES TO FINANCIAL STATEMENTS (Continued)<br />
Balance at end of year $ 714 $ 673 $ 75 $ 712 $ 652 $ 37<br />
The component of unrecognized tax benefits that, if recognized, would affect the effective tax rate at December 31, <strong>2010</strong> for<br />
PG&E Corporation <strong>and</strong> the Utility is $39 million, with the remaining balance representing the probable deferral of taxes to later years.<br />
PG&E Corporation <strong>and</strong> the Utility do not expect that the total unrecognized tax benefits would significantly change within the next 12<br />
months.<br />
PG&E Corporation <strong>and</strong> the Utility recognize accrued interest <strong>and</strong> penalties related to unrecognized tax benefits as income tax<br />
expense in the Consolidated Statements of Income. Interest income net of penalties recognized in income tax expense by PG&E<br />
Corporation in <strong>2010</strong>, 2009, <strong>and</strong> 2008 was $3 million, $19 million, <strong>and</strong> $24 million, respectively. Interest income net of penalties<br />
recognized in income tax expense by the Utility in <strong>2010</strong>, 2009, <strong>and</strong> 2008 was $3 million, $14 million, <strong>and</strong> $11 million, respectively.<br />
As of December 31, <strong>2010</strong>, PG&E Corporation <strong>and</strong> the Utility had accrued interest income of $8 million. As of December 31,<br />
2009, PG&E Corporation <strong>and</strong> the Utility had accrued interest expense <strong>and</strong> penalties of $11 million <strong>and</strong> $12 million, respectively.<br />
Federal subsidy for Medicare Part D<br />
PG&E Corporation <strong>and</strong> the Utility receive a federal subsidy for maintaining a retiree medical benefit plan with prescription<br />
drug benefits that is actuarially equivalent to Medicare Part D. For federal income tax purposes, the subsidy was deductible when<br />
contributed to the benefit plan maintained for these benefits. On March 30, <strong>2010</strong>, federal healthcare legislation was signed eliminating<br />
the deduction for subsidy contributions after 2012. As a result, PG&E Corporation <strong>and</strong> the Utility recognized an expense of $19<br />
million in <strong>2010</strong> to reverse previously recognized federal tax benefits (recorded as an increase to income tax provision <strong>and</strong> a reduction<br />
to deferred income tax assets for subsidy amounts included in the calculation of accrued retiree medical benefit obligation).<br />
Tax settlements <strong>and</strong> years that remain subject to examination<br />
On September 29, <strong>2010</strong>, PG&E Corporation received the Internal Revenue Service (“IRS”) examination report for the 2005<br />
to 2007 audit years <strong>and</strong> resolved all matters except for a few items that will be discussed with the IRS Appeals office. Included in the<br />
2005 to 2007 audit was the resolution of the change in accounting method related to the capitalization of indirect service costs for<br />
those years. As a result, PG&E Corporation recorded a $25 million reduction to income tax expense during <strong>2010</strong>.<br />
In tax year 2008, PG&E Corporation began participating in the Compliance Assurance Process (“CAP”), a real-time IRS<br />
audit intended to expedite resolution of tax matters. The CAP audit culminates with a letter from the IRS indicating their acceptance of<br />
the return. The IRS partially accepted the 2008 return, withholding two issues for further review. The most significant of these relates<br />
to a tax accounting method change filed by PG&E Corporation to accelerate the amount of deductible repairs. While the IRS<br />
approved PG&E Corporation’s request for a change in method, the IRS will audit the methodology to determine the proper deduction.<br />
This audit has not progressed significantly because the IRS is working with the utility industry to resolve this matter in a consistent<br />
manner for all utilities before auditing individual companies. On December 14, <strong>2010</strong> the IRS accepted PG&E Corporation’s 2009 tax<br />
return without change.<br />
In 2009, PG&E Corporation recognized an income tax benefit of $56 million from settling a claim with the IRS related to<br />
1998 <strong>and</strong> 1999. Additionally during 2009, PG&E Corporation recognized $12 million in California benefits, of which $10 million was<br />
attributable to this settlement <strong>and</strong> $2 million was attributable to the 2001–2004 IRS settlement. (The 2001–2004 IRS settlement<br />
resulted in a $154 million tax benefit related to National Energy & <strong>Gas</strong> Transmission, Inc. (“NEGT”) <strong>and</strong> was recorded as<br />
discontinued operations in 2008.) PG&E Corporation received total cash refunds of $605 million in 2009 related to these settlements.<br />
The California Franchise Tax Board is auditing PG&E Corporation’s 2004 <strong>and</strong> 2005 combined California income tax returns,<br />
as well as the 1997-2007 amended income tax returns reflecting IRS settlements for these years <strong>and</strong> claim filings that apply only to<br />
California. It is uncertain when the California Franchise Tax Board will complete the audits.<br />
PG&E Corporation believes that the final resolution of the federal <strong>and</strong> California audits will not have a material adverse<br />
impact on its financial condition or results of operations. PG&E Corporation is neither under audit nor subject to any material risk in<br />
<strong>FERC</strong> FORM NO. 1 (ED. 12-88) Page 123.27
Name of Respondent<br />
PACIFIC GAS AND ELECTRIC COMPANY<br />
This Report is:<br />
(1) X An Original<br />
(2) A Resubmission<br />
Date of Report<br />
(Mo, Da, Yr)<br />
04/08/2011<br />
Year/Period of Report<br />
<strong>2010</strong>/Q4<br />
NOTES TO FINANCIAL STATEMENTS (Continued)<br />
any other jurisdiction.<br />
Loss carry forwards<br />
As of December 31, <strong>2010</strong> <strong>and</strong> 2009, PG&E Corporation has $24 million <strong>and</strong> $25 million, respectively, of federal <strong>and</strong><br />
California capital loss carry forwards based on filed tax returns, of which approximately $9 million will expire if not used by<br />
December 31, 2011. For all periods presented, PG&E Corporation has provided a full valuation allowance against its deferred income<br />
tax assets for capital loss carry forwards.<br />
The Tax Relief, Unemployment Insurance Reauthorization, <strong>and</strong> Job Creation Act of <strong>2010</strong> (the “Tax Relief Act”) Federal<br />
legislation that was signed into law on December 17, <strong>2010</strong>, provides for full expensing of qualified property, plant, <strong>and</strong> equipment<br />
placed in service from September 9, <strong>2010</strong> to December 31, 2011 for tax purposes. The Tax Relief Act increased PG&E Corporation’s<br />
federal net operating loss carry forwards. As of December 31, <strong>2010</strong>, PG&E Corporation has approximately $540 million of federal net<br />
operating loss carry forwards <strong>and</strong> $45 million of tax credit carry forwards, which will expire between 2029 <strong>and</strong> 2030. In addition,<br />
PG&E Corporation has approximately $46 million of loss carry forwards related to charitable contributions, which will expire between<br />
2014 <strong>and</strong> 2015. PG&E Corporation believes it is more likely than not the tax benefits associated with the federal operating loss <strong>and</strong><br />
tax credit can be realized within the carry forward periods, therefore no valuation allowance was recognized as of December 31, <strong>2010</strong>.<br />
The amount of federal net operating loss carry forwards for which a tax benefit from employee stock plans would be recorded in<br />
additional paid-in capital was approximately $9 million as of December 31, <strong>2010</strong>.<br />
NOTE 10: DERIVATIVES AND HEDGING ACTIVITIES<br />
Use of Derivative Instruments<br />
The Utility faces market risk primarily related to electricity <strong>and</strong> natural gas commodity prices. All of the Utility’s risk<br />
management activities involving derivatives reduce the volatility of commodity costs on behalf of its customers. The CPUC allows the<br />
Utility to charge customer rates designed to recover the Utility’s reasonable costs of providing services, including the cost to obtain<br />
<strong>and</strong> deliver electricity <strong>and</strong> natural gas.<br />
The Utility uses both derivative <strong>and</strong> non-derivative contracts in managing its customers’ exposure to commodity-related price<br />
risk, including:<br />
• forward ? contracts that commit the Utility to purchase a commodity in the future;<br />
• swap agreements that require payments to or from counterparties based upon the difference between two prices for a<br />
predetermined contractual quantity;<br />
• option ? contracts that provide the Utility with the right to buy a commodity at a predetermined price; <strong>and</strong><br />
• futures ? contracts that are exchange-traded contracts committing the Utility to make a cash settlement at a specified price <strong>and</strong><br />
future date.<br />
These instruments are not held for speculative purposes <strong>and</strong> are subject to certain regulatory requirements.<br />
Commodity-Related Price Risk<br />
Commodity-related price risk management activities that meet the definition of a derivative are recorded at fair value on the<br />
Consolidated Balance Sheets. As long as the ratemaking mechanisms discussed above remain in place <strong>and</strong> the Utility’s risk<br />
management activities are carried out in accordance with CPUC directives, the Utility expects to fully recover from customers, in rates,<br />
all costs related to commodity-related price risk-related derivative instruments. Therefore, all unrealized gains <strong>and</strong> losses associated<br />
with the change in fair value of these derivative instruments are deferred <strong>and</strong> recorded within the Utility’s regulatory assets <strong>and</strong><br />
liabilities on the Consolidated Balance Sheets. (See Note 3 above.) Net realized gains or losses on derivative instruments related to<br />
<strong>FERC</strong> FORM NO. 1 (ED. 12-88) Page 123.28
Name of Respondent<br />
PACIFIC GAS AND ELECTRIC COMPANY<br />
This Report is:<br />
(1) X An Original<br />
(2) A Resubmission<br />
Date of Report<br />
(Mo, Da, Yr)<br />
04/08/2011<br />
Year/Period of Report<br />
<strong>2010</strong>/Q4<br />
NOTES TO FINANCIAL STATEMENTS (Continued)<br />
price risk for commodities are recorded in the cost of electricity or the cost of natural gas with corresponding increases or decreases to<br />
regulatory balancing accounts for recovery from customers.<br />
The Utility elects the normal purchase <strong>and</strong> sale exception for qualifying commodity-related derivative instruments.<br />
Derivative instruments that require physical delivery, are probable of physical delivery in quantities that are expected to be used by the<br />
Utility over a reasonable period in the normal course of business, <strong>and</strong> do not contain pricing provisions unrelated to the commodity<br />
delivered are eligible for the normal purchase <strong>and</strong> sale exception. The fair value of instruments that are eligible for the normal<br />
purchase <strong>and</strong> sales exception are not reflected in the Consolidated Balance Sheets.<br />
The following is a discussion of the Utility’s use of derivative instruments intended to mitigate commodity-related price risk<br />
for its customers.<br />
<strong>Electric</strong>ity Procurement<br />
The Utility obtains electricity from a diverse mix of resources, including third-party power purchase agreements, amounts<br />
allocated under DWR contracts, <strong>and</strong> its own electricity generation facilities. The amount of electricity the Utility needs to meet the<br />
dem<strong>and</strong>s of customers <strong>and</strong> that is not satisfied from the Utility’s own generation facilities, existing purchase contracts, or DWR<br />
contracts allocated to the Utility’s customers is subject to change for a number of reasons, including:<br />
• periodic ? expirations or terminations of existing electricity purchase contracts, including the DWR’s contracts;<br />
• the execution of new electricity purchase contracts;<br />
• fluctuation ? in the output of hydroelectric <strong>and</strong> other renewable power facilities owned or under contract;<br />
• changes ? in the Utility’s customers’ electricity dem<strong>and</strong>s due to customer <strong>and</strong> economic growth or decline, weather, implementation<br />
of new energy efficiency <strong>and</strong> dem<strong>and</strong> response programs, direct access, <strong>and</strong> community choice aggregation;<br />
• the ? acquisition, retirement, or closure of generation facilities; <strong>and</strong><br />
• changes ? in market prices that make it more economical to purchase power in the market rather than use the Utility’s existing or<br />
contracted resources to generate power.<br />
The Utility enters into third-party power purchase agreements to ensure sufficient electricity to meet customer needs. The<br />
Utility’s third-party power purchase agreements are generally accounted for as leases, but certain third-party power purchase<br />
agreements are considered derivative instruments. The Utility elects to use the normal purchase <strong>and</strong> sale exception for eligible<br />
derivative instruments.<br />
A portion of the Utility’s third-party power purchase agreements contain market-based pricing terms. In order to reduce the<br />
volatility in customer rates, the Utility has entered into financial swap contracts to effectively fix the price of future purchases <strong>and</strong><br />
reduce the cash flow variability associated with fluctuating electricity prices under some of those power purchase agreements. These<br />
financial swaps are considered derivative instruments.<br />
<strong>Electric</strong> Transmission Congestion Revenue Rights<br />
The California Independent System Operator (“CAISO”) controlled electricity transmission grid used by the Utility to<br />
transmit power is subject to transmission constraints. As a result, the Utility is subject to financial risk associated with the cost of<br />
transmission congestion. The congestion revenue rights (“CRRs”) allow market participants, including load-serving entities, to hedge<br />
the financial risk of CAISO-imposed congestion charges in the new day-ahead market. The CAISO releases CRRs through an annual<br />
<strong>and</strong> monthly process, each of which includes an allocation phase (in which load-serving entities are allocated CRRs at no cost based on<br />
the customer dem<strong>and</strong> or “load” they serve) <strong>and</strong> an auction phase (in which CRRs are priced at market <strong>and</strong> available to all market<br />
<strong>FERC</strong> FORM NO. 1 (ED. 12-88) Page 123.29
Name of Respondent<br />
PACIFIC GAS AND ELECTRIC COMPANY<br />
This Report is:<br />
(1) X An Original<br />
(2) A Resubmission<br />
Date of Report<br />
(Mo, Da, Yr)<br />
04/08/2011<br />
Year/Period of Report<br />
<strong>2010</strong>/Q4<br />
NOTES TO FINANCIAL STATEMENTS (Continued)<br />
participants). The CRRs held by the Utility are considered derivative instruments.<br />
Natural <strong>Gas</strong> Procurement (<strong>Electric</strong> Fuels Portfolio)<br />
The Utility’s electric procurement portfolio is exposed to natural gas price risk primarily through the Utility-owned natural<br />
gas generating facilities, tolling agreements, <strong>and</strong> natural gas-indexed electricity procurement contracts. In order to reduce the volatility<br />
in customer rates, the Utility purchases financial instruments such as futures, swaps, <strong>and</strong> options to reduce future cash flow variability<br />
associated with fluctuating natural gas prices. These financial instruments are considered derivative instruments.<br />
Natural <strong>Gas</strong> Procurement (Core <strong>Gas</strong> Supply Portfolio)<br />
The Utility enters into physical natural gas commodity contracts to fulfill the needs of its residential <strong>and</strong> smaller commercial<br />
customers known as “core” customers. (The Utility does not procure natural gas for industrial <strong>and</strong> large commercial, or “non-core,”<br />
customers.) Changes in temperature cause natural gas dem<strong>and</strong> to vary daily, monthly, <strong>and</strong> seasonally. Consequently, varying volumes<br />
of gas may be purchased or sold in the multi-month, monthly, <strong>and</strong> to a lesser extent, daily spot market to balance such seasonal supply<br />
<strong>and</strong> dem<strong>and</strong>. The Utility purchases financial instruments such as swaps <strong>and</strong> options as part of its core winter hedging program in order<br />
to manage customer exposure to high gas prices during peak winter months. These financial instruments are considered derivative<br />
instruments.<br />
Volume of Derivative Activity<br />
At December 31, <strong>2010</strong>, the volumes of PG&E Corporation’s <strong>and</strong> the Utility’s outst<strong>and</strong>ing derivative contracts were as<br />
follows:<br />
Contract Volumes (1)<br />
Greater Than Greater Than<br />
1 Year But 3 Years But<br />
Underlying Less Than 1 Less Than 3 Less Than 5 Greater Than<br />
Product Instruments Year Years Years 5 Years (2)<br />
Natural <strong>Gas</strong> (3)<br />
(MMBtus (4))<br />
<strong>Electric</strong>ity<br />
(Megawatt-hou<br />
rs)<br />
Forwards,<br />
Futures, <strong>and</strong><br />
Swaps<br />
427,176,587 308,712,558 - -<br />
Options 270,509,308 176,150,000 - -<br />
Forwards,<br />
Futures, <strong>and</strong> 5,690,441 6,969,024 3,673,512 4,826,640<br />
Swaps<br />
Options 415,450 - 264,096 396,396<br />
Congestion<br />
Revenue Rights 74,313,524 72,070,789 71,997,921 96,986,809<br />
(1) Amounts shown reflect the total gross derivative volumes by commodity type that are expected to settle in each time period.<br />
(2) Derivatives in this category expire between 2016 <strong>and</strong> 2022.<br />
(3) Amounts shown are for the combined positions of the electric <strong>and</strong> core gas portfolios.<br />
(4) Million British Thermal Units.<br />
Presentation of Derivative Instruments in the Financial Statements<br />
In PG&E Corporation’s <strong>and</strong> the Utility’s Consolidated Balance Sheets, derivative instruments are presented on a net basis by<br />
counterparty where the right of offset exists under a master netting agreement. The net balances include outst<strong>and</strong>ing cash collateral<br />
associated with derivative positions.<br />
<strong>FERC</strong> FORM NO. 1 (ED. 12-88) Page 123.30
Name of Respondent<br />
PACIFIC GAS AND ELECTRIC COMPANY<br />
This Report is:<br />
(1) X An Original<br />
(2) A Resubmission<br />
Date of Report<br />
(Mo, Da, Yr)<br />
04/08/2011<br />
Year/Period of Report<br />
<strong>2010</strong>/Q4<br />
NOTES TO FINANCIAL STATEMENTS (Continued)<br />
At December 31, <strong>2010</strong>, PG&E Corporation’s <strong>and</strong> the Utility’s outst<strong>and</strong>ing derivative balances were as follows:<br />
Gross<br />
Total<br />
Derivative Cash Derivative<br />
(in millions) Balance (1) Netting (2) Collateral (2) Balances<br />
Commodity Risk (PG&E Corporation <strong>and</strong> the Utility)<br />
Current assets –other $ 56 $ (45) $ 79 $ 90<br />
Other noncurrent assets –<br />
other 77 (62) 96 111<br />
Current liabilities – other (388) 45 119 (224)<br />
Noncurrent liabilities –<br />
other (486) 62 130 (294)<br />
Total commodity risk $ (741) $ - $ 424 $ (317)<br />
(1) See Note 11 of the Notes to the Consolidated Financial Statements for a discussion of the valuation techniques<br />
used to calculate the fair value of these instruments.<br />
(2) Positions, by counterparty, are netted where the intent <strong>and</strong> legal right to offset exist in accordance with master<br />
netting agreements.<br />
At December 31, 2009, PG&E Corporation’s <strong>and</strong> the Utility’s outst<strong>and</strong>ing derivative balances were as follows:<br />
Gross<br />
Total<br />
Derivative Cash Derivative<br />
(in millions) Balance (1) Netting (2) Collateral (2) Balances<br />
Commodity Risk (PG&E Corporation <strong>and</strong> the Utility)<br />
Current assets –other $ 76 $ (12) $ 77 $ 141<br />
Other noncurrent assets –<br />
other 64 (44) 13 33<br />
Current liabilities – other (231) 12 54 (165)<br />
Noncurrent liabilities –<br />
other (390) 44 44 (302)<br />
Total commodity risk $ (481) $ - $ 188 $ (293)<br />
Other Risk Instruments (3) (PG&E Corporation Only)<br />
Current liabilities – other $ (13) $ - $ - $ (13)<br />
Total derivatives $ (494) $ - $ 188 $ (306)<br />
(1) See Note 11 of the Notes to the Consolidated Financial Statements for a discussion of the valuation techniques<br />
used to calculate the fair value of these instruments.<br />
(2) Positions, by counterparty, are netted where the intent <strong>and</strong> legal right to offset exist in accordance with master<br />
netting agreements.<br />
(3) This category relates to the dividend participation rights of PG&E Corporation’s Convertible Subordinated<br />
Notes, which were converted to PG&E Corporation common stock in <strong>2010</strong>.<br />
For the years ended December 31, <strong>2010</strong> <strong>and</strong> 2009, the gains <strong>and</strong> losses recorded on PG&E Corporation’s <strong>and</strong> the Utility’s<br />
derivative instruments were as follows:<br />
Commodity Risk<br />
(PG&E Corporation <strong>and</strong> the<br />
Utility)<br />
(in millions) <strong>2010</strong> 2009<br />
<strong>FERC</strong> FORM NO. 1 (ED. 12-88) Page 123.31
Name of Respondent<br />
PACIFIC GAS AND ELECTRIC COMPANY<br />
This Report is:<br />
(1) X An Original<br />
(2) A Resubmission<br />
Date of Report<br />
(Mo, Da, Yr)<br />
04/08/2011<br />
Year/Period of Report<br />
<strong>2010</strong>/Q4<br />
NOTES TO FINANCIAL STATEMENTS (Continued)<br />
Unrealized gain/(loss) – Regulatory assets <strong>and</strong><br />
liabilities (1)<br />
$ (260) $ 15<br />
Realized gain/(loss) – Cost of electricity (2) (573) (701)<br />
Realized gain/(loss) – Cost of natural gas (2) (79) (54)<br />
Total commodity risk instruments $ (912) $ (740)<br />
(1) Unrealized gains <strong>and</strong> losses on commodity risk-related derivative instruments are recorded to regulatory<br />
assets or liabilities rather than being recorded to the Consolidated Statements of Income. These amounts<br />
exclude the impact of cash collateral postings.<br />
(2) These amounts are fully passed through to customers in rates. Accordingly, net income was not impacted<br />
by realized amounts on these instruments.<br />
Cash inflows <strong>and</strong> outflows associated with the settlement of all derivative instruments are included in operating cash flows on<br />
PG&E Corporation’s <strong>and</strong> the Utility’s Consolidated Statements of Cash Flows.<br />
The majority of the Utility’s commodity risk-related derivative instruments contain collateral posting provisions tied to the<br />
Utility’s credit rating from each of the major credit rating agencies. If the Utility’s credit rating were to fall below investment grade,<br />
the Utility would be required to immediately post additional cash to fully collateralize its net liability derivative positions.<br />
At December 31, <strong>2010</strong>, the additional cash collateral that the Utility would be required to post if its credit risk-related<br />
contingency features were triggered was as follows:<br />
(in millions)<br />
Derivatives in a liability position with credit risk-related<br />
contingencies that are not fully collateralized $ (518)<br />
Related derivatives in an asset position -<br />
Collateral posting in the normal course of business related<br />
to these derivatives 7<br />
Net position of derivative contracts/additional collateral<br />
posting requirements (1) $ (511)<br />
(1) This calculation excludes the impact of closed but unpaid positions, as their settlement is<br />
not impacted by any of the Utility’s credit risk-related contingencies.<br />
NOTE 11: FAIR VALUE MEASUREMENTS<br />
PG&E Corporation <strong>and</strong> the Utility measure their cash equivalents, trust assets, <strong>and</strong> price risk management instruments at fair<br />
value. Fair value is an exit price, representing the amount that would be received to sell an asset or paid to transfer a liability in an<br />
orderly transaction between market participants. As such, fair value is a market-based measurement that should be determined based<br />
on assumptions that market participants would use in pricing an asset or a liability. A three-tier fair value hierarchy is established as a<br />
basis for considering such assumptions <strong>and</strong> for inputs used in the valuation methodologies in measuring fair value:<br />
Level 1—Observable inputs that reflect quoted prices (unadjusted) for identical assets or liabilities in active markets.<br />
Level 2—Include other inputs that are directly or indirectly observable in the marketplace.<br />
Level 3—Unobservable inputs which are supported by little or no market activities.<br />
The fair value hierarchy requires an entity to maximize the use of observable inputs <strong>and</strong> minimize the use of unobservable<br />
inputs when measuring fair value.<br />
Assets <strong>and</strong> liabilities measured at fair value on a recurring basis for PG&E Corporation <strong>and</strong> the Utility are summarized below<br />
(money market investments <strong>and</strong> assets held in rabbi trusts are held by PG&E Corporation <strong>and</strong> not the Utility):<br />
<strong>FERC</strong> FORM NO. 1 (ED. 12-88) Page 123.32
Name of Respondent<br />
PACIFIC GAS AND ELECTRIC COMPANY<br />
This Report is:<br />
(1) X An Original<br />
(2) A Resubmission<br />
Date of Report<br />
(Mo, Da, Yr)<br />
04/08/2011<br />
Year/Period of Report<br />
<strong>2010</strong>/Q4<br />
NOTES TO FINANCIAL STATEMENTS (Continued)<br />
Fair Value Measurements at December 31, <strong>2010</strong><br />
(in millions) Level 1 Level 2 Level 3 Total<br />
Assets:<br />
Money market investments $ 138 $ - $ - $ 138<br />
Nuclear decommissioning trusts<br />
U.S. equity securities (1) 1,029 7 - 1,036<br />
Non-U.S. equity securities 349 - - 349<br />
U.S. government <strong>and</strong> agency securities 584 40 - 624<br />
Municipal securities - 119 - 119<br />
Other fixed income securities - 66 - 66<br />
Total nuclear decommissioning trusts (2) 1,962 232 - 2,194<br />
Price risk management instruments (Note 10)<br />
<strong>Electric</strong> (3) 130 - - 130<br />
<strong>Gas</strong> (4) 3 - - 3<br />
Total price risk management instruments 133 - - 133<br />
Rabbi trusts<br />
Fixed Income securities - 24 - 24<br />
Life insurance contracts - 65 - 65<br />
Total rabbi trusts - 89 - 89<br />
Long-term disability trust<br />
U.S. equity securities (1) 11 24 - 35<br />
Corporate debt securities (1) - 150 - 150<br />
Total long-term disability trust 11 174 - 185<br />
Total assets $ 2,244 $ 495 $ - $ 2,739<br />
Liabilities:<br />
Price risk management instruments (Note 10)<br />
<strong>Electric</strong> (5) $ - $ 5 $ 403 $ 408<br />
<strong>Gas</strong> (6) - 1 41 42<br />
Total price risk management instruments<br />
- 6 444 450<br />
Total liabilities $ - $ 6 $ 444 $ 450<br />
(1) Level 2 balances include commingled funds, which are comprised primarily of securities traded publicly on exchanges. Price quotes for the assets held by<br />
the funds are readily observable <strong>and</strong> available.<br />
(2) Excludes $185 million primarily related to deferred taxes on appreciation of investment value.<br />
(3) Balances include the impact of netting adjustments of $359 million to Level 1. Includes natural gas for electric portfolio.<br />
(4) Balances include the impact of netting adjustments of $44 million to Level 1. Includes natural gas for core customers.<br />
(5) Balances include the impact of netting adjustments of $66 million to Level 2 <strong>and</strong> $(48) million to Level 3. Includes natural gas for electric portfolio.<br />
(6) Balances include the impact of netting adjustments of $3 million to Level 3. Includes natural gas for core customers.<br />
Fair Value Measurements at December 31, 2009<br />
(in millions) Level 1 Level 2 Level 3 Total<br />
Assets:<br />
Money market investments $ 189 $ - $ 4 $ 193<br />
Nuclear decommissioning trusts<br />
<strong>FERC</strong> FORM NO. 1 (ED. 12-88) Page 123.33
Name of Respondent<br />
PACIFIC GAS AND ELECTRIC COMPANY<br />
This Report is:<br />
(1) X An Original<br />
(2) A Resubmission<br />
Date of Report<br />
(Mo, Da, Yr)<br />
04/08/2011<br />
Year/Period of Report<br />
<strong>2010</strong>/Q4<br />
NOTES TO FINANCIAL STATEMENTS (Continued)<br />
U.S. equity securities (1) 762 6 - 768<br />
Non-U.S. equity securities 344 - - 344<br />
U.S. government <strong>and</strong> agency securities 653 51 - 704<br />
Municipal securities 1 89 - 90<br />
Other fixed income securities - 108 - 108<br />
Total nuclear decommissioning trusts (2) 1,760 254 - 2,014<br />
Rabbi trusts<br />
Equity securities 21 - - 21<br />
Life insurance contracts 60 - - 60<br />
Total rabbi trusts 81 - - 81<br />
Long-term disability trust<br />
U.S. equity securities (1) 52 23 - 75<br />
Corporate debt securities (1) - 113 - 113<br />
Total long-term disability trust 52 136 - 188<br />
Total assets $ 2,082 $ 390 $ 4 $ 2,476<br />
Liabilities:<br />
Dividend participation rights (3) $ - $ - $ 12 $ 12<br />
Price risk management instruments (Note 10)<br />
<strong>Electric</strong> (4) 2 73 157 232<br />
<strong>Gas</strong> (5) 1 - 60 61<br />
Total price risk management instruments 3 73 217 293<br />
Other liabilities - - 3 3<br />
Total liabilities $ 3 $ 73 $ 232 $ 308<br />
(1) Level 2 balances include commingled funds, which are comprised primarily of securities traded publicly on exchanges. Price quotes for the assets held by<br />
the funds are readily observable <strong>and</strong> available.<br />
(2) Excludes deferred taxes on appreciation of investment value.<br />
(3) The dividend participation rights were associated with PG&E Corporation’s Convertible Subordinated Notes which were no longer outst<strong>and</strong>ing as of<br />
December 31, <strong>2010</strong>.<br />
(4) Balances include the impact of netting adjustments of $108 million to Level 1, $48 million to Level 2, <strong>and</strong> $19 million to Level 3. Includes natural gas for<br />
electric portfolio.<br />
(5) Balances include the impact of netting adjustments of $13 million to Level 3. Includes natural gas for core customers.<br />
Money Market Investments<br />
PG&E Corporation invests in money market funds that seek to maintain a stable net asset value. These funds invest in<br />
high-quality, short-term, diversified money market instruments, such as treasury bills, federal agency securities, certificates of deposit,<br />
<strong>and</strong> commercial paper with a maximum weighted average maturity of 60 days or less. PG&E Corporation’s investments in these<br />
money market funds are generally valued using unadjusted quotes in an active market for identical assets <strong>and</strong> are thus classified as<br />
Level 1 instruments. Money market funds are recorded as cash <strong>and</strong> cash equivalents in PG&E Corporation’s Consolidated Balance<br />
Sheets.<br />
Trust Assets<br />
The assets held by the nuclear decommissioning trusts, the rabbi trusts related to the non-qualified deferred compensation<br />
plans, <strong>and</strong> the long-term disability trust are comprised primarily of equity securities <strong>and</strong> debt securities. In general, investments held in<br />
the trusts are exposed to various risks, such as interest rate, credit, <strong>and</strong> market volatility risks. It is reasonably possible that changes in<br />
the market values of investment securities could occur in the near term, <strong>and</strong> such changes could materially affect the trusts’ fair value.<br />
Equity securities primarily include investments in common stock <strong>and</strong> commingled funds comprised of equity across multiple<br />
<strong>FERC</strong> FORM NO. 1 (ED. 12-88) Page 123.34
Name of Respondent<br />
PACIFIC GAS AND ELECTRIC COMPANY<br />
This Report is:<br />
(1) X An Original<br />
(2) A Resubmission<br />
Date of Report<br />
(Mo, Da, Yr)<br />
04/08/2011<br />
Year/Period of Report<br />
<strong>2010</strong>/Q4<br />
NOTES TO FINANCIAL STATEMENTS (Continued)<br />
industry sectors in the U.S. <strong>and</strong> other regions of the world. Equity securities are generally valued based on unadjusted prices in active<br />
markets for identical transactions <strong>and</strong> are classified as Level 1.<br />
Debt securities are comprised primarily of fixed income securities that include U.S. government <strong>and</strong> agency securities,<br />
municipal securities, <strong>and</strong> corporate debt securities. A market based valuation approach is generally used to estimate the fair value of<br />
debt securities classified as Level 2 instruments in the tables above. Under a market approach, fair values are determined based on<br />
evaluated pricing data, such as broker quotes, for similar securities adjusted for observable differences. Significant inputs used in the<br />
valuation model generally include benchmark yield curves <strong>and</strong> issuer spreads. The external credit rating, coupon rate, <strong>and</strong> maturity of<br />
each security are considered in the valuation, as applicable.<br />
The Consolidated Balance Sheets of PG&E Corporation <strong>and</strong> the Utility contain assets held in trust for the PG&E Retirement<br />
Plan Master Trust, the Postretirement Life Insurance Trust, <strong>and</strong> the Postretirement Medical Trusts presented on a net basis. (See Note<br />
12 below.) The pension assets are presented net of pension obligations as noncurrent liabilities – other in PG&E Corporation’s <strong>and</strong> the<br />
Utility’s Consolidated Balance Sheets.<br />
Price Risk Management Instruments<br />
Price risk management instruments include physical <strong>and</strong> financial derivative contracts, such as futures, forwards, swaps,<br />
options, <strong>and</strong> CRRs that are either exchange-traded or over-the-counter traded. (See Note 10 above.)<br />
Futures, forwards, <strong>and</strong> swaps are valued using observable market prices for the underlying commodity or an identical<br />
instrument <strong>and</strong> are classified as Level 1 or Level 2 instruments. For periods where market data is not available, the Utility extrapolates<br />
forward prices. Other futures, forwards, <strong>and</strong> swaps are considered Level 3 instruments as the determination of their fair value includes<br />
the use of unobservable forward prices.<br />
All energy-related options are classified as Level 3 <strong>and</strong> are valued using a st<strong>and</strong>ard option pricing model with various<br />
assumptions, including forward prices for the underlying commodity, time value at a risk free rate, <strong>and</strong> volatility. For periods when<br />
market data is not available, the Utility extrapolates these assumptions using internal models.<br />
The Utility holds CRRs to hedge financial risk of CAISO-imposed congestion charges in the day-ahead markets. CRRs are<br />
valued based on the forecasted settlement price at the delivery points underlying the CRR using internal models. The Utility also uses<br />
the most current annual auction prices published by the CAISO to calibrate internal models. Limited market data is available between<br />
auction dates; therefore, CRRs are classified as Level 3 measurements.<br />
The Utility enters into power purchase agreements for the purchase of electricity to meet the dem<strong>and</strong> of its customers. (See<br />
Note 10 above.) The Utility uses internal models to determine the fair value of these power purchase agreements. These power<br />
purchase agreements include contract terms that extend beyond a period for which an active market exists. The Utility utilizes market<br />
data for the underlying commodity to the extent that it is available in determining the fair value. For periods where market data is not<br />
available, the Utility extrapolates forward prices. These power purchase agreements are considered Level 3 instruments as the<br />
determination of their fair value includes the use of unobservable forward prices.<br />
Transfers between Levels<br />
PG&E Corporation <strong>and</strong> the Utility recognize any transfers between levels in the fair value hierarchy as of the end of the<br />
reporting period. There were no significant transfers between levels for the year ended December 31, <strong>2010</strong>.<br />
Level 3 Reconciliation<br />
The following tables present reconciliations for assets <strong>and</strong> liabilities measured <strong>and</strong> recorded at fair value on a recurring basis,<br />
using significant unobservable inputs (Level 3), for the years ended December 31, <strong>2010</strong> <strong>and</strong> 2009:<br />
PG&E Corporation Only<br />
PG&E Corporation <strong>and</strong> the Utility<br />
<strong>FERC</strong> FORM NO. 1 (ED. 12-88) Page 123.35
Name of Respondent<br />
PACIFIC GAS AND ELECTRIC COMPANY<br />
This Report is:<br />
(1) X An Original<br />
(2) A Resubmission<br />
Date of Report<br />
(Mo, Da, Yr)<br />
04/08/2011<br />
Year/Period of Report<br />
<strong>2010</strong>/Q4<br />
NOTES TO FINANCIAL STATEMENTS (Continued)<br />
Nuclear<br />
Decommission- Long-term Long-term<br />
Dividend Price Risk ing Trusts Disability Disability<br />
Money Participation Management Equity Equity Corp. Debt Other<br />
(in millions) Market Rights Instruments Securities (1) Securities Securities Liabilities Total<br />
Asset (liability) balance<br />
as of December 31, 2008 $ 12 $ (42) $ (156) $ 5 $ 54 $ 24 $ (2) $ (105)<br />
Realized <strong>and</strong> unrealized<br />
gains (losses):<br />
Included in earnings - 2 - - 12 3 - 17<br />
Included in regulatory<br />
assets <strong>and</strong> liabilities or<br />
balancing accounts - - (61) 1 - - (1) (61)<br />
Purchases, issuances, <strong>and</strong><br />
settlements (8) 28 - - (43) 86 - 63<br />
Transfers into Level 3 - - - - - - - -<br />
Transfers out of Level 3 - - - (6) (23) (113) - (142)<br />
Asset (liability) balance<br />
as of December 31, 2009 $ 4 $ (12) $ (217) $ - $ - $ - $ (3) $ (228)<br />
Realized <strong>and</strong> unrealized<br />
gains (losses):<br />
Included in earnings - - - - - - - -<br />
Included in regulatory<br />
assets <strong>and</strong> liabilities or<br />
balancing accounts - - (227) - - - 3 (224)<br />
Purchases, issuances, <strong>and</strong><br />
settlements (4) 12 - - - - - 8<br />
Transfers into Level 3 - - - - - - - -<br />
Transfers out of Level 3 - - - - - - - -<br />
Asset (liability) balance<br />
as of December 31, <strong>2010</strong> $ - $ - $ (444) $ - $ - $ - $ - $ (444)<br />
(1) Excludes deferred taxes on appreciation of investment value.<br />
Financial Instruments<br />
PG&E Corporation <strong>and</strong> the Utility use the following methods <strong>and</strong> assumptions in estimating fair value for financial<br />
instruments:<br />
• ?The fair values of cash, restricted cash <strong>and</strong> deposits, net accounts receivable, short-term borrowings,<br />
accounts payable, customer deposits, <strong>and</strong> the Utility’s variable rate pollution control bond loan<br />
agreements approximate their carrying values at December 31, <strong>2010</strong> <strong>and</strong> 2009.<br />
• ?The fair values of the Utility’s fixed rate senior notes <strong>and</strong> fixed rate pollution control bond loan<br />
agreements, PG&E Corporation’s Convertible Subordinated Notes, PG&E Corporation’s fixed rate<br />
senior notes, <strong>and</strong> the ERBs issued by PERF were based on quoted market prices at December 31, <strong>2010</strong><br />
<strong>and</strong> 2009.<br />
The carrying amount <strong>and</strong> fair value of PG&E Corporation’s <strong>and</strong> the Utility’s debt instruments were as follows (the table<br />
below excludes financial instruments with carrying values that approximate their fair values):<br />
<strong>FERC</strong> FORM NO. 1 (ED. 12-88) Page 123.36
Name of Respondent<br />
PACIFIC GAS AND ELECTRIC COMPANY<br />
This Report is:<br />
(1) X An Original<br />
(2) A Resubmission<br />
Date of Report<br />
(Mo, Da, Yr)<br />
04/08/2011<br />
Year/Period of Report<br />
<strong>2010</strong>/Q4<br />
NOTES TO FINANCIAL STATEMENTS (Continued)<br />
At December 31,<br />
<strong>2010</strong> 2009<br />
Carrying Fair Carrying Fair<br />
(in millions) Amount Value (2) Amount Value (2)<br />
Debt (Note 4):<br />
PG&E Corporation (1) $ 349 $ 383 $ 597 $ 1,096<br />
Utility 10,444 11,314 9,240 9,824<br />
Energy recovery bonds (Note 5) 827 862 1,213 1,269<br />
(1) PG&E Corporation Convertible Subordinated Notes were no longer outst<strong>and</strong>ing as of December 31, <strong>2010</strong>.<br />
(2) Fair values are determined using readily available quoted market prices.<br />
Nuclear Decommissioning Trust Investments<br />
The funds in the decommissioning trusts, along with accumulated earnings, will be used exclusively for decommissioning <strong>and</strong><br />
dismantling the Utility’s nuclear facilities. At December 31, <strong>2010</strong> <strong>and</strong> 2009, the Utility had accumulated nuclear decommissioning<br />
trust funds with an estimated fair value of $2.0 billion <strong>and</strong> $1.9 billion, respectively, net of deferred taxes on unrealized gains. In <strong>2010</strong><br />
<strong>and</strong> 2009, the trusts earned $62 million <strong>and</strong> $63 million in interest <strong>and</strong> dividends, respectively. All earnings on the assets held in the<br />
trusts, net of authorized disbursements from the trusts <strong>and</strong> investment management <strong>and</strong> administrative fees, are reinvested. Amounts<br />
may not be released from the decommissioning trusts until authorized by the CPUC.<br />
At December 31, <strong>2010</strong> <strong>and</strong> 2009, total unrealized losses on the investments held in the trusts were $6 million <strong>and</strong> $8 million,<br />
respectively. The Utility concluded that the unrealized losses were other-than-temporary impairments <strong>and</strong> recorded a reduction to the<br />
nuclear decommissioning trusts assets <strong>and</strong> the corresponding regulatory liability for asset retirement costs. There were no individually<br />
material unrealized losses.<br />
The following table provides a summary of available-for-sale investments held in the Utility’s nuclear decommissioning<br />
trusts:<br />
Total Total<br />
Amortized Unrealized Unrealized Estimated (1)<br />
Cost Gains Losses Fair Value<br />
(in millions)<br />
As of December 31, <strong>2010</strong><br />
Equity securities<br />
U.S. $ 509 $ 529 $ (2) $ 1,036<br />
Non-U.S. 180 170 (1) 349<br />
Debt securities<br />
U.S. government <strong>and</strong> agency<br />
securities 571 55 (2) 624<br />
Municipal securities 119 1 (1) 119<br />
Other fixed income securities 65 1 - 66<br />
Total $ 1,444 $ 756 $ (6) $ 2,194<br />
As of December 31, 2009<br />
Equity securities<br />
U.S. $ 344 $ 425 $ (1) $ 768<br />
Non-U.S. 182 163 (1) 344<br />
Debt securities<br />
U.S. government <strong>and</strong> agency<br />
securities 656 52 (4) 704<br />
<strong>FERC</strong> FORM NO. 1 (ED. 12-88) Page 123.37
Name of Respondent<br />
PACIFIC GAS AND ELECTRIC COMPANY<br />
This Report is:<br />
(1) X An Original<br />
(2) A Resubmission<br />
Date of Report<br />
(Mo, Da, Yr)<br />
04/08/2011<br />
Year/Period of Report<br />
<strong>2010</strong>/Q4<br />
NOTES TO FINANCIAL STATEMENTS (Continued)<br />
Municipal securities 89 1 - 90<br />
Other fixed income securities 108 2 (2) 108<br />
Total $ 1,379 $ 643 $ (8) $ 2,014<br />
(1) Excludes taxes on appreciation of investment value.<br />
The debt securities mature on the following schedule:<br />
As of December 31, <strong>2010</strong><br />
(in millions)<br />
Less than 1 year $ 37<br />
1–5 years 349<br />
5–10 years 215<br />
More than 10 years 208<br />
Total maturities of debt securities $ 809<br />
The following table provides a summary of the activity for the debt <strong>and</strong> equity securities:<br />
Year Ended December 31,<br />
<strong>2010</strong> 2009 2008<br />
(in millions)<br />
Proceeds from sales <strong>and</strong> maturities of nuclear decommissioning trust<br />
investments $ 1,405 $ 1,351 $ 1,635<br />
Gross realized gains on sales of securities held as available-for-sale 42 27 30<br />
Gross realized losses on sales of securities held as available-for-sale (11) (55) (142)<br />
NOTE 12: EMPLOYEE BENEFIT PLANS<br />
PG&E Corporation <strong>and</strong> the Utility provide a non-contributory defined benefit pension plan for eligible employees <strong>and</strong> retirees<br />
(referred to collectively as “pension benefits”), contributory postretirement medical plans for eligible employees <strong>and</strong> retirees <strong>and</strong> their<br />
eligible dependents, <strong>and</strong> non-contributory postretirement life insurance plans for eligible employees <strong>and</strong> retirees (referred to<br />
collectively as “other benefits”). PG&E Corporation <strong>and</strong> the Utility have elected that certain of the trusts underlying these plans be<br />
treated under the Code as qualified trusts. If certain conditions are met, PG&E Corporation <strong>and</strong> the Utility can deduct payments made<br />
to the qualified trusts, subject to certain Code limitations. PG&E Corporation <strong>and</strong> the Utility use a December 31 measurement date for<br />
all plans.<br />
PG&E Corporation’s <strong>and</strong> the Utility’s funding policy is to contribute tax-deductible amounts, consistent with applicable<br />
regulatory decisions <strong>and</strong> federal minimum funding requirements. Based upon current assumptions <strong>and</strong> available information, the<br />
Utility has not identified any minimum funding requirements related to its pension plans.<br />
Change in Plan Assets, Benefit Obligations, <strong>and</strong> Funded Status<br />
The following tables show the reconciliation of changes in plan assets, benefit obligations, <strong>and</strong> the plans’ aggregate funded<br />
status for pension benefits <strong>and</strong> other benefits for PG&E Corporation during <strong>2010</strong> <strong>and</strong> 2009:<br />
Pension Benefits<br />
(in millions) <strong>2010</strong> 2009<br />
Change in plan assets:<br />
Fair value of plan assets at January 1 $ 9,330 $ 8,066<br />
Actual return on plan assets 1,235 1,523<br />
<strong>FERC</strong> FORM NO. 1 (ED. 12-88) Page 123.38
Name of Respondent<br />
PACIFIC GAS AND ELECTRIC COMPANY<br />
This Report is:<br />
(1) X An Original<br />
(2) A Resubmission<br />
Date of Report<br />
(Mo, Da, Yr)<br />
04/08/2011<br />
Year/Period of Report<br />
<strong>2010</strong>/Q4<br />
NOTES TO FINANCIAL STATEMENTS (Continued)<br />
<strong>Company</strong> contributions 162 187<br />
Benefits <strong>and</strong> expenses paid (477) (446)<br />
Fair value of plan assets at December 31 $ 10,250 $ 9,330<br />
Change in benefit obligation:<br />
Projected benefit obligation at January 1 $ 10,766 $ 9,767<br />
Service cost for benefits earned 253 227<br />
Interest cost 645 624<br />
Actuarial loss 856 494<br />
Plan amendments (1) 71<br />
Transitional costs 4 3<br />
Benefits paid (452) (420)<br />
Projected benefit obligation at December 31 (1) $<br />
12,071<br />
$<br />
10,766<br />
Funded status:<br />
Current liability $ (5) $ (5)<br />
Noncurrent liability (1,816) (1,431)<br />
Accrued benefit cost at December 31 $ (1,821) $ (1,436)<br />
(1) PG&E Corporation’s accumulated benefit obligation was $10,653 million <strong>and</strong> $9,527 million at December 31, <strong>2010</strong> <strong>and</strong> 2009, respectively.<br />
Other Benefits<br />
(in millions) <strong>2010</strong> 2009<br />
Change in plan assets:<br />
Fair value of plan assets at January 1 $ 1,169 $ 990<br />
Actual return on plan assets 147 166<br />
<strong>Company</strong> contributions 94 87<br />
Plan participant contribution 49 42<br />
Benefits <strong>and</strong> expenses paid (122) (116)<br />
Fair value of plan assets at December 31 $ 1,337 $ 1,169<br />
Change in benefit obligation:<br />
Benefit obligation at January 1 $ 1,511 $ 1,382<br />
Service cost for benefits earned 36 30<br />
Interest cost 88 87<br />
Actuarial loss 52 72<br />
Plan amendments 128 -<br />
Transitional costs 1 1<br />
Benefits paid (113) (106)<br />
Federal subsidy on benefits paid 3 4<br />
Plan participant contributions 49 41<br />
Benefit obligation at December 31 $ 1,755 $ 1,511<br />
Funded status:<br />
Noncurrent liability $ (418) $ (342)<br />
Accrued benefit cost at December 31 $ (418) $ (342)<br />
There was no material difference between PG&E Corporation <strong>and</strong> the Utility for the information disclosed above.<br />
<strong>FERC</strong> FORM NO. 1 (ED. 12-88) Page 123.39
Name of Respondent<br />
PACIFIC GAS AND ELECTRIC COMPANY<br />
This Report is:<br />
(1) X An Original<br />
(2) A Resubmission<br />
Date of Report<br />
(Mo, Da, Yr)<br />
04/08/2011<br />
Year/Period of Report<br />
<strong>2010</strong>/Q4<br />
NOTES TO FINANCIAL STATEMENTS (Continued)<br />
On February 16, <strong>2010</strong>, the Utility amended its contributory postretirement medical plans for retirees to provide for additional<br />
employer contributions towards retiree premiums. The plan amendment was accounted for as a plan modification that required<br />
re-measurement of the accumulated benefit obligation, plan assets, <strong>and</strong> periodic benefit costs. The inputs <strong>and</strong> assumptions used in<br />
re-measurement did not change significantly from December 31, 2009 <strong>and</strong> did not have a material impact on the funded status of the<br />
plans. The re-measurement of the accumulated benefit obligation <strong>and</strong> plan assets resulted in an increase to other postretirement<br />
benefits <strong>and</strong> a decrease to other comprehensive income of $148 million. The impact to net periodic benefit cost was not material.<br />
Components of Net Periodic Benefit Cost<br />
Net periodic benefit cost as reflected in PG&E Corporation’s Consolidated Statements of Income for <strong>2010</strong>, 2009, <strong>and</strong> 2008 is<br />
as follows:<br />
Pension Benefits<br />
December 31,<br />
(in millions) <strong>2010</strong> 2009 2008<br />
Service cost for benefits earned $ 279 $ 259 $ 236<br />
Interest cost 645 624 581<br />
Expected return on plan assets (624) (579) (696)<br />
Amortization of prior service cost 53 53 47<br />
Amortization of unrecognized loss 44 101 1<br />
Net periodic benefit cost 397 458 169<br />
Less: transfer to regulatory account (1) (233) (294) (4)<br />
Total $ 164 $ 164 $ 165<br />
(1) The Utility recorded $233 million, $295 million, <strong>and</strong> $4 million for the years ended December 31, <strong>2010</strong>, 2009, <strong>and</strong> 2008, respectively, to a regulatory account as<br />
the amounts are probable of recovery from customers in future rates.<br />
Other Benefits<br />
December 31,<br />
(in millions) <strong>2010</strong> 2009 2008<br />
Service cost for benefits earned $ 36 $ 30 $ 29<br />
Interest cost 88 87 81<br />
Expected return on plan assets (74) (68) (93)<br />
Amortization of transition obligation 26 26 26<br />
Amortization of prior service cost 25 16 16<br />
<strong>FERC</strong> FORM NO. 1 (ED. 12-88) Page 123.40
Name of Respondent<br />
PACIFIC GAS AND ELECTRIC COMPANY<br />
This Report is:<br />
(1) X An Original<br />
(2) A Resubmission<br />
Date of Report<br />
(Mo, Da, Yr)<br />
04/08/2011<br />
Year/Period of Report<br />
<strong>2010</strong>/Q4<br />
NOTES TO FINANCIAL STATEMENTS (Continued)<br />
Amortization of unrecognized loss (gain) 3 3 (15)<br />
Net periodic benefit cost $ 104 $ 94 $ 44<br />
There was no material difference between PG&E Corporation <strong>and</strong> the Utility for the information disclosed above.<br />
Components of Accumulated Other Comprehensive Income (Loss)<br />
PG&E Corporation <strong>and</strong> the Utility record the net periodic benefit cost for pension benefits <strong>and</strong> other benefits as a component<br />
of accumulated other comprehensive income (loss), net of tax. Net periodic benefit cost is composed of unrecognized prior service<br />
costs, unrecognized gains <strong>and</strong> losses, <strong>and</strong> unrecognized net transition obligations as components of accumulated other comprehensive<br />
income, net of tax. (See Note 2 above.)<br />
Regulatory adjustments are recorded in the Consolidated Statements of Income <strong>and</strong> Consolidated Balance Sheets to reflect the<br />
difference between pension expense or income for accounting purposes <strong>and</strong> pension expense or income for ratemaking, which is based<br />
on a funding approach. A regulatory adjustment is also recorded for the amounts that would otherwise be charged to accumulated<br />
other comprehensive income for the pension benefits related to the Utility’s defined benefit pension plan. The Utility would record a<br />
regulatory liability for a portion of the credit balance in accumulated other comprehensive income, should the other benefits be in an<br />
overfunded position. However, this recovery mechanism does not allow the Utility to record a regulatory asset for an underfunded<br />
position related to other benefits. Therefore, the charge remains in accumulated other comprehensive income (loss) for other benefits.<br />
Pension Benefits<br />
The estimated amounts that will be amortized into net periodic benefit cost for PG&E Corporation in 2011 are as follows:<br />
(in millions)<br />
Unrecognized prior service cost $ 35<br />
Unrecognized net loss 48<br />
Total $ 83<br />
Other Benefits<br />
(in millions)<br />
Unrecognized prior service cost $ 26<br />
Unrecognized net loss 4<br />
Unrecognized net transition obligation 26<br />
Total $ 56<br />
There were no material differences between the estimated amounts that will be amortized into net period benefit costs for<br />
PG&E Corporation <strong>and</strong> the Utility.<br />
Medicare Prescription Drug, Improvement <strong>and</strong> Modernization Act of 2003<br />
The Medicare Prescription Drug, Improvement, <strong>and</strong> Modernization Act of 2003 establishes a prescription drug benefit under<br />
Medicare (“Medicare Part D”) <strong>and</strong> a tax-exempt federal subsidy to sponsors of retiree health care benefit plans that provide a benefit<br />
that actuarially is at least equivalent to Medicare Part D. PG&E Corporation <strong>and</strong> the Utility determined that benefits provided to<br />
certain participants actuarially will be at least equivalent to Medicare Part D. Therefore, PG&E Corporation <strong>and</strong> the Utility are<br />
entitled to a tax-exempt subsidy that reduced the accumulated postretirement benefit obligation under the defined benefit medical plan<br />
at December 31, <strong>2010</strong> <strong>and</strong> 2009 <strong>and</strong> reduced the net periodic cost for <strong>2010</strong> <strong>and</strong> 2009 by the following amounts:<br />
(in millions) <strong>2010</strong> 2009<br />
Accumulated postretirement benefit obligation reduction $ 72 $ 71<br />
<strong>FERC</strong> FORM NO. 1 (ED. 12-88) Page 123.41
Name of Respondent<br />
PACIFIC GAS AND ELECTRIC COMPANY<br />
This Report is:<br />
(1) X An Original<br />
(2) A Resubmission<br />
Date of Report<br />
(Mo, Da, Yr)<br />
04/08/2011<br />
Year/Period of Report<br />
<strong>2010</strong>/Q4<br />
NOTES TO FINANCIAL STATEMENTS (Continued)<br />
Net periodic benefit cost reduction 1 7<br />
On March 30, <strong>2010</strong>, federal healthcare legislation was signed eliminating the deduction for subsidy contributions after 2012.<br />
(See Note 9 above.)<br />
There was no material difference between PG&E Corporation’s <strong>and</strong> the Utility’s Medicare Part D subsidy during <strong>2010</strong>.<br />
Valuation Assumptions<br />
The following actuarial assumptions were used in determining the projected benefit obligations <strong>and</strong> the net periodic cost. The<br />
following weighted average year-end assumptions were used in determining the plans’ projected benefit obligations <strong>and</strong> net benefit<br />
cost.<br />
Pension Benefits<br />
Other Benefits<br />
December 31, December 31,<br />
<strong>2010</strong> 2009 2008 <strong>2010</strong> 2009 2008<br />
Discount rate 5.42% 5.97% 6.31% 5.11–5.56% 5.66–6.09% 5.85–6.33%<br />
Average rate of future compensation<br />
increases 5.00% 5.00% 5.00% - - -<br />
Expected return on plan assets 6.60% 6.80% 7.30% 5.20–6.60% 5.80–6.90% 7.00–7.30%<br />
The assumed health care cost trend rate as of December 31, <strong>2010</strong> is 8%, decreasing gradually to an ultimate trend rate in 2018<br />
<strong>and</strong> beyond of approximately 5%. A one-percentage-point change in assumed health care cost trend rate would have the following<br />
effects:<br />
One-<br />
Percentage-<br />
Point<br />
Increase<br />
One-<br />
Percentage-<br />
Point<br />
Decrease<br />
(in millions)<br />
Effect on postretirement benefit obligation $ 83 $ (86)<br />
Effect on service <strong>and</strong> interest cost 7 (7)<br />
Expected rates of return on plan assets were developed by determining projected stock <strong>and</strong> bond returns <strong>and</strong> then applying<br />
these returns to the target asset allocations of the employee benefit plan trusts, resulting in a weighted average rate of return on plan<br />
assets. Returns on fixed-income debt investments were projected based on real maturity <strong>and</strong> credit spreads added to a long-term<br />
inflation rate. Returns on equity investments were estimated based on estimates of dividend yield <strong>and</strong> real earnings growth added to a<br />
long-term inflation rate. For the pension plan, the assumed return of 6.6% compares to a ten-year actual return of 6.2%. The rate used<br />
to discount pension benefits <strong>and</strong> other benefits was based on a yield curve developed from market data of over approximately 600<br />
Aa-grade non-callable bonds at December 31, <strong>2010</strong>. This yield curve has discount rates that vary based on the duration of the<br />
obligations. The estimated future cash flows for the pension <strong>and</strong> other benefit obligations were matched to the corresponding rates on<br />
the yield curve to derive a weighted average discount rate.<br />
The difference between actual <strong>and</strong> expected return on plan assets is included in unrecognized gain (loss), <strong>and</strong> is considered in<br />
the determination of future net periodic benefit income (cost). The actual return on plan assets for 2009 was lower than the expected<br />
return due to the significant decline in equity market values that occurred in 2009. The actual return on plan assets in <strong>2010</strong> was in line<br />
with the expectations.<br />
Investment Policies <strong>and</strong> Strategies<br />
The financial position of PG&E Corporation’s <strong>and</strong> the Utility’s funded employee benefit plans is driven by the relationship<br />
between plan assets <strong>and</strong> liabilities. As noted above, the funded status is the difference between the fair value of plan assets <strong>and</strong><br />
projected benefit obligations. Volatility in funded status occurs when asset values change differently from liability values <strong>and</strong> can<br />
result in fluctuations in costs for financial reporting as well as the amount of minimum contributions required under the Employee<br />
<strong>FERC</strong> FORM NO. 1 (ED. 12-88) Page 123.42
Name of Respondent<br />
PACIFIC GAS AND ELECTRIC COMPANY<br />
This Report is:<br />
(1) X An Original<br />
(2) A Resubmission<br />
Date of Report<br />
(Mo, Da, Yr)<br />
04/08/2011<br />
Year/Period of Report<br />
<strong>2010</strong>/Q4<br />
NOTES TO FINANCIAL STATEMENTS (Continued)<br />
Retirement Income Security Act of 1974, as amended (“ERISA”). PG&E Corporation’s <strong>and</strong> the Utility’s investment policies <strong>and</strong><br />
strategies are designed to increase the ratio of trust assets to plan liabilities at an acceptable level of funded status volatility.<br />
Interest rate risk <strong>and</strong> equity risk are the key determinants of PG&E Corporation’s <strong>and</strong> the Utility’s funded status volatility. In<br />
addition to affecting the trust’s fixed income portfolio market values, interest rate changes also influence liability valuations as<br />
discount rates move with current bond yields. To manage this risk, PG&E Corporation’s <strong>and</strong> the Utility’s trusts hold significant<br />
allocations to fixed income investments that include U.S. government securities, corporate securities, interest rate swaps, <strong>and</strong> other<br />
fixed income securities. Although they contribute to funded status volatility, equity investments are held to reduce long-term funding<br />
costs due to their higher expected return. The equity investment allocation is implemented through diversified U.S., non-U.S., <strong>and</strong><br />
global portfolios that include common stock <strong>and</strong> commingled funds across multiple industry sectors. Absolute return investments<br />
include hedge fund portfolios that diversify the plan’s holdings in equity <strong>and</strong> fixed income investments by exhibiting returns with low<br />
correlation to the direction of these markets. Over the last three years, target allocations to equity investments have generally declined<br />
in favor of longer-maturity fixed income investments as a means of dampening future funded status volatility.<br />
PG&E Corporation <strong>and</strong> the Utility apply a risk management framework for managing the risks associated with employee<br />
benefit plan trust assets. The guiding principles of this risk management framework are the clear articulation of roles <strong>and</strong><br />
responsibilities, appropriate delegation of authority, <strong>and</strong> proper accountability <strong>and</strong> documentation. Trust investment policies <strong>and</strong><br />
investment manager guidelines include provisions to ensure prudent diversification, manage risk through appropriate use of physical<br />
direct asset holdings <strong>and</strong> derivative securities, <strong>and</strong> identify permitted <strong>and</strong> prohibited investments.<br />
The target asset allocation percentages for major categories of trust assets for pension <strong>and</strong> other benefit plans at December 31,<br />
2011, <strong>2010</strong>, <strong>and</strong> 2009 are as follows:<br />
Pension Benefits<br />
Other Benefits<br />
2011 <strong>2010</strong> 2009 2011 <strong>2010</strong> 2009<br />
U.S. Equity 26% 26% 32% 28% 26% 37%<br />
Non-U.S. Equity 14% 14% 18% 15% 13% 18%<br />
Global Equity 5% 5% 5% 3% 3% 3%<br />
Absolute Return 5% 5% 5% 4% 3% 3%<br />
Fixed Income 50% 50% 40% 50% 54% 34%<br />
Cash Equivalents -% -% -% -% 1% 5%<br />
Total 100% 100% 100% 100% 100% 100%<br />
Fair Value Measurements<br />
The following tables present the fair value of plan assets for pension <strong>and</strong> other benefit plans by major asset category at<br />
December 31, <strong>2010</strong> <strong>and</strong> 2009.<br />
Fair Value Measurements as of December 31, <strong>2010</strong><br />
(in millions) Level 1 Level 2 Level 3 Total<br />
Pension Benefits:<br />
U.S. Equity $ 328 $ 2,482 $ - $ 2,810<br />
Non-U.S. Equity 356 1,111 - 1,467<br />
Global Equity 177 360 - 537<br />
Absolute Return - - 494 494<br />
Fixed Income:<br />
U.S. Government 790 233 - 1,023<br />
Corporate 6 2,724 549 3,279<br />
Other 52 393 120 565<br />
Cash Equivalents 20 - - 20<br />
Total $ 1,729 $ 7,303 $ 1,163 $ 10,195<br />
<strong>FERC</strong> FORM NO. 1 (ED. 12-88) Page 123.43
Name of Respondent<br />
PACIFIC GAS AND ELECTRIC COMPANY<br />
This Report is:<br />
(1) X An Original<br />
(2) A Resubmission<br />
Date of Report<br />
(Mo, Da, Yr)<br />
04/08/2011<br />
Year/Period of Report<br />
<strong>2010</strong>/Q4<br />
NOTES TO FINANCIAL STATEMENTS (Continued)<br />
Other Benefits:<br />
U.S. Equity $ 104 $ 230 $ - $ 334<br />
Non-U.S. Equity 118 80 - 198<br />
Global Equity 18 29 - 47<br />
Absolute Return - - 47 47<br />
Fixed Income:<br />
U.S. Government 73 14 - 87<br />
Corporate 8 457 129 594<br />
Other 3 21 10 34<br />
Cash Equivalents 13 - - 13<br />
Total $ 337 $ 831 $ 186 $ 1,354<br />
Other Assets 38<br />
Total Plan Assets at Fair Value $ 11,587<br />
Fair Value Measurements as of December 31, 2009<br />
(in millions) Level 1 Level 2 Level 3 Total<br />
Pension Benefits:<br />
U.S. Equity $ 411 $ 2,065 $ - $ 2,476<br />
Non-U.S. Equity 316 1,018 - 1,334<br />
Global Equity 162 317 - 479<br />
Absolute Return - - 340 340<br />
Fixed Income:<br />
U.S. Government 585 262 - 847<br />
Corporate 25 2,455 531 3,011<br />
Other (8) 233 190 415<br />
Cash Equivalents 378 31 - 409<br />
Total $ 1,869 $ 6,381 $ 1,061 $ 9,311<br />
Other Benefits:<br />
U.S. Equity $ 88 $ 218 $ - $ 306<br />
Non-U.S. Equity 81 68 - 149<br />
Global Equity - 8 - 8<br />
Absolute Return - - 32 32<br />
Fixed Income:<br />
U.S. Government 40 15 - 55<br />
Corporate 82 275 124 481<br />
Other (1) 13 17 29<br />
Cash Equivalents 111 - - 111<br />
Total $ 401 $ 597 $ 173 $ 1,171<br />
Other Assets 17<br />
Total Plan Assets at Fair Value $ 10,499<br />
Equity Securities<br />
The U.S., Non-U.S., <strong>and</strong> combined Global Equity categories include equity investments in common stock <strong>and</strong> commingled<br />
funds comprised of equity across multiple industries <strong>and</strong> regions of the world. Equity investments in common stock are actively traded<br />
on a public exchange <strong>and</strong> are therefore considered Level 1 assets. These equity investments are generally valued based on unadjusted<br />
prices in active markets for identical securities. Commingled funds are maintained by investment companies for large institutional<br />
investors <strong>and</strong> are not publicly traded. Commingled funds are comprised primarily of underlying equity securities that are publicly<br />
traded on exchanges, <strong>and</strong> price quotes for the assets held by these funds are readily observable <strong>and</strong> available. Commingled funds are<br />
categorized as Level 2 assets.<br />
<strong>FERC</strong> FORM NO. 1 (ED. 12-88) Page 123.44
Name of Respondent<br />
PACIFIC GAS AND ELECTRIC COMPANY<br />
This Report is:<br />
(1) X An Original<br />
(2) A Resubmission<br />
Date of Report<br />
(Mo, Da, Yr)<br />
04/08/2011<br />
Year/Period of Report<br />
<strong>2010</strong>/Q4<br />
NOTES TO FINANCIAL STATEMENTS (Continued)<br />
Absolute Return<br />
The Absolute Return category includes portfolios of hedge funds that are valued based on a variety of proprietary <strong>and</strong><br />
non-proprietary valuation methods, including unadjusted prices for publicly-traded securities in active markets. Hedge funds are<br />
considered Level 3 assets.<br />
Fixed Income<br />
The Fixed Income category includes U.S. government securities, corporate securities, <strong>and</strong> other fixed income securities.<br />
U.S. government fixed income primarily consists of U.S. Treasury notes <strong>and</strong> U.S. government bonds that are valued based on<br />
quoted market prices or evaluated pricing data for similar securities adjusted for observable differences. These securities are<br />
categorized as Level 1 or Level 2 assets.<br />
Corporate fixed income primarily includes investment grade bonds of U.S. issuers across multiple industries that are valued<br />
based on a compilation of primarily observable information or broker quotes in non-active markets. The fair value of corporate bonds<br />
is determined using recently executed transactions, market price quotations (where observable), bond spreads or credit default swap<br />
spreads obtained from independent external parties such as vendors <strong>and</strong> brokers adjusted for any basis difference between cash <strong>and</strong><br />
derivative instruments. These securities are classified as Level 2 assets. Corporate fixed income also includes one commingled fund<br />
comprised of private corporate debt instruments. The fund is valued using pricing models <strong>and</strong> valuation inputs that are unobservable<br />
<strong>and</strong> is considered a Level 3 asset.<br />
Other fixed income primarily includes pass-through <strong>and</strong> asset-backed securities. Pass-through securities are valued based on<br />
benchmark yields created using observable market inputs <strong>and</strong> are Level 2 assets. Asset-backed securities are primarily valued based<br />
on broker quotes in non-active markets <strong>and</strong> are considered Level 3 assets. Other fixed income also includes municipal bonds <strong>and</strong><br />
futures. Municipal bonds are valued based on a compilation of primarily observable information or broker quotes in non-active<br />
markets <strong>and</strong> are considered Level 2 assets. Futures are valued based on unadjusted prices in active markets <strong>and</strong> are Level 1 assets.<br />
Cash Equivalents<br />
Cash equivalents consist primarily of money markets <strong>and</strong> commingled funds of short-term securities that are considered Level<br />
1 assets <strong>and</strong> valued at the net asset value of $1 per unit. The number of units held by the plan fluctuates based on the unadjusted price<br />
changes in active markets for the funds’ underlying assets.<br />
Transfers between Levels<br />
PG&E Corporation <strong>and</strong> the Utility recognize any transfers between levels in the fair value hierarchy as of the end of the<br />
reporting period. There were no significant transfers between levels for the year ended December 31, <strong>2010</strong>.<br />
Level 3 Reconciliation<br />
The following table is a reconciliation of changes in the fair value of instruments for pension <strong>and</strong> other benefit plans that have been<br />
classified as Level 3 for the years ended December 31, <strong>2010</strong> <strong>and</strong> 2009:<br />
Absolute<br />
Return<br />
Corporate Fixed<br />
Income<br />
Other Fixed<br />
Income<br />
(in millions)<br />
Total<br />
Pension Benefits:<br />
Balance as of December 31, 2009 $ 340 $ 531 $ 190 $ 1,061<br />
Actual return on plan assets:<br />
Relating to assets still held at the<br />
reporting date 44 52 5 101<br />
<strong>FERC</strong> FORM NO. 1 (ED. 12-88) Page 123.45
Name of Respondent<br />
PACIFIC GAS AND ELECTRIC COMPANY<br />
This Report is:<br />
(1) X An Original<br />
(2) A Resubmission<br />
Date of Report<br />
(Mo, Da, Yr)<br />
04/08/2011<br />
Year/Period of Report<br />
<strong>2010</strong>/Q4<br />
NOTES TO FINANCIAL STATEMENTS (Continued)<br />
Relating to assets sold during the<br />
period 5 5 5 15<br />
Purchases, sales, <strong>and</strong> settlements 105 (39) (80) (14)<br />
Transfers into (out of) Level 3 - - - -<br />
Balance as of December 31, <strong>2010</strong> $ 494 $ 549 $ 120 $ 1,163<br />
Other Benefits:<br />
Balance as of December 31, 2009 $ 32 $ 124 $ 17 $ 173<br />
Actual return on plan assets:<br />
Relating to assets still held at the<br />
reporting date 4 15 - 19<br />
Relating to assets sold during the<br />
period 1 (2) - (1)<br />
Purchases, sales, <strong>and</strong> settlements 10 (8) (7) (5)<br />
Transfers into (out of) Level 3 - - - -<br />
Balance as of December 31, <strong>2010</strong> $ 47 $ 129 $ 10 $ 186<br />
Absolute<br />
Return<br />
Corporate Fixed<br />
Income<br />
Other Fixed<br />
Income<br />
(in millions)<br />
Total<br />
Pension Benefits:<br />
Balance as of December 31, 2008 $ 263 $ 457 $ 291 $ 1,011<br />
Actual return on plan assets:<br />
Relating to assets still held at the<br />
reporting date 15 82 14 111<br />
Relating to assets sold during the<br />
period 4 4 12 20<br />
Purchases, sales, <strong>and</strong> settlements 58 (11) (127) (80)<br />
Transfers into (out of) Level 3 - (1) - (1)<br />
Balance as of December 31, 2009 $ 340 $ 531 $ 190 $ 1,061<br />
Other Benefits:<br />
Balance as of December 31, 2008 $ 25 $ 116 $ 25 $ 166<br />
Actual return on plan assets:<br />
Relating to assets still held at the<br />
reporting date 2 15 1 18<br />
Relating to assets sold during the<br />
period - 1 1 2<br />
Purchases, sales, <strong>and</strong> settlements 5 (8) (10) (13)<br />
Transfers into (out of) Level 3 - - - -<br />
Balance as of December 31, 2009 $ 32 $ 124 $ 17 $ 173<br />
Cash Flow Information<br />
Employer Contributions<br />
PG&E Corporation <strong>and</strong> the Utility contributed $162 million to the pension benefit plans <strong>and</strong> $94 million to the other benefit<br />
plans in <strong>2010</strong>. These contributions are consistent with PG&E Corporation’s <strong>and</strong> the Utility’s funding policy, which is to contribute<br />
amounts that are tax-deductible <strong>and</strong> consistent with applicable regulatory decisions <strong>and</strong> federal minimum funding requirements. None<br />
of these pension or other benefits were subject to a minimum funding requirement requiring a cash contribution in <strong>2010</strong>. The Utility’s<br />
pension benefits met all the funding requirements under ERISA. PG&E Corporation <strong>and</strong> the Utility expect to make total contributions<br />
of approximately $245 million <strong>and</strong> $58 million to the pension plan <strong>and</strong> other postretirement benefit plans, respectively, for 2011.<br />
Benefits Payments<br />
<strong>FERC</strong> FORM NO. 1 (ED. 12-88) Page 123.46
Name of Respondent<br />
PACIFIC GAS AND ELECTRIC COMPANY<br />
This Report is:<br />
(1) X An Original<br />
(2) A Resubmission<br />
Date of Report<br />
(Mo, Da, Yr)<br />
04/08/2011<br />
Year/Period of Report<br />
<strong>2010</strong>/Q4<br />
NOTES TO FINANCIAL STATEMENTS (Continued)<br />
As of December 31, <strong>2010</strong>, the estimated benefits expected to be paid in each of the next five fiscal years, <strong>and</strong> in aggregate for<br />
the five fiscal years thereafter for PG&E Corporation, are as follows:<br />
Pension<br />
Other<br />
(in millions)<br />
2011 $ 509 $ 114<br />
2012 547 117<br />
2013 586 122<br />
2014 624 128<br />
2015 663 133<br />
2016–2020 3,869 725<br />
There were no material differences between the estimated benefits expected to be paid for PG&E Corporation <strong>and</strong> the Utility<br />
for the years presented above.<br />
Defined Contribution Benefit Plans<br />
PG&E Corporation sponsors employee retirement savings plans, including a 401(k) defined contribution savings plan. These<br />
plans are qualified under applicable sections of the Code <strong>and</strong> provide for tax-deferred salary deductions, after-tax employee<br />
contributions, <strong>and</strong> employer contributions. Employer contribution expense reflected in PG&E Corporation’s Consolidated Statements<br />
of Income was as follows:<br />
(in millions)<br />
Year ended December 31,<br />
<strong>2010</strong> $ 56<br />
2009 52<br />
2008 53<br />
There were no material differences between the employer contribution expense for PG&E Corporation <strong>and</strong> the Utility for the<br />
years presented above.<br />
NOTE 13: RESOLUTION OF REMAINING CHAPTER 11 DISPUTED CLAIMS<br />
Various electricity suppliers filed claims in the Utility’s proceeding under Chapter 11 seeking payment for energy supplied to<br />
the Utility’s customers through the wholesale electricity markets operated by the CAISO <strong>and</strong> the California Power Exchange (“PX”)<br />
between May 2000 <strong>and</strong> June 2001. These claims, which the Utility disputes, are being addressed in various <strong>FERC</strong> <strong>and</strong> judicial<br />
proceedings in which the State of California, the Utility, <strong>and</strong> other electricity purchasers are seeking refunds from electricity suppliers,<br />
including municipal <strong>and</strong> governmental entities, for overcharges incurred in the CAISO <strong>and</strong> the PX wholesale electricity markets<br />
between May 2000 <strong>and</strong> June 2001. At December 31, <strong>2010</strong> <strong>and</strong> December 31, 2009, the Utility held $512 million <strong>and</strong> $515 million in<br />
escrow, respectively, including interest earned, for payment of the remaining net disputed claims. These amounts are included within<br />
restricted cash on the Consolidated Balance Sheets.<br />
While the <strong>FERC</strong> <strong>and</strong> judicial proceedings have been pending, the Utility entered into a number of settlements with various<br />
electricity suppliers to resolve some of these disputed claims <strong>and</strong> to resolve the Utility’s refund claims against these electricity<br />
suppliers. These settlement agreements provide that the amounts payable by the parties are, in some instances, subject to adjustment<br />
based on the outcome of the various refund offset <strong>and</strong> interest issues being considered by the <strong>FERC</strong>. The proceeds from these<br />
settlements, after deductions for contingencies based on the outcome of the various refund offset <strong>and</strong> interest issues being considered<br />
by the <strong>FERC</strong>, will continue to be refunded to customers in rates. Additional settlement discussions with other electricity suppliers are<br />
ongoing. Any net refunds, claim offsets, or other credits that the Utility receives from energy suppliers through resolution of the<br />
remaining disputed claims, either through settlement or the conclusion of the various <strong>FERC</strong> <strong>and</strong> judicial proceedings, will also be<br />
refunded to customers.<br />
<strong>FERC</strong> FORM NO. 1 (ED. 12-88) Page 123.47
Name of Respondent<br />
PACIFIC GAS AND ELECTRIC COMPANY<br />
This Report is:<br />
(1) X An Original<br />
(2) A Resubmission<br />
Date of Report<br />
(Mo, Da, Yr)<br />
04/08/2011<br />
Year/Period of Report<br />
<strong>2010</strong>/Q4<br />
NOTES TO FINANCIAL STATEMENTS (Continued)<br />
The following table presents the changes in the remaining net disputed claims liability <strong>and</strong> interest accrued from December<br />
31, 2009 to December 31, <strong>2010</strong>:<br />
(in millions)<br />
Balance at December 31, 2009 $ 946<br />
Interest accrued 30<br />
Less: supplier settlements (42)<br />
Balance at December 31, <strong>2010</strong> $ 934<br />
At December 31, <strong>2010</strong>, the Utility’s net disputed claims liability was $934 million, consisting of $745 million of remaining<br />
disputed claims (classified on the Consolidated Balance Sheets within accounts payable – disputed claims <strong>and</strong> customer refunds) <strong>and</strong><br />
interest accrued at the <strong>FERC</strong>-ordered rate of $683 million (classified on the Consolidated Balance Sheets within interest payable)<br />
partially offset by accounts receivable from the CAISO <strong>and</strong> the PX of $494 million (classified on the Consolidated Balance Sheets<br />
within accounts receivable – other).<br />
Interest accrues on the net liability for disputed claims at the <strong>FERC</strong>-ordered rate, which is higher than the rate earned by the<br />
Utility on the escrow balance. Although the Utility has been collecting the difference between the accrued interest <strong>and</strong> the earned<br />
interest from customers, this amount is not held in escrow. If the amount of interest accrued at the <strong>FERC</strong>-ordered rate is greater than<br />
the amount of interest ultimately determined to be owed with respect to disputed claims, the Utility would refund to customers any<br />
excess net interest collected from customers. The amount of any interest that the Utility may be required to pay will depend on the<br />
final amounts to be paid by the Utility with respect to the disputed claims <strong>and</strong> when such interest is paid.<br />
PG&E Corporation <strong>and</strong> the Utility are unable to predict when the <strong>FERC</strong> or judicial proceedings that are still pending will be<br />
resolved, <strong>and</strong> the amount of any potential refunds that the Utility may receive or the amount of disputed claims, including interest that<br />
the Utility will be required to pay.<br />
NOTE 14: RELATED PARTY AGREEMENTS AND TRANSACTIONS<br />
The Utility <strong>and</strong> other subsidiaries provide <strong>and</strong> receive various services to <strong>and</strong> from their parent, PG&E Corporation, <strong>and</strong><br />
among themselves. The Utility <strong>and</strong> PG&E Corporation exchange administrative <strong>and</strong> professional services in support of operations.<br />
Services provided directly to PG&E Corporation by the Utility are priced at the higher of fully loaded cost (i.e., direct cost of good or<br />
service <strong>and</strong> allocation of overhead costs) or fair market value, depending on the nature of the services. Services provided directly to<br />
the Utility by PG&E Corporation are generally priced at the lower of fully loaded cost or fair market value, depending on the nature<br />
<strong>and</strong> value of the services. PG&E Corporation also allocates various corporate administrative <strong>and</strong> general costs to the Utility <strong>and</strong> other<br />
subsidiaries using agreed-upon allocation factors, including the number of employees, operating <strong>and</strong> maintenance expenses, total<br />
assets, <strong>and</strong> other cost allocation methodologies. Management believes that the methods used to allocate expenses are reasonable <strong>and</strong><br />
meet the reporting <strong>and</strong> accounting requirements of its regulatory agencies.<br />
The Utility’s significant related party transactions were as follows:<br />
Year Ended December 31,<br />
<strong>2010</strong> 2009 2008<br />
(in millions)<br />
Utility revenues from:<br />
Administrative services provided to PG&E Corporation $ 7 $ 5 $ 4<br />
Utility expenses from:<br />
Administrative services received from PG&E<br />
Corporation $ 55 $ 62 $ 122<br />
Utility employee benefit due to PG&E Corporation 27 3 2<br />
<strong>FERC</strong> FORM NO. 1 (ED. 12-88) Page 123.48
Name of Respondent<br />
PACIFIC GAS AND ELECTRIC COMPANY<br />
This Report is:<br />
(1) X An Original<br />
(2) A Resubmission<br />
Date of Report<br />
(Mo, Da, Yr)<br />
04/08/2011<br />
Year/Period of Report<br />
<strong>2010</strong>/Q4<br />
NOTES TO FINANCIAL STATEMENTS (Continued)<br />
At December 31, <strong>2010</strong> <strong>and</strong> December 31, 2009, the Utility had a receivable of $89 million <strong>and</strong> $26 million, respectively,<br />
from PG&E Corporation included in accounts receivable – other <strong>and</strong> other noncurrent assets – other on the Utility’s Consolidated<br />
Balance Sheets, <strong>and</strong> a payable of $16 million, respectively, to PG&E Corporation included in accounts payable – other on the Utility’s<br />
Consolidated Balance Sheets.<br />
NOTE 15: COMMITMENTS AND CONTINGENCIES<br />
PG&E Corporation <strong>and</strong> the Utility have substantial financial commitments in connection with agreements entered into to<br />
support the Utility’s operating activities. PG&E Corporation <strong>and</strong> the Utility also have significant contingencies arising from their<br />
operations, including contingencies related to guarantees, regulatory proceedings, nuclear operations, environmental compliance <strong>and</strong><br />
remediation, tax matters, <strong>and</strong> legal matters.<br />
Commitments<br />
Utility<br />
Third-Party Power Purchase Agreements<br />
As part of the ordinary course of business, the Utility enters into various agreements to purchase power <strong>and</strong> electric capacity.<br />
The price of purchased power may be fixed or variable. Variable pricing is generally based on the current market price of either gas or<br />
electricity at the date of purchase.<br />
The table below shows the costs incurred for each type of third-party power purchase agreement at December 31, <strong>2010</strong>:<br />
Payments<br />
(in millions) <strong>2010</strong> 2009 2008<br />
Qualifying facilities(1) (2) $ 1,164 $ 1,210 $ 1,724<br />
Renewable energy<br />
contracts(1) 573 362 302<br />
Other power purchase<br />
agreements(1) 598 643 2,036<br />
Irrigation district <strong>and</strong><br />
water agencies(1) 59 58 69<br />
(1) The amounts above do not include payments related to DWR purchases<br />
for the benefit of the Utility’s customers, as the Utility only acts as an agent for<br />
the DWR.<br />
(2) Payments include $321, $344, <strong>and</strong> $412 attributable to renewable energy<br />
contracts with qualifying facilities at December 31, <strong>2010</strong>, 2009 <strong>and</strong> 2008,<br />
respectively.<br />
Qualifying Facility Power Purchase Agreements – Under the Public Utility Regulatory Policies Act of 1978 (“PURPA”),<br />
electric utilities are required to purchase energy <strong>and</strong> capacity from independent power producers with generation facilities that meet the<br />
statutory definition of a qualifying facility (“QF”). QFs include small power production facilities whose primary energy sources are<br />
co-generation facilities that produce combined heat <strong>and</strong> power (“CHP”) <strong>and</strong> renewable generation facilities. To implement the<br />
purchase requirements of PURPA, the CPUC required California investor-owned electric utilities to enter into long-term power<br />
purchase agreements with QFs <strong>and</strong> approved the applicable terms <strong>and</strong> conditions, prices, <strong>and</strong> eligibility requirements. These<br />
agreements require the Utility to pay for energy <strong>and</strong> capacity. Energy payments are based on the QF’s actual electrical output <strong>and</strong><br />
CPUC-approved energy prices, while capacity payments are based on the QF’s total available capacity <strong>and</strong> contractual capacity<br />
commitment. Capacity payments may be adjusted if the QF exceeds or fails to meet performance requirements specified in the<br />
<strong>FERC</strong> FORM NO. 1 (ED. 12-88) Page 123.49
Name of Respondent<br />
PACIFIC GAS AND ELECTRIC COMPANY<br />
This Report is:<br />
(1) X An Original<br />
(2) A Resubmission<br />
Date of Report<br />
(Mo, Da, Yr)<br />
04/08/2011<br />
Year/Period of Report<br />
<strong>2010</strong>/Q4<br />
NOTES TO FINANCIAL STATEMENTS (Continued)<br />
applicable power purchase agreement.<br />
As of December 31, <strong>2010</strong>, the Utility had agreements with 226 QFs for approximately 3,700 megawatts (“MW”) that are in<br />
operation. Agreements for approximately 3,400 MW expire at various dates between 2011 <strong>and</strong> 2028. QF power purchase agreements<br />
for approximately 300 MW have no specific expiration dates <strong>and</strong> will terminate only when the owner of the QF exercises its<br />
termination option. The Utility also has power purchase agreements with 75 inoperative QFs. The total of approximately 3,700 MW<br />
consists of approximately 2,500 MW from cogeneration projects <strong>and</strong> approximately 1,200 MW from renewable sources. No single QF<br />
accounted for more than 5% of the Utility’s <strong>2010</strong>, 2009, or 2008 electricity sources.<br />
Renewable Energy Power Purchase Agreements – The Utility has entered into various contracts to purchase renewable<br />
energy to help the Utility meet the current renewable portfolio st<strong>and</strong>ard (“RPS”) requirement. In general, renewable contract payments<br />
consist primarily of per megawatt hour (“MWh”) payments <strong>and</strong> either a small or no fixed capacity payment, as opposed to contracts<br />
with non-renewable sources, which generally include both a per MWh payment <strong>and</strong> a fixed capacity payment. As shown in the table<br />
below, the Utility’s commitments for energy payments under these renewable energy agreements are expected to grow significantly,<br />
assuming that the facilities are developed timely. No single supplier accounted for more than 5% of the Utility’s <strong>2010</strong>, 2009, or 2008<br />
electricity sources.<br />
Other Power Purchase Agreements – In accordance with the Utility’s CPUC-approved long-term procurement plans, the<br />
Utility has entered into several power purchase agreements with third parties. The Utility’s obligations under a portion of these<br />
agreements are contingent on the third party’s development of a new generation facility to provide the power to be purchased by the<br />
Utility under the agreements.<br />
Irrigation District <strong>and</strong> Water Agency Power Purchase Agreements – The Utility has contracts with various irrigation districts<br />
<strong>and</strong> water agencies to purchase hydroelectric power. Under these contracts, the Utility must make specified semi-annual minimum<br />
payments based on the irrigation districts’ <strong>and</strong> water agencies’ debt service requirements, whether or not any hydroelectric power is<br />
supplied, <strong>and</strong> variable payments for operation <strong>and</strong> maintenance costs incurred by the suppliers. These contracts expire on various<br />
dates from 2011 to 2031. Irrigation districts <strong>and</strong> water agencies consist of small <strong>and</strong> large hydro plants. No single irrigation district or<br />
water agency accounted for more than 5% of the Utility’s <strong>2010</strong>, 2009, or 2008 electricity sources.<br />
At December 31, <strong>2010</strong>, the undiscounted future expected power purchase agreement payments were as follows:<br />
Renewable<br />
Irrigation District &<br />
Qualifying Facility (Other than QF) Water Agency Other<br />
Operations & Debt Total<br />
(in millions) Energy Capacity Energy Capacity Maintenance Service Energy Capacity Payments<br />
2011 $ 720 $ 366 $ 796 $ 8 $ 59 $ 21 $ 3 $ 691 $ 2,664<br />
2012 545 321 944 9 45 21 3 684 2,572<br />
2013 542 312 1,261 9 28 15 3 822 2,992<br />
2014 548 301 1,647 - 13 12 1 605 3,127<br />
2015 509 259 1,942 - 11 11 - 583 3,315<br />
Thereafter 3,129 1,263 40,882 5 27 16 - 4,227 49,549<br />
Total $ 5,993 $ 2,822 $ 47,472 $ 31 $ 183 $ 96 $ 10 $ 7,612 $64,219<br />
Some of the power purchase agreements that the Utility entered into with independent power producers that are QFs are<br />
treated as capital leases. The following table shows the future fixed capacity payments due under the QF contracts that are treated as<br />
capital leases. (These amounts are also included in the table above.) The fixed capacity payments are discounted to their present value<br />
in the table below using the Utility’s incremental borrowing rate at the inception of the leases. The amount of this discount is shown in<br />
the table below as the amount representing interest.<br />
(in millions)<br />
2011 $ 50<br />
<strong>FERC</strong> FORM NO. 1 (ED. 12-88) Page 123.50
Name of Respondent<br />
PACIFIC GAS AND ELECTRIC COMPANY<br />
This Report is:<br />
(1) X An Original<br />
(2) A Resubmission<br />
Date of Report<br />
(Mo, Da, Yr)<br />
04/08/2011<br />
Year/Period of Report<br />
<strong>2010</strong>/Q4<br />
NOTES TO FINANCIAL STATEMENTS (Continued)<br />
2012 50<br />
2013 50<br />
2014 42<br />
2015 38<br />
Thereafter 124<br />
Total fixed capacity payments 354<br />
Less: amount representing interest 72<br />
Present value of fixed capacity payments $ 282<br />
Minimum lease payments associated with the lease obligation are included in cost of electricity on PG&E Corporation’s <strong>and</strong><br />
the Utility’s Consolidated Statements of Income. The timing of the recognition of the lease expense conforms to the ratemaking<br />
treatment for the Utility’s recovery of the cost of electricity. The QF contracts that are treated as capital leases expire between April<br />
2014 <strong>and</strong> September 2021.<br />
The present value of the fixed capacity payments due under these contracts is recorded on PG&E Corporation’s <strong>and</strong> the<br />
Utility's Consolidated Balance Sheets. At December 31, <strong>2010</strong> <strong>and</strong> December 31, 2009, current liabilities – other included $34 million<br />
<strong>and</strong> $32 million, respectively, <strong>and</strong> noncurrent liabilities – other included $248 million <strong>and</strong> $282 million, respectively. The<br />
corresponding assets at December 31, <strong>2010</strong> <strong>and</strong> December 31, 2009 of $282 million <strong>and</strong> $314 million including accumulated<br />
amortization of $126 million <strong>and</strong> $94 million, respectively are included in property, plant, <strong>and</strong> equipment on PG&E Corporation’s <strong>and</strong><br />
the Utility’s Consolidated Balance Sheets.<br />
Natural <strong>Gas</strong> Supply, Transportation, <strong>and</strong> Storage Commitments<br />
The Utility purchases natural gas directly from producers <strong>and</strong> marketers in both Canada <strong>and</strong> the United States to serve its core<br />
customers. The contract lengths <strong>and</strong> quantities of the Utility’s portfolio of natural gas procurement contracts can fluctuate based on<br />
market conditions. The Utility also contracts for natural gas transportation from the points at which the Utility takes delivery (typically<br />
in Canada <strong>and</strong> the southwestern United States) to the points at which the Utility’s natural gas transportation system begins. In addition,<br />
the Utility has contracted for gas storage services in northern California in order to better meet core customers’ winter peak loads. At<br />
December 31, <strong>2010</strong>, the Utility’s undiscounted obligations for natural gas purchases, natural gas transportation services, <strong>and</strong> natural<br />
gas storage were as follows:<br />
(in millions)<br />
2011 $ 710<br />
2012 273<br />
2013 191<br />
2014 170<br />
2015 161<br />
Thereafter 1,128<br />
Total (1) $ 2,633<br />
(1) Amounts above include firm transportation contracts for the Ruby Pipeline (a 1.5 billion cubic<br />
feet per day (“bcf/d”) pipeline which is currently under construction <strong>and</strong> expected to become<br />
operational in the summer of 2011, <strong>and</strong> the Utility has contracted for a capacity of approximately<br />
0.4 bcf/d).<br />
Payments for natural gas purchases, natural gas transportation services, <strong>and</strong> natural gas storage amounted to $1.6 billion in<br />
<strong>2010</strong>, $1.4 billion in 2009, <strong>and</strong> $2.7 billion in 2008.<br />
Nuclear Fuel Agreements<br />
The Utility has entered into several purchase agreements for nuclear fuel. These agreements have terms ranging from 1 to 14<br />
years <strong>and</strong> are intended to ensure long-term fuel supply. The contracts for uranium <strong>and</strong> for conversion <strong>and</strong> enrichment services provide<br />
<strong>FERC</strong> FORM NO. 1 (ED. 12-88) Page 123.51
Name of Respondent<br />
PACIFIC GAS AND ELECTRIC COMPANY<br />
This Report is:<br />
(1) X An Original<br />
(2) A Resubmission<br />
Date of Report<br />
(Mo, Da, Yr)<br />
04/08/2011<br />
Year/Period of Report<br />
<strong>2010</strong>/Q4<br />
NOTES TO FINANCIAL STATEMENTS (Continued)<br />
for 100% coverage of reactor requirements through 2016, while contracts for fuel fabrication services provide for 100% coverage of<br />
reactor requirements through 2017. The Utility relies on a number of international producers of nuclear fuel in order to diversify its<br />
sources <strong>and</strong> provide security of supply. Pricing terms are also diversified, ranging from market-based prices to base prices that are<br />
escalated using published indices. New agreements are primarily based on forward market pricing. Price increases in the uranium <strong>and</strong><br />
enrichment service markets are providing upward pressure on nuclear fuel costs starting in 2011.<br />
At December 31, <strong>2010</strong>, the undiscounted obligations under nuclear fuel agreements were as follows:<br />
(in millions)<br />
2011 $ 84<br />
2012 69<br />
2013 105<br />
2014 132<br />
2015 191<br />
Thereafter 1,057<br />
Total $ 1,638<br />
Payments for nuclear fuel amounted to $144 million in <strong>2010</strong>, $141 million in 2009, <strong>and</strong> $157 million in 2008.<br />
Other Commitments <strong>and</strong> Operating Leases<br />
The Utility has other commitments relating to operating leases. At December 31, <strong>2010</strong>, the future minimum payments related<br />
to other commitments were as follows:<br />
(in millions)<br />
2011 $ 25<br />
2012 22<br />
2013 19<br />
2014 14<br />
2015 11<br />
Thereafter 73<br />
Total $ 164<br />
Payments for other commitments <strong>and</strong> operating leases amounted to $25 million in <strong>2010</strong>, $22 million in 2009, <strong>and</strong> $41 million<br />
in 2008. PG&E Corporation <strong>and</strong> the Utility had operating leases on office facilities expiring at various dates from 2011 to 2020.<br />
Certain leases on office facilities contain escalation clauses requiring annual increases in rent ranging from 1% to 4%. The rentals<br />
payable under these leases may increase by a fixed amount each year, a percentage of a base year, or the consumer price index. Most<br />
leases contain extension options ranging between one <strong>and</strong> five years.<br />
Underground <strong>Electric</strong> Facilities<br />
At December 31, <strong>2010</strong>, the Utility was committed to spending approximately $236 million for the conversion of existing<br />
overhead electric facilities to underground electric facilities. These funds are conditionally committed depending on the timing of the<br />
work, including the schedules of the respective cities, counties, <strong>and</strong> communications utilities involved. The Utility expects to spend<br />
approximately $42 million to $60 million each year in connection with these projects. Consistent with past practice, the Utility expects<br />
that these capital expenditures will be included in rate base as each individual project is completed <strong>and</strong> recoverable in rates charged to<br />
customers.<br />
Contingencies<br />
PG&E Corporation<br />
<strong>FERC</strong> FORM NO. 1 (ED. 12-88) Page 123.52
Name of Respondent<br />
PACIFIC GAS AND ELECTRIC COMPANY<br />
This Report is:<br />
(1) X An Original<br />
(2) A Resubmission<br />
Date of Report<br />
(Mo, Da, Yr)<br />
04/08/2011<br />
Year/Period of Report<br />
<strong>2010</strong>/Q4<br />
NOTES TO FINANCIAL STATEMENTS (Continued)<br />
PG&E Corporation retains a guarantee related to certain obligations of its former subsidiary, NEGT, that were issued to the<br />
purchaser of an NEGT subsidiary company in 2000. PG&E Corporation’s primary remaining exposure relates to any potential<br />
environmental obligations that were known to NEGT at the time of the sale but not disclosed to the purchaser, <strong>and</strong> is limited to $150<br />
million. PG&E Corporation has not received any claims nor does it consider it probable that any claims will be made under the<br />
guarantee. PG&E Corporation believes that its potential exposure under this guarantee would not have a material impact on its<br />
financial condition or results of operations.<br />
Utility<br />
Energy Efficiency Programs <strong>and</strong> Incentive Ratemaking<br />
The CPUC has established a ratemaking mechanism to provide incentives to the California investor-owned utilities to meet<br />
the CPUC’s energy savings goals through implementation of the utilities’ 2006 through 2008 energy efficiency programs. On<br />
December 16, <strong>2010</strong>, the CPUC awarded the Utility a final true-up payment award of $29.1 million for the 2006 through 2008 energy<br />
efficiency program cycle. Including this award, the Utility has earned incentive revenues totaling $104 million through December 31,<br />
<strong>2010</strong> based on the energy savings achieved through implementation of the Utility’s energy efficiency programs during the 2006<br />
through 2008 program cycle. The CPUC has directed the utilities to file their applications for incentive awards for 2009 energy<br />
efficiency program performance by June 30, 2011 to enable the CPUC to issue a final decision by the end of 2011.<br />
On November 15, <strong>2010</strong>, a proposed decision was issued that if, adopted by the CPUC, would modify the incentive<br />
mechanism that would apply to the <strong>2010</strong> through 2012 program cycle. Among other changes, the proposed modification would limit<br />
the total amount of the incentive award or penalty that could be awarded to, or imposed on, all the investor-owned utilities to $189<br />
million. If the proposed decision is adopted, the Utility’s opportunity to earn incentive revenues would be limited compared to the<br />
mechanism that was in place for the 2006-2008 program cycle.<br />
Spent Nuclear Fuel Storage Proceedings<br />
As part of the Nuclear Waste Policy Act of 1982, Congress authorized the U.S. Department of Energy (“DOE”) <strong>and</strong> electric<br />
utilities with commercial nuclear power plants to enter into contracts under which the DOE would be required to dispose of the<br />
utilities’ spent nuclear fuel <strong>and</strong> high-level radioactive waste no later than January 31, 1998, in exchange for fees paid by the utilities.<br />
In 1983, the DOE entered into a contract with the Utility to dispose of nuclear waste from the Utility’s two nuclear generating units at<br />
Diablo Canyon Power Plant (“Diablo Canyon”) <strong>and</strong> its retired nuclear facility at Humboldt Bay.<br />
Because the DOE failed to develop a permanent storage site, the Utility obtained a permit from the NRC to build an on-site<br />
dry cask storage facility to store spent fuel at Diablo Canyon through at least 2024. The construction of the dry cask storage facility is<br />
complete. During 2009, the Utility moved all the spent nuclear fuel that was scheduled to be moved into dry cask storage. An appeal<br />
of the NRC’s issuance of the permit is still pending in the U.S. Court of Appeals for the Ninth Circuit. The appellants claim that the<br />
NRC failed to adequately consider environmental impacts of a potential terrorist attack at Diablo Canyon. The Ninth Circuit heard<br />
oral arguments on November 4, <strong>2010</strong>. The Utility expects a decision from the Ninth Circuit in 2011.<br />
As a result of the DOE’s failure to build a repository for nuclear waste, the Utility <strong>and</strong> other nuclear power plant owners sued<br />
the DOE to recover costs that they incurred to build on-site spent nuclear fuel storage facilities. The Utility sought to recover $92<br />
million of costs that it incurred through 2004. After several years of litigation, on March 30, <strong>2010</strong>, the U.S. Court of Federal Claims<br />
awarded the Utility $89 million. The DOE filed an appeal of this decision on May 28, <strong>2010</strong>. On August 3, <strong>2010</strong>, the Utility filed two<br />
complaints against the DOE in the U.S. Court of Federal Claims seeking to recover all costs incurred since 2005 to build on-site<br />
storage facilities. The Utility estimates that it has incurred costs of at least $205 million since 2005. Amounts recovered from the<br />
DOE will be credited to customers.<br />
Nuclear Insurance<br />
The Utility has several types of nuclear insurance for the two nuclear operating units at Diablo Canyon <strong>and</strong> for its retired<br />
<strong>FERC</strong> FORM NO. 1 (ED. 12-88) Page 123.53
Name of Respondent<br />
PACIFIC GAS AND ELECTRIC COMPANY<br />
This Report is:<br />
(1) X An Original<br />
(2) A Resubmission<br />
Date of Report<br />
(Mo, Da, Yr)<br />
04/08/2011<br />
Year/Period of Report<br />
<strong>2010</strong>/Q4<br />
NOTES TO FINANCIAL STATEMENTS (Continued)<br />
nuclear generation facility at Humboldt Bay Unit 3. The Utility has insurance coverage for property damages <strong>and</strong> business interruption<br />
losses as a member of Nuclear <strong>Electric</strong> Insurance Limited (“NEIL”). NEIL is a mutual insurer owned by utilities with nuclear<br />
facilities. NEIL provides property damage <strong>and</strong> business interruption coverage of up to $3.2 billion per incident for Diablo Canyon. In<br />
addition, NEIL provides $131 million of property damage insurance for Humboldt Bay Unit 3. Under this insurance, if any nuclear<br />
generating facility insured by NEIL suffers a catastrophic loss causing a prolonged outage, the Utility may be required to pay an<br />
additional premium of up to $42 million per one-year policy term.<br />
NEIL also provides coverage for damages caused by acts of terrorism at nuclear power plants. If one or more acts of<br />
terrorism cause damages covered under any of the nuclear insurance policies issued by NEIL to any NEIL member, the maximum<br />
recovery under all those nuclear insurance policies may not exceed NEIL’s policy limit of $3.2 billion within a 12-month period plus<br />
any additional amounts recovered by NEIL for these losses from reinsurance. Certain acts of terrorism may be “certified” by the<br />
Secretary of the Treasury. For damages caused by certified acts of terrorism, NEIL can obtain compensation from the federal<br />
government <strong>and</strong> will provide up to its full policy limit of $3.2 billion for each insured loss caused by these certified acts of terrorism.<br />
The $3.2 billion amount would not be shared as is described above for damages caused by acts of terrorism that have not been<br />
certified.<br />
Under the Price-Anderson Act, public liability claims that arise from nuclear incidents that occur at Diablo Canyon, <strong>and</strong> that<br />
occur during the transportation of material to <strong>and</strong> from Diablo Canyon are limited to $12.6 billion. As required by the Price-Anderson<br />
Act, the Utility purchased the maximum available public liability insurance of $375 million for Diablo Canyon. The balance of the<br />
$12.6 billion of liability protection is provided under a loss-sharing program among utilities owning nuclear reactors. The Utility may<br />
be assessed up to $235 million per nuclear incident under this program, with payments in each year limited to a maximum of $35<br />
million per incident. Both the maximum assessment <strong>and</strong> the maximum yearly assessment are adjusted for inflation at least every five<br />
years. The next scheduled adjustment is due on or before October 29, 2013.<br />
The Price-Anderson Act does not apply to public liability claims that arise from nuclear incidents that occur during shipping<br />
of nuclear material from the nuclear fuel enricher to a fuel fabricator or that occur at the fuel fabricator’s facility. Such claims are<br />
covered by nuclear liability policies purchased by the enricher <strong>and</strong> the fuel fabricator as well as by separate supplier’s <strong>and</strong> transporter’s<br />
(“S&T”) insurance policies. The Utility has an S&T policy that provides coverage for claims arising from some of these incidents up<br />
to a maximum of $375 million per incident. The Utility could incur losses that are either not covered by insurance or exceed the<br />
amount of insurance available.<br />
In addition, the Utility has $53 million of liability insurance for Humboldt Bay Unit 3 <strong>and</strong> has a $500 million indemnification<br />
from the NRC for public liability arising from nuclear incidents, covering liabilities in excess of the $53 million of liability insurance.<br />
Legal Matters<br />
PG&E Corporation <strong>and</strong> the Utility are subject to various laws <strong>and</strong> regulations <strong>and</strong>, in the normal course of business, PG&E<br />
Corporation <strong>and</strong> the Utility are named as parties in a number of claims <strong>and</strong> lawsuits. In addition, the Utility can incur penalties for<br />
failure to comply with federal, state, or local laws <strong>and</strong> regulations.<br />
PG&E Corporation <strong>and</strong> the Utility record a provision for a liability when it is both probable that a liability has been incurred<br />
<strong>and</strong> the amount of the loss can be reasonably estimated. PG&E Corporation <strong>and</strong> the Utility evaluate the range of reasonably estimated<br />
costs <strong>and</strong> record a liability based on the lower end of the range, unless an amount within the range is a better estimate than any other<br />
amount. These accruals, <strong>and</strong> the estimates of any additional reasonably possible losses, are reviewed quarterly <strong>and</strong> are adjusted to<br />
reflect the impacts of negotiations, discovery, settlements <strong>and</strong> payments, rulings, advice of legal counsel, <strong>and</strong> other information <strong>and</strong><br />
events pertaining to a particular matter. In assessing such contingencies, PG&E Corporation’s <strong>and</strong> the Utility’s policy is to exclude<br />
anticipated legal costs.<br />
The accrued liability for legal matters (other than third-party liability claims related to the San Bruno accident as discussed<br />
below) totaled $55 million at December 31, <strong>2010</strong> <strong>and</strong> $57 million at December 31, 2009 <strong>and</strong> is included in PG&E Corporation’s <strong>and</strong><br />
the Utility’s current liabilities – other in the Consolidated Balance Sheets. Except as discussed below, PG&E Corporation <strong>and</strong> the<br />
Utility do not believe that losses associated with legal matters would have a material adverse impact on their financial condition,<br />
<strong>FERC</strong> FORM NO. 1 (ED. 12-88) Page 123.54
Name of Respondent<br />
PACIFIC GAS AND ELECTRIC COMPANY<br />
This Report is:<br />
(1) X An Original<br />
(2) A Resubmission<br />
Date of Report<br />
(Mo, Da, Yr)<br />
04/08/2011<br />
Year/Period of Report<br />
<strong>2010</strong>/Q4<br />
NOTES TO FINANCIAL STATEMENTS (Continued)<br />
results of operations, or cash flows after consideration of the accrued liability at December 31, <strong>2010</strong>.<br />
Explosion <strong>and</strong> Fires in San Bruno, California<br />
On September 9, <strong>2010</strong>, an underground 30-inch natural gas transmission pipeline (line 132) owned <strong>and</strong> operated by the Utility<br />
ruptured in a residential area located in the City of San Bruno, California (“San Bruno accident”). The ensuing explosion <strong>and</strong> fire<br />
resulted in the deaths of eight people, injuries to numerous individuals, <strong>and</strong> extensive property damage. Both the NTSB <strong>and</strong> the CPUC<br />
have begun investigations of the San Bruno accident but they have not yet determined the cause of the pipeline rupture. The NTSB has<br />
issued several public statements regarding the investigation <strong>and</strong> a metallurgy report, all of which are available on the NTSB’s website.<br />
The NTSB will hold fact-finding hearings in Washington, D.C. on March 1, 2011 through March 3, 2011 <strong>and</strong> has stated that it intends<br />
to release a total of six factual reports about the San Bruno accident before the hearings begin based on the following topics:<br />
metallurgy, operations, human performance, survival factors, fire scene, <strong>and</strong> meteorology. It is expected that these reports will be<br />
made publicly available on the NTSB’s website as each report is released.<br />
As part of the CPUC’s investigation, the CPUC’s staff will examine the safety of the Utility’s natural gas transmission<br />
pipelines in its northern <strong>and</strong> central California service territory. The CPUC staff reviewed information about the Utility’s planned <strong>and</strong><br />
unplanned pressurization events where the pressure has risen above the maximum available operating pressure (“MAOP”) in several of<br />
the Utility’s gas transmission lines. On February 2, 2011, the CPUC ordered the Utility to reduce operating pressure twenty percent<br />
below the MAOP on certain of its gas transmission pipelines, <strong>and</strong> also ordered the Utility to reduce operating pressure on other<br />
transmission lines that meet certain criteria. The Utility has complied with the CPUC’s order <strong>and</strong> also has reported to the CPUC that<br />
the Utility has identified a number of instances where it had either exceeded MAOP by more than ten percent or had raised the pressure<br />
to maintain operational flexibility, including several instances in which the highest pressure reading exceeded MAOP by a few pounds,<br />
but not more than ten percent. The CPUC also has appointed an independent review panel to gather <strong>and</strong> review facts, make a technical<br />
assessment of the San Bruno accident <strong>and</strong> its root cause, <strong>and</strong> make recommendations for action by the CPUC to ensure such an<br />
accident is not repeated. The report of the independent review panel is expected in the second quarter of 2011.<br />
Several parties have requested that the CPUC institute a formal CPUC investigation into the San Bruno accident. The Utility<br />
has filed a response stating that it welcomes the CPUC’s investigation. The CPUC may consider this request at its meeting to be held<br />
on February 24, 2011. If the CPUC institutes a formal investigation, the CPUC may impose penalties if it determines that the Utility<br />
violated any laws, rules, regulations or orders pertaining to the operations <strong>and</strong> maintenance of its natural gas system. The CPUC is<br />
authorized to assess penalties of up to $20,000, per day, per violation. PG&E Corporation <strong>and</strong> the Utility anticipate that the CPUC<br />
will institute one or more formal investigations regarding these matters. PG&E Corporation <strong>and</strong> the Utility are unable to estimate a<br />
potential loss or range of loss associated with penalties that may be imposed by the CPUC in connection with the San Bruno accident.<br />
In addition to these investigations, as of February 8, 2011, 59 lawsuits on behalf of approximately 177 plaintiffs, including<br />
two class action lawsuits, have been filed against PG&E Corporation <strong>and</strong> the Utility in San Mateo County Superior Courts. In<br />
addition, five lawsuits on behalf of 11 plaintiffs have been filed by residents of San Bruno in the San Francisco County Superior Court<br />
against PG&E Corporation <strong>and</strong> the Utility. These lawsuits seek compensation for personal injury <strong>and</strong> property damage <strong>and</strong> seek other<br />
relief. The class action lawsuits allege causes of action for strict liability, negligence, public nuisance, private nuisance, <strong>and</strong><br />
declaratory relief. Several other residents also have submitted damage claims to the Utility. The Utility has filed a petition on behalf<br />
of PG&E Corporation <strong>and</strong> the Utility to coordinate these lawsuits in San Mateo County Superior Court. In its statement in support of<br />
coordination, the Utility has stated that it is prepared to enter into early mediation in an effort to resolve claims with those plaintiffs<br />
willing to do so. A hearing is scheduled for February 24, 2011.<br />
The Utility recorded a provision of $220 million in <strong>2010</strong> for estimated third-party claims related to the San Bruno accident,<br />
including personal injury <strong>and</strong> property damage claims, damage to infrastructure, <strong>and</strong> other damage claims. The Utility currently<br />
estimates that it may incur as much as $400 million for third-party claims. This estimate may change depending on the final<br />
determination of the causes for the pipeline rupture <strong>and</strong> responsibility for the personal injuries <strong>and</strong> property damages <strong>and</strong> the number<br />
<strong>and</strong> nature of third-party claims. As more information becomes known, including information resulting from the NTSB <strong>and</strong> CPUC<br />
investigations, management’s estimates <strong>and</strong> assumptions regarding the amount of third-party liability incurred in connection with the<br />
San Bruno accident may change. It is possible that a change in estimate could have a material adverse impact on PG&E Corporation’s<br />
<strong>and</strong> the Utility’s financial condition, results of operations, or cash flows.<br />
<strong>FERC</strong> FORM NO. 1 (ED. 12-88) Page 123.55
Name of Respondent<br />
PACIFIC GAS AND ELECTRIC COMPANY<br />
This Report is:<br />
(1) X An Original<br />
(2) A Resubmission<br />
Date of Report<br />
(Mo, Da, Yr)<br />
04/08/2011<br />
Year/Period of Report<br />
<strong>2010</strong>/Q4<br />
NOTES TO FINANCIAL STATEMENTS (Continued)<br />
The Utility maintains liability insurance for damages in the approximate amount of $992 million in excess of a $10 million<br />
deductible. Although PG&E Corporation <strong>and</strong> the Utility currently consider it likely that most of the costs the Utility incurs for<br />
third-party claims relating to the San Bruno accident will ultimately be recovered through this insurance, no amounts for insurance<br />
recoveries have been recorded as of December 31, <strong>2010</strong>. PG&E Corporation <strong>and</strong> the Utility are unable to predict the amount <strong>and</strong><br />
timing of insurance recoveries.<br />
CPUC Investigation of the December 24, 2008 Natural <strong>Gas</strong> Explosion in Rancho Cordova, California<br />
On November 19, <strong>2010</strong>, the CPUC began an investigation of the natural gas explosion <strong>and</strong> fire that occurred on December 24,<br />
2008 in a house in Rancho Cordova, California (“Rancho Cordova accident”). The explosion resulted in one death, injuries to several<br />
people, <strong>and</strong> property damage. The CPUC’s Consumer Protection <strong>and</strong> Safety Division (“CPSD”) <strong>and</strong> the NTSB investigated the<br />
accident. The NTSB issued its investigative report in May <strong>2010</strong>, <strong>and</strong> the CPSD submitted its report to the CPUC in November <strong>2010</strong>.<br />
The NTSB determined that the probable cause of the release, ignition, <strong>and</strong> explosion of natural gas was use of a section of unmarked<br />
<strong>and</strong> out-of-specification polyethylene pipe with inadequate wall thickness that allowed gas to leak from the mechanical coupling that<br />
had been installed on September 21, 2006. The NTSB stated that the delayed response by the Utility’s employees was a contributing<br />
factor. Based on the CPSD’s <strong>and</strong> the NTSB’s investigative findings, the CPSD requested the CPUC to open a formal investigation <strong>and</strong><br />
recommended that the CPUC impose unspecified fines <strong>and</strong> penalties on the Utility.<br />
In its order instituting the investigation, the CPUC stated that it will determine whether the Utility violated any law,<br />
regulation, CPUC general orders or decisions, or other rules or requirement applicable to the Utility’s natural gas service <strong>and</strong> facilities,<br />
<strong>and</strong>/or engaged in unreasonable <strong>and</strong>/or imprudent practices in connection with the Rancho Cordova accident. The CPUC also stated<br />
that it intends to ascertain whether any management policies <strong>and</strong> practices contributed to violations of law <strong>and</strong> the Rancho Cordova<br />
accident.<br />
The CPUC ordered the Utility to provide extensive information, from as far back as January 1, 2000, about its practices <strong>and</strong><br />
procedures at issue. The Utility’s report, due on February 17, 2011, agrees with the NTSB’s conclusions about the probable cause of<br />
the accident <strong>and</strong> explains what process improvements the Utility has made to prevent a similar accident in the future. The CPUC has<br />
scheduled a pre-hearing conference for March 1, 2011 to establish a schedule for the proceeding, including the date of an evidentiary<br />
hearing. PG&E Corporation <strong>and</strong> the Utility believe that the CPUC is likely to impose penalties on the Utility in connection with the<br />
Rancho Cordova accident.<br />
PG&E Corporation <strong>and</strong> the Utility are unable to predict the ultimate outcome of the investigations of the San Bruno <strong>and</strong><br />
Rancho Cordova accidents. The CPUC is authorized to impose penalties of up to $20,000 per day, per violation. If the CPUC<br />
imposed a material amount of penalties on the Utility, there would be a material adverse impact on PG&E Corporation’s <strong>and</strong> the<br />
Utility’s financial condition, results of operations, <strong>and</strong> cash flows.<br />
Environmental Matters<br />
The Utility has been, <strong>and</strong> may be required to pay for environmental remediation at sites where it has been, or may be, a<br />
potentially responsible party under federal <strong>and</strong> state environmental laws. These sites include former manufactured gas plant (“MGP”)<br />
sites, power plant sites, gas gathering sites, sites where natural gas compressor stations are located, <strong>and</strong> sites used by the Utility for the<br />
storage, recycling, or disposal of potentially hazardous substances. Under federal <strong>and</strong> California laws, the Utility may be responsible<br />
for remediation of hazardous substances even if it did not deposit those substances on the site.<br />
Given the complexities of the legal <strong>and</strong> regulatory environment <strong>and</strong> the inherent uncertainties involved in the early stages of a<br />
remediation project, the process for estimating remediation liabilities is subjective <strong>and</strong> requires significant judgment. The Utility<br />
records an environmental remediation liability when site assessments indicate that remediation is probable <strong>and</strong> it can reasonably<br />
estimate the loss within a range of possible amounts.<br />
The Utility records an environmental remediation liability based on the lower end of the range of estimated costs, unless an<br />
amount within the range is a better estimate than any other amount. Amounts recorded are not discounted to their present value.<br />
<strong>FERC</strong> FORM NO. 1 (ED. 12-88) Page 123.56
Name of Respondent<br />
PACIFIC GAS AND ELECTRIC COMPANY<br />
This Report is:<br />
(1) X An Original<br />
(2) A Resubmission<br />
Date of Report<br />
(Mo, Da, Yr)<br />
04/08/2011<br />
Year/Period of Report<br />
<strong>2010</strong>/Q4<br />
NOTES TO FINANCIAL STATEMENTS (Continued)<br />
The Utility had an undiscounted <strong>and</strong> gross environmental remediation liability of $612 million at December 31, <strong>2010</strong> <strong>and</strong><br />
$586 million at December 31, 2009. The following table presents the changes in the environmental remediation liability from<br />
December 31, 2009:<br />
(in millions)<br />
Balance at December 31, 2009 $ 586<br />
Additional remediation costs accrued:<br />
Transfer to regulatory account for recovery 112<br />
Amounts not recoverable from customers 29<br />
Less: Payments (115)<br />
Balance at December 31, <strong>2010</strong> $ 612<br />
The $612 million accrued at December 31, <strong>2010</strong> consists of the following:<br />
• $45 million for remediation at the Utility’s natural gas compressor site located near Hinkley, California;<br />
• $171 for remediation at the Utility’s natural gas compressor site located on the California border, near Topock, Arizona;<br />
• $85 million related to remediation at divested generation facilities;<br />
• $110 million related to remediation costs for the Utility’s generation <strong>and</strong> other facilities <strong>and</strong> for third-party disposal sites;<br />
• $139 million related to investigation <strong>and</strong>/or remediation costs at former MGP sites owned by the Utility or third parties<br />
(including those sites that are the subject of remediation orders by environmental agencies or claims by the current owners of<br />
the former MGP sites); <strong>and</strong><br />
• $62 million related to remediation costs for fossil decommissioning sites.<br />
The Utility has a program, in cooperation with the California Environmental Protection Agency, to evaluate <strong>and</strong> take<br />
appropriate action to mitigate any potential environmental concerns posed by certain former MGPs located throughout the Utility’s<br />
service territory. Of the forty one MGP sites owned or operated by the Utility, forty have been or are in the process of being<br />
investigated <strong>and</strong>/or remediated, <strong>and</strong> the Utility is developing a strategy to investigate <strong>and</strong> remediate the last site.<br />
Of the $612 million environmental remediation liability, the Utility expects to recover $316 million through the<br />
CPUC-approved ratemaking mechanism that authorizes the Utility to recover 90% of hazardous waste remediation costs without a<br />
reasonableness review (excluding any remediation associated with the Hinkley natural gas compressor site) <strong>and</strong> $131 million through<br />
the ratemaking mechanism that authorizes the Utility to recover 100% of remediation costs for decommissioning fossil-fueled sites <strong>and</strong><br />
certain of the Utility’s transmission stations (excluding any remediation associated with divested generation facilities). The Utility also<br />
recovers its costs from insurance carriers <strong>and</strong> from other third parties whenever possible. Any amounts collected in excess of the<br />
Utility’s ultimate obligations may be subject to refund to customers.<br />
Although the Utility has provided for known environmental obligations that are probable <strong>and</strong> reasonably estimable, estimated<br />
costs may vary significantly from actual costs, <strong>and</strong> the amount of additional future costs may be material to results of operations in the<br />
period in which they are recognized. The Utility’s undiscounted future costs could increase to as much as $1.2 billion if the extent of<br />
contamination or necessary remediation is greater than anticipated or if the other potentially responsible parties are not financially able<br />
to contribute to these costs, <strong>and</strong> could increase further if the Utility chooses to remediate beyond regulatory requirements.<br />
<strong>FERC</strong> FORM NO. 1 (ED. 12-88) Page 123.57
Name of Respondent<br />
This Report Is:<br />
Date of Report<br />
Year/Period of Report<br />
(1) X An Original<br />
(Mo, Da, Yr)<br />
PACIFIC GAS AND ELECTRIC COMPANY<br />
End of <strong>2010</strong>/Q4<br />
(2) A Resubmission<br />
04/08/2011<br />
STATEMENTS OF ACCUMULATED COMPREHENSIVE INCOME, COMPREHENSIVE INCOME, AND HEDGING ACTIVITIES<br />
1. Report in columns (b),(c),(d) <strong>and</strong> (e) the amounts of accumulated other comprehensive income items, on a net-of-tax basis, where appropriate.<br />
2. Report in columns (f) <strong>and</strong> (g) the amounts of other categories of other cash flow hedges.<br />
3. For each category of hedges that have been accounted for as "fair value hedges", report the accounts affected <strong>and</strong> the related amounts in a footnote.<br />
4. Report data on a year-to-date basis.<br />
Line<br />
No.<br />
Item<br />
(a)<br />
Unrealized Gains <strong>and</strong><br />
Losses on Availablefor-Sale<br />
Securities<br />
(b)<br />
Minimum Pension<br />
Liability adjustment<br />
(net amount)<br />
(c)<br />
Foreign Currency<br />
Hedges<br />
(d)<br />
Other<br />
Adjustments<br />
(e)<br />
1<br />
2<br />
3<br />
4<br />
5<br />
6<br />
7<br />
8<br />
9<br />
10<br />
Balance of Account 219 at Beginning of<br />
Preceding Year<br />
Preceding Qtr/Yr to Date Reclassifications<br />
from Acct 219 to Net Income<br />
Preceding Quarter/Year to Date Changes in<br />
Fair Value<br />
Total (lines 2 <strong>and</strong> 3)<br />
Balance of Account 219 at End of<br />
Preceding Quarter/Year<br />
Balance of Account 219 at Beginning of<br />
Current Year<br />
Current Qtr/Yr to Date Reclassifications<br />
from Acct 219 to Net Income<br />
Current Quarter/Year to Date Changes in<br />
Fair Value<br />
Total (lines 7 <strong>and</strong> 8)<br />
Balance of Account 219 at End of Current<br />
Quarter/Year<br />
( 216,471,801)<br />
27,102,447<br />
35,859,497<br />
62,961,944<br />
( 153,509,857)<br />
( 153,509,857)<br />
32,459,612<br />
( 73,939,380)<br />
( 41,479,768)<br />
( 194,989,625)<br />
<strong>FERC</strong> FORM NO. 1 (NEW 06-02)<br />
Page 122a
Name of Respondent<br />
This Report Is:<br />
Date of Report<br />
Year/Period of Report<br />
(1) X An Original<br />
(Mo, Da, Yr)<br />
PACIFIC GAS AND ELECTRIC COMPANY<br />
End of <strong>2010</strong>/Q4<br />
(2) A Resubmission<br />
04/08/2011<br />
STATEMENTS OF ACCUMULATED COMPREHENSIVE INCOME, COMPREHENSIVE INCOME, AND HEDGING ACTIVITIES<br />
Line<br />
No.<br />
1<br />
2<br />
3<br />
4<br />
5<br />
6<br />
7<br />
8<br />
9<br />
10<br />
Other Cash Flow<br />
Hedges<br />
Interest Rate Swaps<br />
(f)<br />
Other Cash Flow<br />
Hedges<br />
[Specify]<br />
(g)<br />
Totals for each<br />
category of items<br />
recorded in<br />
Account 219<br />
(h)<br />
( 216,471,801)<br />
27,102,447<br />
35,859,497<br />
62,961,944<br />
( 153,509,857)<br />
( 153,509,857)<br />
32,459,612<br />
( 73,939,380)<br />
( 41,479,768)<br />
( 194,989,625)<br />
Net Income (Carried<br />
Forward from<br />
Page 117, Line 78)<br />
(i)<br />
Total<br />
Comprehensive<br />
Income<br />
(j)<br />
1,250,003,668 1,312,965,612<br />
1,120,973,704 1,079,493,936<br />
<strong>FERC</strong> FORM NO. 1 (NEW 06-02)<br />
Page 122b
Name of Respondent<br />
PACIFIC GAS AND ELECTRIC COMPANY<br />
This Report Is:<br />
Date of Report<br />
(1) X An Original<br />
(Mo, Da, Yr)<br />
(2) A Resubmission<br />
04/08/2011<br />
SUMMARY OF UTILITY PLANT AND ACCUMULATED PROVISIONS<br />
FOR DEPRECIATION. AMORTIZATION AND DEPLETION<br />
Year/Period of Report<br />
End of <strong>2010</strong>/Q4<br />
Report in Column (c) the amount for electric function, in column (d) the amount for gas function, in column (e), (f), <strong>and</strong> (g) report other (specify) <strong>and</strong> in<br />
column (h) common function.<br />
Line<br />
No.<br />
1<br />
Utility Plant<br />
Classification<br />
(a)<br />
Total <strong>Company</strong> for the<br />
Current Year/Quarter Ended<br />
(b)<br />
<strong>Electric</strong><br />
(c)<br />
2<br />
In Service<br />
3<br />
Plant in Service (Classified)<br />
47,904,554,907<br />
34,552,454,380<br />
4<br />
Property Under Capital Leases<br />
411,990,775<br />
410,655,935<br />
5<br />
Plant Purchased or Sold<br />
-1,758,039<br />
-1,758,039<br />
6<br />
Completed Construction not Classified<br />
3,234,162,018<br />
2,488,623,688<br />
7<br />
Experimental Plant Unclassified<br />
8<br />
Total (3 thru 7)<br />
51,548,949,661<br />
37,449,975,964<br />
9<br />
Leased to Others<br />
10<br />
Held for Future Use<br />
11<br />
Construction Work in Progress<br />
1,377,023,361<br />
1,016,902,985<br />
12<br />
Acquisition Adjustments<br />
2,711,908<br />
2,711,908<br />
13<br />
Total Utility Plant (8 thru 12)<br />
52,928,684,930<br />
38,469,590,857<br />
14<br />
Accum Prov for Depr, Amort, & Depl<br />
25,060,388,172<br />
18,068,897,603<br />
15<br />
Net Utility Plant (13 less 14)<br />
27,868,296,758<br />
20,400,693,254<br />
16<br />
Detail of Accum Prov for Depr, Amort & Depl<br />
17<br />
In Service:<br />
18<br />
Depreciation<br />
24,623,869,935<br />
18,016,805,331<br />
19<br />
Amort & Depl of Producing Nat <strong>Gas</strong> L<strong>and</strong>/L<strong>and</strong> Right<br />
20<br />
Amort of Underground Storage L<strong>and</strong>/L<strong>and</strong> Rights<br />
6,911,832<br />
21<br />
Amort of Other Utility Plant<br />
429,606,405<br />
52,092,272<br />
22<br />
Total In Service (18 thru 21)<br />
25,060,388,172<br />
18,068,897,603<br />
23<br />
Leased to Others<br />
24<br />
Depreciation<br />
25<br />
Amortization <strong>and</strong> Depletion<br />
26<br />
Total Leased to Others (24 & 25)<br />
27<br />
Held for Future Use<br />
28<br />
Depreciation<br />
29<br />
Amortization<br />
30<br />
Total Held for Future Use (28 & 29)<br />
31<br />
Ab<strong>and</strong>onment of Leases (Natural <strong>Gas</strong>)<br />
32<br />
Amort of Plant Acquisition Adj<br />
33<br />
Total Accum Prov (equals 14) (22,26,30,31,32)<br />
25,060,388,172<br />
18,068,897,603<br />
<strong>FERC</strong> FORM NO. 1 (ED. 12-89) Page 200
Name of Respondent<br />
This Report Is:<br />
Date of Report<br />
(1) X An Original<br />
(Mo, Da, Yr)<br />
PACIFIC GAS AND ELECTRIC COMPANY<br />
(2) A Resubmission<br />
04/08/2011<br />
SUMMARY OF UTILITY PLANT AND ACCUMULATED PROVISIONS<br />
FOR DEPRECIATION. AMORTIZATION AND DEPLETION<br />
<strong>Gas</strong><br />
Other (Specify)<br />
Other (Specify)<br />
Other (Specify)<br />
(d) (e) (f)<br />
(g)<br />
Year/Period of Report<br />
End of <strong>2010</strong>/Q4<br />
Common<br />
9,210,199,638 4,141,900,889 3<br />
1,334,840 4<br />
460,460,281 285,078,049 6<br />
9,671,994,759 4,426,978,938 8<br />
67,296,319 292,824,057 11<br />
9,739,291,078 4,719,802,995 13<br />
5,290,554,470 1,700,936,099 14<br />
4,448,736,608 3,018,866,896 15<br />
5,281,723,677 1,325,340,927 18<br />
6,911,832 20<br />
1,918,961 375,595,172 21<br />
5,290,554,470 1,700,936,099 22<br />
5,290,554,470 1,700,936,099 33<br />
(h)<br />
Line<br />
No.<br />
1<br />
2<br />
5<br />
7<br />
9<br />
10<br />
12<br />
16<br />
17<br />
19<br />
23<br />
24<br />
25<br />
26<br />
27<br />
28<br />
29<br />
30<br />
31<br />
32<br />
<strong>FERC</strong> FORM NO. 1 (ED. 12-89) Page 201
Name of Respondent<br />
This Report Is:<br />
Date of Report<br />
(1) X An Original<br />
(Mo, Da, Yr)<br />
PACIFIC GAS AND ELECTRIC COMPANY<br />
(2) A Resubmission<br />
04/08/2011<br />
NUCLEAR FUEL MATERIALS (Account 120.1 through 120.6 <strong>and</strong> 157)<br />
Year/Period of Report<br />
End of <strong>2010</strong>/Q4<br />
1. Report below the costs incurred for nuclear fuel materials in process of fabrication, on h<strong>and</strong>, in reactor, <strong>and</strong> in cooling; owned by the<br />
respondent.<br />
2. If the nuclear fuel stock is obtained under leasing arrangements, attach a statement showing the amount of nuclear fuel leased, the<br />
quantity used <strong>and</strong> quantity on h<strong>and</strong>, <strong>and</strong> the costs incurred under such leasing arrangements.<br />
Line<br />
No.<br />
1<br />
2<br />
3<br />
4<br />
5<br />
6<br />
7<br />
8<br />
9<br />
10<br />
11<br />
12<br />
13<br />
14<br />
15<br />
16<br />
17<br />
18<br />
19<br />
20<br />
21<br />
22<br />
Description of item<br />
Balance<br />
Beginning of Year<br />
(a)<br />
(b)<br />
Nuclear Fuel in process of Refinement, Conv, Enrichment & Fab (120.1)<br />
Fabrication<br />
Changes during Year<br />
Additions<br />
(c)<br />
Nuclear Materials 213,404,552 156,733,721<br />
Allowance for Funds Used during Construction<br />
(Other Overhead Construction Costs, provide details in footnote)<br />
SUBTOTAL (Total 2 thru 5) 213,404,552<br />
Nuclear Fuel Materials <strong>and</strong> Assemblies<br />
In Stock (120.2)<br />
In Reactor (120.3) 282,637,283 89,563,543<br />
SUBTOTAL (Total 8 & 9) 282,637,283<br />
Spent Nuclear Fuel (120.4) 1,499,757,195 70,386,399<br />
Nuclear Fuel Under Capital Leases (120.6)<br />
(Less) Accum Prov for Amortization of Nuclear Fuel Assem (120.5) 1,612,579,237<br />
TOTAL Nuclear Fuel Stock (Total 6, 10, 11, 12, less 13) 383,219,793<br />
Estimated net Salvage Value of Nuclear Materials in line 9<br />
Estimated net Salvage Value of Nuclear Materials in line 11<br />
Est Net Salvage Value of Nuclear Materials in Chemical Processing<br />
Nuclear Materials held for Sale (157)<br />
Uranium<br />
Plutonium<br />
Other (provide details in footnote):<br />
TOTAL Nuclear Materials held for Sale (Total 19, 20, <strong>and</strong> 21)<br />
<strong>FERC</strong> FORM NO. 1 (ED. 12-89) Page 202
Name of Respondent<br />
This Report Is:<br />
Date of Report<br />
(1) X An Original<br />
(Mo, Da, Yr)<br />
PACIFIC GAS AND ELECTRIC COMPANY<br />
(2) A Resubmission<br />
04/08/2011<br />
NUCLEAR FUEL MATERIALS (Account 120.1 through 120.6 <strong>and</strong> 157)<br />
Year/Period of Report<br />
End of <strong>2010</strong>/Q4<br />
Amortization<br />
(d)<br />
-85,379,213<br />
Changes during Year<br />
Other Reductions (Explain in a footnote)<br />
(e)<br />
Balance<br />
End of Year<br />
(f)<br />
88,790,917 281,347,356<br />
281,347,356<br />
70,386,399 301,814,427<br />
301,814,427<br />
1,570,143,594<br />
1,697,958,450<br />
455,346,927<br />
Line<br />
No.<br />
1<br />
2<br />
3<br />
4<br />
5<br />
6<br />
7<br />
8<br />
9<br />
10<br />
11<br />
12<br />
13<br />
14<br />
15<br />
16<br />
17<br />
18<br />
19<br />
20<br />
21<br />
22<br />
<strong>FERC</strong> FORM NO. 1 (ED. 12-89) Page 203
Name of Respondent<br />
PACIFIC GAS AND ELECTRIC COMPANY<br />
This Report is:<br />
(1) X An Original<br />
(2) A Resubmission<br />
Date of Report<br />
(Mo, Da, Yr)<br />
04/08/2011<br />
Year/Period of Report<br />
<strong>2010</strong>/Q4<br />
FOOTNOTE DATA<br />
Schedule Page: 202 Line No.: 3 Column: e<br />
Allocated reload inserted into Unit 1 reactor during <strong>2010</strong> refueling outage.<br />
Schedule Page: 202 Line No.: 9 Column: e<br />
Transfer of fuel to spent fuel pool during <strong>2010</strong>.<br />
<strong>FERC</strong> FORM NO. 1 (ED. 12-87) Page 450.1
Name of Respondent<br />
PACIFIC GAS AND ELECTRIC COMPANY<br />
This Report Is:<br />
Date of Report<br />
(1) X An Original<br />
(Mo, Da, Yr)<br />
(2) A Resubmission<br />
04/08/2011<br />
ELECTRIC PLANT IN SERVICE (Account 101, 102, 103 <strong>and</strong> 106)<br />
Year/Period of Report<br />
End of <strong>2010</strong>/Q4<br />
1. Report below the original cost of electric plant in service according to the prescribed accounts.<br />
2. In addition to Account 101, <strong>Electric</strong> Plant in Service (Classified), this page <strong>and</strong> the next include Account 102, <strong>Electric</strong> Plant Purchased or Sold;<br />
Account 103, Experimental <strong>Electric</strong> Plant Unclassified; <strong>and</strong> Account 106, Completed Construction Not Classified-<strong>Electric</strong>.<br />
3. Include in column (c) or (d), as appropriate, corrections of additions <strong>and</strong> retirements for the current or preceding year.<br />
4. For revisions to the amount of initial asset retirement costs capitalized, included by primary plant account, increases in column (c) additions <strong>and</strong><br />
reductions in column (e) adjustments.<br />
5. Enclose in parentheses credit adjustments of plant accounts to indicate the negative effect of such accounts.<br />
6. Classify Account 106 according to prescribed accounts, on an estimated basis if necessary, <strong>and</strong> include the entries in column (c). Also to be included<br />
in column (c) are entries for reversals of tentative distributions of prior year reported in column (b). Likewise, if the respondent has a significant amount<br />
of plant retirements which have not been classified to primary accounts at the end of the year, include in column (d) a tentative distribution of such<br />
retirements, on an estimated basis, with appropriate contra entry to the account for accumulated depreciation provision. Include also in column (d)<br />
Line<br />
Account Balance Additions<br />
No.<br />
Beginning of Year<br />
(a)<br />
(b)<br />
(c)<br />
1 1. INTANGIBLE PLANT<br />
2 (301) Organization<br />
3 (302) Franchises <strong>and</strong> Consents 105,037,374 1,847,097<br />
4 (303) Miscellaneous Intangible Plant 9,655,373<br />
5 TOTAL Intangible Plant (Enter Total of lines 2, 3, <strong>and</strong> 4) 114,692,747 1,847,097<br />
6 2. PRODUCTION PLANT<br />
7 A. Steam Production Plant<br />
8 (310) L<strong>and</strong> <strong>and</strong> L<strong>and</strong> Rights 3,938,242 3,107,249<br />
9 (311) Structures <strong>and</strong> Improvements 62,127,871 55,631,478<br />
10 (312) Boiler Plant Equipment 88,871,962 188,612,183<br />
11 (313) Engines <strong>and</strong> Engine-Driven Generators 892,346<br />
12 (314) Turbogenerator Units 119,751,277 132,980,638<br />
13 (315) Accessory <strong>Electric</strong> Equipment 24,285,138 24,216,985<br />
14 (316) Misc. Power Plant Equipment 15,912,890 15,272,310<br />
15 (317) Asset Retirement Costs for Steam Production 49,536,829<br />
16 TOTAL Steam Production Plant (Enter Total of lines 8 thru 15) 365,316,555 419,820,843<br />
17 B. Nuclear Production Plant<br />
18 (320) L<strong>and</strong> <strong>and</strong> L<strong>and</strong> Rights 21,588,467 4,697,124<br />
19 (321) Structures <strong>and</strong> Improvements 972,842,626 6,606,756<br />
20 (322) Reactor Plant Equipment 3,215,542,734 121,599,246<br />
21 (323) Turbogenerator Units 1,121,318,888 2,998,979<br />
22 (324) Accessory <strong>Electric</strong> Equipment 829,170,810 5,771,471<br />
23 (325) Misc. Power Plant Equipment 592,047,325 4,466,815<br />
24 (326) Asset Retirement Costs for Nuclear Production 96,806,164<br />
25 TOTAL Nuclear Production Plant (Enter Total of lines 18 thru 24) 6,849,317,014 146,140,391<br />
26 C. Hydraulic Production Plant<br />
27 (330) L<strong>and</strong> <strong>and</strong> L<strong>and</strong> Rights 44,235,612 5,080,365<br />
28 (331) Structures <strong>and</strong> Improvements 307,555,065 3,927,440<br />
29 (332) Reservoirs, Dams, <strong>and</strong> Waterways 1,441,664,558 94,262,619<br />
30 (333) Water Wheels, Turbines, <strong>and</strong> Generators 491,148,276 14,743,267<br />
31 (334) Accessory <strong>Electric</strong> Equipment 164,179,365 9,991,020<br />
32 (335) Misc. Power PLant Equipment 54,671,311 5,016,067<br />
33 (336) Roads, Railroads, <strong>and</strong> Bridges 46,599,804 2,296,472<br />
34 (337) Asset Retirement Costs for Hydraulic Production 9,271,738<br />
35 TOTAL Hydraulic Production Plant (Enter Total of lines 27 thru 34) 2,559,325,729 135,317,250<br />
36 D. Other Production Plant<br />
37 (340) L<strong>and</strong> <strong>and</strong> L<strong>and</strong> Rights 1,721,299 6,350,688<br />
38 (341) Structures <strong>and</strong> Improvements 18,269,094 116,190,875<br />
39 (342) Fuel Holders, Products, <strong>and</strong> Accessories 1,713,866 10,903,742<br />
40 (343) Prime Movers 55,588,497 158,955,195<br />
41 (344) Generators 38,528,059 24,092,371<br />
42 (345) Accessory <strong>Electric</strong> Equipment 39,002,205 64,074,683<br />
43 (346) Misc. Power Plant Equipment 28,528,986 39,608,821<br />
44 (347) Asset Retirement Costs for Other Production<br />
45 TOTAL Other Prod. Plant (Enter Total of lines 37 thru 44) 183,352,006 420,176,375<br />
46 TOTAL Prod. Plant (Enter Total of lines 16, 25, 35, <strong>and</strong> 45) 9,957,311,304 1,121,454,859<br />
<strong>FERC</strong> FORM NO. 1 (REV. 12-05)<br />
Page 204
Name of Respondent<br />
PACIFIC GAS AND ELECTRIC COMPANY<br />
This Report Is:<br />
(1) X An Original<br />
(2) A Resubmission<br />
Date of Report<br />
(Mo, Da, Yr)<br />
04/08/2011<br />
Year/Period of Report<br />
End of <strong>2010</strong>/Q4<br />
ELECTRIC PLANT IN SERVICE (Account 101, 102, 103 <strong>and</strong> 106) (Continued)<br />
Line<br />
Account Balance Additions<br />
No.<br />
Beginning of Year<br />
(a)<br />
(b)<br />
(c)<br />
47 3. TRANSMISSION PLANT<br />
48 (350) L<strong>and</strong> <strong>and</strong> L<strong>and</strong> Rights 212,228,241 5,288,378<br />
49 (352) Structures <strong>and</strong> Improvements 205,132,923 18,743,919<br />
50 (353) Station Equipment 2,964,361,694 340,711,511<br />
51 (354) Towers <strong>and</strong> Fixtures 464,692,148 45,591,804<br />
52 (355) Poles <strong>and</strong> Fixtures 471,834,751 51,096,001<br />
53 (356) Overhead Conductors <strong>and</strong> Devices 811,707,165 80,307,577<br />
54 (357) Underground Conduit 310,415,814 40,975,039<br />
55 (358) Underground Conductors <strong>and</strong> Devices 158,694,720 95,381,774<br />
56 (359) Roads <strong>and</strong> Trails 46,660,955 1,383,097<br />
57 (359.1) Asset Retirement Costs for Transmission Plant 967,129<br />
58 TOTAL Transmission Plant (Enter Total of lines 48 thru 57) 5,646,695,540 679,479,100<br />
59 4. DISTRIBUTION PLANT<br />
60 (360) L<strong>and</strong> <strong>and</strong> L<strong>and</strong> Rights 163,632,498 5,866,045<br />
61 (361) Structures <strong>and</strong> Improvements 199,271,018 18,046,464<br />
62 (362) Station Equipment 1,906,092,795 152,845,404<br />
63 (363) Storage Battery Equipment 334,866<br />
64 (364) Poles, Towers, <strong>and</strong> Fixtures 2,454,181,768 147,818,118<br />
65 (365) Overhead Conductors <strong>and</strong> Devices 2,877,247,836 199,154,652<br />
66 (366) Underground Conduit 2,126,134,186 62,736,607<br />
67 (367) Underground Conductors <strong>and</strong> Devices 2,978,537,423 135,859,026<br />
68 (368) Line Transformers 1,738,434,331 150,431,392<br />
69 (369) Services 2,527,889,315 61,194,545<br />
70 (370) Meters 835,250,527 308,899,071<br />
71 (371) Installations on Customer Premises 27,313,912<br />
72 (372) Leased Property on Customer Premises 895,448<br />
73 (373) Street Lighting <strong>and</strong> Signal Systems 157,261,564 2,778,714<br />
74 (374) Asset Retirement Costs for Distribution Plant 24,150,693<br />
75 TOTAL Distribution Plant (Enter Total of lines 60 thru 74) 18,016,628,180 1,245,630,038<br />
76 5. REGIONAL TRANSMISSION AND MARKET OPERATION PLANT<br />
77 (380) L<strong>and</strong> <strong>and</strong> L<strong>and</strong> Rights<br />
78 (381) Structures <strong>and</strong> Improvements<br />
79 (382) Computer Hardware<br />
80 (383) Computer Software<br />
81 (384) Communication Equipment<br />
82 (385) Miscellaneous Regional Transmission <strong>and</strong> Market Operation Plant<br />
83 (386) Asset Retirement Costs for Regional Transmission <strong>and</strong> Market Oper<br />
84 TOTAL Transmission <strong>and</strong> Market Operation Plant (Total lines 77 thru 83)<br />
85 6. GENERAL PLANT<br />
86 (389) L<strong>and</strong> <strong>and</strong> L<strong>and</strong> Rights 424,632<br />
87 (390) Structures <strong>and</strong> Improvements 7,675,000 15,840<br />
88 (391) Office Furniture <strong>and</strong> Equipment 17,167,485 360,645<br />
89 (392) Transportation Equipment<br />
90 (393) Stores Equipment<br />
91 (394) Tools, Shop <strong>and</strong> Garage Equipment 51,362,152 5,940,613<br />
92 (395) Laboratory Equipment 12,457,019 115,282<br />
93 (396) Power Operated Equipment 328,162<br />
94 (397) Communication Equipment 7,050,735 2,239,454<br />
95 (398) Miscellaneous Equipment -2,480,123 51,439<br />
96 SUBTOTAL (Enter Total of lines 86 thru 95) 93,985,062 8,723,273<br />
97 (399) Other Tangible Property 468,499,422<br />
98 (399.1) Asset Retirement Costs for General Plant<br />
99 TOTAL General Plant (Enter Total of lines 96, 97 <strong>and</strong> 98) 562,484,484 8,723,273<br />
100 TOTAL (Accounts 101 <strong>and</strong> 106) 34,297,812,255 3,057,134,367<br />
101 (102) <strong>Electric</strong> Plant Purchased (See Instr. 8)<br />
102 (Less) (102) <strong>Electric</strong> Plant Sold (See Instr. 8) 435,000<br />
103 (103) Experimental Plant Unclassified<br />
104 TOTAL <strong>Electric</strong> Plant in Service (Enter Total of lines 100 thru 103) 34,297,377,255 3,057,134,367<br />
<strong>FERC</strong> FORM NO. 1 (REV. 12-05)<br />
Page 206
Name of Respondent<br />
PACIFIC GAS AND ELECTRIC COMPANY<br />
This Report Is:<br />
(1) X An Original<br />
(2) A Resubmission<br />
Date of Report<br />
(Mo, Da, Yr)<br />
04/08/2011<br />
ELECTRIC PLANT IN SERVICE (Account 101, 102, 103 <strong>and</strong> 106) (Continued)<br />
Year/Period of Report<br />
End of <strong>2010</strong>/Q4<br />
distributions of these tentative classifications in columns (c) <strong>and</strong> (d), including the reversals of the prior years tentative account distributions of these<br />
amounts. Careful observance of the above instructions <strong>and</strong> the texts of Accounts 101 <strong>and</strong> 106 will avoid serious omissions of the reported amount of<br />
respondent’s plant actually in service at end of year.<br />
7. Show in column (f) reclassifications or transfers within utility plant accounts. Include also in column (f) the additions or reductions of primary account<br />
classifications arising from distribution of amounts initially recorded in Account 102, include in column (e) the amounts with respect to accumulated<br />
provision for depreciation, acquisition adjustments, etc., <strong>and</strong> show in column (f) only the offset to the debits or credits distributed in column (f) to primary<br />
account classifications.<br />
8. For Account 399, state the nature <strong>and</strong> use of plant included in this account <strong>and</strong> if substantial in amount submit a supplementary statement showing<br />
subaccount classification of such plant conforming to the requirement of these pages.<br />
9. For each amount comprising the reported balance <strong>and</strong> changes in Account 102, state the property purchased or sold, name of vendor or purchase,<br />
<strong>and</strong> date of transaction. If proposed journal entries have been filed with the Commission as required by the Uniform System of Accounts, give also date<br />
Retirements<br />
Adjustments<br />
Transfers<br />
Balance at<br />
Line<br />
(d)<br />
(e)<br />
(f)<br />
End of Year<br />
(g)<br />
No.<br />
1<br />
2<br />
106,884,471 3<br />
9,655,373 4<br />
116,539,844 5<br />
6<br />
7<br />
7,045,491 8<br />
117,759,349 9<br />
277,484,145 10<br />
892,346 11<br />
252,731,915 12<br />
48,502,123 13<br />
-5,140,000 26,045,200<br />
14<br />
12,988,529 62,525,358<br />
15<br />
7,848,529 792,985,927<br />
16<br />
17<br />
26,285,591 18<br />
1,753,977 977,695,405<br />
19<br />
26,177,296 -410,019<br />
3,310,554,665<br />
20<br />
1,876,345 -176,965<br />
1,122,264,557<br />
21<br />
2,785,844 832,156,437<br />
22<br />
3,578,456 144,000<br />
593,079,684<br />
23<br />
96,806,164 24<br />
36,171,918 -442,984<br />
6,958,842,503<br />
25<br />
26<br />
49,315,977 27<br />
91,945 311,390,560<br />
28<br />
87,028 -165,617<br />
1,535,674,532<br />
29<br />
1,182,527 504,709,016<br />
30<br />
275,804 173,894,581<br />
31<br />
182,885 59,504,493<br />
32<br />
616 48,895,660<br />
33<br />
-1,630,268 7,641,470<br />
34<br />
1,820,805 -1,795,885<br />
2,691,026,289<br />
35<br />
36<br />
8,071,987 37<br />
134,459,969 38<br />
12,617,608 39<br />
214,543,692 40<br />
62,620,430 41<br />
103,076,888 42<br />
128,274 68,266,081<br />
43<br />
44<br />
128,274 603,656,655<br />
45<br />
37,992,723 5,737,934<br />
11,046,511,374<br />
46<br />
<strong>FERC</strong> FORM NO. 1 (REV. 12-05)<br />
Page 205
Name of Respondent<br />
PACIFIC GAS AND ELECTRIC COMPANY<br />
This Report Is:<br />
(1) X An Original<br />
(2) A Resubmission<br />
Date of Report<br />
(Mo, Da, Yr)<br />
04/08/2011<br />
Year/Period of Report<br />
End of <strong>2010</strong>/Q4<br />
ELECTRIC PLANT IN SERVICE (Account 101, 102, 103 <strong>and</strong> 106) (Continued)<br />
Retirements<br />
Adjustments<br />
Transfers<br />
Balance at<br />
Line<br />
(d)<br />
(e)<br />
(f)<br />
End of Year<br />
(g)<br />
No.<br />
47<br />
13,987 -723,364<br />
216,779,268<br />
48<br />
112,796 -2,605,038<br />
221,159,008<br />
49<br />
13,590,014 -744,469<br />
3,290,738,722<br />
50<br />
2,083,871 508,200,081<br />
51<br />
3,514,995 -122,587<br />
519,293,170<br />
52<br />
5,049,260 -135,202<br />
886,830,280<br />
53<br />
351,390,853 54<br />
594,088 253,482,406<br />
55<br />
5,044,077 -41,315<br />
42,958,660<br />
56<br />
2,435,247 3,402,376<br />
57<br />
30,003,088 -1,936,728<br />
6,294,234,824<br />
58<br />
59<br />
-430,555 169,067,988<br />
60<br />
11,711 -1,790,716<br />
215,515,055<br />
61<br />
10,374,654 -250,855<br />
2,048,312,690<br />
62<br />
334,866 63<br />
9,769,284 -762,839<br />
2,591,467,763<br />
64<br />
13,461,911 -724,184<br />
3,062,216,393<br />
65<br />
93,690 -2,199,909<br />
2,186,577,194<br />
66<br />
3,310,283 -1,548,508<br />
3,109,537,658<br />
67<br />
17,538,142 -390,428<br />
1,870,937,153<br />
68<br />
538,378 -297,527<br />
2,588,247,955<br />
69<br />
203,711,568 -25,319,767<br />
915,118,263<br />
70<br />
27,313,912 71<br />
895,448 72<br />
59,926 -6,777<br />
159,973,575<br />
73<br />
-8,678,782 15,471,911<br />
74<br />
258,869,547 -42,400,847<br />
18,960,987,824<br />
75<br />
76<br />
77<br />
78<br />
79<br />
80<br />
81<br />
82<br />
83<br />
84<br />
85<br />
424,632 86<br />
7,690,840 87<br />
7,240 17,520,890<br />
88<br />
89<br />
90<br />
4,140,830 53,161,935<br />
91<br />
12,572,301 92<br />
6,894 321,268<br />
93<br />
27,053 9,263,136<br />
94<br />
55,778,463 53,349,779<br />
95<br />
4,182,017 55,778,463<br />
154,304,781<br />
96<br />
468,499,422 97<br />
98<br />
4,182,017 55,778,463<br />
622,804,203<br />
99<br />
331,047,375 17,178,822<br />
37,041,078,069<br />
100<br />
101<br />
1,323,040 1,758,040<br />
102<br />
103<br />
331,047,375 15,855,782<br />
37,039,320,029<br />
104<br />
<strong>FERC</strong> FORM NO. 1 (REV. 12-05)<br />
Page 207
Name of Respondent<br />
This Report Is:<br />
Date of Report<br />
(1) X An Original<br />
(Mo, Da, Yr)<br />
PACIFIC GAS AND ELECTRIC COMPANY<br />
(2) A Resubmission<br />
04/08/2011<br />
CONSTRUCTION WORK IN PROGRESS - - ELECTRIC (Account 107)<br />
Year/Period of Report<br />
End of <strong>2010</strong>/Q4<br />
1. Report below descriptions <strong>and</strong> balances at end of year of projects in process of construction (107)<br />
2. Show items relating to "research, development, <strong>and</strong> demonstration" projects last, under a caption Research, Development, <strong>and</strong> Demonstrating (see<br />
Account 107 of the Uniform System of Accounts)<br />
3. Minor projects (5% of the Balance End of the Year for Account 107 or $1,000,000, whichever is less) may be grouped.<br />
Line<br />
No.<br />
1<br />
2<br />
3<br />
4<br />
5<br />
6<br />
7<br />
8<br />
9<br />
10<br />
11<br />
12<br />
13<br />
14<br />
15<br />
16<br />
17<br />
18<br />
19<br />
20<br />
21<br />
22<br />
23<br />
24<br />
25<br />
26<br />
27<br />
28<br />
29<br />
30<br />
31<br />
32<br />
33<br />
34<br />
35<br />
36<br />
37<br />
38<br />
39<br />
40<br />
41<br />
42<br />
Description of Project Construction work in progress -<br />
<strong>Electric</strong> (Account 107)<br />
(a)<br />
(b)<br />
5721054 SFR-SF H Sub: 115kV BAAH Conversion<br />
27,236,312<br />
5704039 Upper North Fork Feather River <strong>FERC</strong> 2105 Relicense<br />
25,323,568<br />
5724979 Crane Valley Dam - Seismic Upgrade<br />
23,685,177<br />
5720296 sfr-48-Mission Sub: Rebuild<br />
21,289,750<br />
5719039 McCloud-Pit <strong>FERC</strong> 2106 Relicense<br />
20,833,836<br />
5719538 Drum Spaulding Relicensing<br />
18,961,043<br />
5721919 Atlantic Lincoln Transmission Project<br />
17,641,376<br />
5726013 Mission Rebuild 115Kv Bus<br />
17,625,620<br />
5717079 Palermo-Rio Oso 115kV Line Capacity<br />
16,865,255<br />
5735278 COM:License Renewal Application Review<br />
15,825,916<br />
5716718 DeSabla Centerville Relicensing<br />
15,470,952<br />
5737558 Photovoltaic 250MW Program, (Construct <strong>and</strong> Design)<br />
14,448,816<br />
5735925 NaS Battery Installation<br />
12,789,464<br />
5701979 Poe Hydroelectric <strong>FERC</strong> 2107 Relicense<br />
11,900,581<br />
5715260 ESO Disaster Recovery Project<br />
11,247,873<br />
5727460 Humboldt Bay Generation Station<br />
11,070,373<br />
5718947 Rock Creek Upgrade Units<br />
10,545,669<br />
5723300 Gregg Reactor Project<br />
10,518,802<br />
5727011 Arco Bank 1 Replace 115/70kV<br />
9,855,699<br />
5740318 Implement New Security Force on Force Requirements<br />
8,908,171<br />
5726998 Oakl<strong>and</strong> C: Replace 115/12kV, 60 MVA Bank 2<br />
8,387,689<br />
5724300 Central Coast Reinforcement Project<br />
8,189,358<br />
5736118 Modify PA Boundary (IDS)<br />
8,133,698<br />
5721918 Hollister 115kV Line Reconductoring<br />
8,099,082<br />
5731638 Canada/Pac NW-Northern CA Transmission Project<br />
7,678,149<br />
5732298 Humboldt 115/60 kV Transformer Replacement<br />
7,640,918<br />
5738578 Fuel Cell Generators<br />
7,341,892<br />
5737398 Construct Manzana Wind Generating Station<br />
7,338,252<br />
5716260 Sacramento - Rio Oso-Colgate Raise Towers<br />
7,272,786<br />
5721879 Atlantic Lincoln Transmission Project<br />
7,166,138<br />
5733403 Unit 1:Replace Process Control (7100) Racks<br />
7,017,200<br />
5717285 Work Requested by Others Rule 20A - Mission<br />
6,980,952<br />
5728119 Geographic Information System Network Upgrades<br />
6,581,655<br />
5736540 Helms - Unit 1 Replace Wicket Gate Bushings<br />
6,303,169<br />
5736142 COM: Transition NFPA 805 License Basis<br />
6,286,804<br />
5715550 Pease-Marysville 60kV Line Conversion<br />
5,842,309<br />
5505341 Transmission Emergency Response<br />
5,433,489<br />
5726638 Panoche Sub: Install 230 kV MPAC<br />
5,212,237<br />
5739806 Eastshore 230/115 kV TX No. 2 Replacement<br />
5,183,264<br />
5717284 Work at the Request of Others Rule 20A - Los Padres<br />
5,131,300<br />
5735519 SmartMeter - November 2009 (Release H)<br />
5,034,552<br />
5725603 Glenn #2 60kV Reconductor<br />
4,822,538<br />
43 TOTAL 1,016,902,985<br />
<strong>FERC</strong> FORM NO. 1 (ED. 12-87) Page 216
Name of Respondent<br />
This Report Is:<br />
Date of Report<br />
(1) X An Original<br />
(Mo, Da, Yr)<br />
PACIFIC GAS AND ELECTRIC COMPANY<br />
(2) A Resubmission<br />
04/08/2011<br />
CONSTRUCTION WORK IN PROGRESS - - ELECTRIC (Account 107)<br />
Year/Period of Report<br />
End of <strong>2010</strong>/Q4<br />
1. Report below descriptions <strong>and</strong> balances at end of year of projects in process of construction (107)<br />
2. Show items relating to "research, development, <strong>and</strong> demonstration" projects last, under a caption Research, Development, <strong>and</strong> Demonstrating (see<br />
Account 107 of the Uniform System of Accounts)<br />
3. Minor projects (5% of the Balance End of the Year for Account 107 or $1,000,000, whichever is less) may be grouped.<br />
Line<br />
No.<br />
1<br />
2<br />
3<br />
4<br />
5<br />
6<br />
7<br />
8<br />
9<br />
10<br />
11<br />
12<br />
13<br />
14<br />
15<br />
16<br />
17<br />
18<br />
19<br />
20<br />
21<br />
22<br />
23<br />
24<br />
25<br />
26<br />
27<br />
28<br />
29<br />
30<br />
31<br />
32<br />
33<br />
34<br />
35<br />
36<br />
37<br />
38<br />
39<br />
40<br />
41<br />
42<br />
Description of Project Construction work in progress -<br />
<strong>Electric</strong> (Account 107)<br />
(a)<br />
(b)<br />
5506561 System Breaker Replacement:230/115/60kV<br />
4,804,174<br />
5738002 Security Camera Infrastructure<br />
4,690,481<br />
5717038 Pease-Marysville 60kV Line Conversion<br />
4,623,417<br />
5721442 Mesa Substation: Install Distribution Bank<br />
4,548,156<br />
5720704 Pit 3 Dam Britton Powerhouse<br />
4,547,469<br />
5735302 Garberville SVC Installation<br />
4,445,213<br />
5735620 SmartMeter - June <strong>2010</strong> (Release I)<br />
4,433,750<br />
5732791 San Mateo sub-convert 115kV bus to BAAH<br />
4,426,278<br />
5738903 Henrietta-McCall 230 kV Reconductor<br />
4,396,629<br />
5730181 Sanger-Reedley Reconductoring<br />
4,384,275<br />
5706038 Chili Bar Relicense <strong>FERC</strong> 2155<br />
4,377,256<br />
5729886 Carol<strong>and</strong>s: Replace Bank #2<br />
4,173,662<br />
5704040 Poe U2 Replace Runner<br />
4,156,701<br />
5737279 Smart Meter - BP (Read2Bill Except Hndlng Assess)<br />
4,134,451<br />
5733378 Big River SVC Installation<br />
4,106,485<br />
5738897 Helm-McCall 230 kV Reconductoring<br />
4,059,462<br />
5717292 Work Requested by Others Rule 20A - San Jose<br />
4,051,996<br />
5729893 San Le<strong>and</strong>ro “U”: Replace Bank #1<br />
4,045,398<br />
5738895 Panoche-Helm 230 kV Reconductoring<br />
4,012,765<br />
5720667 Pit 3 Unit 1 Rewind<br />
4,005,388<br />
5731106 Cooley L<strong>and</strong>ing 115/60kv Transformers Bank 1<br />
3,927,794<br />
5733720 COM:Install Intake Bar Rack Raking System<br />
3,920,183<br />
5720787 Kilarc-Cow License Surr Relicensing<br />
3,902,640<br />
5729890 Daly City: Replace Bank #1<br />
3,806,639<br />
5726798 Madera Sub: Convert 70 kV to Ring Bus<br />
3,763,304<br />
5727000 Belmont Sub:Replace 115/12kV, 45 MVA Bank1<br />
3,741,998<br />
5700287 RCC LC- Water Temperature Control<br />
3,733,843<br />
5713559 East Gr<strong>and</strong> Sub: Replace Bank1 115/12-2x45MVA<br />
3,675,690<br />
5733784 San Mateo 230 kV ECC Auto<br />
3,674,063<br />
5725599 Cabrillo-Santa Ynez 115kV Reconductor<br />
3,656,951<br />
5732660 Daly City 115KV Bus Reconfiguration<br />
3,618,779<br />
5717278 Work at the Request of Others Rule 20A - Central Coast<br />
3,563,790<br />
5725600 Atascadero-San Luis Obispo 70kV Reconductoring<br />
3,550,606<br />
5728039 Access <strong>and</strong> Badging<br />
3,451,279<br />
5726860 Relief Dam L.L. Draft Valves<br />
3,416,067<br />
5738899 Panoche-McMullin 230 kV Reconductor<br />
3,402,357<br />
5509699 08D Cornerstone Reclosers<br />
3,342,888<br />
5505597 Work at the Request of Others Non-Reimb.-Mission<br />
3,341,729<br />
5724098 SmartMeter-System Integration & Test<br />
3,316,004<br />
5506315 Yard Improvements<br />
3,251,893<br />
5735439 SA-Synchronized-phasor technology demo<br />
3,238,812<br />
5726502 Purchase 115-17kV 45 MVA +/- 15% LTC<br />
3,199,496<br />
43 TOTAL 1,016,902,985<br />
<strong>FERC</strong> FORM NO. 1 (ED. 12-87) Page 216.1
Name of Respondent<br />
This Report Is:<br />
Date of Report<br />
(1) X An Original<br />
(Mo, Da, Yr)<br />
PACIFIC GAS AND ELECTRIC COMPANY<br />
(2) A Resubmission<br />
04/08/2011<br />
CONSTRUCTION WORK IN PROGRESS - - ELECTRIC (Account 107)<br />
Year/Period of Report<br />
End of <strong>2010</strong>/Q4<br />
1. Report below descriptions <strong>and</strong> balances at end of year of projects in process of construction (107)<br />
2. Show items relating to "research, development, <strong>and</strong> demonstration" projects last, under a caption Research, Development, <strong>and</strong> Demonstrating (see<br />
Account 107 of the Uniform System of Accounts)<br />
3. Minor projects (5% of the Balance End of the Year for Account 107 or $1,000,000, whichever is less) may be grouped.<br />
Line<br />
No.<br />
1<br />
2<br />
3<br />
4<br />
5<br />
6<br />
7<br />
8<br />
9<br />
10<br />
11<br />
12<br />
13<br />
14<br />
15<br />
16<br />
17<br />
18<br />
19<br />
20<br />
21<br />
22<br />
23<br />
24<br />
25<br />
26<br />
27<br />
28<br />
29<br />
30<br />
31<br />
32<br />
33<br />
34<br />
35<br />
36<br />
37<br />
38<br />
39<br />
40<br />
41<br />
42<br />
Description of Project Construction work in progress -<br />
<strong>Electric</strong> (Account 107)<br />
(a)<br />
(b)<br />
5721839 Woodside Sub: Replace Bank 1<br />
3,169,391<br />
5729177 Sierra Lincoln: Replace Bank #2<br />
3,120,406<br />
5732653 Marysville - Plumas Re-conductor<br />
3,114,881<br />
5737999 NRC Force on Force Items<br />
3,070,841<br />
5717295 Work at the Request of Others Rule 20A - Yosemite<br />
3,038,744<br />
5736438 SmartMeter - Peak Time Rebate (PTR)<br />
3,021,972<br />
5733680 COM:FWST 0-1 Internal Refurbishing & Pipe Repladement<br />
3,000,253<br />
5733750 Replace Auxiliary Board Phase 4A<br />
2,956,133<br />
5734859 Condition Based Maintenance implementation, Transmission Substation<br />
2,941,967<br />
5738905 Chowchilla-Le Gr<strong>and</strong> 115 kV Reconductor<br />
2,844,779<br />
5705779 Relicense Transmission Lines<br />
2,840,176<br />
5507682 Replace Deteriorated Boardwalks<br />
2,834,776<br />
5729887 Cassidy: Replace Bank #1<br />
2,789,344<br />
5721938 Holdover Permit Project<br />
2,777,821<br />
5731721 South Coast - Burns Sub Reliability<br />
2,770,181<br />
5732690 Sobrante MPAC<br />
2,676,015<br />
5717280 Work at the Request of Others Rule 20A - Diablo<br />
2,673,162<br />
5728078 Helms - Replace Relays<br />
2,534,756<br />
5737463 Smart Meter - Restoration Validation (Release G)<br />
2,518,854<br />
5732697 Sanger 115 kV MPAC<br />
2,515,856<br />
5738458 Los Banos 230 kV MPAC<br />
2,501,132<br />
5737919 Midway Sub: Bank 1 Replacement Upgrades<br />
2,497,921<br />
5734604 Valley Springs 230/60 kV MPAC<br />
2,477,577<br />
5733785 Ignacio - 230kV MPAC<br />
2,471,463<br />
5740698 Bellota 230 kV MPAC<br />
2,432,125<br />
5506659 Permit Project<br />
2,397,024<br />
5731264 Midway - Replace Circuit Switchers W/ 500kV Circuit Breakers<br />
2,327,319<br />
5733058 Tri-Valley Voltage Control<br />
2,309,979<br />
5732778 Purch 1ph 40MVA230-115x70x60 Mobile<br />
2,266,664<br />
5735119 South Valley - Henrietta 70 kV Bus<br />
2,180,416<br />
5732721 East Bay - Elk Creek 60kV Tap<br />
2,174,684<br />
5740338 San Le<strong>and</strong>ro U: Emergency Replace Bank<br />
2,139,126<br />
5726301 U2:Replace SPDS System<br />
2,083,100<br />
5721854 Napa Sub: Install Bnk # 3 <strong>and</strong> Feeder<br />
2,082,571<br />
5734022 Replace Vaca-Dixon Bank #6<br />
2,077,621<br />
5728905 Sacramento - Hartley Sub: Install 6<br />
2,053,435<br />
5717289 Work at the Request of Others Rule 20A - Peninsula<br />
1,994,680<br />
5733412 U1:Replace SPDS System<br />
1,987,442<br />
5737141 Transbay Transit Center <strong>Electric</strong> Relocation<br />
1,965,350<br />
5506639 Distribution Mobile Replacement Program<br />
1,956,772<br />
5738573 Replace failed Mobile T-45.0-8, purch 45MVA<br />
1,949,446<br />
5733408 DCPP Unit 1:Upgrade Polar Crane Control Systems<br />
1,932,521<br />
43 TOTAL 1,016,902,985<br />
<strong>FERC</strong> FORM NO. 1 (ED. 12-87) Page 216.2
Name of Respondent<br />
This Report Is:<br />
Date of Report<br />
(1) X An Original<br />
(Mo, Da, Yr)<br />
PACIFIC GAS AND ELECTRIC COMPANY<br />
(2) A Resubmission<br />
04/08/2011<br />
CONSTRUCTION WORK IN PROGRESS - - ELECTRIC (Account 107)<br />
Year/Period of Report<br />
End of <strong>2010</strong>/Q4<br />
1. Report below descriptions <strong>and</strong> balances at end of year of projects in process of construction (107)<br />
2. Show items relating to "research, development, <strong>and</strong> demonstration" projects last, under a caption Research, Development, <strong>and</strong> Demonstrating (see<br />
Account 107 of the Uniform System of Accounts)<br />
3. Minor projects (5% of the Balance End of the Year for Account 107 or $1,000,000, whichever is less) may be grouped.<br />
Line<br />
No.<br />
1<br />
2<br />
3<br />
4<br />
5<br />
6<br />
7<br />
8<br />
9<br />
10<br />
11<br />
12<br />
13<br />
14<br />
15<br />
16<br />
17<br />
18<br />
19<br />
20<br />
21<br />
22<br />
23<br />
24<br />
25<br />
26<br />
27<br />
28<br />
29<br />
30<br />
31<br />
32<br />
33<br />
34<br />
35<br />
36<br />
37<br />
38<br />
39<br />
40<br />
41<br />
42<br />
Description of Project Construction work in progress -<br />
<strong>Electric</strong> (Account 107)<br />
(a)<br />
(b)<br />
5738901 McMullin-Kearney 230 kV Reconductor<br />
1,925,226<br />
5733245 Trans Rep Wood Poles_EPC Contract<br />
1,913,611<br />
5737998 COM:Unattended Pathway<br />
1,855,248<br />
5722499 Fort Ord Substation, Bus Regulator<br />
1,852,422<br />
5726809 Atwater Bank 1 115kv-12kv, 45 MVA LTC<br />
1,843,819<br />
5735945 Madera MPAC<br />
1,833,353<br />
5734001 Henrietta Sub: Install New Bank<br />
1,825,225<br />
5736134 Tulare Lake Sub: Inst new Bank<br />
1,797,171<br />
5506253 JIT Replace Transformers<br />
1,796,299<br />
5733990 Glenn Sub: Install Bank 3<br />
1,789,743<br />
5731018 Tesla - Salado - Manteca 115 kV Reconductor<br />
1,771,507<br />
5722558 DeSabla Philbrook Refurb. Spill Channel<br />
1,768,838<br />
5727142 Belmont Sub:Repl 115-12kV Bank2<br />
1,748,951<br />
5506282 JIT Replace Miscellaneous Equipment<br />
1,743,488<br />
5733504 Divide 115 kV MPAC<br />
1,741,198<br />
5733513 Bellota 115 kV MPAC<br />
1,736,693<br />
5505580 Work at the Request of Others Partially Reimb.-CC<br />
1,684,865<br />
5732691 Brighton 115 kV MPAC<br />
1,670,426<br />
5724539 Helm - Replace Exciters<br />
1,663,941<br />
5503191 Mission-City Reliability<br />
1,610,092<br />
5717279 Work at the Request of Others Rule 20A - De Anza<br />
1,579,302<br />
5724399 Drum 1&2 Penstock Tunnel Replacement<br />
1,568,726<br />
5733929 Replace Clayton Bank #1 <strong>and</strong> new feeder<br />
1,550,034<br />
5732978 Sacramento-Caribou#1 60kVBusRecon&SCADAIns<br />
1,543,407<br />
5732986 Moss L<strong>and</strong>ing: convert 230 kV bus to BAAH<br />
1,542,536<br />
5729171 Yosemite Madera: Install Bank/Feeder<br />
1,538,937<br />
5733803 Pease Sub: Repl Failed Reg #2<br />
1,530,445<br />
5738220 Wheeler Ridge 70 kV MPAC<br />
1,503,886<br />
5738000 COM:Last Access Control<br />
1,499,144<br />
5733933 Instll Nortch Bnk#2 for Cisco Sys Exp<br />
1,493,031<br />
5707549 Windsor Sub: L<strong>and</strong> (Fulton DPA)<br />
1,489,917<br />
5727860 U1:Replace Eagle-21 System (I&COM)<br />
1,438,277<br />
5720874 Balch 2 U3 Replace Exciter<br />
1,431,518<br />
5720780 Pit 345 LC Recreation<br />
1,428,387<br />
5726838 U1:Mod Control Room Ventilation<br />
1,428,291<br />
5724538 Helms - Replace Governors<br />
1,414,391<br />
5739631 BURNS 60/24 KV, 10 MVA, BK 1 Emerge<br />
1,410,711<br />
5738728 Cottle MPAC 230kv<br />
1,407,339<br />
5732985 Moss L<strong>and</strong>ing: convert 115 kV bus to BAAH<br />
1,395,097<br />
5730184 Wheeler Ridge 230/70 kV Transfor Install<br />
1,363,754<br />
5731362 Hydro SCADA - Life Cycle Replacement<br />
1,363,482<br />
5726618 Newark-Ravenswood 230kV Reconductor<br />
1,361,372<br />
43 TOTAL 1,016,902,985<br />
<strong>FERC</strong> FORM NO. 1 (ED. 12-87) Page 216.3
Name of Respondent<br />
This Report Is:<br />
Date of Report<br />
(1) X An Original<br />
(Mo, Da, Yr)<br />
PACIFIC GAS AND ELECTRIC COMPANY<br />
(2) A Resubmission<br />
04/08/2011<br />
CONSTRUCTION WORK IN PROGRESS - - ELECTRIC (Account 107)<br />
Year/Period of Report<br />
End of <strong>2010</strong>/Q4<br />
1. Report below descriptions <strong>and</strong> balances at end of year of projects in process of construction (107)<br />
2. Show items relating to "research, development, <strong>and</strong> demonstration" projects last, under a caption Research, Development, <strong>and</strong> Demonstrating (see<br />
Account 107 of the Uniform System of Accounts)<br />
3. Minor projects (5% of the Balance End of the Year for Account 107 or $1,000,000, whichever is less) may be grouped.<br />
Line<br />
No.<br />
1<br />
2<br />
3<br />
4<br />
5<br />
6<br />
7<br />
8<br />
9<br />
10<br />
11<br />
12<br />
13<br />
14<br />
15<br />
16<br />
17<br />
18<br />
19<br />
20<br />
21<br />
22<br />
23<br />
24<br />
25<br />
26<br />
27<br />
28<br />
29<br />
30<br />
31<br />
32<br />
33<br />
34<br />
35<br />
36<br />
37<br />
38<br />
39<br />
40<br />
41<br />
42<br />
Description of Project Construction work in progress -<br />
<strong>Electric</strong> (Account 107)<br />
(a)<br />
(b)<br />
5723320 ED-EOO-Fresno Control Center Rel.-Fac<br />
1,321,119<br />
5736541 Helms - U2 Repl. Wicket Gate Bushings<br />
1,317,589<br />
5738592 Ripon 115kV MPAC<br />
1,316,679<br />
5733925 46-Replace Konocti Bank #1<br />
1,313,559<br />
5736401 Centerville Rebuild TSV & Wickets<br />
1,302,032<br />
5728898 Pittsburg-Tesla 230 kV Reconductoring<br />
1,285,228<br />
5738301 Gill Ranch Transmission<br />
1,249,400<br />
5507181 SA-60-230 KV Protection Relays Replacements<br />
1,246,909<br />
5738059 09-<strong>2010</strong> MRTU projects<br />
1,236,539<br />
5735941 Cooley L<strong>and</strong>ing MPAC<br />
1,222,032<br />
5509219 Pole Replacement - North Region<br />
1,220,557<br />
5508934 Cable Replacement - ERR - Diablo<br />
1,210,273<br />
5503196 Diablo-City Reliability<br />
1,198,450<br />
5732728 Humboldt Sub: 60 kV BAAH in GIS<br />
1,198,118<br />
5733840 Livingston 115 kV MPAC<br />
1,193,549<br />
5738574 Wheeler Ridge 230/115 kV MPAC<br />
1,189,682<br />
5726604 Humboldt Sub - 60 kV MPAC<br />
1,169,372<br />
5732722 Sacramento - Nicolaus-Wilkins Slough 60kV<br />
1,142,356<br />
5738593 Sneath Lane 60 kV MPAC<br />
1,113,900<br />
5737462 Reclamation District 2047: Replace Bank 1<br />
1,107,642<br />
5733783 San Mateo 115 kV ECC Auto<br />
1,104,245<br />
5719003 Spring Gap St LC-S<strong>and</strong>Bar Dam Fish Scrns<br />
1,103,202<br />
5734791 COM:Upgrade EP Dose Assessment-MIDA<br />
1,095,804<br />
5738362 Fort Ord 60 kV MPAC<br />
1,090,805<br />
5507179 SA-Install SCADA/RTUs<br />
1,078,065<br />
5721863 San Benito Sub: Install Bank 1<br />
1,052,465<br />
5507683 Replace UG Pumping Stations<br />
1,050,212<br />
5507699 Rebuild Transmission Line<br />
1,047,400<br />
5720779 Battle Cr Salmon/Steelhead Phase 1<br />
1,040,599<br />
5737658 East Gr<strong>and</strong> - Bank 1 115kV Bus Upgrade<br />
1,040,405<br />
5729482 06-2008 Lockheed New 12kV Feeder Net App<br />
1,026,765<br />
5730478 McCloud Dam LLO Improvements<br />
1,021,956<br />
Aggregate total of projects with less than $1,000,000 in actual costs in CWIP<br />
172,231,406<br />
43 TOTAL 1,016,902,985<br />
<strong>FERC</strong> FORM NO. 1 (ED. 12-87) Page 216.4
Name of Respondent<br />
This Report Is:<br />
Date of Report<br />
Year/Period of Report<br />
(1) X An Original<br />
(Mo, Da, Yr)<br />
PACIFIC GAS AND ELECTRIC COMPANY<br />
End of <strong>2010</strong>/Q4<br />
(2) A Resubmission<br />
04/08/2011<br />
ACCUMULATED PROVISION FOR DEPRECIATION OF ELECTRIC UTILITY PLANT (Account 108)<br />
1. Explain in a footnote any important adjustments during year.<br />
2. Explain in a footnote any difference between the amount for book cost of plant retired, Line 11, column (c), <strong>and</strong> that reported for<br />
electric plant in service, pages 204-207, column 9d), excluding retirements of non-depreciable property.<br />
3. The provisions of Account 108 in the Uniform System of accounts require that retirements of depreciable plant be recorded when<br />
such plant is removed from service. If the respondent has a significant amount of plant retired at year end which has not been recorded<br />
<strong>and</strong>/or classified to the various reserve functional classifications, make preliminary closing entries to tentatively functionalize the book<br />
cost of the plant retired. In addition, include all costs included in retirement work in progress at year end in the appropriate functional<br />
classifications.<br />
4. Show separately interest credits under a sinking fund or similar method of depreciation accounting.<br />
Line<br />
No.<br />
Item<br />
(a)<br />
Section A. Balances <strong>and</strong> Changes During Year<br />
Total<br />
<strong>Electric</strong> Plant in<br />
(c+d+e)<br />
Service<br />
(b)<br />
(c)<br />
<strong>Electric</strong> Plant Held<br />
for Future Use<br />
(d)<br />
<strong>Electric</strong> Plant<br />
Leased to Others<br />
(e)<br />
1 Balance Beginning of Year<br />
17,533,279,224 17,533,279,224<br />
2 Depreciation Provisions for Year, Charged to<br />
3 (403) Depreciation Expense<br />
1,003,132,970 1,003,132,970<br />
4 (403.1) Depreciation Expense for Asset<br />
Retirement Costs<br />
5 (413) Exp. of Elec. Plt. Leas. to Others<br />
6 Transportation Expenses-Clearing<br />
7 Other Clearing Accounts<br />
8 Other Accounts (Specify, details in footnote):<br />
9 Reverse Common Allocation<br />
-109,080,147 -109,080,147<br />
10 TOTAL Deprec. Prov for Year (Enter Total of<br />
894,052,823 894,052,823<br />
lines 3 thru 9)<br />
11 Net Charges for Plant Retired:<br />
12 Book Cost of Plant Retired<br />
331,047,376 331,047,376<br />
13 Cost of Removal<br />
156,136,900 156,136,900<br />
14 Salvage (Credit)<br />
16,747,378 16,747,378<br />
15 TOTAL Net Chrgs. for Plant Ret. (Enter Total<br />
470,436,898 470,436,898<br />
of lines 12 thru 14)<br />
16 Other Debit or Cr. Items (Describe, details in<br />
59,910,182 59,910,182<br />
footnote):<br />
17<br />
18 Book Cost or Asset Retirement Costs Retired<br />
19 Balance End of Year (Enter Totals of lines 1,<br />
18,016,805,331 18,016,805,331<br />
10, 15, 16, <strong>and</strong> 18)<br />
Section B. Balances at End of Year According to Functional Classification<br />
20 Steam Production<br />
244,221,285 244,221,285<br />
21 Nuclear Production<br />
5,531,425,530 5,531,425,530<br />
22 Hydraulic Production-Conventional<br />
1,154,107,951 1,154,107,951<br />
23 Hydraulic Production-Pumped Storage<br />
794,066,870 794,066,870<br />
24 Other Production<br />
19,245,748 19,245,748<br />
25 Transmission<br />
1,980,212,002 1,980,212,002<br />
26 Distribution<br />
7,779,678,286 7,779,678,286<br />
27 Regional Transmission <strong>and</strong> Market Operation<br />
28 General<br />
513,847,659 513,847,659<br />
29 TOTAL (Enter Total of lines 20 thru 28)<br />
18,016,805,331 18,016,805,331<br />
<strong>FERC</strong> FORM NO. 1 (REV. 12-05)<br />
Page 219
Name of Respondent<br />
PACIFIC GAS AND ELECTRIC COMPANY<br />
This Report is:<br />
(1) X An Original<br />
(2) A Resubmission<br />
Date of Report<br />
(Mo, Da, Yr)<br />
04/08/2011<br />
Year/Period of Report<br />
<strong>2010</strong>/Q4<br />
FOOTNOTE DATA<br />
Schedule Page: 219 Line No.: 12 Column: c<br />
This reconciles with the cost of plant retired shown on pages 204-207, column d, as<br />
follows:<br />
Book cost of depreciable plant<br />
retired<br />
331,047,376<br />
Rounding (1)<br />
Total 331,047,375<br />
Schedule Page: 219 Line No.: 16 Column: c<br />
This consists of the following:<br />
Decommissioning reclass to Regulatory Liability<br />
(Nuclear & Fossil)<br />
10,942,439<br />
FAS 143 Assets Depreciation (Nuclear & Fossil) 17,809,043<br />
FIN 47 Asset Depreciation (EDP, EHP, ETP) (853,676)<br />
Capital Lease Obligations 31,976,896<br />
Fleet A/D Reclass from Common (85,640)<br />
Mirant Reclass 2,059,472<br />
Gain or Loss (3,466,454)<br />
Adjustment to prior year's amount 1,528,102<br />
Total 59,910,182<br />
Schedule Page: 219 Line No.: 28 Column: c<br />
FAS 109 gross-up on Diablo Canyon Power Plant Utility Asset I is included in General<br />
Plant.<br />
<strong>FERC</strong> FORM NO. 1 (ED. 12-87) Page 450.1
Name of Respondent<br />
PACIFIC GAS AND ELECTRIC COMPANY<br />
Line<br />
No.<br />
This Report Is:<br />
Date of Report<br />
(1) X An Original<br />
(Mo, Da, Yr)<br />
(2) A Resubmission<br />
04/08/2011<br />
INVESTMENTS IN SUBSIDIARY COMPANIES (Account 123.1)<br />
Description of Investment<br />
(a)<br />
Date Acquired<br />
(b)<br />
Date Of<br />
Maturity<br />
(c)<br />
Year/Period of Report<br />
End of <strong>2010</strong>/Q4<br />
1. Report below investments in Accounts 123.1, investments in Subsidiary Companies.<br />
2. Provide a subheading for each company <strong>and</strong> List there under the information called for below. Sub - TOTAL by company <strong>and</strong> give a TOTAL in<br />
columns (e),(f),(g) <strong>and</strong> (h)<br />
(a) Investment in Securities - List <strong>and</strong> describe each security owned. For bonds give also principal amount, date of issue, maturity <strong>and</strong> interest rate.<br />
(b) Investment Advances - Report separately the amounts of loans or investment advances which are subject to repayment, but which are not subject to<br />
current settlement. With respect to each advance show whether the advance is a note or open account. List each note giving date of issuance, maturity<br />
date, <strong>and</strong> specifying whether note is a renewal.<br />
3. Report separately the equity in undistributed subsidiary earnings since acquisition. The TOTAL in column (e) should equal the amount entered for<br />
Account 418.1.<br />
1<br />
2<br />
3<br />
4<br />
5<br />
6<br />
7<br />
8<br />
9<br />
10<br />
11<br />
12<br />
13<br />
14<br />
15<br />
16<br />
17<br />
18<br />
19<br />
20<br />
21<br />
22<br />
23<br />
24<br />
25<br />
26<br />
27<br />
28<br />
29<br />
30<br />
31<br />
32<br />
33<br />
34<br />
35<br />
36<br />
37<br />
38<br />
39<br />
40<br />
41<br />
Calaska Energy <strong>Company</strong><br />
Common Stock<br />
Additional Paid in Capital<br />
Undistributed Earnings<br />
SUBTOTAL<br />
Eureka Energy <strong>Company</strong><br />
Common Stock<br />
Additional Paid in Capital<br />
Undistributed Earnings<br />
SUBTOTAL<br />
Natural <strong>Gas</strong> Corporation of California<br />
Common Stock<br />
Additional Paid in Capital<br />
Undistributed Earnings<br />
SUBTOTAL<br />
<strong>Pacific</strong> Conservation Services <strong>Company</strong><br />
Common Stock<br />
Undistributed Earnings<br />
SUBTOTAL<br />
<strong>Pacific</strong> <strong>Gas</strong> Properties <strong>Company</strong><br />
Common Stock<br />
Additional Paid in Capital<br />
Undistributed Earnings<br />
SUBTOTAL<br />
<strong>Pacific</strong> Energy Fuels <strong>Company</strong><br />
Common Stock<br />
Undistributed Earnings<br />
SUBTOTAL<br />
1978<br />
1978<br />
1954<br />
1982<br />
1988<br />
1989<br />
Amount of Investment at<br />
Beginning of Year<br />
(d)<br />
1,000<br />
17,240,668<br />
-18,448,826<br />
-1,207,158<br />
1,000<br />
4,000,000<br />
397,901<br />
4,398,901<br />
100,000<br />
10,618,000<br />
-3,148,217<br />
7,569,783<br />
10,000<br />
150,057<br />
160,057<br />
10,000<br />
10,000<br />
-10,698,496<br />
-10,678,496<br />
10,000<br />
-1,282,110<br />
-1,272,110<br />
42 Total Cost of Account 123.1 $ 38<br />
TOTAL 133,708,094<br />
<strong>FERC</strong> FORM NO. 1 (ED. 12-89) Page 224
Name of Respondent<br />
PACIFIC GAS AND ELECTRIC COMPANY<br />
Line<br />
No.<br />
This Report Is:<br />
Date of Report<br />
(1) X An Original<br />
(Mo, Da, Yr)<br />
(2) A Resubmission<br />
04/08/2011<br />
INVESTMENTS IN SUBSIDIARY COMPANIES (Account 123.1)<br />
Description of Investment<br />
(a)<br />
Date Acquired<br />
(b)<br />
Date Of<br />
Maturity<br />
(c)<br />
Year/Period of Report<br />
End of <strong>2010</strong>/Q4<br />
1. Report below investments in Accounts 123.1, investments in Subsidiary Companies.<br />
2. Provide a subheading for each company <strong>and</strong> List there under the information called for below. Sub - TOTAL by company <strong>and</strong> give a TOTAL in<br />
columns (e),(f),(g) <strong>and</strong> (h)<br />
(a) Investment in Securities - List <strong>and</strong> describe each security owned. For bonds give also principal amount, date of issue, maturity <strong>and</strong> interest rate.<br />
(b) Investment Advances - Report separately the amounts of loans or investment advances which are subject to repayment, but which are not subject to<br />
current settlement. With respect to each advance show whether the advance is a note or open account. List each note giving date of issuance, maturity<br />
date, <strong>and</strong> specifying whether note is a renewal.<br />
3. Report separately the equity in undistributed subsidiary earnings since acquisition. The TOTAL in column (e) should equal the amount entered for<br />
Account 418.1.<br />
1<br />
2<br />
3<br />
4<br />
5<br />
6<br />
7<br />
8<br />
9<br />
10<br />
11<br />
12<br />
13<br />
14<br />
15<br />
16<br />
17<br />
18<br />
19<br />
20<br />
21<br />
22<br />
23<br />
24<br />
25<br />
26<br />
27<br />
28<br />
29<br />
30<br />
31<br />
32<br />
33<br />
34<br />
35<br />
36<br />
37<br />
38<br />
39<br />
40<br />
41<br />
St<strong>and</strong>ard <strong>Pacific</strong> <strong>Gas</strong> Line Incorporated<br />
Common Stock<br />
Additional Paid in Capital<br />
Undistributed Earnings<br />
Advances: Note<br />
Note<br />
Note<br />
Note<br />
Note<br />
Note<br />
Note<br />
Less: Accumulated <strong>Gas</strong> Line Depreciation<br />
SUBTOTAL<br />
PG&E Energy Recovery Funding LLC<br />
Additional Paid in Capital<br />
Undistributed Earnings<br />
SUBTOTAL<br />
PG&E Housing Fund<br />
Additional Paid in Capital<br />
Undistributed Earnings<br />
SUBTOTAL<br />
Midway Power LLC<br />
Additional Paid in Capital<br />
Undistributed Earnings<br />
SUBTOTAL<br />
1930-32<br />
1954<br />
05-09-88<br />
09-06-88<br />
12-30-88<br />
08-22-89<br />
10-09-90<br />
02-25-92<br />
12-01-93<br />
2004<br />
2004<br />
2008<br />
Dem<strong>and</strong><br />
Dem<strong>and</strong><br />
Dem<strong>and</strong><br />
Dem<strong>and</strong><br />
Dem<strong>and</strong><br />
Dem<strong>and</strong><br />
Amount of Investment at<br />
Beginning of Year<br />
(d)<br />
1,200<br />
16,157,021<br />
5,962,799<br />
1,127,868<br />
2,580,000<br />
8,712,308<br />
2,880,000<br />
4,200,000<br />
3,300,000<br />
1,518,000<br />
-26,659,988<br />
19,779,208<br />
28,629,378<br />
47,652,526<br />
76,281,904<br />
45,206,278<br />
-27,075,809<br />
18,130,469<br />
25,144,364<br />
-4,598,828<br />
20,545,536<br />
42 Total Cost of Account 123.1 $ 38<br />
TOTAL 133,708,094<br />
<strong>FERC</strong> FORM NO. 1 (ED. 12-89) Page 224.1
Name of Respondent<br />
This Report Is:<br />
Date of Report<br />
(1) X An Original<br />
(Mo, Da, Yr)<br />
PACIFIC GAS AND ELECTRIC COMPANY<br />
(2) A Resubmission<br />
04/08/2011<br />
INVESTMENTS IN SUBSIDIARY COMPANIES (Account 123.1) (Continued)<br />
Year/Period of Report<br />
End of <strong>2010</strong>/Q4<br />
4. For any securities, notes, or accounts that were pledged designate such securities, notes, or accounts in a footnote, <strong>and</strong> state the name of pledgee<br />
<strong>and</strong> purpose of the pledge.<br />
5. If Commission approval was required for any advance made or security acquired, designate such fact in a footnote <strong>and</strong> give name of Commission,<br />
date of authorization, <strong>and</strong> case or docket number.<br />
6. Report column (f) interest <strong>and</strong> dividend revenues form investments, including such revenues form securities disposed of during the year.<br />
7. In column (h) report for each investment disposed of during the year, the gain or loss represented by the difference between cost of the investment (or<br />
the other amount at which carried in the books of account if difference from cost) <strong>and</strong> the selling price thereof, not including interest adjustment includible<br />
in column (f).<br />
8. Report on Line 42, column (a) the TOTAL cost of Account 123.1<br />
Equity in Subsidiary<br />
Revenues for Year<br />
Amount of Investment at Gain or Loss from Investment<br />
Earnings of Year<br />
(e) (f)<br />
End of Year<br />
(g)<br />
Disposed of<br />
(h)<br />
Line<br />
No.<br />
1,000 2<br />
17,240,668 3<br />
-2,290 -18,451,116<br />
4<br />
-2,290 -1,209,448<br />
6<br />
1,000 9<br />
4,000,000 10<br />
175,898 573,799<br />
11<br />
175,898 4,574,799<br />
13<br />
100,000 16<br />
10,618,000 17<br />
7,087 -3,141,130<br />
18<br />
7,087 7,576,870<br />
20<br />
10,000 23<br />
-829 149,228<br />
24<br />
-829 159,228<br />
26<br />
10,000 29<br />
10,000 30<br />
-12,405 -10,710,901<br />
31<br />
-12,405 -10,690,901<br />
33<br />
10,000 36<br />
273,926 -1,635,005<br />
37<br />
273,926 -1,625,005<br />
39<br />
1<br />
5<br />
7<br />
8<br />
12<br />
14<br />
15<br />
19<br />
21<br />
22<br />
25<br />
27<br />
28<br />
32<br />
34<br />
35<br />
38<br />
40<br />
41<br />
-17,426,049 115,151,066<br />
42<br />
<strong>FERC</strong> FORM NO. 1 (ED. 12-89) Page 225
Name of Respondent<br />
This Report Is:<br />
Date of Report<br />
(1) X An Original<br />
(Mo, Da, Yr)<br />
PACIFIC GAS AND ELECTRIC COMPANY<br />
(2) A Resubmission<br />
04/08/2011<br />
INVESTMENTS IN SUBSIDIARY COMPANIES (Account 123.1) (Continued)<br />
Year/Period of Report<br />
End of <strong>2010</strong>/Q4<br />
4. For any securities, notes, or accounts that were pledged designate such securities, notes, or accounts in a footnote, <strong>and</strong> state the name of pledgee<br />
<strong>and</strong> purpose of the pledge.<br />
5. If Commission approval was required for any advance made or security acquired, designate such fact in a footnote <strong>and</strong> give name of Commission,<br />
date of authorization, <strong>and</strong> case or docket number.<br />
6. Report column (f) interest <strong>and</strong> dividend revenues form investments, including such revenues form securities disposed of during the year.<br />
7. In column (h) report for each investment disposed of during the year, the gain or loss represented by the difference between cost of the investment (or<br />
the other amount at which carried in the books of account if difference from cost) <strong>and</strong> the selling price thereof, not including interest adjustment includible<br />
in column (f).<br />
8. Report on Line 42, column (a) the TOTAL cost of Account 123.1<br />
Equity in Subsidiary<br />
Revenues for Year<br />
Amount of Investment at Gain or Loss from Investment<br />
Earnings of Year<br />
(e) (f)<br />
End of Year<br />
(g)<br />
Disposed of<br />
(h)<br />
Line<br />
No.<br />
1,200 2<br />
16,157,021 3<br />
-112,424 5,850,375<br />
4<br />
1,127,868 5<br />
2,580,000 6<br />
8,712,308 7<br />
2,880,000 8<br />
4,200,000 9<br />
3,300,000 10<br />
1,518,000 11<br />
-27,304,974 12<br />
-112,424 19,021,798<br />
14<br />
28,629,378 17<br />
-6,616,434 41,036,092<br />
18<br />
-6,616,434 69,665,470<br />
20<br />
45,259,041 23<br />
-1,107,424 -28,183,233<br />
24<br />
-1,107,424 17,075,808<br />
26<br />
25,232,429 29<br />
-10,031,154 -14,629,982<br />
30<br />
-10,031,154 10,602,447<br />
32<br />
1<br />
13<br />
15<br />
16<br />
19<br />
21<br />
22<br />
25<br />
27<br />
28<br />
31<br />
33<br />
34<br />
35<br />
36<br />
37<br />
38<br />
39<br />
40<br />
41<br />
-17,426,049 115,151,066<br />
42<br />
<strong>FERC</strong> FORM NO. 1 (ED. 12-89) Page 225.1
Name of Respondent<br />
PACIFIC GAS AND ELECTRIC COMPANY<br />
Line<br />
No.<br />
This Report Is:<br />
(1) X An Original<br />
(2) A Resubmission<br />
MATERIALS AND SUPPLIES<br />
Date of Report<br />
(Mo, Da, Yr)<br />
04/08/2011<br />
Account Balance Balance<br />
Beginning of Year<br />
End of Year<br />
(a)<br />
(b)<br />
(c)<br />
Year/Period of Report<br />
End of<br />
<strong>2010</strong>/Q4<br />
1. For Account 154, report the amount of plant materials <strong>and</strong> operating supplies under the primary functional classifications as indicated in column (a);<br />
estimates of amounts by function are acceptable. In column (d), designate the department or departments which use the class of material.<br />
2. Give an explanation of important inventory adjustments during the year (in a footnote) showing general classes of material <strong>and</strong> supplies <strong>and</strong> the<br />
various accounts (operating expenses, clearing accounts, plant, etc.) affected debited or credited. Show separately debit or credits to stores expense<br />
clearing, if applicable.<br />
1 Fuel Stock (Account 151)<br />
2 Fuel Stock Expenses Undistributed (Account 152)<br />
3 Residuals <strong>and</strong> Extracted Products (Account 153)<br />
4 Plant Materials <strong>and</strong> Operating Supplies (Account 154)<br />
5 Assigned to - Construction (Estimated)<br />
6 Assigned to - Operations <strong>and</strong> Maintenance<br />
7 Production Plant (Estimated)<br />
8 Transmission Plant (Estimated)<br />
9 Distribution Plant (Estimated)<br />
10 Regional Transmission <strong>and</strong> Market Operation Plant<br />
(Estimated)<br />
11 Assigned to - Other (provide details in footnote)<br />
12 TOTAL Account 154 (Enter Total of lines 5 thru 11)<br />
13 Merch<strong>and</strong>ise (Account 155)<br />
14 Other Materials <strong>and</strong> Supplies (Account 156)<br />
15 Nuclear Materials Held for Sale (Account 157) (Not<br />
applic to <strong>Gas</strong> Util)<br />
16 Stores Expense Undistributed (Account 163)<br />
17<br />
18<br />
19<br />
20 TOTAL Materials <strong>and</strong> Supplies (Per Balance Sheet)<br />
403,420 1,143,343 ELECTRIC<br />
52,187,387 53,670,031 ALL<br />
62,003,539 62,734,627 ALL<br />
8,973,421 8,622,223 ALL<br />
76,369,854 80,176,065 ALL<br />
199,534,201 205,202,946<br />
199,937,621 206,346,289<br />
Department or<br />
Departments which<br />
Use Material<br />
(d)<br />
<strong>FERC</strong> FORM NO. 1 (REV. 12-05)<br />
Page 227
Name of Respondent<br />
PACIFIC GAS AND ELECTRIC COMPANY<br />
This Report Is:<br />
Date of Report<br />
(1) X An Original<br />
(Mo, Da, Yr)<br />
(2) A Resubmission<br />
04/08/2011<br />
Transmission Service <strong>and</strong> Generation Interconnection Study Costs<br />
7. In column (e) report the account credited with the reimbursement received for performing the study.<br />
Line<br />
Costs Incurred During<br />
No.<br />
Description<br />
Period<br />
Account Charged<br />
(a)<br />
(b)<br />
(c)<br />
Reimbursements<br />
Received During<br />
the Period<br />
(d)<br />
Year/Period of Report<br />
End of <strong>2010</strong>/Q4<br />
1. Report the particulars (details) called for concerning the costs incurred <strong>and</strong> the reimbursements received for performing transmission service <strong>and</strong><br />
generator interconnection studies.<br />
2. List each study separately.<br />
3. In column (a) provide the name of the study.<br />
4. In column (b) report the cost incurred to perform the study at the end of period.<br />
5. In column (c) report the account charged with the cost of the study.<br />
6. In column (d) report the amounts received for reimbursement of the study costs at end of period.<br />
1<br />
2<br />
3<br />
4<br />
5<br />
6<br />
7<br />
8<br />
9<br />
10<br />
11<br />
12<br />
13<br />
14<br />
15<br />
16<br />
17<br />
18<br />
19<br />
20<br />
21<br />
22<br />
23<br />
24<br />
25<br />
26<br />
27<br />
28<br />
29<br />
30<br />
31<br />
32<br />
33<br />
34<br />
35<br />
36<br />
37<br />
38<br />
39<br />
40<br />
Transmission Studies<br />
TOTAL TRANSMISSION STUDIES<br />
(See details in the footnotes) 97,078 186 100,000 186<br />
Generation Studies<br />
TOTAL GENERATION STUDIES<br />
(See details in the footnotes) 2,255,086 186 2,491,895 186<br />
GRAND TOTAL 2,352,164<br />
2,591,895<br />
Account Credited<br />
With Reimbursement<br />
(e)<br />
<strong>FERC</strong> FORM NO. 1/1-F/3-Q (NEW. 03-07) Page 231
Name of Respondent<br />
PACIFIC GAS AND ELECTRIC COMPANY<br />
This Report is:<br />
(1) X An Original<br />
(2) A Resubmission<br />
Date of Report<br />
(Mo, Da, Yr)<br />
04/08/2011<br />
Year/Period of Report<br />
<strong>2010</strong>/Q4<br />
FOOTNOTE DATA<br />
Schedule Page: 231 Line No.: 25 Column: a<br />
The <strong>FERC</strong> format for page 231 requires the reporting of costs incurred <strong>and</strong> reimbursements received during the<br />
period. The additional information below summarizes the balances <strong>and</strong> activities of each study cost from<br />
December 31, 2008 through December 31, 2009<br />
Cost Reimburse- Net<br />
Incurred ments Activity<br />
Balance in Period Received Period Balance in<br />
Acct 186 Ended Period Ended Ended Acct 186<br />
Description at 12/31/09 12/31/10 12/31/10 12/31/10 12/31/10<br />
TRANSMISSION STUDIES<br />
9710341 WL-City of Roseville System Impact Study (19,928) 0 0 0 (19,928)<br />
9712247 WL-Red Bluff 6-MW Reclamation Pump Plant 3,505 12,606 0 12,606 16,111<br />
9712380 WL-Kirkwd Meadows PUD Interconnect-SIS 3,118 33,228 30,000 3,228 6,346<br />
9712460 WL-Hercules Muni Utl Inter-SIS 1,038 24,179 0 24,180 25,218<br />
9712982 WL - Tesla Tracy 230kV Line 1 Reloc-SIS 0 3,703 40,000 (36,297) (36,297)<br />
9713185 WG - LMUD Susanville Biomass Project-SIS 0 13,280 30,000 (16,720) (16,720)<br />
9713260 WL - Hercules Muni Utilities Inter-FAS 0 571 0 571 571<br />
9713955 WL - Tesla Tracy 230kV Line 1 Reloc-FAS 0 8,072 0 8,072 8,072<br />
9714755 WL - KMPUD-IFAS 0 1,439 0 1,439 1,439<br />
Total Transmission Studies (12,267) 97,078 100,000 (2,921) (15,188)<br />
GENERATION STUDIES<br />
9710020 WG-JG Boswell (Rule 21) DI Study (11,453) 0 0 0 (11,453)<br />
9710302 WG-Inergy Propane (Rule 21) DI Study (27,609) 0 0 0 (27,609)<br />
9710360 WG-USE Powerflow, Base Cases & Conting. 50,400 0 0 0 50,400<br />
9710361 WG-Viasyn Stability Study (ISIS) 12,400 0 0 0 12,400<br />
9710382 WG-Western GeoPower Unit 1 - IFAS 54,901 0 0 0 54,901<br />
9710481 WG-Cal Poly - DIS (Rule 21) (17,545) 0 0 0 (17,545)<br />
9710603 WG-Bear River Ridge - IFAS 27,951 0 27,951 (27,951) 0<br />
9710641 WG- Jacob Canal Project- Sys. Imp. Study 21,649 0 21,649 (21,649) 0<br />
9710683 Atwell Isl<strong>and</strong> PV Solar IFS 42,600 0 42,600 (42,600) 0<br />
9710687 WG - Stockton Generation IFAS 19,358 0 19,358 (19,358) 0<br />
9710688 WG - Stockton Generation Expansion IFAS 8,190 0 8,190 (8,190) 0<br />
9710741 WG-Navigant Third Party Study Support 1,962 0 0 0 1,962<br />
9710764 WG-Laurel East ISIS 9,783 0 9,783 (9,783) 0<br />
9710766 WG-Laurel West - ISIS 9,731 0 9,731 (9,731) 0<br />
9710780 WG-California PV IFAS 44,124 0 44,124 (44,124) 0<br />
9710861 WG-Alpaugh North - ISIS 110,767 91,760 0 91,760 202,527<br />
9710862 WG-Carrizo Plain - IFAS 14,917 0 14,917 (14,917) 0<br />
9710980 WG-Transition Cluster Projects-Phase 1 584,529 100,493 708,684 (608,191) (23,662)<br />
9711082 WG-Redwood L<strong>and</strong>fill Project ISI Study 12,640 9,030 12,640 (3,610) 9,030<br />
9711360 WG-Ameresco Butte L<strong>and</strong>fill Prj.Scope Mtg 11,490 0 0 0 11,490<br />
9711361 WG-KRCD - 2nd ISIS Re-study 12,107 0 0 0 12,107<br />
9711402 Santa Cruz L<strong>and</strong>fill (10,000) 0 0 0 (10,000)<br />
9711404 WG-Rio Bravo Status Eval.Prj. CLAP Calc. (1,777) 0 0 0 (1,777)<br />
9711450 Recurrent Energy - PV - Sunset Reservoir (5,000) 0 (5,000) 5,000 0<br />
9711461 WG-Corcoran PV ISIS Study 15,512 2,410 17,922 (15,512) 0<br />
9711480 Antelope Sub PV (81) 0 (81) 81 0<br />
9711481 Blackwell Sub PV 2,799 0 2,799 (2,799) 0<br />
9711500 WG-White River PV Project - Scoping Mtg. 268 0 268 (268) 0<br />
9711501 WG-White River PV Project - ISIS Study 21,217 1,416 22,634 (21,218) (1)<br />
9711563 WG-Ameresco Butte County project - IFAS 6,128 0 0 0 6,128<br />
9711580 Bena L<strong>and</strong>fill (698) 0 (698) 698 0<br />
9711620 WG-EE Support-Contra Costa Gen.Station 12,603 2,683 30,000 (27,317) (14,714)<br />
9711621 G2 Energy, Ostrom Rd - Addt'l Gen 1,432 0 0 0 1,432<br />
9711622 City of Santa Cruz - Newell Creek Dam (2,500) 0 (2,500) 2,500 0<br />
9711660 Delfern Project 2,754 0 2,754 (2,754) 0<br />
9711680 Recurrent Energy - PV - Sunset Reservoir (2,500) 0 (2,500) 2,500 0<br />
9711681 J&A - Santa Maria II, LLC (3,391) 0 (3,391) 3,391 0<br />
9711682 Cymric Project 1,547 0 1,547 (1,547) 0<br />
9711720 WG-Alpaugh North Project - IFAS 8,079 0 8,079 (8,079) 0<br />
9711820 WG-Buena Vista Re-Powering Prj.Scop.Mtg. 3,455 0 3,455 (3,455) 0<br />
<strong>FERC</strong> FORM NO. 1 (ED. 12-87) Page 450.1
Name of Respondent<br />
PACIFIC GAS AND ELECTRIC COMPANY<br />
This Report is:<br />
(1) X An Original<br />
(2) A Resubmission<br />
Date of Report<br />
(Mo, Da, Yr)<br />
04/08/2011<br />
Year/Period of Report<br />
<strong>2010</strong>/Q4<br />
FOOTNOTE DATA<br />
9711821 WG-Buena Vista Re-Powering Project ISIS 10,887 2,730 10,887 (8,157) 2,730<br />
9711840 Salinas Valley Solid Waste Authority (6,116) 778 0 778 (5,338)<br />
9711860 Avenal L<strong>and</strong> LLC (10mW PV Project) 2,544 0 0 0 2,544<br />
9711861 Facility Study (213) 0 (213) 213 0<br />
9711880 WG-20MW Solar Project#3-ISIS (11,293) 6,070 0 6,070 (5,223)<br />
9711920 WG-Hatchel Ridge Wind Farm Project -SAIS 3,133 0 0 0 3,133<br />
9711922 WG-Montezuma (High Winds III) - AIS 3,096 0 0 0 3,096<br />
9711960 WG-Lost Hills Solar project -SM 14,914 0 14,914 (14,914) 0<br />
9711980 WG-Atwell Isl<strong>and</strong> PV Solar Gen Stn -IFAS 9,291 0 9,291 (9,291) 0<br />
9712000 G2 Energy LLC (Hay Road) (5,000) 1,891 0 1,891 (3,109)<br />
9712020 enXco - Merced Falls (SIS) (5,000) 5,678 678 5,000 0<br />
9712021 enXco - Madera (SIS) (5,000) 8,464 3,464 5,000 0<br />
9712022 enXco - Goose Lake 17,347 6,611 23,958 (17,347) 0<br />
9712023 enXco - Smyrna 12,333 6,892 20,225 (13,333) (1,000)<br />
9712024 Kirby Canyon (5,866) 899 0 899 (4,967)<br />
9712025 Tri Cities (6,000) 0 0 0 (6,000)<br />
9712040 enXco - Smyrna - T 9,896 9,032 19,928 (10,896) (1,000)<br />
9712061 Atwell West PV Solar Gen Facility-ISIS 1,504 8,326 0 8,326 9,830<br />
9712062 Twisselman - SIS (1,000) 14,965 5,000 9,965 8,965<br />
9712064 WG-20MW Solar Project#6-ISIS (21,996) 5,020 0 5,020 (16,976)<br />
9712065 WG-Arco I Solar Project - ISIS 1,755 7,717 0 7,717 9,472<br />
9712080 WG-Arco Solar I Project - Scoping Mtg 2,049 0 2,049 (2,049) 0<br />
9712100 Placer County Water Agency (301) 0 (301) 301 0<br />
9712101 BADGER CREEK DEVELOPMENT 9,542 0 0 0 9,542<br />
9712120 J&A - SANTA MARIA II, LLC (500) 500 0 500 0<br />
9712140 BLACKWELL - Facility Impact Study (5,000) 0 0 0 (5,000)<br />
9712141 LOST HILLS SOLAR PROJECT - ISIS 15,601 9,026 17,697 (8,671) 6,930<br />
9712160 KRCD Community Power Plant - IFAS Re-Stu 5,924 0 0 0 5,924<br />
9712180 BiDart Diary - SIS (1,778) 2,556 778 1,778 0<br />
9712220 SOLAR POWER PARTNERS INC - System Impact (3,357) 6,161 2,805 3,356 (1)<br />
9712240 WG-Buena Vista Biomass Project-IFAS 22,326 2,786 25,113 (22,327) (1)<br />
9712241 WG-Corcoran PV 20 MVA Gen Facility-IFAS 0 5,552 5,552 0 0<br />
9712242 WG-Jacob Canal Solar Farm-IFAS 13,291 1,454 14,648 (13,194) 97<br />
9712243 WG-Laurel West Solar Farm-IFAS 5,046 0 5,046 (5,046) 0<br />
9712244 WG-Laurel East Solar Farm-IFAS 5,623 0 5,623 (5,623) 0<br />
9712245 WG-Cluster 1 Projects-Phase I 21,870 120,914 0 120,914 142,784<br />
9712246 WG-Transition Cluster Project-Phase II 22,068 335,982 0 335,982 358,050<br />
9712248 Rio Bravo WDT - Feasibility 1,819 770 2,589 (1,819) 0<br />
9712272 enXco - ELK HILLS - EVANS (Feasibility) (1,000) 0 0 0 (1,000)<br />
9712273 enXco - SAN BERNARD (Feasibility) (1,000) 0 (1,000) 1,000 0<br />
9712274 ORO LOMA T (SIS) (8,500) 11,570 3,070 8,500 0<br />
9712275 ORO LOMA (SIS) (8,500) 10,534 2,034 8,500 0<br />
9712276 FIREBAUGH (SIS) (8,500) 6,959 (1,541) 8,500 0<br />
9712321 WG-Redwood L<strong>and</strong>fill-IFAS 2,466 21,206 23,673 (2,467) (1)<br />
9712340 White River PV 20MVA Solar Gen-IFAS 0 5,311 5,311 0 0<br />
9712341 Atwell West PV Solar Gen-IFAS 649 6,947 7,596 (649) 0<br />
9712342 EE Avenal 20MW Solar #3-IFAS 1,168 23,233 25,000 (1,767) (599)<br />
9712343 EE Avenal 20MW Solar #6-IFAS 779 14,192 25,000 (10,808) (10,029)<br />
9712400 BioVerde BVE Rosina 1 279 (279) 0 (279) 0<br />
9712401 BioVerde BVE Rosina 2 (1,000) 1,000 0 1,000 0<br />
9712402 BioVerde Corcoran (1,000) 1,000 0 1,000 0<br />
9712403 BioVerde San Joaquin Bycad (824) 824 0 824 0<br />
9712404 BioVerde Kettleman City 1 (West) [SIS] (1,000) 1,000 0 1,000 0<br />
9712405 BioVerde Kettleman City 2 (East) (824) 824 0 824 0<br />
9712406 BioVerde Cloverdale Dairy (379) 379 0 379 0<br />
9712407 BioVerde Lansing Dairy (119) 119 0 119 0<br />
9712408 BioVerde Red Top [SIS] (736) 0 9,961 (9,961) (10,697)<br />
9712409 BioVerde BMY Tranquility (161) 161 0 161 0<br />
9712420 Tri Cities (SIS) (5,000) 0 0 0 (5,000)<br />
9712421 BiDart (Feasibility) (5,000) 0 0 0 (5,000)<br />
9712540 enXco Schindler B (Feasibility) (606) 606 0 606 0<br />
9712541 enXco Blackwell (Feasibility) (1,000) 0 0 0 (1,000)<br />
9712560 Solarpack Le Gr<strong>and</strong> (SIS) (329) 6,680 6,351 329 0<br />
9712562 WG-Acacia Solar Gen Fac-SIS 389 8,629 9,019 (390) (1)<br />
9712563 WG-Blkwell Solar 1 Gen Fac-SM 519 0 519 (519) 0<br />
9712564 WG-Blkwell Solar 1 Gen Fac-SIS 1,912 24,585 0 24,585 26,497<br />
<strong>FERC</strong> FORM NO. 1 (ED. 12-87) Page 450.2
Name of Respondent<br />
PACIFIC GAS AND ELECTRIC COMPANY<br />
This Report is:<br />
(1) X An Original<br />
(2) A Resubmission<br />
Date of Report<br />
(Mo, Da, Yr)<br />
04/08/2011<br />
Year/Period of Report<br />
<strong>2010</strong>/Q4<br />
FOOTNOTE DATA<br />
9712566 WG-Old River 1 Gen Fac-SIS 1,688 7,724 9,413 (1,689) (1)<br />
9712568 WG-Old River 2 Gen Fac-SIS 1,688 7,280 8,968 (1,688) 0<br />
9712570 WG-Wagon Wheel Mt Solar 1 Gen Fac-SIS 2,450 12,698 15,148 (2,450) 0<br />
9712571 WG-Westside Solar 20MW Gen Fac-SM 1,558 0 1,558 (1,558) 0<br />
9712572 WG-Westside Solar 20MW Gen Fac-SIS 1,428 10,007 11,435 (1,428) 0<br />
9712573 WG-Quay Valley 20MW Solar PV Gen Fac-SM 3,115 0 3,115 (3,115) 0<br />
9712574 WG-Quay Valley 20MW Solar PV Gen Fac-SIS 0 9,005 0 9,005 9,005<br />
9712576 WG-Whitney Point Solar-SIS 909 16,526 17,435 (909) 0<br />
9712577 WG-Wellhead Renewables Frsno Gen Fac-SM 0 2,612 2,612 0 0<br />
9712578 WG-Wellhead Renewables Frsno Gen Fac-SIS 0 3,996 0 3,996 3,996<br />
9712579 WG-White Ranch Solar-SM 1,039 267 1,306 (1,039) 0<br />
9712580 WG-White Ranch Solar-SIS 0 1,874 1,874 0 0<br />
9712581 WG-Angiola Water District Solar-SM 1,039 401 1,440 (1,039) 0<br />
9712582 WG-Angiola Water District Solar-SIS 0 13,521 13,521 0 0<br />
9712601 BioVerde V<strong>and</strong>er Woude Dairy [SIS] (870) 0 9,961 (9,961) (10,831)<br />
9712681 WG-Carizzo Plain Solar-AIS 0 15,042 0 15,042 15,042<br />
9712700 WG-Buttonwood Solar - Scoping Meeting 909 0 909 (909) 0<br />
9712701 WG-Buttonwood Solar - SIS 519 1,071 1,590 (519) 0<br />
9712702 WG-Panoche Valley Solar Farm-SM 260 0 0 0 260<br />
9712703 WG-Panoche Valley Solar Farm-SIS 0 19,309 0 19,309 19,309<br />
9712704 WG-Avenal 9 MW Solar SIS 1,038 9,995 40,000 (30,005) (28,967)<br />
9712710 WG-FRV Vega Solar - SIS 0 17,749 0 17,749 17,749<br />
9712720 Guadalupe L<strong>and</strong>fill (SIS) 0 1,156 3,000 (1,844) (1,844)<br />
9712761 WG-Hudson Solar Project - Scoping Mtg 0 566 566 0 0<br />
9712762 WG-Hudson Solar Project - SIS 0 14,234 0 14,234 14,234<br />
9712920 WG-Lompoc Wind Power Project - ISIS 0 9,863 0 9,863 9,863<br />
9712922 WG-Sweetwater PV 20 MVA Slr Gen Stn-SIS 0 9,762 9,762 0 0<br />
9712924 WG-Premier Power Russell Solar-SIS 0 8,374 0 8,374 8,374<br />
9712925 WG-CAL SP V - Scoping Meeting 0 1,120 543 577 577<br />
9712926 WG-CAL SP V - SIS 0 16,676 16,676 0 0<br />
9712928 WG-Stanislaus PV (Phase1) - SIS 0 16,537 16,537 0 0<br />
9712931 WG-Lost Hills Solar Generation - FAS 0 5,597 0 5,597 5,597<br />
9713021 WG - FRV Centuri Solar - SIS 0 9,646 0 9,646 9,646<br />
9713022 WG - Excelsior Solar-Scoping Meeting 0 700 700 0 0<br />
9713023 WG - Excelsior Solar-SIS 0 15,520 0 15,520 15,520<br />
9713024 WG - Schindler South Project-Scoping Mtg 0 134 134 0 0<br />
9713025 WG - Schindler South Project-SIS 0 13,696 0 13,696 13,696<br />
9713026 WG - Brannon Solar - Scoping Mtg 0 1,086 1,086 0 0<br />
9713105 WG - Sun Harvester Solar - Scoping Mtg 0 803 803 0 0<br />
9713106 WG - Sun Harvester Solar - SIS 0 9,698 0 9,698 9,698<br />
9713107 WG - FRV Cygnus Solar - Scoping Meeting 0 577 577 0 0<br />
9713111 WG - Fairfax Solar - Scoping Meeting 0 1,354 1,354 0 0<br />
9713112 WG - Fairfax Solar - SIS 0 874 0 874 874<br />
9713113 WG - Placer Solar - Scoping Meeting 0 1,658 1,658 0 0<br />
9713114 WG - Placer Solar - SIS 0 10,017 0 10,017 10,017<br />
9713115 WG - Three Rocks Solar - Scoping Meeting 0 1,086 1,086 0 0<br />
9713116 WG - Three Rocks Solar - SIS 0 4,086 0 4,086 4,086<br />
9713117 WG - Cluster 2 Phase 1 0 178,814 0 178,814 178,814<br />
9713140 WG - Wellhead Renewables-Feasibility 0 5,136 536 4,600 4,600<br />
9713182 WG - El Peco Solar Farm-Scoping Mtg 0 576 0 576 576<br />
9713183 WG - El Peco Solar Farm-SIS 0 23,138 0 23,138 23,138<br />
9713340 AEJ Trust (SIS) 0 353 0 353 353<br />
9713364 WG - Crocker Solar Power-SM 0 2,122 2,122 0 0<br />
9713365 WG - Crocker Solar Power-SIS 0 3,159 0 3,159 3,159<br />
9713366 WG - Great Valley Solar-SM 0 1,364 1,364 0 0<br />
9713367 WG - Great Valley Solar-SIS 0 15,033 0 15,033 15,033<br />
9713368 WG - PV Rosina 1-SM 0 2,197 0 2,197 2,197<br />
9713369 WG - PV Rosina 1-SIS 0 9,464 0 9,464 9,464<br />
9713370 WG - Skunk Hollow-SM 0 1,479 1,479 0 0<br />
9713371 WG - Skunk Hollow-SIS 0 8,240 0 8,240 8,240<br />
9713372 WG - Jefferson Solar-SM 0 1,653 1,653 0 0<br />
9713373 WG - Jefferson Solar-SIS 0 438 0 438 438<br />
9713374 WG - Five Points Solar-SM 0 2,244 2,244 0 0<br />
9713375 WG - Five Points Solar-SIS 0 303 0 303 303<br />
9713423 Shiloh (SIS) 0 9,530 11,000 (1,470) (1,470)<br />
9713480 WG - Copus Solar One Gen Fac-SM 0 455 455 0 0<br />
<strong>FERC</strong> FORM NO. 1 (ED. 12-87) Page 450.3
Name of Respondent<br />
PACIFIC GAS AND ELECTRIC COMPANY<br />
This Report is:<br />
(1) X An Original<br />
(2) A Resubmission<br />
Date of Report<br />
(Mo, Da, Yr)<br />
04/08/2011<br />
Year/Period of Report<br />
<strong>2010</strong>/Q4<br />
FOOTNOTE DATA<br />
9713481 WG - Copus Solar One Gen Fac-SIS 0 9,869 0 9,869 9,869<br />
9713482 WG - Lakeview Solar One Gen Fac-SM 0 152 152 0 0<br />
9713483 WG - Lakeview Solar One Gen Fac-SIS 0 10,869 0 10,869 10,869<br />
9713502 WG - FRV Orion Kern Solar Gen Fac-SM 0 877 877 0 0<br />
9713503 WG - FRV Orion Kern Solar Gen Fac-SIS 0 13,555 0 13,555 13,555<br />
9713504 WG - FRV Adobe Solar Gen Fac-SM 0 893 893 0 0<br />
9713505 WG - FRV Adobe Solar Gen Fac-SIS 0 2,960 0 2,960 2,960<br />
9713506 WG - Arco Solar 1 Project - IFAS 0 13,617 0 13,617 13,617<br />
9713507 WG - Old River 1 Gen Fac-IFAS 0 10,554 0 10,554 10,554<br />
9713511 WG - Quay Valley Solar PV Project-IFAS 0 11,078 0 11,078 11,078<br />
9713512 WG - Westside Solar Project-IFAS 0 876 0 876 876<br />
9713513 WG - Sweetwater PV Solar Gen Stn-IFAS 0 8,861 0 8,861 8,861<br />
9713514 WG - Whitney Point Solar Project-IFAS 0 455 0 455 455<br />
9713515 WG - Stanislaus PV Phase 1 Gen Fac-IFAS 0 15,807 0 15,807 15,807<br />
9713580 Carrizo Plains (SIS) 0 20,597 0 20,597 20,597<br />
9713581 Old River II WDT (SIS) 0 4,288 11,000 (6,712) (6,712)<br />
9713582 Cuyama - Diamond PV-08 (SIS) 0 23,987 15,000 8,987 8,987<br />
9713583 Stockdale - Diamond PV 07 (SIS) 0 5,100 15,000 (9,900) (9,900)<br />
9713585 WG - Avenal Park-Facilities Study 0 2,591 35,000 (32,409) (32,409)<br />
9713600 REP ENERGY - HOROWITZ PV (SIS) 0 546 4,000 (3,454) (3,454)<br />
9713601 WG - Kettleman Solar Farm Gen-SM 0 758 758 0 0<br />
9713602 WG - Kettleman Solar Farm Gen-SIS 0 6,716 0 6,716 6,716<br />
9713603 WG - Sun Seeker Solar Enrgy Ctr-SM 0 303 303 0 0<br />
9713604 WG - Sun Seeker Solar Enrgy Ctr-SIS 0 540 0 540 540<br />
9713606 WG - Stratford Solar Farm Gen-SIS 0 6,666 0 6,666 6,666<br />
9713607 WG - Salado Solar Generation Facility-SM 0 303 303 0 0<br />
9713608 WG - Salado Solar Gen Facility-SIS 0 9,060 0 9,060 9,060<br />
9713609 WG - Kamm Generation Facility-SM 0 725 725 0 0<br />
9713610 WG - Kamm Generation Facility-SIS 0 6,267 0 6,267 6,267<br />
9713611 WG - Adams East Gen Fac-SM 0 590 590 0 0<br />
9713612 WG - Adams East Gen Fac-SIS 0 15,357 0 15,357 15,357<br />
9713613 WG - San Joaquin 1-A Gen Fac-SM 0 405 0 405 405<br />
9713615 WG - San Joaquin 2-A Gen Fac-SM 0 798 0 798 798<br />
9713617 WG - Westl<strong>and</strong>s Solar Farm PV1 Gen-SM 0 675 675 0 0<br />
9713618 WG - Westl<strong>and</strong>s Solar Farm PV1 Gen-SIS 0 11,115 0 11,115 11,115<br />
9713619 E&B Resources (DIS) 0 3,018 6,000 (2,982) (2,982)<br />
9713621 Kirby Canyon (Facility) 0 121 5,000 (4,879) (4,879)<br />
9713622 BIG CREEK HYDRO (Protection/reliability) 0 24,586 31,825 (7,239) (7,239)<br />
9713623 Rhodia (Relay Upgrade, Eng Review) 0 24,035 24,035 0 0<br />
9713624 BIOVERDE - VLOT (SIS) 0 0 1,000 (1,000) (1,000)<br />
9713625 BIOVERDE VANDER WOUDE II (Feasibility) 0 1,000 1,000 0 0<br />
9713626 BIOVERDE - LAKESIDE DAIRY (Feasibility) 0 1,215 1,000 215 215<br />
9713627 BIOVERDE - HOOGENDAM (Feasibility) 0 1,000 1,000 0 0<br />
9713628 Solar Power Inc - Aerojet3 (Feasibility) 0 1,000 1,000 0 0<br />
9713629 Solar Power Inc - Aerojet4 (Feasibility) 0 1,000 1,000 0 0<br />
9713630 Solar Power Inc - Colusa (System Impact) 0 15,500 20,000 (4,500) (4,500)<br />
9713631 Solar Power - Susanville (Feasibility) 0 1,000 1,000 0 0<br />
9713632 Ortigalita Power <strong>Company</strong> (SIS) 0 3,392 5,000 (1,608) (1,608)<br />
9713634 enXco - Santa Nella (SIS) 0 5,983 10,000 (4,017) (4,017)<br />
9713635 enXco - Stone Corral (SIS) 0 6,744 7,500 (756) (756)<br />
9713636 enXco - Giffen (SIS) 0 11,181 15,000 (3,819) (3,819)<br />
9713637 enXco - Corcoran City (SIS) 0 5,705 16,000 (10,295) (10,295)<br />
9713638 enXco - Corcoran Irrigation (SIS) 0 6,909 15,000 (8,091) (8,091)<br />
9713639 enXco - Chowchilla Muller (SIS) 0 1,000 1,000 0 0<br />
9713640 CENERGY POWER - BAXTER 1 (SIS) 0 6,598 7,500 (902) (902)<br />
9713641 CENERGY POWER - ECK 2 (SIS) 0 5,158 7,500 (2,342) (2,342)<br />
9713642 CENERGY POWER - NICKEL 1 (SIS) 0 7,168 7,500 (332) (332)<br />
9713643 EID - TANK 7 HYDRO (SIS) 0 1,869 5,000 (3,131) (3,131)<br />
9713644 enXco -Chowchilla Ora Muller (SIS) 0 1,164 1,000 164 164<br />
9713645 Bakersfield Fuel <strong>and</strong> Oil (SIS) 0 7,241 11,000 (3,759) (3,759)<br />
9713647 Kiara Solar (SIS) 0 8,314 11,000 (2,686) (2,686)<br />
9713648 CITY AND CTY OF SF- SF SHORE PWR (DIS) 0 5,273 6,000 (727) (727)<br />
9713649 Potrero Hills Egy L<strong>and</strong>fill (SIS) 0 4,345 15,000 (10,655) (10,655)<br />
9713650 AEJ Trust (SIS) 0 9,926 11,000 (1,074) (1,074)<br />
9713651 CENERGY POWER - ECK 1 (SIS) 0 1,000 1,000 0 0<br />
9713652 CENERGY POWER - BAXTER 2 (SIS) 0 1,000 1,000 0 0<br />
<strong>FERC</strong> FORM NO. 1 (ED. 12-87) Page 450.4
Name of Respondent<br />
PACIFIC GAS AND ELECTRIC COMPANY<br />
This Report is:<br />
(1) X An Original<br />
(2) A Resubmission<br />
Date of Report<br />
(Mo, Da, Yr)<br />
04/08/2011<br />
Year/Period of Report<br />
<strong>2010</strong>/Q4<br />
FOOTNOTE DATA<br />
9713653 Solar Power Inc - Red Bluff (SIS) 0 8,251 20,000 (11,749) (11,749)<br />
9713654 enXco - Stone Corral R7 (SIS) 0 3,198 10,000 (6,802) (6,802)<br />
9713655 enXco - Goose Lake Memo (SIS) 0 0 1,000 (1,000) (1,000)<br />
9713656 enXco - San Bernard Delis (SIS) 0 1,020 10,000 (8,980) (8,980)<br />
9713657 enXco - El Peco (SIS) 0 2,610 8,500 (5,890) (5,890)<br />
9713658 enXco - Chowchilla LR Montgomery (SIS) 0 8,345 7,500 845 845<br />
9713659 SR Solis - ROCKET SOLAR (SIS) 0 3,153 15,000 (11,847) (11,847)<br />
9713660 Bakersfield Fuel <strong>and</strong> Oil 2 (SIS) 0 3,004 11,000 (7,996) (7,996)<br />
9713741 CAL SP X (SIS) 0 0 11,000 (11,000) (11,000)<br />
9713742 FRV CYGNUS (SIS) 0 5,750 11,000 (5,250) (5,250)<br />
9713743 CAL SP XI (SIS) 0 96 11,000 (10,904) (10,904)<br />
9713780 GSNA 6 (SIS) 0 0 1,000 (1,000) (1,000)<br />
9713781 GSNA 7 (SIS) 0 0 1,000 (1,000) (1,000)<br />
9713783 SR Solis Huron (SIS) 0 0 15,000 (15,000) (15,000)<br />
9713820 FRV ORION II (SIS) 0 5,460 11,000 (5,540) (5,540)<br />
9713903 BAP POWER - NICKEL 1 (Facility Study) 0 0 500 (500) (500)<br />
9713941 WG - Grangeville Solar Farm Gen Fac-SIS 0 3,628 0 3,628 3,628<br />
9713942 WG - CAL SP XII Gen Fac-SM 0 675 0 675 675<br />
9713943 WG - CAL SP XII Gen Fac-SIS 0 1,423 0 1,423 1,423<br />
9713944 WG - Kansas Gen Fac-SM 0 946 0 946 946<br />
9713945 WG - Kansas Gen Fac-SIS 0 2,447 0 2,447 2,447<br />
9713946 WG - Kansas South Gen Fac-SM 0 2,817 0 2,817 2,817<br />
9713947 WG - Kansas South Gen Fac-SIS 0 936 0 936 936<br />
9713948 WG - Jayne East Gen Fac-SM 0 1,764 0 1,764 1,764<br />
9713949 WG - Jayne East Gen Fac-SIS 0 11,631 0 11,631 11,631<br />
9713952 WG - Angiola Water Dist Solar-FAS 0 30,397 0 30,397 30,397<br />
9713953 WG - Panoche Valley Solar Farm-FAS 0 18,099 0 18,099 18,099<br />
9713954 WG - FRV Vega Solar-FAS 0 11,239 0 11,239 11,239<br />
9713963 Putah Creek Solar Farm (SIS) 0 6,963 6,000 963 963<br />
9713981 Green Point (SIS) 0 4,520 4,000 520 520<br />
9714000 WG - Angiola Valley Solar Ranch C3-SM 0 675 0 675 675<br />
9714001 WG - Arco Solar Station C3-SM 0 270 0 270 270<br />
9714002 WG - Laguna Solar Farm C3-SM 0 540 0 540 540<br />
9714005 WG - RE Mustang C3-SM 0 392 0 392 392<br />
9714006 WG - RE Tranquility C3-SM 0 262 0 262 262<br />
9714011 WG - WRE Coalinga C3-SM 0 270 0 270 270<br />
9714012 WG - WRE Mendota C3-SM 0 270 0 270 270<br />
9714013 WG - WRE Panoche C3-SM 0 270 0 270 270<br />
9714014 WG - WRE Schindler C3-SM 0 270 0 270 270<br />
9714015 WG - WRE Stroud C3-SM 0 135 0 135 135<br />
9714017 WG - Cluster 3 Projects Phase 1 0 2,382 0 2,382 2,382<br />
9714041 GASNA 10P, LLC- OL1 (SIS) 0 164 11,000 (10,836) (10,836)<br />
9714042 GASNA 14P, LLC - OL5 (SIS) 0 164 1,000 (836) (836)<br />
9714081 SunEdison - Le Gr<strong>and</strong> (SIS) 0 164 11,000 (10,836) (10,836)<br />
9714082 Hansen Ranch (SIS) 0 0 1,000 (1,000) (1,000)<br />
9714102 WG - Montezuma II Wind-TCPII Results Mtg 0 262 0 262 262<br />
9714103 WG - Carrizo Slr Farm-TCPII Results Mtg 0 9,495 0 9,495 9,495<br />
9714104 WG - Desert Topaz 2-TCPII Results Mtg 0 5,052 0 5,052 5,052<br />
9714105 WG - Walker Rdg Wind-TCPII Results Mtg 0 1,582 0 1,582 1,582<br />
9714106 WG - Avenal Energy -TCPII Results Mtg 0 532 0 532 532<br />
9714107 WG - Contra Costa Gen -TCPII Results Mtg 0 540 0 540 540<br />
9714108 WG - GWF Henrietta -TCPII Results Mtg 0 667 0 667 667<br />
9714109 WG - Hydro Enrgy CA -TCPII Results Mtg 0 2,018 0 2,018 2,018<br />
9714110 WG - Madera Power -TCPII Results Mtg 0 262 0 262 262<br />
9714111 WG - GWF Hanford -TCPII Results Mtg 0 405 0 405 405<br />
9714112 WG - Alpaugh PV Slr-TCPII Results Mtg 0 536 0 536 536<br />
9714113 WG - Marsh L<strong>and</strong>ing Gen-TCPII Results Mtg 0 1,068 0 1,068 1,068<br />
9714114 WG - DGC Kelso CT-TCPII Results Mtg 0 540 0 540 540<br />
9714115 WG - PV-42 -TCPII Results Mtg 0 36,413 0 36,413 36,413<br />
9714116 WG - Los Esteros Crit -TCPII Results Mtg 0 270 0 270 270<br />
9714117 WG - Tres Vaqueros Wi -TCPII Results Mtg 0 270 0 270 270<br />
9714120 AXIO POWER - JOLON (SIS) 0 0 11,000 (11,000) (11,000)<br />
9714121 AXIO POWER - SAN MIGUEL (SIS) 0 0 11,000 (11,000) (11,000)<br />
9714140 WG - World Sun PV-SM 0 135 0 135 135<br />
9714146 WG - Repowered McKittrick Cogen-SM 0 270 0 270 270<br />
9714149 WG - Thunderhill Solar Pwr Gen-SIS 0 3,667 0 3,667 3,667<br />
<strong>FERC</strong> FORM NO. 1 (ED. 12-87) Page 450.5
Name of Respondent<br />
PACIFIC GAS AND ELECTRIC COMPANY<br />
This Report is:<br />
(1) X An Original<br />
(2) A Resubmission<br />
Date of Report<br />
(Mo, Da, Yr)<br />
04/08/2011<br />
Year/Period of Report<br />
<strong>2010</strong>/Q4<br />
FOOTNOTE DATA<br />
9714150 WG - Chowchilla Solar Gen-SM 0 785 0 785 785<br />
9714152 WG - BFO PV 09 Gen-SM 0 532 0 532 532<br />
9714155 BFO-PV-12 (SIS) 0 0 1,000 (1,000) (1,000)<br />
9714156 BFO-PV-13 (SIS) 0 0 1,000 (1,000) (1,000)<br />
9714160 IRD McFarl<strong>and</strong> (SIS) 0 4,822 11,000 (6,178) (6,178)<br />
9714162 CAL SP IX (SIS) 0 251 11,000 (10,749) (10,749)<br />
9714180 COOL EARTH SOLAR (SIS) 0 823 5,000 (4,177) (4,177)<br />
9714200 WG - LMUD OPDE High Rock Solar-SIS 0 0 30,000 (30,000) (30,000)<br />
9714220 SEPV-18 (SIS) 0 0 10,000 (10,000) (10,000)<br />
9714243 AMERESCO VASCO RD (SIS) 0 3,828 7,500 (3,672) (3,672)<br />
9714244 STOCKTON ENERGY CNT -R & R (SIS) 0 0 1,000 (1,000) (1,000)<br />
9714261 CAL SP VI (SIS) 0 914 0 914 914<br />
9714360 AMERESCO SJ - FOOTHILL (SIS) 0 2,053 1,000 1,053 1,053<br />
9714361 Acciona - Copus Interconnection (SIS) 0 2,470 21,500 (19,030) (19,030)<br />
9714362 Acciona - Lakeview Interconnection (SIS) 0 0 15,000 (15,000) (15,000)<br />
9714364 Bakersfield Fuel <strong>and</strong> Oil (FAS) 0 2,360 10,000 (7,640) (7,640)<br />
9714366 WGD - Salinas Valley Solid Waste (FAS) 0 0 30,000 (30,000) (30,000)<br />
9714440 IEC ORD RANCH SOLAR PROJECT (SIS) 0 0 10,000 (10,000) (10,000)<br />
9714448 11 MW SR SolisGooseLakeLLC SolEner (SIS) 0 0 10,000 (10,000) (10,000)<br />
9714449 20 MW SR SolisYanceyLLC SolEner (SIS) 0 0 10,000 (10,000) (10,000)<br />
9714450 20 MW SR Solis Gustine LLC SolEner (SIS) 0 0 10,000 (10,000) (10,000)<br />
9714451 9 MW SR Solis Ikemiya LLC SolEner (SIS) 0 0 10,000 (10,000) (10,000)<br />
9714540 Cenergy # MA1 (SIS) 0 0 1,000 (1,000) (1,000)<br />
9714541 Cenergy - MA2 (SIS) 0 0 1,000 (1,000) (1,000)<br />
9714542 WG - DES Gen Facility-SM 0 785 0 785 785<br />
9714544 WG - BRJ Gen Facility-SM 0 785 0 785 785<br />
9714546 WG - Enrico Matson 2 Gen Fac-SM 0 785 0 785 785<br />
9714548 WG - Enrico Matson 4 Gen Fac-SM 0 785 0 785 785<br />
9714550 WG - Sirius Solar Gen Fac-SM 0 392 0 392 392<br />
9714551 WG - Sirius Solar Gen Fac-SIS 0 785 0 785 785<br />
9714552 WG - Trinity Gen Fac-SM 0 785 0 785 785<br />
9714554 WG - Graham-Westl<strong>and</strong>s Proj Gen Fac-SM 0 131 0 131 131<br />
9714556 WG - Kent South Gen Fac-SM 0 785 0 785 785<br />
9714558 WG - Orion Gen Fac-SM 0 785 0 785 785<br />
9714560 WG - JAC Gen Fac-SM 0 916 0 916 916<br />
9714562 WG - Indeck Yuba Energy CTR Gen Fac-SM 0 392 0 392 392<br />
9714680 Axio Maricopa (SIS) 0 0 11,000 (11,000) (11,000)<br />
9714701 Solar Power Inc - Colusa (Feasibility) 0 0 5,000 (5,000) (5,000)<br />
9714722 WG - Shiloh III-AIS 0 1,841 0 1,841 1,841<br />
9714740 WG - Panoche Valley Slr Farm C2 P-RM 0 523 0 523 523<br />
9714742 WG - White River West PV Gen C2P1-RM 0 262 0 262 262<br />
9714743 WG - Corcoran West PV Gen C2P1-RM 0 131 0 131 131<br />
9714745 WG - FRV Leo Slr C2P1-RM 0 1,187 0 1,187 1,187<br />
9714746 WG - Russell City Enrgy Ctr Exp2 C2P1-RM 0 523 0 523 523<br />
9714747 WG - Sutter Energy Ctr #2 C2P1-RM 0 1,329 0 1,329 1,329<br />
9714748 WG - Solar Star CA XIII C2P1-RM 0 523 0 523 523<br />
9714749 WG - Madera Slr PV1 C2P1-RM 0 523 0 523 523<br />
9714750 WG - CPN Wild Horse Geothermal C2P1-RM 0 261 0 261 261<br />
9714751 WG - King Solar II C2P1-RM 0 915 0 915 915<br />
9714752 WG - BioVerde PV V<strong>and</strong>er Woude C2P1-RM 0 522 0 522 522<br />
9714753 WG - GWF Tracy Add Capacity C2P1-RM 0 261 0 261 261<br />
9714754 WG - North Star Slr 1 C2P1-RM 0 784 0 784 784<br />
9714804 WG - Pioneer Solar I Gen Fac-SM 0 785 0 785 785<br />
9714810 WG - Las Lomas Solar Gen Fac-SM 0 785 0 785 785<br />
9714825 WG - Annedale Solar Gen Fac-SM 0 785 0 785 785<br />
9714853 WG - Goose Lake Slr I Gen Fac-SM 0 785 0 785 785<br />
9714860 WG - Rio Bravo Slr I Gen Fac-SM 0 785 0 785 785<br />
9714878 CCSF TRANS CRYSTAL SPRINGS RD HWY 35 0 121,147 220,000 (98,853) (98,853)<br />
Total Generation Studies 1,155,631 2,255,086 2,491,895 (236,809) 918,822<br />
Gr<strong>and</strong> Total 1,143,364 2,352,164 2,591,895 (239,730) 903,634<br />
Definition of acronyms used above:<br />
AIS Amended Interconnection Study<br />
DIS Detailed Interconnection Study<br />
<strong>FERC</strong> FORM NO. 1 (ED. 12-87) Page 450.6
Name of Respondent<br />
PACIFIC GAS AND ELECTRIC COMPANY<br />
This Report is:<br />
(1) X An Original<br />
(2) A Resubmission<br />
Date of Report<br />
(Mo, Da, Yr)<br />
04/08/2011<br />
Year/Period of Report<br />
<strong>2010</strong>/Q4<br />
FOOTNOTE DATA<br />
IFS<br />
IFAS<br />
ISIS<br />
OIS<br />
SAIS<br />
SIS<br />
FSS<br />
Interconnection Feasibility Study<br />
Interconnection Facility Study<br />
Interconnection System Impact Re-Study<br />
Optional Interconnection Study<br />
Second Amended Interconnection Study<br />
System Impact Study<br />
Feasibility Study Scoping<br />
<strong>FERC</strong> FORM NO. 1 (ED. 12-87) Page 450.7
Name of Respondent<br />
PACIFIC GAS AND ELECTRIC COMPANY<br />
This Report Is:<br />
Date of Report<br />
(1) X An Original<br />
(Mo, Da, Yr)<br />
(2) A Resubmission<br />
04/08/2011<br />
OTHER REGULATORY ASSETS (Account 182.3)<br />
Year/Period of Report<br />
End of <strong>2010</strong>/Q4<br />
1. Report below the particulars (details) called for concerning other regulatory assets, including rate order docket number, if applicable.<br />
2. Minor items (5% of the Balance in Account 182.3 at end of period, or amounts less than $100,000 which ever is less), may be<br />
grouped by classes.<br />
3. For Regulatory Assets being amortized, show period of amortization.<br />
Line<br />
No.<br />
1<br />
2<br />
3<br />
4<br />
5<br />
6<br />
7<br />
8<br />
9<br />
10<br />
11<br />
12<br />
13<br />
14<br />
15<br />
16<br />
17<br />
18<br />
19<br />
20<br />
21<br />
22<br />
23<br />
24<br />
25<br />
26<br />
27<br />
28<br />
29<br />
30<br />
31<br />
32<br />
33<br />
34<br />
35<br />
36<br />
37<br />
38<br />
39<br />
40<br />
41<br />
42<br />
43<br />
Core Brokerage Fee<br />
Description <strong>and</strong> Purpose of<br />
Other Regulatory Assets<br />
Balance at<br />
Debits CREDITS<br />
Written off During<br />
the Quarter/Year<br />
Account Charged<br />
(a)<br />
Net Energy Metering Memo - <strong>Electric</strong><br />
Purchased <strong>Gas</strong> Balancing Account<br />
<strong>Electric</strong> Baseline Shortfall Balancing Account<br />
Self-Generation Program Memo Account-<strong>Electric</strong><br />
Self-Generation Program Memo Account-<strong>Gas</strong><br />
BCA Charge Account<br />
CA Alternate Rates for Energy Program-<strong>Electric</strong><br />
CA Alternate Rates for Energy Program-<strong>Gas</strong><br />
<strong>Electric</strong> Hazardous Substance Balancing Account<br />
<strong>Gas</strong> Hazardous Substance Balancing Account<br />
Core Fixed Cost <strong>Gas</strong> Balancing Account<br />
Transition Cost - Noncore Balancing Account<br />
Enhanced Oil Recovery Balancing Account<br />
Core Pipeline Dem<strong>and</strong> Charge Account<br />
CEE Incentive <strong>Electric</strong> Balancing Account<br />
CEE Incentive <strong>Gas</strong> Balancing Account<br />
<strong>Gas</strong> Core Firm Storage Account<br />
Energy Resource Recovery Account<br />
Common-Area Balancing Account<br />
Renewables Balancing Account<br />
Research, Dev. <strong>and</strong> Demo. Balancing Account<br />
Bond Charge Balancing Account<br />
Noncore Distribution Fixed Cost Balancing Acct<br />
Environmental Compliance Regulatory Asset<br />
Natural <strong>Gas</strong> Vehicle Balancing Account<br />
Distribution Revenue Adjustment Mechanism<br />
Transmission Revenue Balancing Account<br />
Reliability Services Balancing Account<br />
<strong>Electric</strong> Price Risk Management - Current<br />
<strong>Electric</strong> Price Risk Management - NonCurrent<br />
<strong>Gas</strong> Price Risk Management - Current<br />
<strong>Gas</strong> Price Risk Management - NonCurrent<br />
Vegetation Management Deferred Expense<br />
Transmission Access Charge Balancing Account<br />
DWR Power Charge Collection Balancing Account<br />
DWR Power Charge Regulatory Asset<br />
Public Purpose Programs Revenue Adjustment Mech.<br />
Distribution Bypass Deferral Rate Memo Account<br />
End-Use Customer Refund Adjustment<br />
<strong>Gas</strong> Public Purpose Program Surcharge Memo Acct<br />
SmartMeter Project Balancing Account-<strong>Electric</strong><br />
SmartMeter Project Balancing Account-<strong>Gas</strong><br />
Beginning of<br />
Current<br />
Quarter/Year<br />
(b)<br />
(c)<br />
(d)<br />
Written off During<br />
the Period<br />
Amount<br />
(e)<br />
Balance at end of<br />
Current Quarter/Year<br />
1,382,395 Various<br />
356,789<br />
1,025,606<br />
( 1,711,081) Various<br />
3,839<br />
-1,714,920<br />
( 26,635,377) 40,278,141<br />
13,642,764<br />
210,124,688 471,511<br />
210,596,199<br />
( 89,613,020) Various<br />
17,366,020<br />
-106,979,040<br />
( 15,205,992) 182.3<br />
3,801,866<br />
-19,007,858<br />
( 632,320) Various<br />
274,394<br />
-906,714<br />
64,845,660 84,721,125<br />
149,566,785<br />
( 17,020,997) 3,411,598<br />
-13,609,399<br />
8,895,367 22,293,162<br />
31,188,529<br />
20,771,776 52,001,432<br />
72,773,208<br />
93,433,436 Various<br />
37,009,322<br />
56,424,114<br />
( 811,638) 1,131,816<br />
320,178<br />
( 2) 2<br />
( 11,612,199) 12,196,922<br />
584,723<br />
30,416,852 431<br />
6,886,109<br />
23,530,743<br />
4,874,421 785,076<br />
5,659,497<br />
( 2,551,767) 2,672,437<br />
120,670<br />
71,834,153 Various<br />
188,537,974<br />
-116,703,821<br />
8,354,283 18,746<br />
8,373,029<br />
( 1,290,086) 1,290,087<br />
1<br />
( 637,378) 637,387<br />
9<br />
( 49,686,491) Various<br />
111,434<br />
-49,797,925<br />
875,971 Various<br />
2,526,342<br />
-1,650,371<br />
407,562,937 400<br />
257,670,315<br />
149,892,622<br />
( 134,474) 134,161<br />
-313<br />
151,889,685 Various<br />
7,001,551<br />
144,888,134<br />
46,304,579 400<br />
83,903,897<br />
-37,599,318<br />
15,536,328 400<br />
22,905,030<br />
-7,368,702<br />
178,495,205 131,794,235<br />
310,289,440<br />
362,804,228 93,596,682<br />
456,400,910<br />
53,070,132 12,251,577<br />
65,321,709<br />
28,136,664 4,293,307<br />
32,429,971<br />
10,648,014 Various<br />
7,374,531<br />
3,273,483<br />
52,811,529 Various<br />
3,644,095<br />
49,167,434<br />
20,386,320 34,350,558<br />
54,736,878<br />
28,078,464 400<br />
20,323,019<br />
7,755,445<br />
( 5,342,537) 6,295,619<br />
953,082<br />
2,017,714 9,566<br />
2,027,280<br />
( 893,625) 254<br />
2,463,009<br />
-3,356,634<br />
5,025,592 Various<br />
19,812<br />
5,005,780<br />
49,497,661 7,759,448<br />
57,257,109<br />
31,839,851 23,397,728<br />
55,237,579<br />
(f)<br />
44 TOTAL 6,500,673,291 1,925,627,307<br />
1,528,054,977 6,898,245,621<br />
<strong>FERC</strong> FORM NO. 1/3-Q (REV. 02-04) Page 232
Name of Respondent<br />
PACIFIC GAS AND ELECTRIC COMPANY<br />
This Report Is:<br />
Date of Report<br />
(1) X An Original<br />
(Mo, Da, Yr)<br />
(2) A Resubmission<br />
04/08/2011<br />
OTHER REGULATORY ASSETS (Account 182.3)<br />
Year/Period of Report<br />
End of <strong>2010</strong>/Q4<br />
1. Report below the particulars (details) called for concerning other regulatory assets, including rate order docket number, if applicable.<br />
2. Minor items (5% of the Balance in Account 182.3 at end of period, or amounts less than $100,000 which ever is less), may be<br />
grouped by classes.<br />
3. For Regulatory Assets being amortized, show period of amortization.<br />
Line<br />
No.<br />
1<br />
2<br />
3<br />
4<br />
5<br />
6<br />
7<br />
8<br />
9<br />
10<br />
11<br />
12<br />
13<br />
14<br />
15<br />
16<br />
17<br />
18<br />
19<br />
20<br />
21<br />
22<br />
23<br />
24<br />
25<br />
26<br />
27<br />
28<br />
29<br />
30<br />
31<br />
32<br />
33<br />
34<br />
35<br />
36<br />
37<br />
38<br />
39<br />
40<br />
41<br />
42<br />
43<br />
Description <strong>and</strong> Purpose of<br />
Other Regulatory Assets<br />
Balance at<br />
Debits CREDITS<br />
Written off During<br />
the Quarter/Year<br />
Account Charged<br />
(a)<br />
Renewables Portfolio St<strong>and</strong>ard Cost Memo Acct<br />
Climate Smart Balancing Acccount-<strong>Gas</strong><br />
Climate Smart Balancing Acccount-<strong>Electric</strong><br />
Procurement Energy Efficiency Rev. Adj. Mechanism<br />
Family <strong>Electric</strong> Rate Assistance Balancing Acct<br />
Negative Ongoing Competition Transition Chrg BA<br />
Dynamic Pricing Memor<strong>and</strong>um Account<br />
Bristish Columbia Renewable Study Bal Account-Elec<br />
Market Redesign & Technology Memo Account<br />
Gateway Settlement Balancing Account<br />
L<strong>and</strong> Conserv. Plan Env. Remediation Memo Acct.<br />
Energy Efficiency 2009-2011 Memo Acct-<strong>Electric</strong><br />
Energy Efficiency 2009-2011 Memo Acct-<strong>Gas</strong><br />
Fire Hazard Prevention Memo Acct<br />
FASB 109 Regulatory Asset<br />
QF Buyout<br />
Advanced Metering <strong>and</strong> Dem<strong>and</strong> Response Account<br />
Distributed Energy Resources Memo Account<br />
Nuclear Decommissioning Adjustment Mechanism<br />
Dept of Energy Litigation Balancing Acct<br />
Dem<strong>and</strong> Response Expenditures Balancing Account<br />
Dem<strong>and</strong> Response Revenue Balancing Account<br />
Miscellaneous <strong>Gas</strong> Reg Asset - Current<br />
Miscellaneous <strong>Gas</strong> Reg Asset - NonCurrent<br />
Miscellaneous <strong>Electric</strong> Reg Asset - Current<br />
Miscellaneous <strong>Electric</strong> Reg Asset - NonCurrent<br />
Energy Recovery Bonds Regulatory Asset<br />
EEC Funding Payment Recovery Account<br />
Financing Costs Regulatory Asset<br />
Utility Retained Generation Regulatory Assets<br />
Financial Hedging Costs<br />
Pension Regulatory Asset<br />
FIN 47 - Regulatory Asset<br />
Fossil Decommissioning Reg Asset<br />
<strong>Electric</strong>/<strong>Gas</strong> Reserve Accounts<br />
Community Choice Aggr. Implem. Costs Balan. Acct.<br />
<strong>Gas</strong> Hazardous Substance Regulatory Asset<br />
<strong>Gas</strong> Non-Hazardous Substance Regulatory Asset<br />
<strong>Gas</strong> AB32 Administration Fee Memo Account<br />
<strong>Electric</strong> AB32 Administration Fee Memo Account<br />
San Bruno Independent Review Panel Memo Account<br />
CA Solar Initiative Thermal Program Memo Account<br />
<strong>Electric</strong> Disconnection Memo Account<br />
Beginning of<br />
Current<br />
Quarter/Year<br />
(b)<br />
(c)<br />
(d)<br />
Written off During<br />
the Period<br />
Amount<br />
(e)<br />
Balance at end of<br />
Current Quarter/Year<br />
385,772 311,869<br />
697,641<br />
( 3,808,344) Various<br />
798,324<br />
-4,606,668<br />
( 5,117,989) 511,483<br />
-4,606,506<br />
4,069,110 Varioius<br />
6,421,939<br />
-2,352,829<br />
4,643,803 2,027,913<br />
6,671,716<br />
1,267,272,840 404,487,090<br />
1,671,759,930<br />
2,425,621 182.3<br />
2,199,891<br />
225,730<br />
( 884,156) 1,298,507<br />
414,351<br />
1,322,521 20,225,662<br />
21,548,183<br />
416,006 1,022,218<br />
1,438,224<br />
566,535 1,342,529<br />
1,909,064<br />
192,492,955 Various<br />
192,492,955<br />
39,024,877 Various<br />
39,024,877<br />
23,331 14,303<br />
37,634<br />
1,042,684,540 207,170,136<br />
1,249,854,676<br />
67,212,714 67,212,714<br />
6,473,355 14,526<br />
6,487,881<br />
8,509,063 1,509,097<br />
10,018,160<br />
292,134 16,762,011<br />
17,054,145<br />
13,730,639 1,119,428<br />
14,850,067<br />
( 26,417,793) Various<br />
13,560,916<br />
-39,978,709<br />
222,859 1,832,781<br />
2,055,640<br />
253,062 234,563<br />
487,625<br />
14,624,897 Various<br />
15,866,814<br />
-1,241,917<br />
59,855,815 48,052,602<br />
107,908,417<br />
7,434,556 Various<br />
6,131,658<br />
1,302,898<br />
998,422,308 Various<br />
296,619,193<br />
701,803,115<br />
37,707,000 228.4<br />
8,670,000<br />
29,037,000<br />
38,718,919 428<br />
3,411,394<br />
35,307,525<br />
1,161,443,237 Various<br />
120,052,052 1,041,391,185<br />
24,792,670 428<br />
2,530,211<br />
22,262,459<br />
1,386,300,699 372,680,540<br />
1,758,981,239<br />
14,851,094 3,620,361<br />
18,471,455<br />
56,274,462 55,674,906<br />
111,949,368<br />
(1,651,680,742) Various<br />
158,095,405<br />
*,***,***,***<br />
3,833,238<br />
221,135,693<br />
13,179,292<br />
4,664,786<br />
157,915<br />
500,242<br />
844,963<br />
2,260,440<br />
(f)<br />
3,833,238<br />
221,135,693<br />
13,179,292<br />
4,664,786<br />
157,915<br />
500,242<br />
844,963<br />
2,260,440<br />
44 TOTAL 6,500,673,291 1,925,627,307<br />
1,528,054,977 6,898,245,621<br />
<strong>FERC</strong> FORM NO. 1/3-Q (REV. 02-04) Page 232.1
Name of Respondent<br />
PACIFIC GAS AND ELECTRIC COMPANY<br />
This Report Is:<br />
Date of Report<br />
(1) X An Original<br />
(Mo, Da, Yr)<br />
(2) A Resubmission<br />
04/08/2011<br />
OTHER REGULATORY ASSETS (Account 182.3)<br />
Year/Period of Report<br />
End of <strong>2010</strong>/Q4<br />
1. Report below the particulars (details) called for concerning other regulatory assets, including rate order docket number, if applicable.<br />
2. Minor items (5% of the Balance in Account 182.3 at end of period, or amounts less than $100,000 which ever is less), may be<br />
grouped by classes.<br />
3. For Regulatory Assets being amortized, show period of amortization.<br />
Line<br />
No.<br />
1<br />
2<br />
3<br />
4<br />
5<br />
6<br />
7<br />
8<br />
9<br />
10<br />
11<br />
12<br />
13<br />
14<br />
15<br />
16<br />
17<br />
18<br />
19<br />
20<br />
21<br />
22<br />
23<br />
24<br />
25<br />
26<br />
27<br />
28<br />
29<br />
30<br />
31<br />
32<br />
33<br />
34<br />
35<br />
36<br />
37<br />
38<br />
39<br />
40<br />
41<br />
42<br />
43<br />
Description <strong>and</strong> Purpose of<br />
Other Regulatory Assets<br />
Balance at<br />
Debits CREDITS<br />
Written off During<br />
the Quarter/Year<br />
Account Charged<br />
(a)<br />
<strong>Gas</strong> Disconnection Memo Account<br />
SmartMeter Memor<strong>and</strong>um Account <strong>Electric</strong><br />
SmartMeter Memor<strong>and</strong>um Account <strong>Gas</strong><br />
Beginning of<br />
Current<br />
Quarter/Year<br />
(b)<br />
(c)<br />
1,705,244<br />
893,470<br />
747,176<br />
(d)<br />
Written off During<br />
the Period<br />
Amount<br />
(e)<br />
Balance at end of<br />
Current Quarter/Year<br />
(f)<br />
1,705,244<br />
893,470<br />
747,176<br />
44 TOTAL 6,500,673,291 1,925,627,307<br />
1,528,054,977 6,898,245,621<br />
<strong>FERC</strong> FORM NO. 1/3-Q (REV. 02-04) Page 232.2
Name of Respondent<br />
PACIFIC GAS AND ELECTRIC COMPANY<br />
This Report is:<br />
(1) X An Original<br />
(2) A Resubmission<br />
Date of Report<br />
(Mo, Da, Yr)<br />
04/08/2011<br />
Year/Period of Report<br />
<strong>2010</strong>/Q4<br />
FOOTNOTE DATA<br />
Schedule Page: 232 Line No.: 25 Column: a<br />
The Utility expects to recover these costs over periods ranging from 1 to 32 years.<br />
Schedule Page: 232 Line No.: 40 Column: a<br />
Amortization period - one year.<br />
Schedule Page: 232.1 Line No.: 15 Column: a<br />
Based on current regulatory ratemaking <strong>and</strong> income tax laws, the Utility expects to recover<br />
deferred income taxes related to regulatory assets over periods ranging from 1 to 45<br />
years.<br />
Schedule Page: 232.1 Line No.: 16 Column: a<br />
Amortization period - 2003-2014.<br />
Schedule Page: 232.1 Line No.: 27 Column: a<br />
Amortization period is 8 years, the term of the Energy Recovery Bonds.<br />
Schedule Page: 232.1 Line No.: 28 Column: a<br />
Amortization period - 2004-2013.<br />
EEC st<strong>and</strong>s for Environmental Enhancement Corporation.<br />
Schedule Page: 232.1 Line No.: 29 Column: a<br />
The interest rate hedge portion of this regulatory asset is being amortized over periods<br />
of 5, 7, 10, <strong>and</strong> 30 years.<br />
This regulatory asset is recoverable through the cost of capital mechanism. Costs, net of<br />
premiums or discounts for outst<strong>and</strong>ing debt which are also recoverable through this<br />
mechanism, are shown on pages 256-257 of the annual report on <strong>Form</strong> 1.<br />
Schedule Page: 232.1 Line No.: 30 Column: a<br />
The individual components of these regulatory assets are amortized over their respective<br />
lives, with a weighted average life of approximately 13 years.<br />
Schedule Page: 232.1 Line No.: 31 Column: a<br />
This regulatory asset is recoverable through the cost of capital mechanism. Costs, net of<br />
premiums or discounts for outst<strong>and</strong>ing debt which are also recoverable through this<br />
mechanism, are shown on pages 256-257 of the annual report on <strong>Form</strong> 1.<br />
Schedule Page: 232.1 Line No.: 35 Column: f<br />
This is a combination of various accounts as follows:<br />
<strong>Electric</strong> <strong>and</strong> <strong>Gas</strong> Reserve Accounts<br />
Modified Transition Cost Balancing Account<br />
Deferred Divestiture Transaction Cost<br />
The ending balance of these regulatory assets should show ($1,809,776,147), but the <strong>FERC</strong><br />
software is unable to show negative numbers of over a billion dollars.<br />
<strong>FERC</strong> FORM NO. 1 (ED. 12-87) Page 450.1
Name of Respondent<br />
PACIFIC GAS AND ELECTRIC COMPANY<br />
This Report Is:<br />
Date of Report<br />
(1) X An Original<br />
(Mo, Da, Yr)<br />
(2) A Resubmission<br />
04/08/2011<br />
MISCELLANEOUS DEFFERED DEBITS (Account 186)<br />
Year/Period of Report<br />
End of <strong>2010</strong>/Q4<br />
1. Report below the particulars (details) called for concerning miscellaneous deferred debits.<br />
2. For any deferred debit being amortized, show period of amortization in column (a)<br />
3. Minor item (1% of the Balance at End of Year for Account 186 or amounts less than $100,000, whichever is less) may be grouped by<br />
classes.<br />
Line<br />
No.<br />
1<br />
2<br />
3<br />
4<br />
5<br />
6<br />
7<br />
8<br />
9<br />
10<br />
11<br />
12<br />
13<br />
14<br />
15<br />
16<br />
17<br />
18<br />
19<br />
20<br />
21<br />
22<br />
23<br />
24<br />
25<br />
26<br />
27<br />
28<br />
29<br />
30<br />
31<br />
32<br />
33<br />
34<br />
35<br />
36<br />
37<br />
38<br />
39<br />
40<br />
41<br />
42<br />
43<br />
44<br />
45<br />
46<br />
Description of Miscellaneous Balance at<br />
Debits CREDITS<br />
Deferred Debits<br />
Beginning of Year<br />
Account<br />
Charged<br />
Amount<br />
(a)<br />
(b)<br />
(c)<br />
(d)<br />
(e)<br />
Customer Advance for<br />
Construction - Refundable<br />
Deferred Development Costs<br />
Payments for Main Line<br />
Extension (MLX) <strong>and</strong><br />
Non-energy Invoices<br />
Payments for MLX<br />
Reimburseable Transmission<br />
Service & Generation<br />
Interconnection Study Costs<br />
Miscellaneous Minor Items<br />
Balance at<br />
End of Year<br />
(f)<br />
13,596,973 162,433<br />
13,759,406<br />
15,924,763 11,648,750<br />
27,573,513<br />
223,176 893,142<br />
1,116,318<br />
-3,026,184 Various<br />
4,774,518<br />
-7,800,702<br />
1,143,364 186<br />
239,730<br />
903,634<br />
-2,849,436 3,905,209<br />
1,055,773<br />
47 Misc. Work in Progress<br />
48<br />
Deferred Regulatory Comm.<br />
Expenses (See pages 350 - 351)<br />
49 TOTAL<br />
25,012,656 36,607,942<br />
<strong>FERC</strong> FORM NO. 1 (ED. 12-94) Page 233
Name of Respondent<br />
PACIFIC GAS AND ELECTRIC COMPANY<br />
This Report Is:<br />
Date of Report<br />
(1) X An Original<br />
(Mo, Da, Yr)<br />
(2) A Resubmission<br />
04/08/2011<br />
ACCUMULATED DEFERRED INCOME TAXES (Account 190)<br />
1. Report the information called for below concerning the respondent’s accounting for deferred income taxes.<br />
2. At Other (Specify), include deferrals relating to other income <strong>and</strong> deductions.<br />
Year/Period of Report<br />
End of <strong>2010</strong>/Q4<br />
Line<br />
No.<br />
1<br />
2<br />
3<br />
4<br />
5<br />
6<br />
7<br />
8<br />
9<br />
10<br />
11<br />
12<br />
13<br />
14<br />
15<br />
16<br />
17<br />
18<br />
Description <strong>and</strong> Location<br />
(a)<br />
<strong>Electric</strong><br />
Environmental<br />
Compensation<br />
CIAC<br />
Injuries <strong>and</strong> Damages<br />
California Corporation Franchise Tax<br />
Other<br />
TOTAL <strong>Electric</strong> (Enter Total of lines 2 thru 7)<br />
<strong>Gas</strong><br />
Environmental<br />
Compensation<br />
CIAC<br />
Injuries <strong>and</strong> Damages<br />
California Corporation Franchise Tax<br />
Other<br />
TOTAL <strong>Gas</strong> (Enter Total of lines 10 thru 15<br />
Other (Specify)<br />
TOTAL (Acct 190) (Total of lines 8, 16 <strong>and</strong> 17)<br />
Line 17 consists of the following:<br />
Balance of Begining<br />
of Year<br />
(b)<br />
154,841,472<br />
227,092,208<br />
-10,983,266<br />
98,089,009<br />
-20,488,238<br />
16,110,853<br />
464,662,038<br />
72,426,218<br />
95,259,642<br />
110,940,462<br />
31,890,619<br />
-32,808,999<br />
39,849,440<br />
317,557,382<br />
16,302,135<br />
798,521,555<br />
Notes<br />
Balance<br />
Balance<br />
at Beginning<br />
at End<br />
of Year<br />
of Year<br />
------------ -------------<br />
Balance at End<br />
of Year<br />
(c)<br />
164,915,112<br />
227,775,252<br />
-18,620,173<br />
94,109,871<br />
-29,425,091<br />
189,728,213<br />
628,483,184<br />
76,743,375<br />
95,552,206<br />
108,473,731<br />
117,323,676<br />
-5,147,418<br />
139,909,417<br />
532,854,987<br />
43,365,614<br />
1,204,703,785<br />
California Corporation Franchise Tax $(18,128,714) $(17,332,321)<br />
Compensation (140,138) 2,382,404<br />
Other 34,570,987 58,305,531<br />
------------ ------------<br />
Total $ 16,302,135 $ 43,365,614<br />
============ ============<br />
<strong>FERC</strong> FORM NO. 1 (ED. 12-88) Page 234
Name of Respondent<br />
PACIFIC GAS AND ELECTRIC COMPANY<br />
This Report Is:<br />
Date of Report<br />
(1) X An Original<br />
(Mo, Da, Yr)<br />
(2) A Resubmission<br />
04/08/2011<br />
CAPITAL STOCKS (Account 201 <strong>and</strong> 204)<br />
Year/Period of Report<br />
End of <strong>2010</strong>/Q4<br />
1. Report below the particulars (details) called for concerning common <strong>and</strong> preferred stock at end of year, distinguishing separate<br />
series of any general class. Show separate totals for common <strong>and</strong> preferred stock. If information to meet the stock exchange reporting<br />
requirement outlined in column (a) is available from the SEC 10-K Report <strong>Form</strong> filing, a specific reference to report form (i.e., year <strong>and</strong><br />
company title) may be reported in column (a) provided the fiscal years for both the 10-K report <strong>and</strong> this report are compatible.<br />
2. Entries in column (b) should represent the number of shares authorized by the articles of incorporation as amended to end of year.<br />
Line<br />
No.<br />
Class <strong>and</strong> Series of Stock <strong>and</strong><br />
Name of Stock Series<br />
Number of shares<br />
Authorized by Charter<br />
Par or Stated<br />
Value per share<br />
Call Price at<br />
End of Year<br />
1<br />
2<br />
3<br />
4<br />
5<br />
6<br />
7<br />
8<br />
9<br />
10<br />
11<br />
12<br />
13<br />
14<br />
15<br />
16<br />
17<br />
18<br />
19<br />
20<br />
21<br />
22<br />
23<br />
24<br />
25<br />
26<br />
27<br />
28<br />
29<br />
30<br />
31<br />
32<br />
33<br />
34<br />
35<br />
36<br />
37<br />
38<br />
39<br />
40<br />
41<br />
42<br />
(a)<br />
<strong>Pacific</strong> <strong>Gas</strong> <strong>and</strong> <strong>Electric</strong> <strong>Company</strong>'s stock<br />
is wholly owned by PG&E Corporation<br />
Common<br />
TOTAL COMMON<br />
Registered with the American Stock Exchange<br />
Preferred, Cumulative:<br />
Redeemable: Without M<strong>and</strong>atory Redemption<br />
4.36%<br />
4.50%<br />
4.80%<br />
5.00%<br />
5.00% - Series A<br />
7.04%<br />
Undesignated in Class<br />
SubTotal Redeemable Without<br />
M<strong>and</strong>atory Redemption<br />
Registered with the American Stock Exchange<br />
Non-Redeemable<br />
5.00%<br />
5.50%<br />
6.00%<br />
SubTotal Non-Redeemable<br />
Redeemable: With M<strong>and</strong>atory Redemption<br />
6.30%<br />
6.57%<br />
Undesignated in Class<br />
SubTotal Redeemable With<br />
M<strong>and</strong>atory Redemption<br />
TOTAL PREFERRED<br />
(b)<br />
800,000,000<br />
800,000,000<br />
418,291<br />
611,142<br />
793,031<br />
1,778,172<br />
934,322<br />
3,000,000<br />
56,180,217<br />
63,715,175<br />
400,000<br />
1,173,163<br />
4,211,662<br />
5,784,825<br />
2,500,000<br />
3,000,000<br />
10,000,000<br />
15,500,000<br />
85,000,000<br />
(c)<br />
5.00<br />
5.00<br />
25.00<br />
25.00<br />
25.00<br />
25.00<br />
25.00<br />
25.00<br />
25.00<br />
25.00<br />
25.00<br />
25.00<br />
25.00<br />
25.00<br />
100.00<br />
(d)<br />
25.75<br />
26.00<br />
27.25<br />
26.75<br />
26.75<br />
<strong>FERC</strong> FORM NO. 1 (ED. 12-91) Page 250
Name of Respondent<br />
PACIFIC GAS AND ELECTRIC COMPANY<br />
This Report Is:<br />
Date of Report<br />
(1) X An Original<br />
(Mo, Da, Yr)<br />
(2) A Resubmission<br />
04/08/2011<br />
CAPITAL STOCKS (Account 201 <strong>and</strong> 204) (Continued)<br />
Year/Period of Report<br />
End of <strong>2010</strong>/Q4<br />
3. Give particulars (details) concerning shares of any class <strong>and</strong> series of stock authorized to be issued by a regulatory commission<br />
which have not yet been issued.<br />
4. The identification of each class of preferred stock should show the dividend rate <strong>and</strong> whether the dividends are cumulative or<br />
non-cumulative.<br />
5. State in a footnote if any capital stock which has been nominally issued is nominally outst<strong>and</strong>ing at end of year.<br />
Give particulars (details) in column (a) of any nominally issued capital stock, reacquired stock, or stock in sinking <strong>and</strong> other funds which<br />
is pledged, stating name of pledgee <strong>and</strong> purposes of pledge.<br />
OUTSTANDING PER BALANCE SHEET<br />
HELD BY RESPONDENT<br />
Line<br />
(Total amount outst<strong>and</strong>ing without reduction<br />
AS REACQUIRED STOCK (Account 217)<br />
IN SINKING AND OTHER FUNDS No.<br />
for amounts held by respondent)<br />
Shares<br />
(e)<br />
Amount<br />
(f)<br />
Shares<br />
(g)<br />
Cost<br />
(h)<br />
Shares<br />
(i)<br />
Amount<br />
(j)<br />
1<br />
2<br />
264,374,809 1,321,874,045<br />
3<br />
4<br />
264,374,809 1,321,874,045<br />
5<br />
6<br />
7<br />
8<br />
9<br />
418,291 10,457,275<br />
10<br />
611,142 15,278,550<br />
11<br />
793,031 19,825,775<br />
12<br />
1,778,172 44,454,300<br />
13<br />
934,322 23,358,050<br />
14<br />
15<br />
16<br />
17<br />
4,534,958 113,373,950<br />
18<br />
19<br />
20<br />
21<br />
22<br />
400,000 10,000,000<br />
23<br />
1,173,163 29,329,075<br />
24<br />
4,211,662 105,291,550<br />
25<br />
26<br />
5,784,825 144,620,625<br />
27<br />
28<br />
29<br />
30<br />
31<br />
32<br />
33<br />
34<br />
35<br />
36<br />
10,319,783 257,994,575<br />
37<br />
38<br />
39<br />
40<br />
41<br />
42<br />
<strong>FERC</strong> FORM NO. 1 (ED. 12-88) Page 251
Name of Respondent<br />
PACIFIC GAS AND ELECTRIC COMPANY<br />
This Report is:<br />
(1) X An Original<br />
(2) A Resubmission<br />
Date of Report<br />
(Mo, Da, Yr)<br />
04/08/2011<br />
Year/Period of Report<br />
<strong>2010</strong>/Q4<br />
FOOTNOTE DATA<br />
Schedule Page: 250 Line No.: 15 Column: a<br />
Redeemed on August 31, 2005.<br />
Schedule Page: 250 Line No.: 30 Column: a<br />
This was reclassifed to Other Long-Term Debt in accordance with FASB 150 in September<br />
2003. It was shown here since it is still part of the total number of preferred shares<br />
authorized. They were fully redeemed on May 31, 2005.<br />
Schedule Page: 250 Line No.: 31 Column: a<br />
This was reclassifed to Other Long-Term Debt in accordance with FASB 150 in September<br />
2003. It was shown here since it is still part of the total number of preferred shares<br />
authorized. They were fully redeemed on May 31, 2005.<br />
<strong>FERC</strong> FORM NO. 1 (ED. 12-87) Page 450.1
Name of Respondent<br />
PACIFIC GAS AND ELECTRIC COMPANY<br />
This Report Is:<br />
(1) X An Original<br />
(2) A Resubmission<br />
OTHER PAID-IN CAPITAL (Accounts 208-211, inc.)<br />
Date of Report<br />
(Mo, Da, Yr)<br />
04/08/2011<br />
Year/Period of Report<br />
End of <strong>2010</strong>/Q4<br />
Report below the balance at the end of the year <strong>and</strong> the information specified below for the respective other paid-in capital accounts. Provide a<br />
subheading for each account <strong>and</strong> show a total for the account, as well as total of all accounts for reconciliation with balance sheet, Page 112. Add more<br />
columns for any account if deemed necessary. Explain changes made in any account during the year <strong>and</strong> give the accounting entries effecting such<br />
change.<br />
(a) Donations Received from Stockholders (Account 208)-State amount <strong>and</strong> give brief explanation of the origin <strong>and</strong> purpose of each donation.<br />
(b) Reduction in Par or Stated value of Capital Stock (Account 209): State amount <strong>and</strong> give brief explanation of the capital change which gave rise to<br />
amounts reported under this caption including identification with the class <strong>and</strong> series of stock to which related.<br />
(c) Gain on Resale or Cancellation of Reacquired Capital Stock (Account 210): Report balance at beginning of year, credits, debits, <strong>and</strong> balance at end<br />
of year with a designation of the nature of each credit <strong>and</strong> debit identified by the class <strong>and</strong> series of stock to which related.<br />
(d) Miscellaneous Paid-in Capital (Account 211)-Classify amounts included in this account according to captions which, together with brief explanations,<br />
disclose the general nature of the transactions which gave rise to the reported amounts.<br />
Line Item Amount<br />
No.<br />
(a)<br />
(b)<br />
1<br />
2<br />
3<br />
4<br />
5<br />
6<br />
7<br />
8<br />
9<br />
10<br />
11<br />
12<br />
13<br />
14<br />
15<br />
16<br />
17<br />
18<br />
19<br />
20<br />
21<br />
22<br />
23<br />
24<br />
25<br />
26<br />
27<br />
28<br />
29<br />
30<br />
31<br />
32<br />
33<br />
34<br />
35<br />
36<br />
37<br />
38<br />
39<br />
Account 211 - Miscellaneous Paid-in Capital<br />
1,471,315,126<br />
40 TOTAL 1,471,315,126<br />
<strong>FERC</strong> FORM NO. 1 (ED. 12-87) Page 253
Name of Respondent<br />
PACIFIC GAS AND ELECTRIC COMPANY<br />
This Report Is:<br />
Date of Report<br />
(1) X An Original<br />
(Mo, Da, Yr)<br />
(2) A Resubmission<br />
04/08/2011<br />
CAPITAL STOCK EXPENSE (Account 214)<br />
Year/Period of Report<br />
End of <strong>2010</strong>/Q4<br />
1. Report the balance at end of the year of discount on capital stock for each class <strong>and</strong> series of capital stock.<br />
2. If any change occurred during the year in the balance in respect to any class or series of stock, attach a statement giving particulars<br />
(details) of the change. State the reason for any charge-off of capital stock expense <strong>and</strong> specify the account charged.<br />
Line<br />
No.<br />
1<br />
2<br />
3<br />
4<br />
5<br />
6<br />
7<br />
8<br />
9<br />
10<br />
11<br />
12<br />
13<br />
14<br />
15<br />
16<br />
17<br />
18<br />
19<br />
20<br />
21<br />
Class <strong>and</strong> Series of Stock<br />
(a)<br />
COMMON<br />
PREFERRED, CUMULATIVE:<br />
Redeemable - $25 par value per share:<br />
4.36%<br />
4.50%<br />
4.80%<br />
5.00%<br />
5.00% - Series A<br />
Non-Redeemable - $25 par value per share:<br />
5.00%<br />
5.50%<br />
6.00%<br />
Balance at End of Year<br />
(b)<br />
25,143,083<br />
29,509<br />
387,663<br />
777,999<br />
1,758,375<br />
158,204<br />
73,717<br />
173,730<br />
449,606<br />
22 TOTAL 28,951,886<br />
<strong>FERC</strong> FORM NO. 1 (ED. 12-87) Page 254b
Name of Respondent<br />
PACIFIC GAS AND ELECTRIC COMPANY<br />
This Report Is:<br />
Date of Report<br />
(1) X An Original<br />
(Mo, Da, Yr)<br />
(2) A Resubmission<br />
04/08/2011<br />
LONG-TERM DEBT (Account 221, 222, 223 <strong>and</strong> 224)<br />
Year/Period of Report<br />
End of <strong>2010</strong>/Q4<br />
1. Report by balance sheet account the particulars (details) concerning long-term debt included in Accounts 221, Bonds, 222,<br />
Reacquired Bonds, 223, Advances from Associated Companies, <strong>and</strong> 224, Other long-Term Debt.<br />
2. In column (a), for new issues, give Commission authorization numbers <strong>and</strong> dates.<br />
3. For bonds assumed by the respondent, include in column (a) the name of the issuing company as well as a description of the bonds.<br />
4. For advances from Associated Companies, report separately advances on notes <strong>and</strong> advances on open accounts. Designate<br />
dem<strong>and</strong> notes as such. Include in column (a) names of associated companies from which advances were received.<br />
5. For receivers, certificates, show in column (a) the name of the court -<strong>and</strong> date of court order under which such certificates were<br />
issued.<br />
6. In column (b) show the principal amount of bonds or other long-term debt originally issued.<br />
7. In column (c) show the expense, premium or discount with respect to the amount of bonds or other long-term debt originally issued.<br />
8. For column (c) the total expenses should be listed first for each issuance, then the amount of premium (in parentheses) or discount.<br />
Indicate the premium or discount with a notation, such as (P) or (D). The expenses, premium or discount should not be netted.<br />
9. Furnish in a footnote particulars (details) regarding the treatment of unamortized debt expense, premium or discount associated with<br />
issues redeemed during the year. Also, give in a footnote the date of the Commission’s authorization of treatment other than as<br />
specified by the Uniform System of Accounts.<br />
Line<br />
No.<br />
Class <strong>and</strong> Series of Obligation, Coupon Rate<br />
(For new issue, give commission Authorization numbers <strong>and</strong> dates)<br />
(a)<br />
1 ACCOUNT 221:<br />
2 SENIOR NOTES & POLLUTION CONTROL BONDS:<br />
3 Series<br />
Rate<br />
4 Series 4.20% Senior Notes due 2011 4.200%<br />
Principal Amount<br />
Of Debt issued<br />
(b)<br />
500,000,000<br />
Total expense,<br />
Premium or Discount<br />
(c)<br />
3,869,586<br />
5 1,300,000 D<br />
6 Series 4.80% Senior Notes due 2014 4.800%<br />
1,000,000,000<br />
7,989,172<br />
7 1,530,000 D<br />
8 Series 6.05% Senior Notes due 2034 6.050%<br />
3,000,000,000<br />
30,717,515<br />
9 14,640,000 D<br />
10 Series 5.80% Senior Notes due 2037 5.800%<br />
700,000,000<br />
6,807,234<br />
11 3,822,000 D<br />
12 Series 5.625% Senior Notes due 2017 5.625%<br />
500,000,000<br />
3,857,481<br />
13 2,710,000 D<br />
14 Series 5.625% Senior Notes due 2017 5.625%<br />
200,000,000<br />
1,486,541<br />
15 -3,100,000 P<br />
16 Series 6.35% Senior Notes due 2038 6.350%<br />
400,000,000<br />
3,943,976<br />
17 568,000 D<br />
18 Series 8.25% Senior Notes due 2018 8.250%<br />
600,000,000<br />
4,572,075<br />
19 9,942,000 D<br />
20 Series 8.25% Senior Notes due 2018 8.250%<br />
200,000,000<br />
1,511,598<br />
21 -8,950,000 P<br />
22 Series 6.25% Senior Notes due 2013 6.250%<br />
400,000,000<br />
2,788,005<br />
23 2,968,000 D<br />
24 Series 6.25% Senior Notes due 2039 6.250%<br />
550,000,000<br />
5,145,853<br />
25 6,814,500 D<br />
26 Series 5.4% Senior Notes due 2040 5.400%<br />
550,000,000<br />
5,464,539<br />
27 7,815,500 D<br />
28 Series 5.8% Senior Notes due 2037 5.800%<br />
250,000,000<br />
2,568,157<br />
29 3,862,500 D<br />
30 Series 3.5% Senior Notes due 2020 3.500%<br />
550,000,000<br />
4,311,853<br />
31 2,728,000 D<br />
32 Series 3.5% Senior Notes due 2020 3.500%<br />
250,000,000<br />
2,006,306<br />
33 TOTAL 14,143,075,908 173,019,023<br />
<strong>FERC</strong> FORM NO. 1 (ED. 12-96) Page 256
Name of Respondent<br />
PACIFIC GAS AND ELECTRIC COMPANY<br />
This Report Is:<br />
Date of Report<br />
(1) X An Original<br />
(Mo, Da, Yr)<br />
(2) A Resubmission<br />
04/08/2011<br />
LONG-TERM DEBT (Account 221, 222, 223 <strong>and</strong> 224)<br />
Year/Period of Report<br />
End of <strong>2010</strong>/Q4<br />
1. Report by balance sheet account the particulars (details) concerning long-term debt included in Accounts 221, Bonds, 222,<br />
Reacquired Bonds, 223, Advances from Associated Companies, <strong>and</strong> 224, Other long-Term Debt.<br />
2. In column (a), for new issues, give Commission authorization numbers <strong>and</strong> dates.<br />
3. For bonds assumed by the respondent, include in column (a) the name of the issuing company as well as a description of the bonds.<br />
4. For advances from Associated Companies, report separately advances on notes <strong>and</strong> advances on open accounts. Designate<br />
dem<strong>and</strong> notes as such. Include in column (a) names of associated companies from which advances were received.<br />
5. For receivers, certificates, show in column (a) the name of the court -<strong>and</strong> date of court order under which such certificates were<br />
issued.<br />
6. In column (b) show the principal amount of bonds or other long-term debt originally issued.<br />
7. In column (c) show the expense, premium or discount with respect to the amount of bonds or other long-term debt originally issued.<br />
8. For column (c) the total expenses should be listed first for each issuance, then the amount of premium (in parentheses) or discount.<br />
Indicate the premium or discount with a notation, such as (P) or (D). The expenses, premium or discount should not be netted.<br />
9. Furnish in a footnote particulars (details) regarding the treatment of unamortized debt expense, premium or discount associated with<br />
issues redeemed during the year. Also, give in a footnote the date of the Commission’s authorization of treatment other than as<br />
specified by the Uniform System of Accounts.<br />
Line<br />
No.<br />
Class <strong>and</strong> Series of Obligation, Coupon Rate<br />
(For new issue, give commission Authorization numbers <strong>and</strong> dates)<br />
(a)<br />
Principal Amount<br />
Of Debt issued<br />
(b)<br />
Total expense,<br />
Premium or Discount<br />
(c)<br />
1 6,840,000 D<br />
2 Series 5.4% Senior Notes due 2040 5.400%<br />
250,000,000<br />
2,568,806<br />
3 6,252,500 D<br />
4 Pollution Control Bonds<br />
5<br />
6<br />
7<br />
8<br />
9<br />
10<br />
11<br />
12<br />
13<br />
14<br />
15<br />
16<br />
17<br />
18<br />
19<br />
1996 Series 96A/C/E/F/G<br />
1997 Series 97B<br />
2004 Series A-D<br />
2008 Series F-G<br />
2009 Series A-D<br />
<strong>2010</strong> Series E<br />
SUBTOTAL ACCOUNT 221<br />
ACCOUNT 222:<br />
Various<br />
Various<br />
4.750%<br />
3.750%<br />
Various<br />
2.250%<br />
727,870,000<br />
148,550,000<br />
345,000,000<br />
95,000,000<br />
308,550,000<br />
50,000,000<br />
11,574,970,000<br />
10,607,457<br />
2,129,592<br />
7,897,424<br />
538,745<br />
1,986,577<br />
507,531<br />
173,019,023<br />
20 REACQUIRED BONDS<br />
21 Pollution Control Bonds<br />
22<br />
23<br />
24<br />
25<br />
26<br />
27<br />
28<br />
1996 Series 96G<br />
2008 Series F-G<br />
SUBTOTAL ACCOUNT 222<br />
ACCOUNT 223:<br />
Variable<br />
Variable<br />
-62,870,000<br />
-95,000,000<br />
-157,870,000<br />
29 ADVANCES FROM ASSOCIATED COMPANIES<br />
30<br />
31<br />
32<br />
PG&E Energy Recovery Funding LLC<br />
SUBTOTAL ACCOUNT 223<br />
Various<br />
2,725,975,908<br />
2,725,975,908<br />
33 TOTAL 14,143,075,908 173,019,023<br />
<strong>FERC</strong> FORM NO. 1 (ED. 12-96) Page 256.1
Name of Respondent<br />
PACIFIC GAS AND ELECTRIC COMPANY<br />
This Report Is:<br />
Date of Report<br />
(1) X An Original<br />
(Mo, Da, Yr)<br />
(2) A Resubmission<br />
04/08/2011<br />
LONG-TERM DEBT (Account 221, 222, 223 <strong>and</strong> 224) (Continued)<br />
Year/Period of Report<br />
End of <strong>2010</strong>/Q4<br />
10. Identify separate undisposed amounts applicable to issues which were redeemed in prior years.<br />
11. Explain any debits <strong>and</strong> credits other than debited to Account 428, Amortization <strong>and</strong> Expense, or credited to Account 429, Premium<br />
on Debt - Credit.<br />
12. In a footnote, give explanatory (details) for Accounts 223 <strong>and</strong> 224 of net changes during the year. With respect to long-term<br />
advances, show for each company: (a) principal advanced during year, (b) interest added to principal amount, <strong>and</strong> (c) principle repaid<br />
during year. Give Commission authorization numbers <strong>and</strong> dates.<br />
13. If the respondent has pledged any of its long-term debt securities give particulars (details) in a footnote including name of pledgee<br />
<strong>and</strong> purpose of the pledge.<br />
14. If the respondent has any long-term debt securities which have been nominally issued <strong>and</strong> are nominally outst<strong>and</strong>ing at end of<br />
year, describe such securities in a footnote.<br />
15. If interest expense was incurred during the year on any obligations retired or reacquired before end of year, include such interest<br />
expense in column (i). Explain in a footnote any difference between the total of column (i) <strong>and</strong> the total of Account 427, interest on<br />
Long-Term Debt <strong>and</strong> Account 430, Interest on Debt to Associated Companies.<br />
16. Give particulars (details) concerning any long-term debt authorized by a regulatory commission but not yet issued.<br />
AMORTIZATION PERIOD<br />
Outst<strong>and</strong>ing<br />
Line<br />
Nominal Date Date of<br />
(Total amount outst<strong>and</strong>ing without Interest for Year<br />
No.<br />
of Issue Maturity Date From Date To<br />
reduction for amounts held by<br />
respondent)<br />
Amount<br />
(d) (e) (f) (g) (h) (i)<br />
1<br />
2<br />
3<br />
3/23/04 3/1/11<br />
3/23/04<br />
3/1/11<br />
500,000,000 21,000,000 4<br />
5<br />
3/23/04 3/1/14<br />
3/23/04<br />
3/1/14<br />
1,000,000,000 48,000,000 6<br />
7<br />
3/23/04 3/1/34<br />
3/23/04<br />
3/1/34<br />
3,000,000,000 181,500,000 8<br />
9<br />
3/13/07 3/1/37<br />
3/13/07<br />
3/1/37<br />
700,000,000 40,600,000 10<br />
11<br />
12/4/07 11/30/17 12/4/07<br />
11/30/17<br />
500,000,000 28,125,000 12<br />
13<br />
3/3/08 11/30/17 3/3/08<br />
11/30/17<br />
200,000,000 11,250,000 14<br />
15<br />
3/3/08 2/15/38 3/3/08<br />
2/15/38<br />
400,000,000 25,400,000 16<br />
17<br />
10/21/08 10/15/18 10/21/08 10/15/18<br />
600,000,000 49,500,000 18<br />
19<br />
11/18/08 10/15/18 11/18/08 10/15/18<br />
200,000,000 16,500,000 20<br />
21<br />
11/18/08 12/1/13 11/18/08 12/1/13<br />
400,000,000 25,000,000 22<br />
23<br />
3/6/09 3/1/39<br />
3/6/09<br />
3/1/39<br />
550,000,000 34,375,000 24<br />
25<br />
11/18/09 1/15/40 11/18/09 1/15/40<br />
550,000,000 29,700,000 26<br />
27<br />
4/1/10 3/1/37<br />
4/1/10<br />
3/1/37<br />
250,000,000 10,875,000 28<br />
29<br />
9/15/10 10/1/20 9/15/10<br />
10/1/20<br />
550,000,000 5,668,056 30<br />
31<br />
11/18/10 10/1/20 11/18/10 10/1/20<br />
250,000,000 1,045,139 32<br />
12,252,523,939 607,199,526<br />
33<br />
<strong>FERC</strong> FORM NO. 1 (ED. 12-96) Page 257
Name of Respondent<br />
PACIFIC GAS AND ELECTRIC COMPANY<br />
This Report Is:<br />
Date of Report<br />
(1) X An Original<br />
(Mo, Da, Yr)<br />
(2) A Resubmission<br />
04/08/2011<br />
LONG-TERM DEBT (Account 221, 222, 223 <strong>and</strong> 224) (Continued)<br />
Year/Period of Report<br />
End of <strong>2010</strong>/Q4<br />
10. Identify separate undisposed amounts applicable to issues which were redeemed in prior years.<br />
11. Explain any debits <strong>and</strong> credits other than debited to Account 428, Amortization <strong>and</strong> Expense, or credited to Account 429, Premium<br />
on Debt - Credit.<br />
12. In a footnote, give explanatory (details) for Accounts 223 <strong>and</strong> 224 of net changes during the year. With respect to long-term<br />
advances, show for each company: (a) principal advanced during year, (b) interest added to principal amount, <strong>and</strong> (c) principle repaid<br />
during year. Give Commission authorization numbers <strong>and</strong> dates.<br />
13. If the respondent has pledged any of its long-term debt securities give particulars (details) in a footnote including name of pledgee<br />
<strong>and</strong> purpose of the pledge.<br />
14. If the respondent has any long-term debt securities which have been nominally issued <strong>and</strong> are nominally outst<strong>and</strong>ing at end of<br />
year, describe such securities in a footnote.<br />
15. If interest expense was incurred during the year on any obligations retired or reacquired before end of year, include such interest<br />
expense in column (i). Explain in a footnote any difference between the total of column (i) <strong>and</strong> the total of Account 427, interest on<br />
Long-Term Debt <strong>and</strong> Account 430, Interest on Debt to Associated Companies.<br />
16. Give particulars (details) concerning any long-term debt authorized by a regulatory commission but not yet issued.<br />
AMORTIZATION PERIOD<br />
Outst<strong>and</strong>ing<br />
Line<br />
Nominal Date Date of<br />
(Total amount outst<strong>and</strong>ing without Interest for Year<br />
No.<br />
of Issue Maturity Date From Date To<br />
reduction for amounts held by<br />
respondent)<br />
Amount<br />
(d) (e) (f) (g) (h) (i)<br />
1<br />
11/18/10 1/15/40 11/18/10 1/15/40<br />
250,000,000 1,612,500 2<br />
3<br />
4<br />
5/23/96 Various 5/23/96<br />
Various<br />
727,870,000 11,618,337 5<br />
6<br />
9/16/97 Various 9/16/97<br />
Various<br />
148,550,000 342,723 7<br />
8<br />
6/29/04 12/1/23 6/29/04<br />
12/1/23<br />
345,000,000 16,387,500 9<br />
10<br />
9/22/08 Various 9/22/08<br />
Various<br />
95,000,000 2,563,021 11<br />
12<br />
9/1/09 Various 9/1/09<br />
Various<br />
308,550,000 588,373 13<br />
14<br />
4/8/10 11/1/26 4/8/10<br />
11/1/26<br />
50,000,000 821,875 15<br />
16<br />
11,574,970,000 562,472,524 17<br />
18<br />
19<br />
20<br />
21<br />
-62,870,000 22<br />
23<br />
-95,000,000 24<br />
25<br />
-157,870,000 26<br />
27<br />
28<br />
29<br />
835,423,939 44,727,002 30<br />
31<br />
835,423,939 44,727,002 32<br />
12,252,523,939 607,199,526<br />
33<br />
<strong>FERC</strong> FORM NO. 1 (ED. 12-96) Page 257.1
Name of Respondent<br />
PACIFIC GAS AND ELECTRIC COMPANY<br />
This Report is:<br />
(1) X An Original<br />
(2) A Resubmission<br />
Date of Report<br />
(Mo, Da, Yr)<br />
04/08/2011<br />
Year/Period of Report<br />
<strong>2010</strong>/Q4<br />
FOOTNOTE DATA<br />
Schedule Page: 256 Line No.: 1 Column: c<br />
Items included under column (c) represent original issuance expense, premium or discount<br />
on issuance related to outst<strong>and</strong>ing debt which are recoverable through the cost of capital<br />
mechanism. Other financing related costs which are also recoverable are reflected on page<br />
232, Other Regulatory Assets (Account 182.3).<br />
Schedule Page: 256.1 Line No.: 17 Column: i<br />
This amount reconciles to Account 427, Interest on Long-Term Debt, per Line 62, Column c<br />
of <strong>Form</strong> 1 page 117, Statement of Income for the Year, as follows:<br />
Interest expense per this page 562,472,524<br />
Remarketing costs not included on this page 986,727<br />
Total Interest expense per page 117 563,459,250<br />
Schedule Page: 256.1 Line No.: 26 Column: c<br />
Original debt expense amortization costs on reacquired bonds are reported in Account 189<br />
on <strong>Form</strong> 2 page 260.<br />
Schedule Page: 256.1 Line No.: 26 Column: i<br />
No interest costs or income is recorded for bonds outst<strong>and</strong>ing <strong>and</strong> held in <strong>FERC</strong> Account<br />
222.<br />
Schedule Page: 256.1 Line No.: 32 Column: i<br />
This amount reconciles to Account 430, Interest on Debt to Associated Companies per Line<br />
67, Column c of <strong>Form</strong> 1 page 117, Statement of Income for the Year, as follows:<br />
Interest expense per this page 44,727,002<br />
Subsidiary interest not included on this page 13,929<br />
Total Interest expense per page 117 44,740,932<br />
<strong>FERC</strong> FORM NO. 1 (ED. 12-87) Page 450.1
Name of Respondent<br />
This Report Is:<br />
Date of Report<br />
Year/Period of Report<br />
(1) X An Original<br />
(Mo, Da, Yr)<br />
PACIFIC GAS AND ELECTRIC COMPANY<br />
End of <strong>2010</strong>/Q4<br />
(2) A Resubmission<br />
04/08/2011<br />
RECONCILIATION OF REPORTED NET INCOME WITH TAXABLE INCOME FOR FEDERAL INCOME TAXES<br />
1. Report the reconciliation of reported net income for the year with taxable income used in computing Federal income tax accruals <strong>and</strong> show<br />
computation of such tax accruals. Include in the reconciliation, as far as practicable, the same detail as furnished on Schedule M-1 of the tax return for<br />
the year. Submit a reconciliation even though there is no taxable income for the year. Indicate clearly the nature of each reconciling amount.<br />
2. If the utility is a member of a group which files a consolidated Federal tax return, reconcile reported net income with taxable net income as if a<br />
separate return were to be field, indicating, however, intercompany amounts to be eliminated in such a consolidated return. State names of group<br />
member, tax assigned to each group member, <strong>and</strong> basis of allocation, assignment, or sharing of the consolidated tax among the group members.<br />
3. A substitute page, designed to meet a particular need of a company, may be used as Long as the data is consistent <strong>and</strong> meets the requirements of<br />
the above instructions. For electronic reporting purposes complete Line 27 <strong>and</strong> provide the substitute Page in the context of a footnote.<br />
Line<br />
No.<br />
1 Net Income for the Year (Page 117)<br />
2<br />
3<br />
4 Taxable Income Not Reported on Books<br />
5 Contributions in Aid of Construction<br />
6<br />
7<br />
8<br />
Particulars (Details)<br />
(a)<br />
9 Deductions Recorded on Books Not Deducted for Return<br />
10 Provision for Federal Income Taxes<br />
11 Provision for State Income Taxes<br />
12 Others (See footnotes for details)<br />
13<br />
14 Income Recorded on Books Not Included in Return<br />
15 AFUDC - Equity <strong>and</strong> debt<br />
16 Balancing Accounts<br />
17<br />
18<br />
19 Deductions on Return Not Charged Against Book Income<br />
20 Others (See footnotes for details)<br />
21<br />
22<br />
23<br />
24<br />
25<br />
26<br />
27 Federal Tax Net Income<br />
28 Show Computation of Tax:<br />
29 Tax at 35% for <strong>Electric</strong>, Water, Non-Utility, <strong>and</strong> <strong>Gas</strong><br />
30 Les: Return to accrual<br />
31 Add: Tax on FIN 48 Interest<br />
32 Less: Low Income Housing Credits<br />
33 Audit Adjustments<br />
34 FIN 48 Adjustment (IRS Settlement - Acctg Method Change & R&E Credit)<br />
35 Reclass Acctg Method Change Adjustment to Deferred Expense Since NOL<br />
36<br />
37 TOTAL TAX<br />
38<br />
39 FEDERAL INCOME TAX ACCRUAL (Lines 15, 53, <strong>and</strong> 76 of Pages 114-117)<br />
40<br />
41<br />
42<br />
43<br />
44<br />
Amount<br />
(b)<br />
1,120,973,704<br />
82,288,749<br />
506,630,630<br />
67,418,494<br />
1,123,764,981<br />
160,103,895<br />
72,309,704<br />
2,878,296,686<br />
-209,633,727<br />
-73,371,701<br />
-57,281,340<br />
8,913,634<br />
-1,176,000<br />
25,413,930<br />
-72,290,955<br />
136,505,000<br />
-33,287,432<br />
-33,287,432<br />
<strong>FERC</strong> FORM NO. 1 (ED. 12-96) Page 261
Name of Respondent<br />
PACIFIC GAS AND ELECTRIC COMPANY<br />
This Report is:<br />
(1) X An Original<br />
(2) A Resubmission<br />
Date of Report<br />
(Mo, Da, Yr)<br />
04/08/2011<br />
Year/Period of Report<br />
<strong>2010</strong>/Q4<br />
FOOTNOTE DATA<br />
Schedule Page: 261 Line No.: 12 Column: b<br />
This consists of the following:<br />
Total<br />
ERB Regulatory Asset Amortization $390,727,013<br />
Supplier Settlements 127,346,882<br />
Executive Compensation 151,968<br />
Pretax income LLC Funding 17,426,048<br />
Loss on Reacquired Debt 22,345,000<br />
Meals & Entertainment & Lobbying 51,000,000<br />
Capitalized Interest 108,640,866<br />
Nuclear Fuel expense 85,379,213<br />
<strong>Gas</strong> Hedge Amortization 71,098,128<br />
Penalties 8,233,850<br />
Bad Debts 13,304,000<br />
Injuries & Damages 203,859,326<br />
Other 24,252,687<br />
Total $1,123,764,981<br />
Schedule Page: 261 Line No.: 20 Column: b<br />
This consists of the following:<br />
Computer Software $91,714,000<br />
Cost of removal 189,819,835<br />
Depreciation adjustment 2,325,004,011<br />
Earnings of Subsidiaries 17,755,011<br />
Franchise Tax 100,506,000<br />
Tax Exempt Bond Interest 1,000,000<br />
Repair allowance 41,207,850<br />
Fossil Decommissioning 25,640,646<br />
Bankruptcy 17,324,362<br />
Humboldt Decommissioning 45,876,543<br />
Dividends Paid Deduction 3,540,000<br />
Stock Options/Restricted Stock 7,218,722<br />
Medicare Part D 1,494,464<br />
Compensation Related Adjustments 10,195,242<br />
Total 2,878,296,686<br />
<strong>FERC</strong> FORM NO. 1 (ED. 12-87) Page 450.1
Name of Respondent<br />
PACIFIC GAS AND ELECTRIC COMPANY<br />
This Report Is:<br />
Date of Report<br />
(1) X An Original<br />
(Mo, Da, Yr)<br />
(2) A Resubmission<br />
04/08/2011<br />
TAXES ACCRUED, PREPAID AND CHARGED DURING YEAR<br />
Year/Period of Report<br />
End of <strong>2010</strong>/Q4<br />
1. Give particulars (details) of the combined prepaid <strong>and</strong> accrued tax accounts <strong>and</strong> show the total taxes charged to operations <strong>and</strong> other accounts during<br />
the year. Do not include gasoline <strong>and</strong> other sales taxes which have been charged to the accounts to which the taxed material was charged. If the<br />
actual, or estimated amounts of such taxes are know, show the amounts in a footnote <strong>and</strong> designate whether estimated or actual amounts.<br />
2. Include on this page, taxes paid during the year <strong>and</strong> charged direct to final accounts, (not charged to prepaid or accrued taxes.)<br />
Enter the amounts in both columns (d) <strong>and</strong> (e). The balancing of this page is not affected by the inclusion of these taxes.<br />
3. Include in column (d) taxes charged during the year, taxes charged to operations <strong>and</strong> other accounts through (a) accruals credited to taxes accrued,<br />
(b)amounts credited to proportions of prepaid taxes chargeable to current year, <strong>and</strong> (c) taxes paid <strong>and</strong> charged direct to operations or accounts other<br />
than accrued <strong>and</strong> prepaid tax accounts.<br />
4. List the aggregate of each kind of tax in such manner that the total tax for each State <strong>and</strong> subdivision can readily be ascertained.<br />
Line<br />
No.<br />
1<br />
2<br />
3<br />
4<br />
5<br />
6<br />
7<br />
8<br />
9<br />
10<br />
11<br />
12<br />
13<br />
14<br />
15<br />
16<br />
17<br />
18<br />
19<br />
20<br />
21<br />
22<br />
23<br />
24<br />
25<br />
26<br />
27<br />
28<br />
29<br />
30<br />
31<br />
32<br />
33<br />
34<br />
35<br />
36<br />
37<br />
38<br />
39<br />
40<br />
BALANCE AT BEGINNING OF YEAR<br />
Taxes<br />
Taxes<br />
Charged<br />
Paid<br />
Taxes Accrued Prepaid Taxes<br />
During<br />
During<br />
(Account 236) (Include in Account 165) Year<br />
Year<br />
(a) (b) (c) (d) (e) (f)<br />
Kind of Tax<br />
(See instruction 5)<br />
FEDERAL<br />
FICA<br />
Taxes on Income<br />
Unemployment<br />
Decommissioning Inc.<br />
SUBTOTAL FEDERAL<br />
STATE<br />
State Training Tax Fund<br />
Taxes on Income<br />
Unemployment<br />
SUBTOTAL STATE TAXES<br />
OTHER STATE AND LOCAL<br />
Timber Yield Tax<br />
Ad Valorem Property<br />
Payroll Tax<br />
Business Tax<br />
Other<br />
SUBTOTAL OTHER STATE<br />
& LOCAL TAXES<br />
14,612,301<br />
222,998,166<br />
19,609<br />
237,630,076<br />
102,974<br />
102,974<br />
1,887,458<br />
1,887,458<br />
81,128,907<br />
-33,287,432<br />
1,295,160<br />
14,462,254<br />
63,598,889<br />
158,761<br />
133,884,933<br />
8,685,121<br />
142,728,815<br />
48,448<br />
248,699,973<br />
8,575,432<br />
982,046<br />
1,128,989<br />
259,434,888<br />
85,874,534<br />
Adjustments<br />
-48,211,961 -119,032,366<br />
1,263,034<br />
14,462,254<br />
53,387,861 -119,032,366<br />
158,761<br />
318,024,535 193,353,749<br />
8,433,273<br />
326,616,569 193,353,749<br />
48,448<br />
248,699,973<br />
9,031,978<br />
982,046<br />
1,128,989<br />
259,891,434<br />
TOTAL<br />
41 465,762,592 639,895,864 74,321,383<br />
239,620,508<br />
<strong>FERC</strong> FORM NO. 1 (ED. 12-96) Page 262
Name of Respondent<br />
This Report Is:<br />
Date of Report<br />
(1) X An Original<br />
(Mo, Da, Yr)<br />
PACIFIC GAS AND ELECTRIC COMPANY<br />
(2) A Resubmission<br />
04/08/2011<br />
TAXES ACCRUED, PREPAID AND CHARGED DURING YEAR (Continued)<br />
Year/Period of Report<br />
End of <strong>2010</strong>/Q4<br />
5. If any tax (exclude Federal <strong>and</strong> State income taxes)- covers more then one year, show the required information separately for each tax year,<br />
identifying the year in column (a).<br />
6. Enter all adjustments of the accrued <strong>and</strong> prepaid tax accounts in column (f) <strong>and</strong> explain each adjustment in a foot- note. Designate debit adjustments<br />
by parentheses.<br />
7. Do not include on this page entries with respect to deferred income taxes or taxes collected through payroll deductions or otherwise pending<br />
transmittal of such taxes to the taxing authority.<br />
8. Report in columns (i) through (l) how the taxes were distributed. Report in column (I) only the amounts charged to Accounts 408.1 <strong>and</strong> 409.1<br />
pertaining to electric operations. Report in column (l) the amounts charged to Accounts 408.1 <strong>and</strong> 109.1 pertaining to other utility departments <strong>and</strong><br />
amounts charged to Accounts 408.2 <strong>and</strong> 409.2. Also shown in column (l) the taxes charged to utility plant or other balance sheet accounts.<br />
9. For any tax apportioned to more than one utility department or account, state in a footnote the basis (necessity) of apportioning such tax.<br />
BALANCE AT END OF YEAR DISTRIBUTION OF TAXES CHARGED<br />
(Taxes accrued Prepaid Taxes<br />
<strong>Electric</strong> Extraordinary Items Adjustments to Ret.<br />
Other<br />
Account 236) (Incl. in Account 165) (Account 408.1, 409.1) (Account 409.3) Earnings (Account 439)<br />
(g) (h) (i) (j) (k) (l)<br />
1<br />
9,866,674 61,103,347<br />
20,025,560 2<br />
118,890,329 -17,814,651<br />
-15,472,781 3<br />
51,735 929,148<br />
366,012 4<br />
14,462,254 5<br />
6<br />
128,808,738 58,680,098<br />
4,918,791 7<br />
8<br />
9<br />
113,895 44,866 10<br />
9,214,147 40,969,983<br />
92,914,950 11<br />
354,822 6,230,706<br />
2,454,415 12<br />
13<br />
9,568,969 47,314,584<br />
95,414,231 14<br />
15<br />
16<br />
34,756 13,692 17<br />
195,683,548 53,016,425 18<br />
1,430,912 6,152,015<br />
2,423,417 19<br />
704,520 277,526 20<br />
842,190 286,799 21<br />
22<br />
1,430,912 203,417,029<br />
56,017,859 23<br />
24<br />
25<br />
26<br />
27<br />
28<br />
29<br />
30<br />
31<br />
32<br />
33<br />
34<br />
35<br />
36<br />
37<br />
38<br />
39<br />
40<br />
Line<br />
No.<br />
139,808,619<br />
309,411,711 156,350,881<br />
41<br />
<strong>FERC</strong> FORM NO. 1 (ED. 12-96) Page 263
Name of Respondent<br />
PACIFIC GAS AND ELECTRIC COMPANY<br />
This Report is:<br />
(1) X An Original<br />
(2) A Resubmission<br />
Date of Report<br />
(Mo, Da, Yr)<br />
04/08/2011<br />
Year/Period of Report<br />
<strong>2010</strong>/Q4<br />
FOOTNOTE DATA<br />
Schedule Page: 262 Line No.: 1 Column: l<br />
<strong>Gas</strong><br />
Non-utility<br />
(Account 408.1 (Account 408.2 Total<br />
409.1) 409.2) Other<br />
(a) (b) (c)<br />
FEDERAL<br />
FICA 20,025,560 0 20,025,560<br />
Taxes on Income (10,692,195) (4,780,586) (15,472,781)<br />
Unemployment 366,012 0 366,012<br />
Total Federal Taxes 9,699,377 (4,780,586) 4,918,791<br />
STATE<br />
State Training Tax Fund 44,866 0 44,866<br />
Taxes on Income 97,212,748 (4,297,798) 92,914,950<br />
Unemployment 2,454,415 0 2,454,415<br />
Total State Taxes 99,712,029 (4,297,798) 95,414,231<br />
STATE AND LOCAL<br />
Timber Yield Tax 13,692 0 13,692<br />
Ad Valorem Property 52,709,010 307,415 53,016,425<br />
Payroll Tax 2,423,417 0 2,423,417<br />
Business Tax 277,526 0 277,526<br />
Other 286,799 0 286,799<br />
Total Local Taxes 55,710,444 307,415 56,017,859<br />
Schedule Page: 262 Line No.: 3 Column: f<br />
This consists of the following:<br />
165,121,850 (8,770,969) 156,350,881<br />
FIN 48 gross interest $-21,874,634<br />
Activity booked to Account 143 due<br />
to debit balance 140,907,000<br />
Total $119,032,366<br />
Schedule Page: 262 Line No.: 11 Column: f<br />
This consists of the following:<br />
Reclass debit balance of Account 236<br />
to Account 143 $-47,908,668<br />
Activity booked to Account 143 due to<br />
debit balance -145,445,081<br />
Total $-193,353,749<br />
<strong>FERC</strong> FORM NO. 1 (ED. 12-87) Page 450.1
Name of Respondent<br />
This Report Is:<br />
Date of Report<br />
(1) X An Original<br />
(Mo, Da, Yr)<br />
PACIFIC GAS AND ELECTRIC COMPANY<br />
(2) A Resubmission<br />
04/08/2011<br />
ACCUMULATED DEFERRED INVESTMENT TAX CREDITS (Account 255)<br />
the average period over which the tax credits are amortized.<br />
Line Account Balance at Beginning<br />
No. Subdivisions<br />
of Year<br />
(a)<br />
(b)<br />
Year/Period of Report<br />
End of <strong>2010</strong>/Q4<br />
Report below information applicable to Account 255. Where appropriate, segregate the balances <strong>and</strong> transactions by utility <strong>and</strong><br />
nonutility operations. Explain by footnote any correction adjustments to the account balance shown in column (g).Include in column (i)<br />
Allocations to<br />
Deferred for Year<br />
Current Year's Income<br />
Adjustments<br />
Account No. Amount Account No. Amount<br />
(c)<br />
(d) (e) (f) (g)<br />
1 <strong>Electric</strong> Utility<br />
2 3%<br />
3 4%<br />
4 7%<br />
5 10% 58,217,000 411.5 271,362<br />
6<br />
7<br />
8 TOTAL 58,217,000 271,362<br />
9 Other (List separately<br />
<strong>and</strong> show 3%, 4%, 7%,<br />
10% <strong>and</strong> TOTAL)<br />
10<br />
11 10% 30,514,266 411.5 1,558,000<br />
12<br />
13 TOTAL GAS 30,514,266 1,558,000<br />
14<br />
15 ELECTRIC AND GAS 88,731,266 1,829,362<br />
16<br />
17<br />
18<br />
19<br />
20<br />
21<br />
22<br />
23<br />
24<br />
25<br />
26<br />
27<br />
28<br />
30<br />
31<br />
32<br />
33<br />
34<br />
35<br />
36<br />
37<br />
38<br />
39<br />
40<br />
41<br />
42<br />
43<br />
44<br />
45<br />
46<br />
47<br />
48<br />
<strong>FERC</strong> FORM NO. 1 (ED. 12-89) Page 266
Name of Respondent<br />
This Report Is:<br />
Date of Report<br />
(1) X An Original<br />
(Mo, Da, Yr)<br />
PACIFIC GAS AND ELECTRIC COMPANY<br />
(2) A Resubmission<br />
04/08/2011<br />
ACCUMULATED DEFERRED INVESTMENT TAX CREDITS (Account 255) (continued)<br />
Year/Period of Report<br />
End of <strong>2010</strong>/Q4<br />
Balance at End<br />
of Year<br />
(h)<br />
Average Period<br />
of Allocation<br />
to Income<br />
(i)<br />
ADJUSTMENT EXPLANATION<br />
57,945,638 16 5<br />
57,945,638 8<br />
Line<br />
No.<br />
1<br />
2<br />
3<br />
4<br />
6<br />
7<br />
9<br />
22 10<br />
28,956,266 11<br />
12<br />
28,956,266 13<br />
14<br />
86,901,904 15<br />
16<br />
17<br />
18<br />
19<br />
20<br />
21<br />
22<br />
23<br />
24<br />
25<br />
26<br />
27<br />
28<br />
30<br />
31<br />
32<br />
33<br />
34<br />
35<br />
36<br />
37<br />
38<br />
39<br />
40<br />
41<br />
42<br />
43<br />
44<br />
45<br />
46<br />
47<br />
48<br />
<strong>FERC</strong> FORM NO. 1 (ED. 12-89) Page 267
Name of Respondent<br />
PACIFIC GAS AND ELECTRIC COMPANY<br />
Line<br />
No.<br />
Description <strong>and</strong> Other<br />
Deferred Credits<br />
(a)<br />
This Report Is:<br />
Date of Report<br />
(1) X An Original<br />
(Mo, Da, Yr)<br />
(2) A Resubmission<br />
04/08/2011<br />
OTHER DEFFERED CREDITS (Account 253)<br />
Balance at<br />
Beginning of Year<br />
(b)<br />
Contra<br />
Account<br />
(c)<br />
DEBITS<br />
Amount<br />
(d)<br />
Credits<br />
(e)<br />
Year/Period of Report<br />
End of <strong>2010</strong>/Q4<br />
1. Report below the particulars (details) called for concerning other deferred credits.<br />
2. For any deferred credit being amortized, show the period of amortization.<br />
3. Minor items (5% of the Balance End of Year for Account 253 or amounts less than $100,000, whichever is greater) may be grouped by classes.<br />
1<br />
2<br />
3<br />
4<br />
5<br />
6<br />
7<br />
8<br />
9<br />
10<br />
11<br />
12<br />
13<br />
14<br />
15<br />
16<br />
17<br />
18<br />
19<br />
20<br />
21<br />
22<br />
23<br />
24<br />
25<br />
26<br />
27<br />
28<br />
29<br />
30<br />
31<br />
32<br />
33<br />
34<br />
35<br />
36<br />
37<br />
38<br />
39<br />
40<br />
41<br />
42<br />
43<br />
44<br />
45<br />
46<br />
Balance at<br />
End of Year<br />
CIAC Deferred Revenue 213,799,398 Various<br />
7,211,388<br />
206,588,010<br />
Deferred Credits - <strong>Electric</strong> 49,184,799 Various<br />
1,047,543<br />
48,137,256<br />
Reserves<br />
Deferred Credits - Hazardous 38,027,079 Various<br />
38,027,079<br />
Substance Insurance Recoveries<br />
Performance Shares Liability 30,817,488 Various<br />
-19,305,705<br />
11,511,783<br />
Other 18,655,209 Various<br />
6,332,089<br />
24,987,298<br />
(f)<br />
47 TOTAL 350,483,973<br />
46,286,010 -12,973,616<br />
291,224,347<br />
<strong>FERC</strong> FORM NO. 1 (ED. 12-94) Page 269
Name of Respondent<br />
This Report Is:<br />
Date of Report<br />
Year/Period of Report<br />
(1) X An Original<br />
(Mo, Da, Yr)<br />
PACIFIC GAS AND ELECTRIC COMPANY<br />
End of <strong>2010</strong>/Q4<br />
(2) A Resubmission<br />
04/08/2011<br />
ACCUMULATED DEFERRED INCOME TAXES - ACCELERATED AMORTIZATION PROPERTY (Account 281)<br />
1. Report the information called for below concerning the respondent’s accounting for deferred income taxes rating to amortizable<br />
property.<br />
2. For other (Specify),include deferrals relating to other income <strong>and</strong> deductions.<br />
Line<br />
No.<br />
CHANGES DURING YEAR<br />
Account<br />
Balance at<br />
Beginning of Year<br />
Amounts Debited<br />
Amounts Credited<br />
to Account 410.1 to Account 411.1<br />
(a) (b) (c) (d)<br />
1 Accelerated Amortization (Account 281)<br />
2 <strong>Electric</strong><br />
3 Defense Facilities<br />
4 Pollution Control Facilities<br />
5 Other (provide details in footnote):<br />
6 Settlement Regulatory Asset<br />
7<br />
8 TOTAL <strong>Electric</strong> (Enter Total of lines 3 thru 7)<br />
9 <strong>Gas</strong><br />
10 Defense Facilities<br />
11 Pollution Control Facilities<br />
12 Other (provide details in footnote):<br />
13<br />
14<br />
15 TOTAL <strong>Gas</strong> (Enter Total of lines 10 thru 14)<br />
16<br />
17 TOTAL (Acct 281) (Total of 8, 15 <strong>and</strong> 16)<br />
18 Classification of TOTAL<br />
19 Federal Income Tax<br />
20 State Income Tax<br />
21 Local Income Tax<br />
1,105,025,558<br />
1,105,025,558<br />
1,105,025,558<br />
870,627,356<br />
234,398,202<br />
-9,004,908<br />
-9,004,908<br />
-9,004,908<br />
-7,051,259<br />
-1,953,649<br />
NOTES<br />
<strong>FERC</strong> FORM NO. 1 (ED. 12-96) Page 272
Name of Respondent<br />
This Report Is:<br />
Date of Report<br />
Year/Period of Report<br />
(1) X An Original<br />
(Mo, Da, Yr)<br />
PACIFIC GAS AND ELECTRIC COMPANY<br />
End of <strong>2010</strong>/Q4<br />
(2) A Resubmission<br />
04/08/2011<br />
ACCUMULATED DEFERRED INCOME TAXES _ ACCELERATED AMORTIZATION PROPERTY (Account 281) (Continued)<br />
3. Use footnotes as required.<br />
CHANGES DURING YEAR<br />
ADJUSTMENTS<br />
Amounts Debited Amounts Credited<br />
Debits<br />
Credits<br />
Balance at<br />
to Account 410.2 to Account 411.2 Account<br />
Amount<br />
Account<br />
Amount<br />
End of Year<br />
Credited<br />
Debited<br />
(e) (f) (g)<br />
(h) (j)<br />
(i)<br />
(k)<br />
Line<br />
No.<br />
1<br />
2<br />
3<br />
4<br />
5<br />
1,114,030,466 6<br />
7<br />
1,114,030,466 8<br />
9<br />
10<br />
11<br />
12<br />
13<br />
14<br />
15<br />
16<br />
1,114,030,466 17<br />
18<br />
877,678,615 19<br />
236,351,851 20<br />
21<br />
NOTES (Continued)<br />
<strong>FERC</strong> FORM NO. 1 (ED. 12-96) Page 273
Name of Respondent<br />
This Report Is:<br />
Date of Report<br />
Year/Period of Report<br />
(1) X An Original<br />
(Mo, Da, Yr)<br />
PACIFIC GAS AND ELECTRIC COMPANY<br />
End of <strong>2010</strong>/Q4<br />
(2) A Resubmission<br />
04/08/2011<br />
ACCUMULATED DEFFERED INCOME TAXES - OTHER PROPERTY (Account 282)<br />
1. Report the information called for below concerning the respondent’s accounting for deferred income taxes rating to property not<br />
subject to accelerated amortization<br />
2. For other (Specify),include deferrals relating to other income <strong>and</strong> deductions.<br />
CHANGES DURING YEAR<br />
Line<br />
Account<br />
Balance at<br />
No.<br />
Beginning of Year<br />
Amounts Debited<br />
Amounts Credited<br />
to Account 410.1 to Account 411.1<br />
(a) (b) (c) (d)<br />
1 Account 282<br />
2 <strong>Electric</strong> 3,646,688,960 -482,269,725 -1,343,799,904<br />
3 <strong>Gas</strong> 809,334,691 -204,238,970 -356,877,021<br />
4 Non-Utility 2,553,719<br />
5 TOTAL (Enter Total of lines 2 thru 4) 4,458,577,370 -686,508,695 -1,700,676,925<br />
6<br />
7<br />
8<br />
9 TOTAL Account 282 (Enter Total of lines 5 thru 4,458,577,370 -686,508,695 -1,700,676,925<br />
10 Classification of TOTAL<br />
11 Federal Income Tax 3,857,107,872 -537,568,017 -1,331,708,584<br />
12 State Income Tax 601,469,498 -148,940,678 -368,968,341<br />
13 Local Income Tax<br />
NOTES<br />
<strong>FERC</strong> FORM NO. 1 (ED. 12-96) Page 274
Name of Respondent<br />
This Report Is:<br />
Date of Report<br />
(1) X An Original<br />
(Mo, Da, Yr)<br />
PACIFIC GAS AND ELECTRIC COMPANY<br />
(2) A Resubmission<br />
04/08/2011<br />
ACCUMULATED DEFERRED INCOME TAXES - OTHER PROPERTY (Account 282) (Continued)<br />
3. Use footnotes as required.<br />
Year/Period of Report<br />
End of <strong>2010</strong>/Q4<br />
CHANGES DURING YEAR<br />
ADJUSTMENTS<br />
Amounts Debited Amounts Credited<br />
Debits<br />
Credits<br />
Balance at<br />
to Account 410.2 to Account 411.2 Account<br />
Amount<br />
Account<br />
Amount<br />
End of Year<br />
Credited<br />
Debited<br />
(e) (f) (g)<br />
(h) (j)<br />
(i)<br />
(k)<br />
Line<br />
No.<br />
192,529,786 4,700,748,925 2<br />
82,512,766 1,044,485,508 3<br />
2,553,719 4<br />
275,042,552 5,747,788,152 5<br />
6<br />
7<br />
8<br />
275,042,552 5,747,788,152 9<br />
10<br />
215,371,022 4,866,619,461 11<br />
59,671,530 881,168,691 12<br />
13<br />
1<br />
NOTES (Continued)<br />
<strong>FERC</strong> FORM NO. 1 (ED. 12-96) Page 275
Name of Respondent<br />
PACIFIC GAS AND ELECTRIC COMPANY<br />
This Report is:<br />
(1) X An Original<br />
(2) A Resubmission<br />
Date of Report<br />
(Mo, Da, Yr)<br />
04/08/2011<br />
Year/Period of Report<br />
<strong>2010</strong>/Q4<br />
FOOTNOTE DATA<br />
Schedule Page: 274 Line No.: 2 Column: j<br />
This consists of the following:<br />
SFAS 109 adjustment - account 182.3 (117,975,593<br />
)<br />
NDT Tax Settlement 9,293,162<br />
Other adjustment <strong>and</strong> reclassification (return-to-accrual (55,634,319)<br />
true-up)<br />
Other adjustment <strong>and</strong> reclassification (FIN48) (78,953,133)<br />
Current - Noncurrent Reclass (4,894,223)<br />
(248,164,106<br />
)<br />
Schedule Page: 274 Line No.: 3 Column: j<br />
This consists of the following:<br />
SFAS 109 adjustment - account 182.3 (50,560,968)<br />
NDT Tax Settlement 3,982,784<br />
Other adjustment <strong>and</strong> reclassification<br />
(33,837,057)<br />
(FIN48)<br />
Current - Noncurrent Reclass (2,097,524)<br />
(82,512,766)<br />
<strong>FERC</strong> FORM NO. 1 (ED. 12-87) Page 450.1
Name of Respondent<br />
This Report Is:<br />
Date of Report<br />
Year/Period of Report<br />
(1) X An Original<br />
(Mo, Da, Yr)<br />
PACIFIC GAS AND ELECTRIC COMPANY<br />
End of <strong>2010</strong>/Q4<br />
(2) A Resubmission<br />
04/08/2011<br />
ACCUMULATED DEFFERED INCOME TAXES - OTHER (Account 283)<br />
1. Report the information called for below concerning the respondent’s accounting for deferred income taxes relating to amounts<br />
recorded in Account 283.<br />
2. For other (Specify),include deferrals relating to other income <strong>and</strong> deductions.<br />
CHANGES DURING YEAR<br />
Line<br />
Account<br />
Balance at<br />
Amounts Debited Amounts Credited<br />
No.<br />
Beginning of Year<br />
to Account 410.1 to Account 411.1<br />
(a) (b) (c) (d)<br />
1 Account 283<br />
2 <strong>Electric</strong><br />
3 Loss on Reacquired Debt<br />
73,338,592<br />
-7,239,955<br />
-419,020<br />
4 Balancing Accounts<br />
388,094,238<br />
-244,658,393<br />
1,444,824<br />
5<br />
6<br />
7<br />
8<br />
Other<br />
-121,206,986<br />
-63,464,327<br />
-72,769,954<br />
9 TOTAL <strong>Electric</strong> (Total of lines 3 thru 8)<br />
10 <strong>Gas</strong><br />
340,225,844<br />
-315,362,675<br />
-71,744,150<br />
11 Loss on Reacquired Debt<br />
18,973,032<br />
-3,102,838<br />
-187,206<br />
12 Balancing Accounts<br />
25,327,129<br />
-57,194,342<br />
-60,862,980<br />
13 Hedging<br />
14<br />
15<br />
16<br />
Other<br />
-51,448,521<br />
-30,238,587<br />
-32,093,835<br />
17 TOTAL <strong>Gas</strong> (Total of lines 11 thru 16)<br />
-7,148,360<br />
-90,535,767<br />
-93,144,021<br />
18 Other<br />
715,742<br />
19 TOTAL (Acct 283) (Enter Total of lines 9, 17 <strong>and</strong> 18)<br />
20 Classification of TOTAL<br />
21 Federal Income Tax<br />
333,793,226<br />
303,915,805<br />
-405,898,442<br />
-317,837,228<br />
-164,888,171<br />
-129,115,054<br />
22 State Income Tax<br />
23 Local Income Tax<br />
29,877,421<br />
-88,061,214<br />
-35,773,117<br />
NOTES<br />
<strong>FERC</strong> FORM NO. 1 (ED. 12-96) Page 276
Name of Respondent<br />
This Report Is:<br />
Date of Report<br />
Year/Period of Report<br />
(1) X An Original<br />
(Mo, Da, Yr)<br />
PACIFIC GAS AND ELECTRIC COMPANY<br />
End of <strong>2010</strong>/Q4<br />
(2) A Resubmission<br />
04/08/2011<br />
ACCUMULATED DEFERRED INCOME TAXES - OTHER (Account 283) (Continued)<br />
3. Provide in the space below explanations for Page 276 <strong>and</strong> 277. Include amounts relating to insignificant items listed under Other.<br />
4. Use footnotes as required.<br />
CHANGES DURING YEAR<br />
ADJUSTMENTS<br />
Amounts Debited Amounts Credited<br />
Debits<br />
Credits<br />
Balance at Line<br />
to Account 410.2 to Account 411.2 Account<br />
Amount<br />
Account<br />
Amount<br />
End of Year No.<br />
Credited<br />
Debited<br />
(e) (f) (g)<br />
(h) (i)<br />
(j) (k)<br />
1<br />
2<br />
66,517,657 3<br />
141,991,021 4<br />
19,612,533 -92,288,826 5<br />
19,612,533 116,219,852 9<br />
6<br />
7<br />
8<br />
10<br />
16,057,400 11<br />
28,995,767 12<br />
13<br />
8,405,372 -41,187,901 14<br />
15<br />
16<br />
8,405,372 3,865,266 17<br />
-61,189 358,535<br />
296,018 18<br />
-61,189 358,535<br />
28,017,905<br />
120,381,136 19<br />
-47,914 280,749<br />
21,939,314<br />
136,804,282 21<br />
-13,275 77,786<br />
6,078,591<br />
-16,423,146 22<br />
20<br />
23<br />
NOTES (Continued)<br />
<strong>FERC</strong> FORM NO. 1 (ED. 12-96) Page 277
Name of Respondent<br />
PACIFIC GAS AND ELECTRIC COMPANY<br />
This Report is:<br />
(1) X An Original<br />
(2) A Resubmission<br />
Date of Report<br />
(Mo, Da, Yr)<br />
04/08/2011<br />
Year/Period of Report<br />
<strong>2010</strong>/Q4<br />
FOOTNOTE DATA<br />
Schedule Page: 276 Line No.: 5 Column: j<br />
This represents other adjustment <strong>and</strong> reclassification (between deferred accounts).<br />
Schedule Page: 276 Line No.: 14 Column: j<br />
This represents other adjustment <strong>and</strong> reclassification (between deferred accounts).<br />
Schedule Page: 276 Line No.: 18 Column: a<br />
This relates significantly to gain or loss on reacquired debt (non-utility).<br />
<strong>FERC</strong> FORM NO. 1 (ED. 12-87) Page 450.1
Name of Respondent<br />
PACIFIC GAS AND ELECTRIC COMPANY<br />
Line<br />
No.<br />
Description <strong>and</strong> Purpose of<br />
Other Regulatory Liabilities<br />
This Report Is:<br />
Date of Report<br />
(1) X An Original<br />
(Mo, Da, Yr)<br />
(2) A Resubmission<br />
04/08/2011<br />
OTHER REGULATORY LIABILITIES (Account 254)<br />
DEBITS<br />
Account<br />
Credited<br />
Amount<br />
(c)<br />
(d)<br />
Credits<br />
(e)<br />
Year/Period of Report<br />
End of <strong>2010</strong>/Q4<br />
1. Report below the particulars (details) called for concerning other regulatory liabilities, including rate order docket number, if<br />
applicable.<br />
2. Minor items (5% of the Balance in Account 254 at end of period, or amounts less than $100,000 which ever is less), may be grouped<br />
by classes.<br />
3. For Regulatory Liabilities being amortized, show period of amortization.<br />
(a)<br />
1 <strong>Electric</strong> Procurement Collateral Payment<br />
2<br />
3<br />
4<br />
5<br />
6<br />
7<br />
8<br />
9<br />
10<br />
11<br />
12<br />
13<br />
14<br />
15<br />
16<br />
17<br />
18<br />
19<br />
20<br />
21<br />
22<br />
23<br />
24<br />
25<br />
26<br />
27<br />
28<br />
29<br />
30<br />
31<br />
32<br />
33<br />
34<br />
35<br />
36<br />
37<br />
38<br />
39<br />
40<br />
Balance at Begining<br />
of Current<br />
Quarter/Year<br />
(b)<br />
Balance at End<br />
of Current<br />
Quarter/Year<br />
(f)<br />
Miscellaneous <strong>Gas</strong> Reg Liab - Current 3,878,394 182.3<br />
480,284 3,398,110<br />
Miscellaneous <strong>Gas</strong> Reg Liab - NonCurrent<br />
Miscellaneous <strong>Electric</strong> Reg Liab - Current<br />
( 204,540) 204,540<br />
155,149,395 Various<br />
88,716,461 66,432,934<br />
Miscellaneous <strong>Electric</strong> Reg Liab - NonCurrent 70,297,858 254<br />
50,292,910 20,004,948<br />
Sempra & Price Indexing <strong>Gas</strong><br />
1,154,355 -1,154,355<br />
Non Current Reg Liab-CC8 Settlement 64,843,137 107<br />
2,059,472 62,783,665<br />
Direct Access Discretionary Cost/Revenue ( 6,729,794) 182.3<br />
1,745,783 -8,475,577<br />
Humboldt Bay Power Plant Memo Account<br />
Affiliate Transaction Fee Memo Account<br />
3,010,509 2,264,497<br />
5,275,006<br />
252,345 136,606<br />
388,951<br />
<strong>Gas</strong> Price Risk Management - Current 2,221,700 176<br />
1,579,688 642,012<br />
<strong>Gas</strong> Price Risk Management - NonCurrent 4,767,170 176<br />
3,377,108 1,390,062<br />
<strong>Electric</strong> Price Risk Management - Curren 73,966,343 175<br />
31,668,835 42,297,508<br />
<strong>Electric</strong> Price Risk Management - NonCurrent<br />
Headroom Account<br />
FAS 143 Regulatory Liability<br />
FIN 47 Regulatory Liability<br />
Customer Credit Holding Account<br />
California Solar Initiative<br />
Air Conditioning Expenditure<br />
Energy Efficiency - <strong>Electric</strong><br />
PPP Energy Efficiency - <strong>Gas</strong><br />
PPP Surcharge Energy Efficiency - <strong>Gas</strong><br />
PPP Low Income - <strong>Electric</strong><br />
PPP Low Income - <strong>Gas</strong><br />
PPP Surcharge Low Income - <strong>Gas</strong><br />
PPP Surcharge RDD - <strong>Gas</strong><br />
Affiliate Transfer Fees Account<br />
Non-Tariffed Products <strong>and</strong> Svcs BA-<strong>Electric</strong><br />
Non-Tariffed Products <strong>and</strong> Svcs BA-<strong>Gas</strong><br />
Procurement Energy Effiency<br />
On Bill Financing Balancing <strong>Electric</strong><br />
On Bill Financing Balancing <strong>Gas</strong><br />
Hazardous Insurance Recoveries<br />
59,405,376 7,653,877<br />
67,059,253<br />
164,285 Various<br />
2 164,283<br />
715,573,013 125,137,795 840,710,808<br />
( 227,286,219) Various<br />
13,209,122 -240,495,341<br />
131,611 295<br />
131,906<br />
208,624,631 Various<br />
58,840,364 149,784,267<br />
45,248,238 31,138,558<br />
76,386,796<br />
43,383,959 9,085,948<br />
52,469,907<br />
16,812,567 6,881,420<br />
23,693,987<br />
( 7,998,044) Various<br />
8,039,556 -16,037,600<br />
18,875,655 10,182,161<br />
29,057,816<br />
5,931,025 Various<br />
3,190,641 2,740,384<br />
( 8,111,186) 4,424,240<br />
-3,686,946<br />
( 520,564) 262,098<br />
-258,466<br />
99,404 53,813<br />
153,217<br />
( 43,004) 317,191<br />
274,187<br />
( 35,185) 259,521<br />
224,336<br />
57,352,175 21,706,205<br />
79,058,380<br />
15,189,552<br />
3,334,202<br />
24,450,543<br />
15,189,552<br />
3,334,202<br />
24,450,543<br />
41 TOTAL 1,299,060,254<br />
264,354,581 262,683,062 1,297,388,735<br />
<strong>FERC</strong> FORM NO. 1/3-Q (REV 02-04) Page 278
Name of Respondent<br />
PACIFIC GAS AND ELECTRIC COMPANY<br />
This Report is:<br />
(1) X An Original<br />
(2) A Resubmission<br />
Date of Report<br />
(Mo, Da, Yr)<br />
04/08/2011<br />
Year/Period of Report<br />
<strong>2010</strong>/Q4<br />
FOOTNOTE DATA<br />
Schedule Page: 278 Line No.: 7 Column: a<br />
The designations for the type of supporting structure in this column are defined as<br />
follows:<br />
SSP - Single Steel Poles<br />
SWP - Single Wood Poles<br />
WH - Wood "H" Structures<br />
T - Steel Towers<br />
UG - Underground<br />
<strong>FERC</strong> FORM NO. 1 (ED. 12-87) Page 450.1
Name of Respondent<br />
PACIFIC GAS AND ELECTRIC COMPANY<br />
This Report Is:<br />
Date of Report<br />
(1) X An Original<br />
(Mo, Da, Yr)<br />
(2) A Resubmission<br />
04/08/2011<br />
ELECTRIC OPERATING REVENUES (Account 400)<br />
Year/Period of Report<br />
End of <strong>2010</strong>/Q4<br />
1. The following instructions generally apply to the annual version of these pages. Do not report quarterly data in columns (c), (e), (f), <strong>and</strong> (g). Unbilled revenues <strong>and</strong> MWH<br />
related to unbilled revenues need not be reported separately as required in the annual version of these pages.<br />
2. Report below operating revenues for each prescribed account, <strong>and</strong> manufactured gas revenues in total.<br />
3. Report number of customers, columns (f) <strong>and</strong> (g), on the basis of meters, in addition to the number of flat rate accounts; except that where separate meter readings are added<br />
for billing purposes, one customer should be counted for each group of meters added. The -average number of customers means the average of twelve figures at the close of<br />
each month.<br />
4. If increases or decreases from previous period (columns (c),(e), <strong>and</strong> (g)), are not derived from previously reported figures, explain any inconsistencies in a footnote.<br />
5. Disclose amounts of $250,000 or greater in a footnote for accounts 451, 456, <strong>and</strong> 457.2.<br />
Line<br />
No.<br />
1<br />
2<br />
3<br />
4<br />
5<br />
6<br />
7<br />
8<br />
9<br />
10<br />
11<br />
12<br />
13<br />
14<br />
15<br />
16<br />
17<br />
18<br />
19<br />
20<br />
21<br />
22<br />
23<br />
24<br />
25<br />
26<br />
27<br />
Title of Account<br />
Operating Revenues Year<br />
to Date Quarterly/Annual<br />
(a)<br />
(b)<br />
Sales of <strong>Electric</strong>ity<br />
(440) Residential Sales 4,795,501,768<br />
(442) Commercial <strong>and</strong> Industrial Sales<br />
Small (or Comm.) (See Instr. 4) 5,559,550,382<br />
Large (or Ind.) (See Instr. 4) 1,423,531,071<br />
(444) Public Street <strong>and</strong> Highway Lighting 71,456,772<br />
(445) Other Sales to Public Authorities 2,465,159<br />
(446) Sales to Railroads <strong>and</strong> Railways 4,362,151<br />
(448) Interdepartmental Sales 22,540,420<br />
TOTAL Sales to Ultimate Consumers 11,879,407,723<br />
(447) Sales for Resale 63,271,138<br />
TOTAL Sales of <strong>Electric</strong>ity 11,942,678,861<br />
(Less) (449.1) Provision for Rate Refunds -21,673,968<br />
TOTAL Revenues Net of Prov. for Refunds 11,964,352,829<br />
Other Operating Revenues<br />
(450) Forfeited Discounts 4,305,310<br />
(451) Miscellaneous Service Revenues 10,738,741<br />
(453) Sales of Water <strong>and</strong> Water Power 372,864<br />
(454) Rent from <strong>Electric</strong> Property 56,516,278<br />
(455) Interdepartmental Rents<br />
(456) Other <strong>Electric</strong> Revenues -1,306,972,894<br />
(456.1) Revenues from Transmission of <strong>Electric</strong>ity of Others 11,856,022<br />
(457.1) Regional Control Service Revenues<br />
(457.2) Miscellaneous Revenues<br />
(400) Balancing Accounts -35,004,349<br />
TOTAL Other Operating Revenues -1,258,188,028<br />
TOTAL <strong>Electric</strong> Operating Revenues 10,706,164,801<br />
Operating Revenues<br />
Previous year (no Quarterly)<br />
(c)<br />
4,759,286,389<br />
5,307,906,424<br />
1,391,727,726<br />
68,305,535<br />
2,320,306<br />
3,180,894<br />
18,740,759<br />
11,551,468,033<br />
66,368,799<br />
11,617,836,832<br />
-16,184,278<br />
11,634,021,110<br />
5,417,340<br />
12,801,301<br />
394,065<br />
51,267,749<br />
-1,895,642,980<br />
11,727,726<br />
487,540,636<br />
-1,326,494,163<br />
10,307,526,947<br />
<strong>FERC</strong> FORM NO. 1/3-Q (REV. 12-05)<br />
Page 300
Name of Respondent<br />
PACIFIC GAS AND ELECTRIC COMPANY<br />
This Report Is:<br />
Date of Report<br />
(1) X An Original<br />
(Mo, Da, Yr)<br />
(2) A Resubmission<br />
04/08/2011<br />
ELECTRIC OPERATING REVENUES (Account 400)<br />
Year/Period of Report<br />
End of <strong>2010</strong>/Q4<br />
6. Commercial <strong>and</strong> industrial Sales, Account 442, may be classified according to the basis of classification (Small or Commercial, <strong>and</strong> Large or Industrial) regularly used by the<br />
respondent if such basis of classification is not generally greater than 1000 Kw of dem<strong>and</strong>. (See Account 442 of the Uniform System of Accounts. Explain basis of classification<br />
in a footnote.)<br />
7. See pages 108-109, Important Changes During Period, for important new territory added <strong>and</strong> important rate increase or decreases.<br />
8. For Lines 2,4,5,<strong>and</strong> 6, see Page 304 for amounts relating to unbilled revenue by accounts.<br />
9. Include unmetered sales. Provide details of such Sales in a footnote.<br />
MEGAWATT HOURS SOLD<br />
AVG.NO. CUSTOMERS PER MONTH<br />
Year to Date Quarterly/Annual<br />
Amount Previous year (no Quarterly)<br />
Current Year (no Quarterly) Previous Year (no Quarterly)<br />
(d) (e) (f) (g)<br />
30,744,336 31,234,681 4,565,637<br />
4,578,151 2<br />
37,932,845 38,761,410 613,773<br />
613,472 4<br />
14,414,954 14,805,543 1,293<br />
1,335 5<br />
448,325 445,730 31,850<br />
31,252 6<br />
19,761 19,957 16<br />
16 7<br />
345,718 360,383 27<br />
29 8<br />
158,542 135,583<br />
9<br />
84,064,481 85,763,287 5,212,596<br />
5,224,255 10<br />
1,607,595 1,865,338 3<br />
3 11<br />
85,672,076 87,628,625 5,212,599<br />
5,224,258 12<br />
85,672,076 87,628,625 5,212,599<br />
5,224,258 14<br />
Line<br />
No.<br />
1<br />
3<br />
13<br />
Line 12, column (b) includes $<br />
Line 12, column (d) includes<br />
0<br />
0<br />
of unbilled revenues.<br />
MWH relating to unbilled revenues<br />
<strong>FERC</strong> FORM NO. 1/3-Q (REV. 12-05)<br />
Page 301
Name of Respondent<br />
PACIFIC GAS AND ELECTRIC COMPANY<br />
This Report is:<br />
(1) X An Original<br />
(2) A Resubmission<br />
Date of Report<br />
(Mo, Da, Yr)<br />
04/08/2011<br />
Year/Period of Report<br />
<strong>2010</strong>/Q4<br />
FOOTNOTE DATA<br />
Schedule Page: 300 Line No.: 4 Column: b<br />
Line 4 includes all other commercial <strong>and</strong> industrial customers including irrigation<br />
pumping.<br />
Schedule Page: 300 Line No.: 5 Column: b<br />
Line 5 includes commercial <strong>and</strong> industrial customers with dem<strong>and</strong>s of 1,000 Kw or greater.<br />
Schedule Page: 300 Line No.: 10 Column: b<br />
This includes California Department of Water Resources ("DWR") revenues of $1,455,848,989,<br />
which was deducted from Line 21 below.<br />
Schedule Page: 300 Line No.: 10 Column: d<br />
This includes Direct Access MWh of 4,192,541 <strong>and</strong> DWR MWh of 9,799,434<br />
Schedule Page: 300 Line No.: 17 Column: b<br />
This consists of :<br />
NSF fees <strong>and</strong> rent charges to customers' refundable deposits 4,540,811<br />
Funds received from customers for damages to Utility property (144,691)<br />
MLX billings to electric residential customers 3,132,311<br />
MLX billings to electric non-residential customers 1,844,965<br />
Miscellaneous (items under $250,000) 234,764<br />
Misc. Service Revenues 1,130,581<br />
Total 10,738,741<br />
Schedule Page: 300 Line No.: 21 Column: b<br />
This consists of :<br />
California Department of Water Resources ("DWR") (1,382,937,262)<br />
Unbilled revenues (19,086,906)<br />
Other electric revenues not classified elsewhere 71,007,541<br />
Reimbursement to the Utility for costs spent on customer<br />
43,530,065<br />
projects<br />
Reimbursement fees paid to the CPUC based on sales (19,932,988)<br />
Transition Cost Revenue Account for non-bypassable charges 18,184,726<br />
Revenue assigned - base (19,070,114)<br />
Other revenue-damage claim 1,207,330<br />
MCI rights of way 864,577<br />
Timber sales 1,324,862<br />
Miscellaneous (items under $400,000) (2,064,724)<br />
Total (1,306,972,894)<br />
The DWR revenues of ($1,382,937,262) above represents amount passed through to the DWR.<br />
The Utility acts as a pass-through entity for electricity purchased by the DWR that is<br />
sold to the Utility's customers. Although charges for electricity provided by the DWR are<br />
included in the amounts the Utility bills its customers, the Utility deducts from<br />
electricity revenues amounts passed through to the DWR. The pass-through amounts are based<br />
on the quantities of electricity provided by the DWR that are consumed by customers,<br />
priced at the related CPUC-approved remittance rate. These pass-through amounts are<br />
excluded from the Utility's electricity revenues in its Statement of Income.<br />
<strong>FERC</strong> FORM NO. 1 (ED. 12-87) Page 450.1
Name of Respondent<br />
PACIFIC GAS AND ELECTRIC COMPANY<br />
This Report Is:<br />
Date of Report<br />
(1) X An Original<br />
(Mo, Da, Yr)<br />
(2) A Resubmission<br />
04/08/2011<br />
SALES OF ELECTRICITY BY RATE SCHEDULES<br />
Year/Period of Report<br />
End of <strong>2010</strong>/Q4<br />
1. Report below for each rate schedule in effect during the year the MWH of electricity sold, revenue, average number of customer, average Kwh per<br />
customer, <strong>and</strong> average revenue per Kwh, excluding date for Sales for Resale which is reported on Pages 310-311.<br />
2. Provide a subheading <strong>and</strong> total for each prescribed operating revenue account in the sequence followed in "<strong>Electric</strong> Operating Revenues," Page<br />
300-301. If the sales under any rate schedule are classified in more than one revenue account, List the rate schedule <strong>and</strong> sales data under each<br />
applicable revenue account subheading.<br />
3. Where the same customers are served under more than one rate schedule in the same revenue account classification (such as a general residential<br />
schedule <strong>and</strong> an off peak water heating schedule), the entries in column (d) for the special schedule should denote the duplication in number of reported<br />
customers.<br />
4. The average number of customers should be the number of bills rendered during the year divided by the number of billing periods during the year (12<br />
if all billings are made monthly).<br />
5. For any rate schedule having a fuel adjustment clause state in a footnote the estimated additional revenue billed pursuant thereto.<br />
6. Report amount of unbilled revenue as of end of year for each applicable revenue account subheading.<br />
Line Number <strong>and</strong> Title of Rate schedule MWh Sold<br />
Revenue Average Number KWh of Sales Revenue Per<br />
No.<br />
of Customers Per Customer KWh Sold<br />
(a)<br />
(b)<br />
(c)<br />
(d)<br />
(e)<br />
(f)<br />
1 440 Residential Sales:<br />
2 E1 - Individually Metered<br />
3 E1 - California Alternate Rates<br />
4 for Energy (CARE) for<br />
5 low income<br />
28,195,058 4,376,274,502<br />
4,400,351 6,407 0.1552<br />
6 E6<br />
7 E6 - CARE for Low Income<br />
8 E7 - Time-of-Use (TOU)<br />
9 E7 - CARE for Low Income<br />
10 E8 -Seasonal Service Option<br />
11 E8 - CARE for Low Income<br />
64,563<br />
787,049<br />
898,112<br />
12,363,876<br />
133,916,764<br />
177,774,117<br />
9,845<br />
76,241<br />
57,178<br />
6,558<br />
10,323<br />
15,707<br />
0.1915<br />
0.1702<br />
0.1979<br />
12 EA7 -Experimental Alternate<br />
13 Peak TOU Service<br />
14 EA7 - CARE for Low Income<br />
15 EA9<br />
503<br />
1,622<br />
80,939<br />
314,082<br />
39<br />
166<br />
12,897<br />
9,771<br />
0.1609<br />
0.1936<br />
16 EB9<br />
29 3,967<br />
15 1,933 0.1368<br />
17 ECLSD<br />
-2,108<br />
18 EM -Master-Metered Multi- family<br />
286,850 50,466,014<br />
18,622 15,404 0.1759<br />
19 ENET - New Energy Metering Servic<br />
-54<br />
20 EML -Multifamily CARE Program<br />
27,497 2,359,162<br />
181 151,917 0.0858<br />
21 EMTOU<br />
189 23,178<br />
5 37,800 0.1226<br />
22 ES -Multi-family Service<br />
27,091 3,184,338<br />
263 103,008 0.1175<br />
23 ESL -Multifamily CARE<br />
29,633 2,981,294<br />
261 113,536 0.1006<br />
24 ESR -RV Park <strong>and</strong> Residential Mari<br />
1,381 175,815<br />
31 44,548 0.1273<br />
25 ESRL -RV Park <strong>and</strong> Residential Ma<br />
6,069 680,142<br />
60 101,150 0.1121<br />
26 ET -Mobilehome Park Service<br />
17,724 1,707,336<br />
278 63,755 0.0963<br />
27 ETL -Low-Income Mobile Home<br />
397,906 32,775,291<br />
2,079 191,393 0.0824<br />
28 MIS-RS<br />
29 MULTI-RS<br />
30 NEMS<br />
-2,341<br />
-651<br />
31 SE1 -St<strong>and</strong>by - Individually Meter<br />
7 789<br />
1 7,000 0.1127<br />
32 SEM1 -St<strong>and</strong>by - Master-Metered<br />
2,993 408,315<br />
10 299,300 0.1364<br />
33 STOUS -St<strong>and</strong>by - TOU<br />
58<br />
1<br />
34 STOUS -St<strong>and</strong>by - TOU Secondary -<br />
35 UNCLASSIFIED<br />
36<br />
61<br />
16,942<br />
10<br />
37 SUBTOTAL RESIDENTIAL<br />
38<br />
39 442 Commercial <strong>and</strong> Industrial<br />
40 Sales:<br />
30,744,337 4,795,501,767<br />
4,565,637 6,734 0.1560<br />
41 TOTAL Billed<br />
42 Total Unbilled Rev.(See Instr. 6)<br />
43 TOTAL<br />
<strong>FERC</strong> FORM NO. 1 (ED. 12-95) Page 304<br />
0 0 0 0 0.0000<br />
0 0 0 0 0.0000<br />
0 0 0 0 0.0000
Name of Respondent<br />
PACIFIC GAS AND ELECTRIC COMPANY<br />
This Report Is:<br />
Date of Report<br />
(1) X An Original<br />
(Mo, Da, Yr)<br />
(2) A Resubmission<br />
04/08/2011<br />
SALES OF ELECTRICITY BY RATE SCHEDULES<br />
Year/Period of Report<br />
End of <strong>2010</strong>/Q4<br />
1. Report below for each rate schedule in effect during the year the MWH of electricity sold, revenue, average number of customer, average Kwh per<br />
customer, <strong>and</strong> average revenue per Kwh, excluding date for Sales for Resale which is reported on Pages 310-311.<br />
2. Provide a subheading <strong>and</strong> total for each prescribed operating revenue account in the sequence followed in "<strong>Electric</strong> Operating Revenues," Page<br />
300-301. If the sales under any rate schedule are classified in more than one revenue account, List the rate schedule <strong>and</strong> sales data under each<br />
applicable revenue account subheading.<br />
3. Where the same customers are served under more than one rate schedule in the same revenue account classification (such as a general residential<br />
schedule <strong>and</strong> an off peak water heating schedule), the entries in column (d) for the special schedule should denote the duplication in number of reported<br />
customers.<br />
4. The average number of customers should be the number of bills rendered during the year divided by the number of billing periods during the year (12<br />
if all billings are made monthly).<br />
5. For any rate schedule having a fuel adjustment clause state in a footnote the estimated additional revenue billed pursuant thereto.<br />
6. Report amount of unbilled revenue as of end of year for each applicable revenue account subheading.<br />
Line Number <strong>and</strong> Title of Rate schedule MWh Sold<br />
Revenue Average Number KWh of Sales Revenue Per<br />
No.<br />
of Customers Per Customer KWh Sold<br />
(a)<br />
(b)<br />
(c)<br />
(d)<br />
(e)<br />
(f)<br />
1 A1 -Small General Service<br />
6,851,680 1,242,760,084<br />
399,858 17,135 0.1814<br />
2 A1F -Small General Service<br />
75,985 15,168,547<br />
18,346 4,142 0.1996<br />
3<br />
1,157 212,520<br />
53 21,830 0.1837<br />
4 A15 -Small General Service<br />
5 A1NC<br />
6 A1NR<br />
649 292,682<br />
533 1,218 0.4510<br />
7 A6 -TOU<br />
1,747,178 296,985,614<br />
27,659 63,169 0.1700<br />
8 A10 -Medium General Dem<strong>and</strong>-<br />
9 Metered Service<br />
10 E1<br />
11 E19 -500 to 999 Kw Dem<strong>and</strong><br />
9,852,725<br />
12,358,129<br />
1,536,838,975<br />
1,533,575,609<br />
48,398<br />
17,137<br />
203,577<br />
721,137<br />
0.1560<br />
0.1241<br />
12 E20 -1000 Kw Dem<strong>and</strong> or More<br />
13,070,374 1,272,331,981<br />
1,047 12,483,643 0.0973<br />
13 E37 - 1000 Kw Dem<strong>and</strong> or More<br />
1,129,638 107,814,772<br />
608 1,857,957 0.0954<br />
14 ECLSD<br />
15 ENET<br />
16 MIS-RS<br />
17 NEMS<br />
4,460<br />
18 AG1 -Agricultural Power<br />
452,819 114,589,284<br />
38,072 11,894 0.2531<br />
19 AG4 -TOU Agricultural Power<br />
583,573 109,322,099<br />
20,607 28,319 0.1873<br />
20 AG5 -Large TOU<br />
21 Agricultural Power<br />
22 AGICE<br />
3,635,956<br />
303,607<br />
466,189,632<br />
26,897,904<br />
17,751<br />
1,967<br />
204,831<br />
154,350<br />
0.1282<br />
0.0886<br />
23 AGR -Split-Wk TOU<br />
24 Agricultural Power<br />
25 AGV -Short-Pk TOU<br />
26 Agricultural Power<br />
57,905<br />
36,607<br />
11,501,212<br />
7,238,811<br />
3,129<br />
2,208<br />
18,506<br />
16,579<br />
0.1986<br />
0.1977<br />
27 OL1 -Outdoor Area Lighting Serv<br />
11,756 3,163,233<br />
17,069 689 0.2691<br />
28 SA1 -St<strong>and</strong>by & General<br />
29 Service<br />
30 SA6 -St<strong>and</strong>by & Small TOU<br />
437<br />
8,617<br />
78,111<br />
1,605,460<br />
8<br />
16<br />
54,625<br />
538,563<br />
0.1787<br />
0.1863<br />
31 SA10 -St<strong>and</strong>by & Alt. Rate for<br />
32 Med-Use<br />
33 SAG1B<br />
34 SAG4E<br />
35 SAG5B<br />
31,721<br />
5<br />
4,793,673<br />
1,174<br />
43 737,698 0.1511<br />
0.2348<br />
36 SE19 -St<strong>and</strong>by & 500 to 999 Kw<br />
37 Dem<strong>and</strong> or More<br />
38 SE20 -St<strong>and</strong>by & 1000 Kw<br />
39 1001430<br />
160,320<br />
966,059<br />
21,490,602<br />
103,468,282<br />
81<br />
80<br />
1,979,259<br />
12,075,738<br />
0.1340<br />
0.1071<br />
40 SE37 -St<strong>and</strong>by - Med Gen<br />
610,010 53,525,101<br />
5 122,002,000 0.0877<br />
41 TOTAL Billed<br />
42 Total Unbilled Rev.(See Instr. 6)<br />
43 TOTAL<br />
<strong>FERC</strong> FORM NO. 1 (ED. 12-95) Page 304.1<br />
0 0 0 0 0.0000<br />
0 0 0 0 0.0000<br />
0 0 0 0 0.0000
Name of Respondent<br />
PACIFIC GAS AND ELECTRIC COMPANY<br />
This Report Is:<br />
Date of Report<br />
(1) X An Original<br />
(Mo, Da, Yr)<br />
(2) A Resubmission<br />
04/08/2011<br />
SALES OF ELECTRICITY BY RATE SCHEDULES<br />
Year/Period of Report<br />
End of <strong>2010</strong>/Q4<br />
1. Report below for each rate schedule in effect during the year the MWH of electricity sold, revenue, average number of customer, average Kwh per<br />
customer, <strong>and</strong> average revenue per Kwh, excluding date for Sales for Resale which is reported on Pages 310-311.<br />
2. Provide a subheading <strong>and</strong> total for each prescribed operating revenue account in the sequence followed in "<strong>Electric</strong> Operating Revenues," Page<br />
300-301. If the sales under any rate schedule are classified in more than one revenue account, List the rate schedule <strong>and</strong> sales data under each<br />
applicable revenue account subheading.<br />
3. Where the same customers are served under more than one rate schedule in the same revenue account classification (such as a general residential<br />
schedule <strong>and</strong> an off peak water heating schedule), the entries in column (d) for the special schedule should denote the duplication in number of reported<br />
customers.<br />
4. The average number of customers should be the number of bills rendered during the year divided by the number of billing periods during the year (12<br />
if all billings are made monthly).<br />
5. For any rate schedule having a fuel adjustment clause state in a footnote the estimated additional revenue billed pursuant thereto.<br />
6. Report amount of unbilled revenue as of end of year for each applicable revenue account subheading.<br />
Line Number <strong>and</strong> Title of Rate schedule MWh Sold<br />
Revenue Average Number KWh of Sales Revenue Per<br />
No.<br />
of Customers Per Customer KWh Sold<br />
(a)<br />
(b)<br />
(c)<br />
(d)<br />
(e)<br />
(f)<br />
1 Dem<strong>and</strong>-Mtrd TOU Svc<br />
2 STOUP -St<strong>and</strong>by - TOU Primary<br />
21,070 5,822,863<br />
126 167,222 0.2764<br />
3 STOUS -St<strong>and</strong>by - TOU<br />
4 Secondary<br />
5 STOUT -St<strong>and</strong>by - TOU<br />
6 Transformer<br />
7 E31<br />
8 UNCLASSIFIED<br />
9<br />
5,980<br />
373,825<br />
18<br />
1,487,540<br />
44,368,098<br />
1,553,130<br />
116<br />
149<br />
51,552<br />
2,508,893<br />
0.2488<br />
0.1187<br />
86.2850<br />
10 SUBTOTAL COMMERCIAL<br />
11 AND INDUSTRIAL<br />
12<br />
13 444 Public Street <strong>and</strong><br />
14 Highway Lighting<br />
52,347,800 6,983,081,453<br />
615,066 85,109 0.1334<br />
15 LS1-A -Utility-Owned Street<br />
16 & Highway Lighting<br />
31,415 9,108,908<br />
3,922 8,010 0.2900<br />
17 LS1-B -Utility-Owned Street<br />
18 & Highway Lighting<br />
30 6,336<br />
8 3,750 0.2112<br />
19 LS1-C -Utility-Owned Street<br />
20 & Highway Lighting<br />
21 LS1-D -Utility-Owned Street<br />
22 & Highway Lighting<br />
23 LS1-E -Utility-Owned Street<br />
24 & Highway Lighting<br />
25 LS1-F -Utility-Owned Street<br />
26 & Highway Lighting<br />
10,080<br />
6,351<br />
17,451<br />
8,178<br />
2,451,154<br />
2,286,446<br />
5,466,628<br />
2,607,881<br />
565<br />
793<br />
1,277<br />
1,403<br />
17,841<br />
8,009<br />
13,666<br />
5,829<br />
0.2432<br />
0.3600<br />
0.3133<br />
0.3189<br />
27 LS1-F1 -Utility-Owned Street<br />
28 & Highway Lighting<br />
3 1,023<br />
7 429 0.3410<br />
29 LS2-A -Customer-Owned Street<br />
30 & Highway Lighting<br />
310,990 39,117,582<br />
8,462 36,751 0.1258<br />
31 LS2-B<br />
17 2,425<br />
2 8,500 0.1426<br />
32 LS2-C -Customer-Owned Street<br />
33 & Highway Lighting<br />
34 LS3 -Cust-Owned Street<br />
35 & Highway Lighting<br />
36 LS3-F -Cust-Owned Street<br />
37 & Highway Lighting<br />
38 TC1 -Traffic Control Service<br />
11,136<br />
8,873<br />
4,080<br />
38,489<br />
1,899,650<br />
1,167,764<br />
660,952<br />
6,447,585<br />
657<br />
1,047<br />
2,198<br />
10,914<br />
16,950<br />
8,475<br />
1,856<br />
3,527<br />
0.1706<br />
0.1316<br />
0.1620<br />
0.1675<br />
39 TC1F -Traffic Control Service<br />
1,228 232,436<br />
595 2,064 0.1893<br />
40 UNCLASSIFIED<br />
3<br />
41 TOTAL Billed<br />
42 Total Unbilled Rev.(See Instr. 6)<br />
43 TOTAL<br />
<strong>FERC</strong> FORM NO. 1 (ED. 12-95) Page 304.2<br />
0 0 0 0 0.0000<br />
0 0 0 0 0.0000<br />
0 0 0 0 0.0000
Name of Respondent<br />
PACIFIC GAS AND ELECTRIC COMPANY<br />
This Report Is:<br />
Date of Report<br />
(1) X An Original<br />
(Mo, Da, Yr)<br />
(2) A Resubmission<br />
04/08/2011<br />
SALES OF ELECTRICITY BY RATE SCHEDULES<br />
Year/Period of Report<br />
End of <strong>2010</strong>/Q4<br />
1. Report below for each rate schedule in effect during the year the MWH of electricity sold, revenue, average number of customer, average Kwh per<br />
customer, <strong>and</strong> average revenue per Kwh, excluding date for Sales for Resale which is reported on Pages 310-311.<br />
2. Provide a subheading <strong>and</strong> total for each prescribed operating revenue account in the sequence followed in "<strong>Electric</strong> Operating Revenues," Page<br />
300-301. If the sales under any rate schedule are classified in more than one revenue account, List the rate schedule <strong>and</strong> sales data under each<br />
applicable revenue account subheading.<br />
3. Where the same customers are served under more than one rate schedule in the same revenue account classification (such as a general residential<br />
schedule <strong>and</strong> an off peak water heating schedule), the entries in column (d) for the special schedule should denote the duplication in number of reported<br />
customers.<br />
4. The average number of customers should be the number of bills rendered during the year divided by the number of billing periods during the year (12<br />
if all billings are made monthly).<br />
5. For any rate schedule having a fuel adjustment clause state in a footnote the estimated additional revenue billed pursuant thereto.<br />
6. Report amount of unbilled revenue as of end of year for each applicable revenue account subheading.<br />
Line Number <strong>and</strong> Title of Rate schedule MWh Sold<br />
Revenue Average Number KWh of Sales Revenue Per<br />
No.<br />
of Customers Per Customer KWh Sold<br />
(a)<br />
(b)<br />
(c)<br />
(d)<br />
(e)<br />
(f)<br />
1<br />
2 SUBTOTAL PUBLIC STREET<br />
3 & HIGHWAY LIGHTING<br />
4<br />
5 445 Other Sales to Public Au-<br />
6 thorities - Special Contracts<br />
7<br />
8 SUBTOTAL OTHER SALES<br />
9 TO PUBLIC AUTHORITIES<br />
10<br />
11 446 Sales to Railroads <strong>and</strong><br />
12 Railways Special Contracts<br />
13<br />
14 SUBTOTAL SALES TO<br />
15 RAILROADS AND RAILWAYS<br />
16<br />
17 448 Interdepartmental Sales<br />
18<br />
19 SUBTOTAL INTERDEPART-<br />
20 MENTAL SALES<br />
21<br />
22 TOTAL SALES TO ULTIMATE<br />
23 CONSUMERS<br />
24<br />
25 447 Sales for Resale<br />
26 Special Contracts<br />
27<br />
28 TOTAL SALES FOR RESALE<br />
29<br />
30 RECAP:<br />
31 Sales to Ultimate Consumer<br />
32 Sale for Resale<br />
33<br />
34 TOTAL BILLED<br />
35<br />
36<br />
37<br />
38<br />
39<br />
40<br />
448,324 71,456,770<br />
31,850 14,076 0.1594<br />
19,761 2,465,160<br />
16 1,235,063 0.1247<br />
19,761 2,465,160<br />
16 1,235,063 0.1247<br />
345,718 4,632,151<br />
27 12,804,370 0.0134<br />
345,718 4,632,151<br />
27 12,804,370 0.0134<br />
158,542 22,540,420<br />
0.1422<br />
158,542 22,540,420<br />
0.1422<br />
84,064,482 11,879,677,721<br />
5,212,596 16,127 0.1413<br />
1,607,595 63,271,138<br />
3 535,865,000 0.0394<br />
1,607,595 63,271,138<br />
3 535,865,000 0.0394<br />
84,064,482 11,879,677,721<br />
5,212,596 16,127 0.1413<br />
1,607,595 63,271,138<br />
3 535,865,000 0.0394<br />
85,672,077 11,942,948,859<br />
5,212,599 16,436 0.1394<br />
41 TOTAL Billed<br />
42 Total Unbilled Rev.(See Instr. 6)<br />
43 TOTAL<br />
<strong>FERC</strong> FORM NO. 1 (ED. 12-95) Page 304.3<br />
0 0 0 0 0.0000<br />
0 0 0 0 0.0000<br />
0 0 0 0 0.0000
Name of Respondent<br />
PACIFIC GAS AND ELECTRIC COMPANY<br />
This Report is:<br />
(1) X An Original<br />
(2) A Resubmission<br />
Date of Report<br />
(Mo, Da, Yr)<br />
04/08/2011<br />
Year/Period of Report<br />
<strong>2010</strong>/Q4<br />
FOOTNOTE DATA<br />
Schedule Page: 304.2 Line No.: 10 Column: a<br />
(1) Mr. Mistry became VP <strong>and</strong> Controller on March 8, <strong>2010</strong>.<br />
<strong>FERC</strong> FORM NO. 1 (ED. 12-87) Page 450.1
Name of Respondent<br />
PACIFIC GAS AND ELECTRIC COMPANY<br />
This Report Is:<br />
Date of Report<br />
(1) X An Original<br />
(Mo, Da, Yr)<br />
(2) A Resubmission<br />
04/08/2011<br />
SALES FOR RESALE (Account 447)<br />
Year/Period of Report<br />
End of <strong>2010</strong>/Q4<br />
1. Report all sales for resale (i.e., sales to purchasers other than ultimate consumers) transacted on a settlement basis other than<br />
power exchanges during the year. Do not report exchanges of electricity ( i.e., transactions involving a balancing of debits <strong>and</strong> credits<br />
for energy, capacity, etc.) <strong>and</strong> any settlements for imbalanced exchanges on this schedule. Power exchanges must be reported on the<br />
Purchased Power schedule (Page 326-327).<br />
2. Enter the name of the purchaser in column (a). Do note abbreviate or truncate the name or use acronyms. Explain in a footnote any<br />
ownership interest or affiliation the respondent has with the purchaser.<br />
3. In column (b), enter a Statistical Classification Code based on the original contractual terms <strong>and</strong> conditions of the service as follows:<br />
RQ - for requirements service. Requirements service is service which the supplier plans to provide on an ongoing basis (i.e., the<br />
supplier includes projected load for this service in its system resource planning). In addition, the reliability of requirements service must<br />
be the same as, or second only to, the supplier's service to its own ultimate consumers.<br />
LF - for tong-term service. "Long-term" means five years or Longer <strong>and</strong> "firm" means that service cannot be interrupted for economic<br />
reasons <strong>and</strong> is intended to remain reliable even under adverse conditions (e.g., the supplier must attempt to buy emergency energy<br />
from third parties to maintain deliveries of LF service). This category should not be used for Long-term firm service which meets the<br />
definition of RQ service. For all transactions identified as LF, provide in a footnote the termination date of the contract defined as the<br />
earliest date that either buyer or setter can unilaterally get out of the contract.<br />
IF - for intermediate-term firm service. The same as LF service except that "intermediate-term" means longer than one year but Less<br />
than five years.<br />
SF - for short-term firm service. Use this category for all firm services where the duration of each period of commitment for service is<br />
one year or less.<br />
LU - for Long-term service from a designated generating unit. "Long-term" means five years or Longer. The availability <strong>and</strong> reliability of<br />
service, aside from transmission constraints, must match the availability <strong>and</strong> reliability of designated unit.<br />
IU - for intermediate-term service from a designated generating unit. The same as LU service except that "intermediate-term" means<br />
Longer than one year but Less than five years.<br />
Line<br />
No.<br />
1<br />
2<br />
3<br />
4<br />
5<br />
6<br />
7<br />
8<br />
9<br />
10<br />
11<br />
12<br />
13<br />
14<br />
Name of <strong>Company</strong> or Public Authority Statistical <strong>FERC</strong> Rate<br />
Average<br />
Actual Dem<strong>and</strong> (MW)<br />
Classifi- Schedule or Monthly Billing Average<br />
(Footnote Affiliations)<br />
Average<br />
cation Tariff Number Dem<strong>and</strong> (MW) Monthly NCP Dem<strong>and</strong> Monthly CP Dem<strong>and</strong><br />
(a)<br />
(b)<br />
(c)<br />
(d)<br />
(e)<br />
(f)<br />
Silicon Valley Power RQ<br />
85<br />
0.1<br />
17.6<br />
17.6<br />
Hetch Hetchy RQ<br />
114<br />
18.6<br />
18.6<br />
18.6<br />
California Independent<br />
System Operator (ISO)<br />
RQ<br />
6<br />
n/a<br />
n/a<br />
n/a<br />
Subtotal RQ<br />
0<br />
0 0<br />
Subtotal non-RQ<br />
0<br />
0<br />
0<br />
Total<br />
0<br />
0<br />
0<br />
<strong>FERC</strong> FORM NO. 1 (ED. 12-90) Page 310
Name of Respondent<br />
PACIFIC GAS AND ELECTRIC COMPANY<br />
This Report Is:<br />
Date of Report<br />
(1) X An Original<br />
(Mo, Da, Yr)<br />
(2) A Resubmission<br />
04/08/2011<br />
SALES FOR RESALE (Account 447) (Continued)<br />
Year/Period of Report<br />
End of <strong>2010</strong>/Q4<br />
OS - for other service. use this category only for those services which cannot be placed in the above-defined categories, such as all<br />
non-firm service regardless of the Length of the contract <strong>and</strong> service from designated units of Less than one year. Describe the nature<br />
of the service in a footnote.<br />
AD - for Out-of-period adjustment. Use this code for any accounting adjustments or "true-ups" for service provided in prior reporting<br />
years. Provide an explanation in a footnote for each adjustment.<br />
4. Group requirements RQ sales together <strong>and</strong> report them starting at line number one. After listing all RQ sales, enter "Subtotal - RQ"<br />
in column (a). The remaining sales may then be listed in any order. Enter "Subtotal-Non-RQ" in column (a) after this Listing. Enter<br />
"Total'' in column (a) as the Last Line of the schedule. Report subtotals <strong>and</strong> total for columns (9) through (k)<br />
5. In Column (c), identify the <strong>FERC</strong> Rate Schedule or Tariff Number. On separate Lines, List all <strong>FERC</strong> rate schedules or tariffs under<br />
which service, as identified in column (b), is provided.<br />
6. For requirements RQ sales <strong>and</strong> any type of-service involving dem<strong>and</strong> charges imposed on a monthly (or Longer) basis, enter the<br />
average monthly billing dem<strong>and</strong> in column (d), the average monthly non-coincident peak (NCP) dem<strong>and</strong> in column (e), <strong>and</strong> the average<br />
monthly coincident peak (CP)<br />
dem<strong>and</strong> in column (f). For all other types of service, enter NA in columns (d), (e) <strong>and</strong> (f). Monthly NCP dem<strong>and</strong> is the maximum<br />
metered hourly (60-minute integration) dem<strong>and</strong> in a month. Monthly CP dem<strong>and</strong> is the metered dem<strong>and</strong> during the hour (60-minute<br />
integration) in which the supplier's system reaches its monthly peak. Dem<strong>and</strong> reported in columns (e) <strong>and</strong> (f) must be in megawatts.<br />
Footnote any dem<strong>and</strong> not stated on a megawatt basis <strong>and</strong> explain.<br />
7. Report in column (g) the megawatt hours shown on bills rendered to the purchaser.<br />
8. Report dem<strong>and</strong> charges in column (h), energy charges in column (i), <strong>and</strong> the total of any other types of charges, including<br />
out-of-period adjustments, in column (j). Explain in a footnote all components of the amount shown in column (j). Report in column (k)<br />
the total charge shown on bills rendered to the purchaser.<br />
9. The data in column (g) through (k) must be subtotaled based on the RQ/Non-RQ grouping (see instruction 4), <strong>and</strong> then totaled on<br />
the Last -line of the schedule. The "Subtotal - RQ" amount in column (g) must be reported as Requirements Sales For Resale on Page<br />
401, line 23. The "Subtotal - Non-RQ" amount in column (g) must be reported as Non-Requirements Sales For Resale on Page<br />
401,iine 24.<br />
10. Footnote entries as required <strong>and</strong> provide explanations following all required data.<br />
MegaWatt Hours<br />
Sold<br />
(g)<br />
REVENUE<br />
Total ($) Line<br />
Dem<strong>and</strong> Charges Energy Charges Other Charges<br />
(h+i+j)<br />
No.<br />
($) ($) ($)<br />
(h)<br />
(i)<br />
(j)<br />
(k)<br />
188 77 24,002<br />
-24,079<br />
1<br />
1,118,000 26,825 1,144,825 2<br />
1,607,407 62,126,313 62,126,313 4<br />
3<br />
5<br />
6<br />
7<br />
8<br />
9<br />
10<br />
11<br />
12<br />
13<br />
14<br />
1,607,595<br />
1,118,077<br />
62,150,315<br />
2,746 63,271,138<br />
0<br />
0<br />
0<br />
0<br />
0<br />
1,607,595<br />
1,118,077<br />
62,150,315<br />
2,746<br />
63,271,138<br />
<strong>FERC</strong> FORM NO. 1 (ED. 12-90) Page 311
Name of Respondent<br />
PACIFIC GAS AND ELECTRIC COMPANY<br />
This Report is:<br />
(1) X An Original<br />
(2) A Resubmission<br />
Date of Report<br />
(Mo, Da, Yr)<br />
04/08/2011<br />
Year/Period of Report<br />
<strong>2010</strong>/Q4<br />
FOOTNOTE DATA<br />
Schedule Page: 310 Line No.: 1 Column: a<br />
Sales represent the Grizzly Power Sale.<br />
Schedule Page: 310 Line No.: 1 Column: j<br />
Other charges represent booking estimate adjustments.<br />
Schedule Page: 310 Line No.: 2 Column: a<br />
Represents Supplemental Dem<strong>and</strong> A-1, Supplemental Dem<strong>and</strong> A-2, <strong>and</strong> energy sales, if<br />
applicable.<br />
Schedule Page: 310 Line No.: 2 Column: j<br />
Other charges represent booking estimate adjustments.<br />
Schedule Page: 310 Line No.: 4 Column: a<br />
Represents amounts included in ISO Settlement Statement on page 397.<br />
<strong>FERC</strong> FORM NO. 1 (ED. 12-87) Page 450.1
Name of Respondent<br />
PACIFIC GAS AND ELECTRIC COMPANY<br />
This Report Is:<br />
(1) X An Original<br />
(2) A Resubmission<br />
Date of Report<br />
(Mo, Da, Yr)<br />
04/08/2011<br />
ELECTRIC OPERATION AND MAINTENANCE EXPENSES<br />
If the amount for previous year is not derived from previously reported figures, explain in footnote.<br />
Line<br />
Account<br />
Amount for<br />
Current Year<br />
No.<br />
(a)<br />
(b)<br />
Year/Period of Report<br />
End of <strong>2010</strong>/Q4<br />
Amount for<br />
Previous Year<br />
(c)<br />
1 1. POWER PRODUCTION EXPENSES<br />
2 A. Steam Power Generation<br />
3 Operation<br />
4 (500) Operation Supervision <strong>and</strong> Engineering<br />
5 (501) Fuel<br />
148,272,824<br />
107,910,039<br />
6 (502) Steam Expenses<br />
29,309<br />
8,616<br />
7 (503) Steam from Other Sources<br />
8 (Less) (504) Steam Transferred-Cr.<br />
9 (505) <strong>Electric</strong> Expenses<br />
10 (506) Miscellaneous Steam Power Expenses<br />
9,486,442<br />
10,006,307<br />
11 (507) Rents<br />
12 (509) Allowances<br />
13 TOTAL Operation (Enter Total of Lines 4 thru 12)<br />
157,788,575<br />
117,924,962<br />
14 Maintenance<br />
15 (510) Maintenance Supervision <strong>and</strong> Engineering<br />
16 (511) Maintenance of Structures<br />
44,569<br />
3,898<br />
17 (512) Maintenance of Boiler Plant<br />
1,575,759<br />
1,070,676<br />
18 (513) Maintenance of <strong>Electric</strong> Plant<br />
9,956,103<br />
17,227,162<br />
19 (514) Maintenance of Miscellaneous Steam Plant<br />
5,283,867<br />
6,255,935<br />
20 TOTAL Maintenance (Enter Total of Lines 15 thru 19)<br />
16,860,298<br />
24,557,671<br />
21 TOTAL Power Production Expenses-Steam Power (Entr Tot lines 13 & 20)<br />
174,648,873<br />
142,482,633<br />
22 B. Nuclear Power Generation<br />
23 Operation<br />
24 (517) Operation Supervision <strong>and</strong> Engineering<br />
25 (518) Fuel<br />
105,267,617<br />
89,842,086<br />
26 (519) Coolants <strong>and</strong> Water<br />
29,049,330<br />
30,657,140<br />
27 (520) Steam Expenses<br />
49,020,065<br />
45,078,190<br />
28 (521) Steam from Other Sources<br />
29 (Less) (522) Steam Transferred-Cr.<br />
30 (523) <strong>Electric</strong> Expenses<br />
1,620,980<br />
4,566,404<br />
31 (524) Miscellaneous Nuclear Power Expenses<br />
84,464,062<br />
86,775,275<br />
32 (525) Rents<br />
33 TOTAL Operation (Enter Total of lines 24 thru 32)<br />
269,422,054<br />
256,919,095<br />
34 Maintenance<br />
35 (528) Maintenance Supervision <strong>and</strong> Engineering<br />
36 (529) Maintenance of Structures<br />
8,515,850<br />
13,318,977<br />
37 (530) Maintenance of Reactor Plant Equipment<br />
33,840,917<br />
50,251,342<br />
38 (531) Maintenance of <strong>Electric</strong> Plant<br />
40,039,351<br />
44,809,825<br />
39 (532) Maintenance of Miscellaneous Nuclear Plant<br />
18,668,000<br />
22,075,462<br />
40 TOTAL Maintenance (Enter Total of lines 35 thru 39)<br />
101,064,118<br />
130,455,606<br />
41 TOTAL Power Production Expenses-Nuc. Power (Entr tot lines 33 & 40)<br />
370,486,172<br />
387,374,701<br />
42 C. Hydraulic Power Generation<br />
43 Operation<br />
44 (535) Operation Supervision <strong>and</strong> Engineering<br />
45 (536) Water for Power<br />
5,275,893<br />
5,847,524<br />
46 (537) Hydraulic Expenses<br />
3,678,661<br />
3,192,674<br />
47 (538) <strong>Electric</strong> Expenses<br />
20,301,242<br />
20,099,111<br />
48 (539) Miscellaneous Hydraulic Power Generation Expenses<br />
29,573,615<br />
27,471,536<br />
49 (540) Rents<br />
2,577,246<br />
2,220,193<br />
50 TOTAL Operation (Enter Total of Lines 44 thru 49)<br />
61,406,657<br />
58,831,038<br />
51 C. Hydraulic Power Generation (Continued)<br />
52 Maintenance<br />
53 (541) Mainentance Supervision <strong>and</strong> Engineering<br />
54 (542) Maintenance of Structures<br />
3,798,130<br />
3,340,833<br />
55 (543) Maintenance of Reservoirs, Dams, <strong>and</strong> Waterways<br />
21,150,049<br />
17,608,490<br />
56 (544) Maintenance of <strong>Electric</strong> Plant<br />
20,546,485<br />
24,126,127<br />
57 (545) Maintenance of Miscellaneous Hydraulic Plant<br />
8,873,663<br />
8,747,748<br />
58 TOTAL Maintenance (Enter Total of lines 53 thru 57)<br />
54,368,327<br />
53,823,198<br />
59 TOTAL Power Production Expenses-Hydraulic Power (tot of lines 50 & 58)<br />
115,774,984<br />
112,654,236<br />
<strong>FERC</strong> FORM NO. 1 (ED. 12-93) Page 320
Name of Respondent<br />
PACIFIC GAS AND ELECTRIC COMPANY<br />
This Report Is:<br />
(1) X An Original<br />
(2) A Resubmission<br />
Date of Report<br />
(Mo, Da, Yr)<br />
04/08/2011<br />
ELECTRIC OPERATION AND MAINTENANCE EXPENSES (Continued)<br />
If the amount for previous year is not derived from previously reported figures, explain in footnote.<br />
Line<br />
Account<br />
Amount for<br />
Current Year<br />
No.<br />
(a)<br />
(b)<br />
Year/Period of Report<br />
End of <strong>2010</strong>/Q4<br />
Amount for<br />
Previous Year<br />
(c)<br />
60 D. Other Power Generation<br />
61 Operation<br />
62 (546) Operation Supervision <strong>and</strong> Engineering<br />
63 (547) Fuel<br />
1,017,375<br />
4,638,032<br />
64 (548) Generation Expenses<br />
319,182<br />
3,330<br />
65 (549) Miscellaneous Other Power Generation Expenses<br />
-12,988,223<br />
2,313,177<br />
66 (550) Rents<br />
67 TOTAL Operation (Enter Total of lines 62 thru 66)<br />
-11,651,666<br />
6,954,539<br />
68 Maintenance<br />
69 (551) Maintenance Supervision <strong>and</strong> Engineering<br />
70 (552) Maintenance of Structures<br />
641,374<br />
424,002<br />
71 (553) Maintenance of Generating <strong>and</strong> <strong>Electric</strong> Plant<br />
579,550<br />
624,590<br />
72 (554) Maintenance of Miscellaneous Other Power Generation Plant<br />
624,695<br />
963,269<br />
73 TOTAL Maintenance (Enter Total of lines 69 thru 72)<br />
1,845,619<br />
2,011,861<br />
74 TOTAL Power Production Expenses-Other Power (Enter Tot of 67 & 73)<br />
-9,806,047<br />
8,966,400<br />
75 E. Other Power Supply Expenses<br />
76 (555) Purchased Power<br />
3,633,537,677<br />
3,490,737,323<br />
77 (556) System Control <strong>and</strong> Load Dispatching<br />
78 (557) Other Expenses<br />
64,639,548<br />
69,828,126<br />
79 TOTAL Other Power Supply Exp (Enter Total of lines 76 thru 78)<br />
3,698,177,225<br />
3,560,565,449<br />
80 TOTAL Power Production Expenses (Total of lines 21, 41, 59, 74 & 79)<br />
4,349,281,207<br />
4,212,043,419<br />
81 2. TRANSMISSION EXPENSES<br />
82 Operation<br />
83 (560) Operation Supervision <strong>and</strong> Engineering<br />
84 (561) Load Dispatching<br />
1,332<br />
85 (561.1) Load Dispatch-Reliability<br />
86 (561.2) Load Dispatch-Monitor <strong>and</strong> Operate Transmission System<br />
19,551,973<br />
14,484,818<br />
87 (561.3) Load Dispatch-Transmission Service <strong>and</strong> Scheduling<br />
88 (561.4) Scheduling, System Control <strong>and</strong> Dispatch Services<br />
44,725,102<br />
36,171,609<br />
89 (561.5) Reliability, Planning <strong>and</strong> St<strong>and</strong>ards Development<br />
262<br />
91,027<br />
90 (561.6) Transmission Service Studies<br />
372<br />
91 (561.7) Generation Interconnection Studies<br />
92 (561.8) Reliability, Planning <strong>and</strong> St<strong>and</strong>ards Development Services<br />
7,632,274<br />
8,128,841<br />
93 (562) Station Expenses<br />
4,746,698<br />
7,411,362<br />
94 (563) Overhead Lines Expenses<br />
16,515,771<br />
19,794,891<br />
95 (564) Underground Lines Expenses<br />
1,452,941<br />
1,488,018<br />
96 (565) Transmission of <strong>Electric</strong>ity by Others<br />
21,572,412<br />
21,591,178<br />
97 (566) Miscellaneous Transmission Expenses<br />
29,355,517<br />
33,749,859<br />
98 (567) Rents<br />
99 TOTAL Operation (Enter Total of lines 83 thru 98)<br />
145,553,322<br />
142,912,935<br />
100 Maintenance<br />
101 (568) Maintenance Supervision <strong>and</strong> Engineering<br />
102 (569) Maintenance of Structures<br />
2,808,862<br />
1,600,622<br />
103 (569.1) Maintenance of Computer Hardware<br />
1,667,864<br />
1,499,612<br />
104 (569.2) Maintenance of Computer Software<br />
871,770<br />
697,771<br />
105 (569.3) Maintenance of Communication Equipment<br />
1,356,282<br />
1,582,419<br />
106 (569.4) Maintenance of Miscellaneous Regional Transmission Plant<br />
107 (570) Maintenance of Station Equipment<br />
19,314,152<br />
17,050,315<br />
108 (571) Maintenance of Overhead Lines<br />
35,560,058<br />
35,010,107<br />
109 (572) Maintenance of Underground Lines<br />
653,004<br />
816,340<br />
110 (573) Maintenance of Miscellaneous Transmission Plant<br />
349,685<br />
281,000<br />
111 TOTAL Maintenance (Total of lines 101 thru 110)<br />
62,581,677<br />
58,538,186<br />
112 TOTAL Transmission Expenses (Total of lines 99 <strong>and</strong> 111)<br />
208,134,999<br />
201,451,121<br />
<strong>FERC</strong> FORM NO. 1 (ED. 12-93) Page 321
Name of Respondent<br />
PACIFIC GAS AND ELECTRIC COMPANY<br />
This Report Is:<br />
(1) X An Original<br />
(2) A Resubmission<br />
Date of Report<br />
(Mo, Da, Yr)<br />
04/08/2011<br />
ELECTRIC OPERATION AND MAINTENANCE EXPENSES (Continued)<br />
If the amount for previous year is not derived from previously reported figures, explain in footnote.<br />
Line<br />
Account<br />
Amount for<br />
Current Year<br />
No.<br />
(a)<br />
(b)<br />
Year/Period of Report<br />
End of <strong>2010</strong>/Q4<br />
Amount for<br />
Previous Year<br />
(c)<br />
113 3. REGIONAL MARKET EXPENSES<br />
114 Operation<br />
115 (575.1) Operation Supervision<br />
116 (575.2) Day-Ahead <strong>and</strong> Real-Time Market Facilitation<br />
117 (575.3) Transmission Rights Market Facilitation<br />
118 (575.4) Capacity Market Facilitation<br />
119 (575.5) Ancillary Services Market Facilitation<br />
120 (575.6) Market Monitoring <strong>and</strong> Compliance<br />
121 (575.7) Market Facilitation, Monitoring <strong>and</strong> Compliance Services<br />
9,039,432<br />
11,662,949<br />
122 (575.8) Rents<br />
123 Total Operation (Lines 115 thru 122)<br />
9,039,432<br />
11,662,949<br />
124 Maintenance<br />
125 (576.1) Maintenance of Structures <strong>and</strong> Improvements<br />
126 (576.2) Maintenance of Computer Hardware<br />
127 (576.3) Maintenance of Computer Software<br />
128 (576.4) Maintenance of Communication Equipment<br />
129 (576.5) Maintenance of Miscellaneous Market Operation Plant<br />
130 Total Maintenance (Lines 125 thru 129)<br />
131 TOTAL Regional Transmission <strong>and</strong> Market Op Expns (Total 123 <strong>and</strong> 130)<br />
9,039,432<br />
11,662,949<br />
132 4. DISTRIBUTION EXPENSES<br />
133 Operation<br />
134 (580) Operation Supervision <strong>and</strong> Engineering<br />
135 (581) Load Dispatching<br />
136 (582) Station Expenses<br />
3,071,381<br />
6,482,773<br />
137 (583) Overhead Line Expenses<br />
17,837,032<br />
14,949,299<br />
138 (584) Underground Line Expenses<br />
28,698,062<br />
25,038,219<br />
139 (585) Street Lighting <strong>and</strong> Signal System Expenses<br />
52,545<br />
140 (586) Meter Expenses<br />
-1,678,114<br />
-1,641,962<br />
141 (587) Customer Installations Expenses<br />
23,609,207<br />
25,694,010<br />
142 (588) Miscellaneous Expenses<br />
82,264,736<br />
88,624,137<br />
143 (589) Rents<br />
144 TOTAL Operation (Enter Total of lines 134 thru 143)<br />
153,802,304<br />
159,199,021<br />
145 Maintenance<br />
146 (590) Maintenance Supervision <strong>and</strong> Engineering<br />
147 (591) Maintenance of Structures<br />
9,103,204<br />
7,759,024<br />
148 (592) Maintenance of Station Equipment<br />
25,858,790<br />
24,106,586<br />
149 (593) Maintenance of Overhead Lines<br />
277,298,657<br />
259,994,803<br />
150 (594) Maintenance of Underground Lines<br />
28,742,412<br />
27,110,565<br />
151 (595) Maintenance of Line Transformers<br />
3,118,453<br />
83,343<br />
152 (596) Maintenance of Street Lighting <strong>and</strong> Signal Systems<br />
4,307,590<br />
4,390,200<br />
153 (597) Maintenance of Meters<br />
3,869,621<br />
2,556,284<br />
154 (598) Maintenance of Miscellaneous Distribution Plant<br />
118,254<br />
103,826<br />
155 TOTAL Maintenance (Total of lines 146 thru 154)<br />
352,416,981<br />
326,104,631<br />
156 TOTAL Distribution Expenses (Total of lines 144 <strong>and</strong> 155)<br />
506,219,285<br />
485,303,652<br />
157 5. CUSTOMER ACCOUNTS EXPENSES<br />
158 Operation<br />
159 (901) Supervision<br />
160 (902) Meter Reading Expenses<br />
37,333,416<br />
44,102,420<br />
161 (903) Customer Records <strong>and</strong> Collection Expenses<br />
137,891,659<br />
142,677,335<br />
162 (904) Uncollectible Accounts<br />
44,381,617<br />
55,796,063<br />
163 (905) Miscellaneous Customer Accounts Expenses<br />
85,852<br />
95,048<br />
164 TOTAL Customer Accounts Expenses (Total of lines 159 thru 163)<br />
219,692,544<br />
242,670,866<br />
<strong>FERC</strong> FORM NO. 1 (ED. 12-93) Page 322
Name of Respondent<br />
PACIFIC GAS AND ELECTRIC COMPANY<br />
This Report Is:<br />
(1) X An Original<br />
(2) A Resubmission<br />
Date of Report<br />
(Mo, Da, Yr)<br />
04/08/2011<br />
ELECTRIC OPERATION AND MAINTENANCE EXPENSES (Continued)<br />
If the amount for previous year is not derived from previously reported figures, explain in footnote.<br />
Line<br />
Account<br />
Amount for<br />
Current Year<br />
No.<br />
(a)<br />
(b)<br />
Year/Period of Report<br />
End of <strong>2010</strong>/Q4<br />
Amount for<br />
Previous Year<br />
(c)<br />
165 6. CUSTOMER SERVICE AND INFORMATIONAL EXPENSES<br />
166 Operation<br />
167 (907) Supervision<br />
168 (908) Customer Assistance Expenses<br />
685,131,746<br />
692,449,590<br />
169 (909) Informational <strong>and</strong> Instructional Expenses<br />
1,800,964<br />
37,052<br />
170 (910) Miscellaneous Customer Service <strong>and</strong> Informational Expenses<br />
171 TOTAL Customer Service <strong>and</strong> Information Expenses (Total 167 thru 170)<br />
686,932,710<br />
692,486,642<br />
172 7. SALES EXPENSES<br />
173 Operation<br />
174 (911) Supervision<br />
175 (912) Demonstrating <strong>and</strong> Selling Expenses<br />
8,649,009<br />
5,540,811<br />
176 (913) Advertising Expenses<br />
177 (916) Miscellaneous Sales Expenses<br />
178 TOTAL Sales Expenses (Enter Total of lines 174 thru 177)<br />
8,649,009<br />
5,540,811<br />
179 8. ADMINISTRATIVE AND GENERAL EXPENSES<br />
180 Operation<br />
181 (920) Administrative <strong>and</strong> General Salaries<br />
204,020,880<br />
324,001,999<br />
182 (921) Office Supplies <strong>and</strong> Expenses<br />
17,987,790<br />
15,322,873<br />
183 (Less) (922) Administrative Expenses Transferred-Credit<br />
27,384,595<br />
44,907,723<br />
184 (923) Outside Services Employed<br />
135,128,569<br />
135,568,475<br />
185 (924) Property Insurance<br />
14,344,568<br />
9,393,615<br />
186 (925) Injuries <strong>and</strong> Damages<br />
66,259,243<br />
57,567,250<br />
187 (926) Employee Pensions <strong>and</strong> Benefits<br />
277,048,419<br />
274,650,832<br />
188 (927) Franchise Requirements<br />
90,224,140<br />
89,140,441<br />
189 (928) Regulatory Commission Expenses<br />
190 (929) (Less) Duplicate Charges-Cr.<br />
191 (930.1) General Advertising Expenses<br />
2,074,773<br />
387,169<br />
192 (930.2) Miscellaneous General Expenses<br />
4,628,192<br />
4,238,648<br />
193 (931) Rents<br />
194 TOTAL Operation (Enter Total of lines 181 thru 193)<br />
784,331,979<br />
865,363,579<br />
195 Maintenance<br />
196 (935) Maintenance of General Plant<br />
11,056,083<br />
15,937,376<br />
197 TOTAL Administrative & General Expenses (Total of lines 194 <strong>and</strong> 196)<br />
795,388,062<br />
881,300,955<br />
198 TOTAL Elec Op <strong>and</strong> Maint Expns (Total 80,112,131,156,164,171,178,197)<br />
6,783,337,248<br />
6,732,460,415<br />
<strong>FERC</strong> FORM NO. 1 (ED. 12-93) Page 323
Name of Respondent<br />
PACIFIC GAS AND ELECTRIC COMPANY<br />
This Report Is:<br />
Date of Report<br />
(1) X An Original<br />
(Mo, Da, Yr)<br />
(2) A Resubmission<br />
04/08/2011<br />
PURCHASED POWER (Account 555)<br />
(Including power exchanges)<br />
Year/Period of Report<br />
End of <strong>2010</strong>/Q4<br />
1. Report all power purchases made during the year. Also report exchanges of electricity (i.e., transactions involving a balancing of<br />
debits <strong>and</strong> credits for energy, capacity, etc.) <strong>and</strong> any settlements for imbalanced exchanges.<br />
2. Enter the name of the seller or other party in an exchange transaction in column (a). Do not abbreviate or truncate the name or use<br />
acronyms. Explain in a footnote any ownership interest or affiliation the respondent has with the seller.<br />
3. In column (b), enter a Statistical Classification Code based on the original contractual terms <strong>and</strong> conditions of the service as follows:<br />
RQ - for requirements service. Requirements service is service which the supplier plans to provide on an ongoing basis (i.e., the<br />
supplier includes projects load for this service in its system resource planning). In addition, the reliability of requirement service must<br />
be the same as, or second only to, the supplier’s service to its own ultimate consumers.<br />
LF - for long-term firm service. "Long-term" means five years or longer <strong>and</strong> "firm" means that service cannot be interrupted for<br />
economic reasons <strong>and</strong> is intended to remain reliable even under adverse conditions (e.g., the supplier must attempt to buy emergency<br />
energy from third parties to maintain deliveries of LF service). This category should not be used for long-term firm service firm service<br />
which meets the definition of RQ service. For all transaction identified as LF, provide in a footnote the termination date of the contract<br />
defined as the earliest date that either buyer or seller can unilaterally get out of the contract.<br />
IF - for intermediate-term firm service. The same as LF service expect that "intermediate-term" means longer than one year but less<br />
than five years.<br />
SF - for short-term service. Use this category for all firm services, where the duration of each period of commitment for service is one<br />
year or less.<br />
LU - for long-term service from a designated generating unit. "Long-term" means five years or longer. The availability <strong>and</strong> reliability of<br />
service, aside from transmission constraints, must match the availability <strong>and</strong> reliability of the designated unit.<br />
IU - for intermediate-term service from a designated generating unit. The same as LU service expect that "intermediate-term" means<br />
longer than one year but less than five years.<br />
EX - For exchanges of electricity. Use this category for transactions involving a balancing of debits <strong>and</strong> credits for energy, capacity, etc.<br />
<strong>and</strong> any settlements for imbalanced exchanges.<br />
OS - for other service. Use this category only for those services which cannot be placed in the above-defined categories, such as all<br />
non-firm service regardless of the Length of the contract <strong>and</strong> service from designated units of Less than one year. Describe the nature<br />
of the service in a footnote for each adjustment.<br />
Line<br />
No.<br />
Name of <strong>Company</strong> or Public Authority<br />
(Footnote Affiliations)<br />
(a)<br />
Statistical<br />
Classification<br />
(b)<br />
<strong>FERC</strong> Rate<br />
Schedule or<br />
Tariff Number<br />
(c)<br />
Average<br />
Monthly Billing<br />
Dem<strong>and</strong> (MW)<br />
(d)<br />
Actual Dem<strong>and</strong> (MW)<br />
Average<br />
Average<br />
Monthly NCP Dem<strong>and</strong> Monthly CP Dem<strong>and</strong><br />
(e)<br />
(f)<br />
1<br />
QUALIFYING FACILITIES (QF's)<br />
2<br />
THERMAL: BIOMASS<br />
3<br />
BIG VALLEY POWER LLC<br />
LU<br />
N/A<br />
0.3665<br />
N/A<br />
4<br />
BURNEY FOREST PRODUCTS<br />
LU<br />
24<br />
31.42916667<br />
N/A<br />
5<br />
COLLINS PINE<br />
LU<br />
5.5<br />
8.805<br />
N/A<br />
6<br />
COVANTA MENDOTA L. P.<br />
LU<br />
22<br />
25.1971545<br />
N/A<br />
7<br />
DG FAIRHAVEN POWER, LLC<br />
LU<br />
16<br />
14.95258333<br />
N/A<br />
8<br />
HL POWER<br />
LU<br />
20<br />
27.213184<br />
N/A<br />
9<br />
OGDEN POWER PACIFIC, INC. (BURNEY)<br />
LU<br />
9.75<br />
9.629<br />
N/A<br />
10<br />
OGDEN POWER PACIFIC, INC. (MT.<br />
LU<br />
10.5<br />
9.7575<br />
N/A<br />
11<br />
OGDEN POWER PACIFIC, INC. (OROVILLE) LU<br />
16.5<br />
11.772<br />
N/A<br />
12<br />
PACIFIC-ULTRAPOWER CHINESE<br />
LU<br />
19.8<br />
19.53725<br />
N/A<br />
13<br />
RIO BRAVO FRESNO<br />
LU<br />
23.5<br />
24.75358333<br />
N/A<br />
14<br />
RIO BRAVO ROCKLIN<br />
LU<br />
22<br />
24.733<br />
N/A<br />
Total<br />
<strong>FERC</strong> FORM NO. 1 (ED. 12-90) Page 326
Name of Respondent<br />
PACIFIC GAS AND ELECTRIC COMPANY<br />
This Report Is:<br />
Date of Report<br />
(1) X An Original<br />
(Mo, Da, Yr)<br />
(2) A Resubmission<br />
04/08/2011<br />
PURCHASED POWER (Account 555)<br />
(Including power exchanges)<br />
Year/Period of Report<br />
End of <strong>2010</strong>/Q4<br />
1. Report all power purchases made during the year. Also report exchanges of electricity (i.e., transactions involving a balancing of<br />
debits <strong>and</strong> credits for energy, capacity, etc.) <strong>and</strong> any settlements for imbalanced exchanges.<br />
2. Enter the name of the seller or other party in an exchange transaction in column (a). Do not abbreviate or truncate the name or use<br />
acronyms. Explain in a footnote any ownership interest or affiliation the respondent has with the seller.<br />
3. In column (b), enter a Statistical Classification Code based on the original contractual terms <strong>and</strong> conditions of the service as follows:<br />
RQ - for requirements service. Requirements service is service which the supplier plans to provide on an ongoing basis (i.e., the<br />
supplier includes projects load for this service in its system resource planning). In addition, the reliability of requirement service must<br />
be the same as, or second only to, the supplier’s service to its own ultimate consumers.<br />
LF - for long-term firm service. "Long-term" means five years or longer <strong>and</strong> "firm" means that service cannot be interrupted for<br />
economic reasons <strong>and</strong> is intended to remain reliable even under adverse conditions (e.g., the supplier must attempt to buy emergency<br />
energy from third parties to maintain deliveries of LF service). This category should not be used for long-term firm service firm service<br />
which meets the definition of RQ service. For all transaction identified as LF, provide in a footnote the termination date of the contract<br />
defined as the earliest date that either buyer or seller can unilaterally get out of the contract.<br />
IF - for intermediate-term firm service. The same as LF service expect that "intermediate-term" means longer than one year but less<br />
than five years.<br />
SF - for short-term service. Use this category for all firm services, where the duration of each period of commitment for service is one<br />
year or less.<br />
LU - for long-term service from a designated generating unit. "Long-term" means five years or longer. The availability <strong>and</strong> reliability of<br />
service, aside from transmission constraints, must match the availability <strong>and</strong> reliability of the designated unit.<br />
IU - for intermediate-term service from a designated generating unit. The same as LU service expect that "intermediate-term" means<br />
longer than one year but less than five years.<br />
EX - For exchanges of electricity. Use this category for transactions involving a balancing of debits <strong>and</strong> credits for energy, capacity, etc.<br />
<strong>and</strong> any settlements for imbalanced exchanges.<br />
OS - for other service. Use this category only for those services which cannot be placed in the above-defined categories, such as all<br />
non-firm service regardless of the Length of the contract <strong>and</strong> service from designated units of Less than one year. Describe the nature<br />
of the service in a footnote for each adjustment.<br />
Line<br />
No.<br />
Name of <strong>Company</strong> or Public Authority<br />
(Footnote Affiliations)<br />
(a)<br />
Statistical<br />
Classification<br />
(b)<br />
<strong>FERC</strong> Rate<br />
Schedule or<br />
Tariff Number<br />
(c)<br />
Average<br />
Monthly Billing<br />
Dem<strong>and</strong> (MW)<br />
(d)<br />
Actual Dem<strong>and</strong> (MW)<br />
Average<br />
Average<br />
Monthly NCP Dem<strong>and</strong> Monthly CP Dem<strong>and</strong><br />
(e)<br />
(f)<br />
1<br />
SIERRA PACIFIC IND. (BURNEY)<br />
LU<br />
9.5<br />
14.63316667<br />
N/A<br />
2<br />
SIERRA PACIFIC IND. (LINCOLN)<br />
LU<br />
4.98<br />
13.11833333<br />
N/A<br />
3<br />
SIERRA PACIFIC IND. (QUINCY)<br />
LU<br />
12.5<br />
20.468<br />
N/A<br />
4<br />
SIERRA PACIFIC IND.(SUSANVILLE)<br />
LU<br />
9.842<br />
0<br />
N/A<br />
5<br />
SONOMA COUNTY WATER AGENCY<br />
LU<br />
0<br />
0<br />
N/A<br />
6<br />
THERMAL ENERGY DEV. CORP.<br />
LU<br />
13<br />
19.2975<br />
N/A<br />
7<br />
TOWN OF SCOTIA COMPANY, LLC<br />
LU<br />
N/A<br />
22.492<br />
N/A<br />
8<br />
WHEELABRATOR SHASTA<br />
LU<br />
49.68<br />
48.978<br />
N/A<br />
9<br />
WOODLAND BIOMASS<br />
LU<br />
22<br />
18.972<br />
N/A<br />
10<br />
THERMAL: ENHANCED OIL RECOVERY<br />
11<br />
AERA ENERGY LLC. (COALINGA)<br />
LU<br />
N/A<br />
3.064833333<br />
N/A<br />
12<br />
AERA ENERGY LLC. (N. MIDWAY SUNSET) LU<br />
N/A<br />
0<br />
N/A<br />
13<br />
AERA ENERGY LLC. (OXFORD)<br />
LU<br />
N/A<br />
0<br />
N/A<br />
14<br />
AERA ENERGY LLC. (S. BELRIDGE)<br />
LU<br />
N/A<br />
5.811583333<br />
N/A<br />
Total<br />
<strong>FERC</strong> FORM NO. 1 (ED. 12-90) Page 326.1
Name of Respondent<br />
PACIFIC GAS AND ELECTRIC COMPANY<br />
This Report Is:<br />
Date of Report<br />
(1) X An Original<br />
(Mo, Da, Yr)<br />
(2) A Resubmission<br />
04/08/2011<br />
PURCHASED POWER (Account 555)<br />
(Including power exchanges)<br />
Year/Period of Report<br />
End of <strong>2010</strong>/Q4<br />
1. Report all power purchases made during the year. Also report exchanges of electricity (i.e., transactions involving a balancing of<br />
debits <strong>and</strong> credits for energy, capacity, etc.) <strong>and</strong> any settlements for imbalanced exchanges.<br />
2. Enter the name of the seller or other party in an exchange transaction in column (a). Do not abbreviate or truncate the name or use<br />
acronyms. Explain in a footnote any ownership interest or affiliation the respondent has with the seller.<br />
3. In column (b), enter a Statistical Classification Code based on the original contractual terms <strong>and</strong> conditions of the service as follows:<br />
RQ - for requirements service. Requirements service is service which the supplier plans to provide on an ongoing basis (i.e., the<br />
supplier includes projects load for this service in its system resource planning). In addition, the reliability of requirement service must<br />
be the same as, or second only to, the supplier’s service to its own ultimate consumers.<br />
LF - for long-term firm service. "Long-term" means five years or longer <strong>and</strong> "firm" means that service cannot be interrupted for<br />
economic reasons <strong>and</strong> is intended to remain reliable even under adverse conditions (e.g., the supplier must attempt to buy emergency<br />
energy from third parties to maintain deliveries of LF service). This category should not be used for long-term firm service firm service<br />
which meets the definition of RQ service. For all transaction identified as LF, provide in a footnote the termination date of the contract<br />
defined as the earliest date that either buyer or seller can unilaterally get out of the contract.<br />
IF - for intermediate-term firm service. The same as LF service expect that "intermediate-term" means longer than one year but less<br />
than five years.<br />
SF - for short-term service. Use this category for all firm services, where the duration of each period of commitment for service is one<br />
year or less.<br />
LU - for long-term service from a designated generating unit. "Long-term" means five years or longer. The availability <strong>and</strong> reliability of<br />
service, aside from transmission constraints, must match the availability <strong>and</strong> reliability of the designated unit.<br />
IU - for intermediate-term service from a designated generating unit. The same as LU service expect that "intermediate-term" means<br />
longer than one year but less than five years.<br />
EX - For exchanges of electricity. Use this category for transactions involving a balancing of debits <strong>and</strong> credits for energy, capacity, etc.<br />
<strong>and</strong> any settlements for imbalanced exchanges.<br />
OS - for other service. Use this category only for those services which cannot be placed in the above-defined categories, such as all<br />
non-firm service regardless of the Length of the contract <strong>and</strong> service from designated units of Less than one year. Describe the nature<br />
of the service in a footnote for each adjustment.<br />
Line<br />
No.<br />
Name of <strong>Company</strong> or Public Authority<br />
(Footnote Affiliations)<br />
(a)<br />
Statistical<br />
Classification<br />
(b)<br />
<strong>FERC</strong> Rate<br />
Schedule or<br />
Tariff Number<br />
(c)<br />
Average<br />
Monthly Billing<br />
Dem<strong>and</strong> (MW)<br />
(d)<br />
Actual Dem<strong>and</strong> (MW)<br />
Average<br />
Average<br />
Monthly NCP Dem<strong>and</strong> Monthly CP Dem<strong>and</strong><br />
(e)<br />
(f)<br />
1<br />
BADGER CREEK LIMITED<br />
LU<br />
42<br />
47.891801<br />
N/A<br />
2<br />
BEAR MOUNTAIN LIMITED<br />
LU<br />
42<br />
49.31991667<br />
N/A<br />
3<br />
BERRY PETROLEUM COMPANY<br />
LU<br />
N/A<br />
11.95741667<br />
N/A<br />
4<br />
CHALK CLIFF LIMITED<br />
LU<br />
42<br />
47.49125<br />
N/A<br />
5<br />
CHEVRON USA (COALINGA)<br />
LU<br />
N/A<br />
11.17808333<br />
N/A<br />
6<br />
CHEVRON USA (CYMRIC)<br />
LU<br />
N/A<br />
7.37575<br />
N/A<br />
7<br />
CHEVRON USA (EASTRIDGE)<br />
LU<br />
N/A<br />
18.93616667<br />
N/A<br />
8<br />
CHEVRON USA (TAFT/CADET)<br />
LU<br />
N/A<br />
5.547166667<br />
N/A<br />
9<br />
CHEVRON U.S.A. INC. (FEE A)<br />
LU<br />
N/A<br />
3.759<br />
N/A<br />
10<br />
CHEVRON U.S.A INC. (FEE C)<br />
LU<br />
N/A<br />
1.82725<br />
N/A<br />
11<br />
CHEVRON U.S.A. INC. (SE KERN RIVER)<br />
LU<br />
N/A<br />
17.16483333<br />
N/A<br />
12<br />
CHEVRON U.S.A. INC. (MCKITTRICK)<br />
LU<br />
N/A<br />
5.465568333<br />
N/A<br />
13<br />
COALINGA COGENERATION COMPANY<br />
LU<br />
33<br />
40.81541667<br />
N/A<br />
14<br />
DAI / OILDALE , INC.<br />
LU<br />
29<br />
30.04558333<br />
N/A<br />
Total<br />
<strong>FERC</strong> FORM NO. 1 (ED. 12-90) Page 326.2
Name of Respondent<br />
PACIFIC GAS AND ELECTRIC COMPANY<br />
This Report Is:<br />
Date of Report<br />
(1) X An Original<br />
(Mo, Da, Yr)<br />
(2) A Resubmission<br />
04/08/2011<br />
PURCHASED POWER (Account 555)<br />
(Including power exchanges)<br />
Year/Period of Report<br />
End of <strong>2010</strong>/Q4<br />
1. Report all power purchases made during the year. Also report exchanges of electricity (i.e., transactions involving a balancing of<br />
debits <strong>and</strong> credits for energy, capacity, etc.) <strong>and</strong> any settlements for imbalanced exchanges.<br />
2. Enter the name of the seller or other party in an exchange transaction in column (a). Do not abbreviate or truncate the name or use<br />
acronyms. Explain in a footnote any ownership interest or affiliation the respondent has with the seller.<br />
3. In column (b), enter a Statistical Classification Code based on the original contractual terms <strong>and</strong> conditions of the service as follows:<br />
RQ - for requirements service. Requirements service is service which the supplier plans to provide on an ongoing basis (i.e., the<br />
supplier includes projects load for this service in its system resource planning). In addition, the reliability of requirement service must<br />
be the same as, or second only to, the supplier’s service to its own ultimate consumers.<br />
LF - for long-term firm service. "Long-term" means five years or longer <strong>and</strong> "firm" means that service cannot be interrupted for<br />
economic reasons <strong>and</strong> is intended to remain reliable even under adverse conditions (e.g., the supplier must attempt to buy emergency<br />
energy from third parties to maintain deliveries of LF service). This category should not be used for long-term firm service firm service<br />
which meets the definition of RQ service. For all transaction identified as LF, provide in a footnote the termination date of the contract<br />
defined as the earliest date that either buyer or seller can unilaterally get out of the contract.<br />
IF - for intermediate-term firm service. The same as LF service expect that "intermediate-term" means longer than one year but less<br />
than five years.<br />
SF - for short-term service. Use this category for all firm services, where the duration of each period of commitment for service is one<br />
year or less.<br />
LU - for long-term service from a designated generating unit. "Long-term" means five years or longer. The availability <strong>and</strong> reliability of<br />
service, aside from transmission constraints, must match the availability <strong>and</strong> reliability of the designated unit.<br />
IU - for intermediate-term service from a designated generating unit. The same as LU service expect that "intermediate-term" means<br />
longer than one year but less than five years.<br />
EX - For exchanges of electricity. Use this category for transactions involving a balancing of debits <strong>and</strong> credits for energy, capacity, etc.<br />
<strong>and</strong> any settlements for imbalanced exchanges.<br />
OS - for other service. Use this category only for those services which cannot be placed in the above-defined categories, such as all<br />
non-firm service regardless of the Length of the contract <strong>and</strong> service from designated units of Less than one year. Describe the nature<br />
of the service in a footnote for each adjustment.<br />
Line<br />
No.<br />
Name of <strong>Company</strong> or Public Authority<br />
(Footnote Affiliations)<br />
(a)<br />
Statistical<br />
Classification<br />
(b)<br />
<strong>FERC</strong> Rate<br />
Schedule or<br />
Tariff Number<br />
(c)<br />
Average<br />
Monthly Billing<br />
Dem<strong>and</strong> (MW)<br />
(d)<br />
Actual Dem<strong>and</strong> (MW)<br />
Average<br />
Average<br />
Monthly NCP Dem<strong>and</strong> Monthly CP Dem<strong>and</strong><br />
(e)<br />
(f)<br />
1<br />
DOUBLE C<br />
LU<br />
47<br />
36.47575817<br />
N/A<br />
2<br />
GRAPHIC PACKAGING INT'L (BLUE<br />
LU<br />
N/A<br />
17.88333358<br />
N/A<br />
3<br />
HIGH SIERRA LIMITED<br />
LU<br />
47<br />
18.55919875<br />
N/A<br />
4<br />
JACKSON VALLEY IRRIGATION DIST<br />
LU<br />
N/A<br />
0.079166667<br />
N/A<br />
5<br />
KERN FRONT LIMITED<br />
LU<br />
47<br />
23.19930825<br />
N/A<br />
6<br />
LIVE OAK LIMITED<br />
LU<br />
42<br />
48.84483333<br />
N/A<br />
7<br />
MCKITTRICK LIMITED<br />
LU<br />
42<br />
47.142<br />
N/A<br />
8<br />
MIDSET COGEN. CO.<br />
LU<br />
N/A<br />
0<br />
N/A<br />
9<br />
MIDWAY-SUNSET COGEN. CO.<br />
LU<br />
N/A<br />
26.70181818<br />
N/A<br />
10<br />
PLAINS EXPLORATION AND PRODUCTION LU<br />
N/A<br />
1.510333333<br />
N/A<br />
11<br />
PLAINS EXPLORATION AND PRODUCTION LU<br />
N/A<br />
1.379166667<br />
N/A<br />
12<br />
SALINAS RIVER COGEN CO<br />
LU<br />
N/A<br />
38.818<br />
N/A<br />
13<br />
SARGENT CANYON COGERATION<br />
LU<br />
N/A<br />
36.502<br />
N/A<br />
14<br />
THERMAL: COGENERATION<br />
Total<br />
<strong>FERC</strong> FORM NO. 1 (ED. 12-90) Page 326.3
Name of Respondent<br />
PACIFIC GAS AND ELECTRIC COMPANY<br />
This Report Is:<br />
Date of Report<br />
(1) X An Original<br />
(Mo, Da, Yr)<br />
(2) A Resubmission<br />
04/08/2011<br />
PURCHASED POWER (Account 555)<br />
(Including power exchanges)<br />
Year/Period of Report<br />
End of <strong>2010</strong>/Q4<br />
1. Report all power purchases made during the year. Also report exchanges of electricity (i.e., transactions involving a balancing of<br />
debits <strong>and</strong> credits for energy, capacity, etc.) <strong>and</strong> any settlements for imbalanced exchanges.<br />
2. Enter the name of the seller or other party in an exchange transaction in column (a). Do not abbreviate or truncate the name or use<br />
acronyms. Explain in a footnote any ownership interest or affiliation the respondent has with the seller.<br />
3. In column (b), enter a Statistical Classification Code based on the original contractual terms <strong>and</strong> conditions of the service as follows:<br />
RQ - for requirements service. Requirements service is service which the supplier plans to provide on an ongoing basis (i.e., the<br />
supplier includes projects load for this service in its system resource planning). In addition, the reliability of requirement service must<br />
be the same as, or second only to, the supplier’s service to its own ultimate consumers.<br />
LF - for long-term firm service. "Long-term" means five years or longer <strong>and</strong> "firm" means that service cannot be interrupted for<br />
economic reasons <strong>and</strong> is intended to remain reliable even under adverse conditions (e.g., the supplier must attempt to buy emergency<br />
energy from third parties to maintain deliveries of LF service). This category should not be used for long-term firm service firm service<br />
which meets the definition of RQ service. For all transaction identified as LF, provide in a footnote the termination date of the contract<br />
defined as the earliest date that either buyer or seller can unilaterally get out of the contract.<br />
IF - for intermediate-term firm service. The same as LF service expect that "intermediate-term" means longer than one year but less<br />
than five years.<br />
SF - for short-term service. Use this category for all firm services, where the duration of each period of commitment for service is one<br />
year or less.<br />
LU - for long-term service from a designated generating unit. "Long-term" means five years or longer. The availability <strong>and</strong> reliability of<br />
service, aside from transmission constraints, must match the availability <strong>and</strong> reliability of the designated unit.<br />
IU - for intermediate-term service from a designated generating unit. The same as LU service expect that "intermediate-term" means<br />
longer than one year but less than five years.<br />
EX - For exchanges of electricity. Use this category for transactions involving a balancing of debits <strong>and</strong> credits for energy, capacity, etc.<br />
<strong>and</strong> any settlements for imbalanced exchanges.<br />
OS - for other service. Use this category only for those services which cannot be placed in the above-defined categories, such as all<br />
non-firm service regardless of the Length of the contract <strong>and</strong> service from designated units of Less than one year. Describe the nature<br />
of the service in a footnote for each adjustment.<br />
Line<br />
No.<br />
Name of <strong>Company</strong> or Public Authority<br />
(Footnote Affiliations)<br />
(a)<br />
Statistical<br />
Classification<br />
(b)<br />
<strong>FERC</strong> Rate<br />
Schedule or<br />
Tariff Number<br />
(c)<br />
Average<br />
Monthly Billing<br />
Dem<strong>and</strong> (MW)<br />
(d)<br />
Actual Dem<strong>and</strong> (MW)<br />
Average<br />
Average<br />
Monthly NCP Dem<strong>and</strong> Monthly CP Dem<strong>and</strong><br />
(e)<br />
(f)<br />
1<br />
ALTAMONT COGENERATION CORP.<br />
LU<br />
5.7<br />
0<br />
N/A<br />
2<br />
CALPINE KING CITY COGEN.<br />
LU<br />
111<br />
121.856<br />
3<br />
CALPINE GILROY COGEN, L.P.<br />
LU<br />
N/A<br />
N/A<br />
N/A<br />
4<br />
CALPINE KING CITY COGEN.<br />
LU<br />
111<br />
121.856<br />
N/A<br />
5<br />
CALPINE MONTEREY COGEN INC.<br />
LU<br />
20.9<br />
14.9545<br />
N/A<br />
6<br />
CALPINE PITTSBURG POWER PLANT<br />
LU<br />
N/A<br />
3.132<br />
N/A<br />
7<br />
CARDINAL COGEN<br />
LU<br />
N/A<br />
29.49114492<br />
N/A<br />
8<br />
CHEVRON USA (CONCORD)<br />
LU<br />
N/A<br />
0.867583333<br />
N/A<br />
9<br />
GATX/CALPINE COGEN-AGNEWS INC.<br />
LU<br />
24<br />
28.94383333<br />
N/A<br />
10<br />
GRAPHIC PACKAGING INT'L (BLUE<br />
LU<br />
N/A<br />
17.88333358<br />
N/A<br />
11<br />
CROCKETT COGEN<br />
LU<br />
240<br />
222.92099<br />
N/A<br />
12<br />
GREENLEAF UNIT #1<br />
LU<br />
49.2<br />
49.79508333<br />
N/A<br />
13<br />
GREENLEAF UNIT #2<br />
LU<br />
49.2<br />
49.608<br />
N/A<br />
14<br />
MARTINEZ COGEN LIMITED<br />
LU<br />
10<br />
40.76116667<br />
N/A<br />
Total<br />
<strong>FERC</strong> FORM NO. 1 (ED. 12-90) Page 326.4
Name of Respondent<br />
PACIFIC GAS AND ELECTRIC COMPANY<br />
This Report Is:<br />
Date of Report<br />
(1) X An Original<br />
(Mo, Da, Yr)<br />
(2) A Resubmission<br />
04/08/2011<br />
PURCHASED POWER (Account 555)<br />
(Including power exchanges)<br />
Year/Period of Report<br />
End of <strong>2010</strong>/Q4<br />
1. Report all power purchases made during the year. Also report exchanges of electricity (i.e., transactions involving a balancing of<br />
debits <strong>and</strong> credits for energy, capacity, etc.) <strong>and</strong> any settlements for imbalanced exchanges.<br />
2. Enter the name of the seller or other party in an exchange transaction in column (a). Do not abbreviate or truncate the name or use<br />
acronyms. Explain in a footnote any ownership interest or affiliation the respondent has with the seller.<br />
3. In column (b), enter a Statistical Classification Code based on the original contractual terms <strong>and</strong> conditions of the service as follows:<br />
RQ - for requirements service. Requirements service is service which the supplier plans to provide on an ongoing basis (i.e., the<br />
supplier includes projects load for this service in its system resource planning). In addition, the reliability of requirement service must<br />
be the same as, or second only to, the supplier’s service to its own ultimate consumers.<br />
LF - for long-term firm service. "Long-term" means five years or longer <strong>and</strong> "firm" means that service cannot be interrupted for<br />
economic reasons <strong>and</strong> is intended to remain reliable even under adverse conditions (e.g., the supplier must attempt to buy emergency<br />
energy from third parties to maintain deliveries of LF service). This category should not be used for long-term firm service firm service<br />
which meets the definition of RQ service. For all transaction identified as LF, provide in a footnote the termination date of the contract<br />
defined as the earliest date that either buyer or seller can unilaterally get out of the contract.<br />
IF - for intermediate-term firm service. The same as LF service expect that "intermediate-term" means longer than one year but less<br />
than five years.<br />
SF - for short-term service. Use this category for all firm services, where the duration of each period of commitment for service is one<br />
year or less.<br />
LU - for long-term service from a designated generating unit. "Long-term" means five years or longer. The availability <strong>and</strong> reliability of<br />
service, aside from transmission constraints, must match the availability <strong>and</strong> reliability of the designated unit.<br />
IU - for intermediate-term service from a designated generating unit. The same as LU service expect that "intermediate-term" means<br />
longer than one year but less than five years.<br />
EX - For exchanges of electricity. Use this category for transactions involving a balancing of debits <strong>and</strong> credits for energy, capacity, etc.<br />
<strong>and</strong> any settlements for imbalanced exchanges.<br />
OS - for other service. Use this category only for those services which cannot be placed in the above-defined categories, such as all<br />
non-firm service regardless of the Length of the contract <strong>and</strong> service from designated units of Less than one year. Describe the nature<br />
of the service in a footnote for each adjustment.<br />
Line<br />
No.<br />
Name of <strong>Company</strong> or Public Authority<br />
(Footnote Affiliations)<br />
(a)<br />
Statistical<br />
Classification<br />
(b)<br />
<strong>FERC</strong> Rate<br />
Schedule or<br />
Tariff Number<br />
(c)<br />
Average<br />
Monthly Billing<br />
Dem<strong>and</strong> (MW)<br />
(d)<br />
Actual Dem<strong>and</strong> (MW)<br />
Average<br />
Average<br />
Monthly NCP Dem<strong>and</strong> Monthly CP Dem<strong>and</strong><br />
(e)<br />
(f)<br />
1<br />
OROVILLE COGEN<br />
LU<br />
7.5<br />
4.479583333<br />
N/A<br />
2<br />
PE - KES KINGSBURG,LLC<br />
LU<br />
34.5<br />
32.434<br />
N/A<br />
3<br />
SAN JOAQUIN POWER COMPANY<br />
LU<br />
0<br />
0<br />
N/A<br />
4<br />
SAN JOSE COGEN<br />
LU<br />
N/A<br />
0.455<br />
N/A<br />
5<br />
SRI INTERNATIONAL<br />
LU<br />
N/A<br />
2.28<br />
N/A<br />
6<br />
UNITED AIRLINES (COGEN)<br />
LU<br />
25.65<br />
26.2305<br />
N/A<br />
7<br />
WHEELABRATOR LASSEN INC.<br />
LU<br />
42<br />
6.930168<br />
N/A<br />
8<br />
YUBA CITY COGEN<br />
LU<br />
46<br />
48.3625<br />
N/A<br />
9<br />
NAPA STATE HOSPITAL<br />
LU<br />
N/A<br />
0.40325<br />
N/A<br />
10<br />
OCCIDENTAL OF ELK HILLS<br />
LU<br />
N/A<br />
0<br />
N/A<br />
11<br />
OILDALE ENERGY LLC<br />
LU<br />
29<br />
40.21216667<br />
N/A<br />
12<br />
PE - BERKELEY, INC.<br />
LU<br />
22.47<br />
26.054<br />
N/A<br />
13<br />
RHODIA INC. (RHONE- POULENC)<br />
LU<br />
N/A<br />
0.529083333<br />
N/A<br />
14<br />
RIPON COGENERATION, LLC<br />
LU<br />
42<br />
47.98752508<br />
N/A<br />
Total<br />
<strong>FERC</strong> FORM NO. 1 (ED. 12-90) Page 326.5
Name of Respondent<br />
PACIFIC GAS AND ELECTRIC COMPANY<br />
This Report Is:<br />
Date of Report<br />
(1) X An Original<br />
(Mo, Da, Yr)<br />
(2) A Resubmission<br />
04/08/2011<br />
PURCHASED POWER (Account 555)<br />
(Including power exchanges)<br />
Year/Period of Report<br />
End of <strong>2010</strong>/Q4<br />
1. Report all power purchases made during the year. Also report exchanges of electricity (i.e., transactions involving a balancing of<br />
debits <strong>and</strong> credits for energy, capacity, etc.) <strong>and</strong> any settlements for imbalanced exchanges.<br />
2. Enter the name of the seller or other party in an exchange transaction in column (a). Do not abbreviate or truncate the name or use<br />
acronyms. Explain in a footnote any ownership interest or affiliation the respondent has with the seller.<br />
3. In column (b), enter a Statistical Classification Code based on the original contractual terms <strong>and</strong> conditions of the service as follows:<br />
RQ - for requirements service. Requirements service is service which the supplier plans to provide on an ongoing basis (i.e., the<br />
supplier includes projects load for this service in its system resource planning). In addition, the reliability of requirement service must<br />
be the same as, or second only to, the supplier’s service to its own ultimate consumers.<br />
LF - for long-term firm service. "Long-term" means five years or longer <strong>and</strong> "firm" means that service cannot be interrupted for<br />
economic reasons <strong>and</strong> is intended to remain reliable even under adverse conditions (e.g., the supplier must attempt to buy emergency<br />
energy from third parties to maintain deliveries of LF service). This category should not be used for long-term firm service firm service<br />
which meets the definition of RQ service. For all transaction identified as LF, provide in a footnote the termination date of the contract<br />
defined as the earliest date that either buyer or seller can unilaterally get out of the contract.<br />
IF - for intermediate-term firm service. The same as LF service expect that "intermediate-term" means longer than one year but less<br />
than five years.<br />
SF - for short-term service. Use this category for all firm services, where the duration of each period of commitment for service is one<br />
year or less.<br />
LU - for long-term service from a designated generating unit. "Long-term" means five years or longer. The availability <strong>and</strong> reliability of<br />
service, aside from transmission constraints, must match the availability <strong>and</strong> reliability of the designated unit.<br />
IU - for intermediate-term service from a designated generating unit. The same as LU service expect that "intermediate-term" means<br />
longer than one year but less than five years.<br />
EX - For exchanges of electricity. Use this category for transactions involving a balancing of debits <strong>and</strong> credits for energy, capacity, etc.<br />
<strong>and</strong> any settlements for imbalanced exchanges.<br />
OS - for other service. Use this category only for those services which cannot be placed in the above-defined categories, such as all<br />
non-firm service regardless of the Length of the contract <strong>and</strong> service from designated units of Less than one year. Describe the nature<br />
of the service in a footnote for each adjustment.<br />
Line<br />
No.<br />
Name of <strong>Company</strong> or Public Authority<br />
(Footnote Affiliations)<br />
(a)<br />
Statistical<br />
Classification<br />
(b)<br />
<strong>FERC</strong> Rate<br />
Schedule or<br />
Tariff Number<br />
(c)<br />
Average<br />
Monthly Billing<br />
Dem<strong>and</strong> (MW)<br />
(d)<br />
Actual Dem<strong>and</strong> (MW)<br />
Average<br />
Average<br />
Monthly NCP Dem<strong>and</strong> Monthly CP Dem<strong>and</strong><br />
(e)<br />
(f)<br />
1<br />
SAINT AGNES MED. CTR<br />
LU<br />
N/A<br />
1.1355<br />
N/A<br />
2<br />
CONOCOPHILLIPS COMPANY<br />
LU<br />
N/A<br />
8.4675<br />
N/A<br />
3<br />
SANGER POWER, L.L.C.<br />
LU<br />
38<br />
41.6675<br />
N/A<br />
4<br />
FRESNO COGENERATION CORPORATION LU<br />
33<br />
19.25<br />
N/A<br />
5<br />
FRITO LAY COGEN<br />
LU<br />
N/A<br />
0.83425<br />
N/A<br />
6<br />
THERMAL: WASTE TO ENERGY<br />
7<br />
WASTE MANAGEMENT RENEWABLE<br />
LU<br />
N/A<br />
15.84074842<br />
N/A<br />
8<br />
EBMUD (OAKLAND)<br />
LU<br />
N/A<br />
1.620756667<br />
N/A<br />
9<br />
GAS RECOVERY SYS. (AMERICAN CYN)<br />
LU<br />
0.836<br />
1.367083333<br />
N/A<br />
10<br />
GAS RECOVERY SYS. (GUADALUPE)<br />
LU<br />
1.443<br />
2.302833333<br />
N/A<br />
11<br />
GAS RECOVERY SYS. (MENLO PARK)<br />
LU<br />
0.95<br />
1.134083333<br />
N/A<br />
12<br />
GAS RECOVERY SYS. (NEWBY ISLAND 1)<br />
LU<br />
1.73<br />
1.855<br />
N/A<br />
13<br />
GAS RECOVERY SYS. (NEWBY ISLAND 2)<br />
LU<br />
3.76<br />
3.19<br />
N/A<br />
14<br />
GWF POWER SYSTEMS INC. #1<br />
LU<br />
16<br />
19.71108333<br />
N/A<br />
Total<br />
<strong>FERC</strong> FORM NO. 1 (ED. 12-90) Page 326.6
Name of Respondent<br />
PACIFIC GAS AND ELECTRIC COMPANY<br />
This Report Is:<br />
Date of Report<br />
(1) X An Original<br />
(Mo, Da, Yr)<br />
(2) A Resubmission<br />
04/08/2011<br />
PURCHASED POWER (Account 555)<br />
(Including power exchanges)<br />
Year/Period of Report<br />
End of <strong>2010</strong>/Q4<br />
1. Report all power purchases made during the year. Also report exchanges of electricity (i.e., transactions involving a balancing of<br />
debits <strong>and</strong> credits for energy, capacity, etc.) <strong>and</strong> any settlements for imbalanced exchanges.<br />
2. Enter the name of the seller or other party in an exchange transaction in column (a). Do not abbreviate or truncate the name or use<br />
acronyms. Explain in a footnote any ownership interest or affiliation the respondent has with the seller.<br />
3. In column (b), enter a Statistical Classification Code based on the original contractual terms <strong>and</strong> conditions of the service as follows:<br />
RQ - for requirements service. Requirements service is service which the supplier plans to provide on an ongoing basis (i.e., the<br />
supplier includes projects load for this service in its system resource planning). In addition, the reliability of requirement service must<br />
be the same as, or second only to, the supplier’s service to its own ultimate consumers.<br />
LF - for long-term firm service. "Long-term" means five years or longer <strong>and</strong> "firm" means that service cannot be interrupted for<br />
economic reasons <strong>and</strong> is intended to remain reliable even under adverse conditions (e.g., the supplier must attempt to buy emergency<br />
energy from third parties to maintain deliveries of LF service). This category should not be used for long-term firm service firm service<br />
which meets the definition of RQ service. For all transaction identified as LF, provide in a footnote the termination date of the contract<br />
defined as the earliest date that either buyer or seller can unilaterally get out of the contract.<br />
IF - for intermediate-term firm service. The same as LF service expect that "intermediate-term" means longer than one year but less<br />
than five years.<br />
SF - for short-term service. Use this category for all firm services, where the duration of each period of commitment for service is one<br />
year or less.<br />
LU - for long-term service from a designated generating unit. "Long-term" means five years or longer. The availability <strong>and</strong> reliability of<br />
service, aside from transmission constraints, must match the availability <strong>and</strong> reliability of the designated unit.<br />
IU - for intermediate-term service from a designated generating unit. The same as LU service expect that "intermediate-term" means<br />
longer than one year but less than five years.<br />
EX - For exchanges of electricity. Use this category for transactions involving a balancing of debits <strong>and</strong> credits for energy, capacity, etc.<br />
<strong>and</strong> any settlements for imbalanced exchanges.<br />
OS - for other service. Use this category only for those services which cannot be placed in the above-defined categories, such as all<br />
non-firm service regardless of the Length of the contract <strong>and</strong> service from designated units of Less than one year. Describe the nature<br />
of the service in a footnote for each adjustment.<br />
Line<br />
No.<br />
Name of <strong>Company</strong> or Public Authority<br />
(Footnote Affiliations)<br />
(a)<br />
Statistical<br />
Classification<br />
(b)<br />
<strong>FERC</strong> Rate<br />
Schedule or<br />
Tariff Number<br />
(c)<br />
Average<br />
Monthly Billing<br />
Dem<strong>and</strong> (MW)<br />
(d)<br />
Actual Dem<strong>and</strong> (MW)<br />
Average<br />
Average<br />
Monthly NCP Dem<strong>and</strong> Monthly CP Dem<strong>and</strong><br />
(e)<br />
(f)<br />
1<br />
GWF POWER SYSTEMS INC. #2<br />
LU<br />
16<br />
19.218<br />
N/A<br />
2<br />
GWF POWER SYSTEMS INC. #3<br />
LU<br />
16<br />
18.772<br />
N/A<br />
3<br />
GWF POWER SYSTEMS INC. #4<br />
LU<br />
16<br />
19.30916667<br />
N/A<br />
4<br />
GWF POWER SYSTEMS INC. #5<br />
LU<br />
16<br />
19.5045<br />
N/A<br />
5<br />
HANFORD L.P.<br />
LU<br />
22<br />
23.99448<br />
N/A<br />
6<br />
MONTEREY REGIONAL WASTE MGMT<br />
LU<br />
1.15<br />
1.953061667<br />
N/A<br />
7<br />
MONTEREY REGIONAL WATER<br />
LU<br />
N/A<br />
0.212583333<br />
N/A<br />
8<br />
COVANTA POWER PACIFIC (SALINAS)<br />
LU<br />
N/A<br />
0<br />
N/A<br />
9<br />
COVANTA POWER PACIFIC, STOCKTON<br />
LU<br />
N/A<br />
0.766916667<br />
N/A<br />
10<br />
PALO ALTO LANDFILL<br />
LU<br />
N/A<br />
0<br />
N/A<br />
11<br />
STANISLAUS WASTE ENERGY CO.<br />
LU<br />
16.5<br />
17.96108333<br />
N/A<br />
12<br />
THERMAL: COAL<br />
13<br />
AIR PRODUCTS MANUFACTURING<br />
LU<br />
N/A<br />
51.14341667<br />
N/A<br />
14<br />
MT.POSO COGENERATION CO.<br />
LU<br />
N/A<br />
50.79233333<br />
N/A<br />
Total<br />
<strong>FERC</strong> FORM NO. 1 (ED. 12-90) Page 326.7
Name of Respondent<br />
PACIFIC GAS AND ELECTRIC COMPANY<br />
This Report Is:<br />
Date of Report<br />
(1) X An Original<br />
(Mo, Da, Yr)<br />
(2) A Resubmission<br />
04/08/2011<br />
PURCHASED POWER (Account 555)<br />
(Including power exchanges)<br />
Year/Period of Report<br />
End of <strong>2010</strong>/Q4<br />
1. Report all power purchases made during the year. Also report exchanges of electricity (i.e., transactions involving a balancing of<br />
debits <strong>and</strong> credits for energy, capacity, etc.) <strong>and</strong> any settlements for imbalanced exchanges.<br />
2. Enter the name of the seller or other party in an exchange transaction in column (a). Do not abbreviate or truncate the name or use<br />
acronyms. Explain in a footnote any ownership interest or affiliation the respondent has with the seller.<br />
3. In column (b), enter a Statistical Classification Code based on the original contractual terms <strong>and</strong> conditions of the service as follows:<br />
RQ - for requirements service. Requirements service is service which the supplier plans to provide on an ongoing basis (i.e., the<br />
supplier includes projects load for this service in its system resource planning). In addition, the reliability of requirement service must<br />
be the same as, or second only to, the supplier’s service to its own ultimate consumers.<br />
LF - for long-term firm service. "Long-term" means five years or longer <strong>and</strong> "firm" means that service cannot be interrupted for<br />
economic reasons <strong>and</strong> is intended to remain reliable even under adverse conditions (e.g., the supplier must attempt to buy emergency<br />
energy from third parties to maintain deliveries of LF service). This category should not be used for long-term firm service firm service<br />
which meets the definition of RQ service. For all transaction identified as LF, provide in a footnote the termination date of the contract<br />
defined as the earliest date that either buyer or seller can unilaterally get out of the contract.<br />
IF - for intermediate-term firm service. The same as LF service expect that "intermediate-term" means longer than one year but less<br />
than five years.<br />
SF - for short-term service. Use this category for all firm services, where the duration of each period of commitment for service is one<br />
year or less.<br />
LU - for long-term service from a designated generating unit. "Long-term" means five years or longer. The availability <strong>and</strong> reliability of<br />
service, aside from transmission constraints, must match the availability <strong>and</strong> reliability of the designated unit.<br />
IU - for intermediate-term service from a designated generating unit. The same as LU service expect that "intermediate-term" means<br />
longer than one year but less than five years.<br />
EX - For exchanges of electricity. Use this category for transactions involving a balancing of debits <strong>and</strong> credits for energy, capacity, etc.<br />
<strong>and</strong> any settlements for imbalanced exchanges.<br />
OS - for other service. Use this category only for those services which cannot be placed in the above-defined categories, such as all<br />
non-firm service regardless of the Length of the contract <strong>and</strong> service from designated units of Less than one year. Describe the nature<br />
of the service in a footnote for each adjustment.<br />
Line<br />
No.<br />
Name of <strong>Company</strong> or Public Authority<br />
(Footnote Affiliations)<br />
(a)<br />
Statistical<br />
Classification<br />
(b)<br />
<strong>FERC</strong> Rate<br />
Schedule or<br />
Tariff Number<br />
(c)<br />
Average<br />
Monthly Billing<br />
Dem<strong>and</strong> (MW)<br />
(d)<br />
Actual Dem<strong>and</strong> (MW)<br />
Average<br />
Average<br />
Monthly NCP Dem<strong>and</strong> Monthly CP Dem<strong>and</strong><br />
(e)<br />
(f)<br />
1<br />
POSDEF (COGEN NATIONAL)<br />
LU<br />
44<br />
0<br />
N/A<br />
2<br />
RIO BRAVO POSO<br />
LU<br />
30<br />
36.0215<br />
N/A<br />
3<br />
RENEWABLE: GEOTHERMAL<br />
4<br />
AMEDEE GEOTHERMAL VENTURE 1<br />
0.369<br />
0.112166667<br />
N/A<br />
5<br />
RENEWABLE: HYDRO<br />
6<br />
BAKER STATION ASSOCIATES L.P.<br />
LU<br />
N/A<br />
1.141083333<br />
N/A<br />
7<br />
CALAVERAS CTY WD<br />
LU<br />
N/A<br />
0.592916667<br />
N/A<br />
8<br />
EL DORADO (MONTGOMERY CK)<br />
LU<br />
N/A<br />
2.166715917<br />
N/A<br />
9<br />
FRIANT POWER AUTHORITY<br />
LU<br />
N/A<br />
14.38266667<br />
N/A<br />
10<br />
EIF HAYPRESS, LLC (LWR)<br />
LU<br />
N/A<br />
1.682666667<br />
N/A<br />
11<br />
EIF HAYPRESS LLC (MDL)<br />
LU<br />
N/A<br />
1.780833333<br />
N/A<br />
12<br />
HUMBOLDT BAY MWD<br />
LU<br />
N/A<br />
0.868583333<br />
N/A<br />
13<br />
HYPOWER, INC.<br />
LU<br />
N/A<br />
9.41677775<br />
N/A<br />
14<br />
INDIAN VALLEY HYDRO<br />
LU<br />
N/A<br />
0.5635<br />
N/A<br />
Total<br />
<strong>FERC</strong> FORM NO. 1 (ED. 12-90) Page 326.8
Name of Respondent<br />
PACIFIC GAS AND ELECTRIC COMPANY<br />
This Report Is:<br />
Date of Report<br />
(1) X An Original<br />
(Mo, Da, Yr)<br />
(2) A Resubmission<br />
04/08/2011<br />
PURCHASED POWER (Account 555)<br />
(Including power exchanges)<br />
Year/Period of Report<br />
End of <strong>2010</strong>/Q4<br />
1. Report all power purchases made during the year. Also report exchanges of electricity (i.e., transactions involving a balancing of<br />
debits <strong>and</strong> credits for energy, capacity, etc.) <strong>and</strong> any settlements for imbalanced exchanges.<br />
2. Enter the name of the seller or other party in an exchange transaction in column (a). Do not abbreviate or truncate the name or use<br />
acronyms. Explain in a footnote any ownership interest or affiliation the respondent has with the seller.<br />
3. In column (b), enter a Statistical Classification Code based on the original contractual terms <strong>and</strong> conditions of the service as follows:<br />
RQ - for requirements service. Requirements service is service which the supplier plans to provide on an ongoing basis (i.e., the<br />
supplier includes projects load for this service in its system resource planning). In addition, the reliability of requirement service must<br />
be the same as, or second only to, the supplier’s service to its own ultimate consumers.<br />
LF - for long-term firm service. "Long-term" means five years or longer <strong>and</strong> "firm" means that service cannot be interrupted for<br />
economic reasons <strong>and</strong> is intended to remain reliable even under adverse conditions (e.g., the supplier must attempt to buy emergency<br />
energy from third parties to maintain deliveries of LF service). This category should not be used for long-term firm service firm service<br />
which meets the definition of RQ service. For all transaction identified as LF, provide in a footnote the termination date of the contract<br />
defined as the earliest date that either buyer or seller can unilaterally get out of the contract.<br />
IF - for intermediate-term firm service. The same as LF service expect that "intermediate-term" means longer than one year but less<br />
than five years.<br />
SF - for short-term service. Use this category for all firm services, where the duration of each period of commitment for service is one<br />
year or less.<br />
LU - for long-term service from a designated generating unit. "Long-term" means five years or longer. The availability <strong>and</strong> reliability of<br />
service, aside from transmission constraints, must match the availability <strong>and</strong> reliability of the designated unit.<br />
IU - for intermediate-term service from a designated generating unit. The same as LU service expect that "intermediate-term" means<br />
longer than one year but less than five years.<br />
EX - For exchanges of electricity. Use this category for transactions involving a balancing of debits <strong>and</strong> credits for energy, capacity, etc.<br />
<strong>and</strong> any settlements for imbalanced exchanges.<br />
OS - for other service. Use this category only for those services which cannot be placed in the above-defined categories, such as all<br />
non-firm service regardless of the Length of the contract <strong>and</strong> service from designated units of Less than one year. Describe the nature<br />
of the service in a footnote for each adjustment.<br />
Line<br />
No.<br />
Name of <strong>Company</strong> or Public Authority<br />
(Footnote Affiliations)<br />
(a)<br />
Statistical<br />
Classification<br />
(b)<br />
<strong>FERC</strong> Rate<br />
Schedule or<br />
Tariff Number<br />
(c)<br />
Average<br />
Monthly Billing<br />
Dem<strong>and</strong> (MW)<br />
(d)<br />
Actual Dem<strong>and</strong> (MW)<br />
Average<br />
Average<br />
Monthly NCP Dem<strong>and</strong> Monthly CP Dem<strong>and</strong><br />
(e)<br />
(f)<br />
1<br />
KERN HYDRO (OLCESE)<br />
LU<br />
N/A<br />
6.00075<br />
N/A<br />
2<br />
MADERA-CHOWCHILLA WATER AND<br />
LU<br />
N/A<br />
1.032624333<br />
N/A<br />
3<br />
MALACHA HYDRO L.P.<br />
LU<br />
N/A<br />
20.92<br />
N/A<br />
4<br />
MEGA RENEWABLES (BIDWELL DITCH)<br />
LU<br />
N/A<br />
1.488048667<br />
N/A<br />
5<br />
MEGA RENEWABLES (HATCHET CRK)<br />
LU<br />
N/A<br />
4.19206275<br />
N/A<br />
6<br />
MEGA RENEWABLES (ROARING CRK)<br />
LU<br />
N/A<br />
1.35558725<br />
N/A<br />
7<br />
MERCED ID (PARKER)<br />
LU<br />
N/A<br />
0.904666667<br />
N/A<br />
8<br />
MONTEREY CTY WATER RES AGENCY<br />
LU<br />
N/A<br />
1.923333333<br />
N/A<br />
9<br />
NELSON CREEK POWER INC.<br />
LU<br />
N/A<br />
0.731083333<br />
N/A<br />
10<br />
NEVADA IRRIGATION DISTRICT/BOWMAN LU<br />
N/A<br />
1.781995833<br />
N/A<br />
11<br />
NID/COMBIE SOUTH<br />
LU<br />
N/A<br />
0.802666667<br />
N/A<br />
12<br />
NID/SCOTTS FLAT<br />
LU<br />
N/A<br />
0.600416667<br />
N/A<br />
13<br />
NORMAN ROSS BURGESS<br />
LU<br />
N/A<br />
1.547833333<br />
N/A<br />
14<br />
OLSEN POWER PARTNERS<br />
LU<br />
N/A<br />
2.26325<br />
N/A<br />
Total<br />
<strong>FERC</strong> FORM NO. 1 (ED. 12-90) Page 326.9
Name of Respondent<br />
PACIFIC GAS AND ELECTRIC COMPANY<br />
This Report Is:<br />
Date of Report<br />
(1) X An Original<br />
(Mo, Da, Yr)<br />
(2) A Resubmission<br />
04/08/2011<br />
PURCHASED POWER (Account 555)<br />
(Including power exchanges)<br />
Year/Period of Report<br />
End of <strong>2010</strong>/Q4<br />
1. Report all power purchases made during the year. Also report exchanges of electricity (i.e., transactions involving a balancing of<br />
debits <strong>and</strong> credits for energy, capacity, etc.) <strong>and</strong> any settlements for imbalanced exchanges.<br />
2. Enter the name of the seller or other party in an exchange transaction in column (a). Do not abbreviate or truncate the name or use<br />
acronyms. Explain in a footnote any ownership interest or affiliation the respondent has with the seller.<br />
3. In column (b), enter a Statistical Classification Code based on the original contractual terms <strong>and</strong> conditions of the service as follows:<br />
RQ - for requirements service. Requirements service is service which the supplier plans to provide on an ongoing basis (i.e., the<br />
supplier includes projects load for this service in its system resource planning). In addition, the reliability of requirement service must<br />
be the same as, or second only to, the supplier’s service to its own ultimate consumers.<br />
LF - for long-term firm service. "Long-term" means five years or longer <strong>and</strong> "firm" means that service cannot be interrupted for<br />
economic reasons <strong>and</strong> is intended to remain reliable even under adverse conditions (e.g., the supplier must attempt to buy emergency<br />
energy from third parties to maintain deliveries of LF service). This category should not be used for long-term firm service firm service<br />
which meets the definition of RQ service. For all transaction identified as LF, provide in a footnote the termination date of the contract<br />
defined as the earliest date that either buyer or seller can unilaterally get out of the contract.<br />
IF - for intermediate-term firm service. The same as LF service expect that "intermediate-term" means longer than one year but less<br />
than five years.<br />
SF - for short-term service. Use this category for all firm services, where the duration of each period of commitment for service is one<br />
year or less.<br />
LU - for long-term service from a designated generating unit. "Long-term" means five years or longer. The availability <strong>and</strong> reliability of<br />
service, aside from transmission constraints, must match the availability <strong>and</strong> reliability of the designated unit.<br />
IU - for intermediate-term service from a designated generating unit. The same as LU service expect that "intermediate-term" means<br />
longer than one year but less than five years.<br />
EX - For exchanges of electricity. Use this category for transactions involving a balancing of debits <strong>and</strong> credits for energy, capacity, etc.<br />
<strong>and</strong> any settlements for imbalanced exchanges.<br />
OS - for other service. Use this category only for those services which cannot be placed in the above-defined categories, such as all<br />
non-firm service regardless of the Length of the contract <strong>and</strong> service from designated units of Less than one year. Describe the nature<br />
of the service in a footnote for each adjustment.<br />
Line<br />
No.<br />
Name of <strong>Company</strong> or Public Authority<br />
(Footnote Affiliations)<br />
(a)<br />
Statistical<br />
Classification<br />
(b)<br />
<strong>FERC</strong> Rate<br />
Schedule or<br />
Tariff Number<br />
(c)<br />
Average<br />
Monthly Billing<br />
Dem<strong>and</strong> (MW)<br />
(d)<br />
Actual Dem<strong>and</strong> (MW)<br />
Average<br />
Average<br />
Monthly NCP Dem<strong>and</strong> Monthly CP Dem<strong>and</strong><br />
(e)<br />
(f)<br />
1<br />
ORANGE COVE IRRIGATION DIST.<br />
LU<br />
N/A<br />
0.416916667<br />
N/A<br />
2<br />
ROCK CREEK L.P.<br />
LU<br />
N/A<br />
1.48925<br />
N/A<br />
3<br />
SNOW MOUNTAIN HYDRO LLC (LOST<br />
LU<br />
N/A<br />
0.399128167<br />
N/A<br />
4<br />
SNOW MOUNTAIN HYDRO LLC<br />
LU<br />
N/A<br />
0.3805<br />
N/A<br />
5<br />
SNOW MOUNTAIN HYDRO LLC (COVE)<br />
LU<br />
N/A<br />
3.196017167<br />
N/A<br />
6<br />
SNOW MOUNTAIN HYDRO LLC (BURNEY<br />
LU<br />
N/A<br />
1.4105<br />
N/A<br />
7<br />
SOUTH SAN JOAQUIN ID<br />
LU<br />
N/A<br />
2.1385<br />
N/A<br />
8<br />
SOUTH SAN JOAQUIN ID (WOODWARD)<br />
LU<br />
N/A<br />
0.95775<br />
N/A<br />
9<br />
STS HYDROPOWER LTD. (KANAKA)<br />
LU<br />
N/A<br />
0.75875<br />
N/A<br />
10<br />
STS HYDROPOWER LTD. (KEKAWAKA)<br />
LU<br />
N/A<br />
3.5995<br />
N/A<br />
11<br />
TKO POWER (SOUTH BEAR CREEK)<br />
LU<br />
N/A<br />
0.262408167<br />
N/A<br />
12<br />
TRI-DAM AUTHORITY<br />
LU<br />
15<br />
11.829<br />
N/A<br />
13<br />
YOLO COUNTY FLOOD & WCD<br />
LU<br />
N/A<br />
0<br />
N/A<br />
14<br />
YUBA COUNTY WATER (DEADWOOD<br />
LU<br />
N/A<br />
0.789304167<br />
N/A<br />
Total<br />
<strong>FERC</strong> FORM NO. 1 (ED. 12-90) Page 326.10
Name of Respondent<br />
PACIFIC GAS AND ELECTRIC COMPANY<br />
This Report Is:<br />
Date of Report<br />
(1) X An Original<br />
(Mo, Da, Yr)<br />
(2) A Resubmission<br />
04/08/2011<br />
PURCHASED POWER (Account 555)<br />
(Including power exchanges)<br />
Year/Period of Report<br />
End of <strong>2010</strong>/Q4<br />
1. Report all power purchases made during the year. Also report exchanges of electricity (i.e., transactions involving a balancing of<br />
debits <strong>and</strong> credits for energy, capacity, etc.) <strong>and</strong> any settlements for imbalanced exchanges.<br />
2. Enter the name of the seller or other party in an exchange transaction in column (a). Do not abbreviate or truncate the name or use<br />
acronyms. Explain in a footnote any ownership interest or affiliation the respondent has with the seller.<br />
3. In column (b), enter a Statistical Classification Code based on the original contractual terms <strong>and</strong> conditions of the service as follows:<br />
RQ - for requirements service. Requirements service is service which the supplier plans to provide on an ongoing basis (i.e., the<br />
supplier includes projects load for this service in its system resource planning). In addition, the reliability of requirement service must<br />
be the same as, or second only to, the supplier’s service to its own ultimate consumers.<br />
LF - for long-term firm service. "Long-term" means five years or longer <strong>and</strong> "firm" means that service cannot be interrupted for<br />
economic reasons <strong>and</strong> is intended to remain reliable even under adverse conditions (e.g., the supplier must attempt to buy emergency<br />
energy from third parties to maintain deliveries of LF service). This category should not be used for long-term firm service firm service<br />
which meets the definition of RQ service. For all transaction identified as LF, provide in a footnote the termination date of the contract<br />
defined as the earliest date that either buyer or seller can unilaterally get out of the contract.<br />
IF - for intermediate-term firm service. The same as LF service expect that "intermediate-term" means longer than one year but less<br />
than five years.<br />
SF - for short-term service. Use this category for all firm services, where the duration of each period of commitment for service is one<br />
year or less.<br />
LU - for long-term service from a designated generating unit. "Long-term" means five years or longer. The availability <strong>and</strong> reliability of<br />
service, aside from transmission constraints, must match the availability <strong>and</strong> reliability of the designated unit.<br />
IU - for intermediate-term service from a designated generating unit. The same as LU service expect that "intermediate-term" means<br />
longer than one year but less than five years.<br />
EX - For exchanges of electricity. Use this category for transactions involving a balancing of debits <strong>and</strong> credits for energy, capacity, etc.<br />
<strong>and</strong> any settlements for imbalanced exchanges.<br />
OS - for other service. Use this category only for those services which cannot be placed in the above-defined categories, such as all<br />
non-firm service regardless of the Length of the contract <strong>and</strong> service from designated units of Less than one year. Describe the nature<br />
of the service in a footnote for each adjustment.<br />
Line<br />
No.<br />
Name of <strong>Company</strong> or Public Authority<br />
(Footnote Affiliations)<br />
(a)<br />
Statistical<br />
Classification<br />
(b)<br />
<strong>FERC</strong> Rate<br />
Schedule or<br />
Tariff Number<br />
(c)<br />
Average<br />
Monthly Billing<br />
Dem<strong>and</strong> (MW)<br />
(d)<br />
Actual Dem<strong>and</strong> (MW)<br />
Average<br />
Average<br />
Monthly NCP Dem<strong>and</strong> Monthly CP Dem<strong>and</strong><br />
(e)<br />
(f)<br />
1<br />
MISC. CHARGES FOR VARIOUS<br />
2<br />
DISTRICTS<br />
3<br />
RENEWABLE: WIND<br />
4<br />
ALTAMONT ENERGY CORP<br />
LU<br />
N/A<br />
0<br />
N/A<br />
5<br />
ALTAMONT MIDWAY LTD.<br />
LU<br />
N/A<br />
4.482<br />
N/A<br />
6<br />
ALTAMONT POWER LLC (PARTNERS 1)<br />
LU<br />
N/A<br />
0<br />
N/A<br />
7<br />
ALTAMONT POWER LLC (PARTNERS 2)<br />
LU<br />
N/A<br />
0<br />
N/A<br />
8<br />
ALTAMONT POWER LLC (3-4 )<br />
LU<br />
N/A<br />
1.5549925<br />
N/A<br />
9<br />
ALTAMONT POWER LLC (4-4)<br />
LU<br />
N/A<br />
7.9486435<br />
N/A<br />
10<br />
ALTAMONT POWER LLC (6-4)<br />
LU<br />
N/A<br />
6.588399333<br />
N/A<br />
11<br />
GREEN RIDGE POWER LLC (10 MW)<br />
LU<br />
N/A<br />
9.865651417<br />
N/A<br />
12<br />
GREEN RIDGE POWER LLC (100 MW - A)<br />
LU<br />
N/A<br />
24.92677375<br />
N/A<br />
13<br />
GREEN RIDGE POWER LLC (100 MW - C)<br />
LU<br />
N/A<br />
2.918652333<br />
N/A<br />
14<br />
GREEN RIDGE POWER LLC (100 MW - D)<br />
LU<br />
N/A<br />
5.666597667<br />
N/A<br />
Total<br />
<strong>FERC</strong> FORM NO. 1 (ED. 12-90) Page 326.11
Name of Respondent<br />
PACIFIC GAS AND ELECTRIC COMPANY<br />
This Report Is:<br />
Date of Report<br />
(1) X An Original<br />
(Mo, Da, Yr)<br />
(2) A Resubmission<br />
04/08/2011<br />
PURCHASED POWER (Account 555)<br />
(Including power exchanges)<br />
Year/Period of Report<br />
End of <strong>2010</strong>/Q4<br />
1. Report all power purchases made during the year. Also report exchanges of electricity (i.e., transactions involving a balancing of<br />
debits <strong>and</strong> credits for energy, capacity, etc.) <strong>and</strong> any settlements for imbalanced exchanges.<br />
2. Enter the name of the seller or other party in an exchange transaction in column (a). Do not abbreviate or truncate the name or use<br />
acronyms. Explain in a footnote any ownership interest or affiliation the respondent has with the seller.<br />
3. In column (b), enter a Statistical Classification Code based on the original contractual terms <strong>and</strong> conditions of the service as follows:<br />
RQ - for requirements service. Requirements service is service which the supplier plans to provide on an ongoing basis (i.e., the<br />
supplier includes projects load for this service in its system resource planning). In addition, the reliability of requirement service must<br />
be the same as, or second only to, the supplier’s service to its own ultimate consumers.<br />
LF - for long-term firm service. "Long-term" means five years or longer <strong>and</strong> "firm" means that service cannot be interrupted for<br />
economic reasons <strong>and</strong> is intended to remain reliable even under adverse conditions (e.g., the supplier must attempt to buy emergency<br />
energy from third parties to maintain deliveries of LF service). This category should not be used for long-term firm service firm service<br />
which meets the definition of RQ service. For all transaction identified as LF, provide in a footnote the termination date of the contract<br />
defined as the earliest date that either buyer or seller can unilaterally get out of the contract.<br />
IF - for intermediate-term firm service. The same as LF service expect that "intermediate-term" means longer than one year but less<br />
than five years.<br />
SF - for short-term service. Use this category for all firm services, where the duration of each period of commitment for service is one<br />
year or less.<br />
LU - for long-term service from a designated generating unit. "Long-term" means five years or longer. The availability <strong>and</strong> reliability of<br />
service, aside from transmission constraints, must match the availability <strong>and</strong> reliability of the designated unit.<br />
IU - for intermediate-term service from a designated generating unit. The same as LU service expect that "intermediate-term" means<br />
longer than one year but less than five years.<br />
EX - For exchanges of electricity. Use this category for transactions involving a balancing of debits <strong>and</strong> credits for energy, capacity, etc.<br />
<strong>and</strong> any settlements for imbalanced exchanges.<br />
OS - for other service. Use this category only for those services which cannot be placed in the above-defined categories, such as all<br />
non-firm service regardless of the Length of the contract <strong>and</strong> service from designated units of Less than one year. Describe the nature<br />
of the service in a footnote for each adjustment.<br />
Line<br />
No.<br />
Name of <strong>Company</strong> or Public Authority<br />
(Footnote Affiliations)<br />
(a)<br />
Statistical<br />
Classification<br />
(b)<br />
<strong>FERC</strong> Rate<br />
Schedule or<br />
Tariff Number<br />
(c)<br />
Average<br />
Monthly Billing<br />
Dem<strong>and</strong> (MW)<br />
(d)<br />
Actual Dem<strong>and</strong> (MW)<br />
Average<br />
Average<br />
Monthly NCP Dem<strong>and</strong> Monthly CP Dem<strong>and</strong><br />
(e)<br />
(f)<br />
1<br />
GREEN RIDGE POWER LLC (110 MW)<br />
LU<br />
N/A<br />
89.7254155<br />
N/A<br />
2<br />
GREEN RIDGE POWER LLC (23.8 MW)<br />
LU<br />
N/A<br />
4.997657833<br />
N/A<br />
3<br />
GREEN RIDGE POWER LLC (5.9 MW)<br />
LU<br />
N/A<br />
3.314973<br />
N/A<br />
4<br />
GREEN RIDGE POWER LLC (70 MW - B)<br />
LU<br />
N/A<br />
8.65554125<br />
N/A<br />
5<br />
GREEN RIDGE POWER LLC (70 MW - C)<br />
LU<br />
N/A<br />
13.95541517<br />
N/A<br />
6<br />
GREEN RIDGE POWER LLC (70 MW - D)<br />
LU<br />
N/A<br />
0.701941917<br />
N/A<br />
7<br />
GREEN RIDGE POWER LLC (70 MW)<br />
LU<br />
N/A<br />
26.55072567<br />
N/A<br />
8<br />
INTERNATIONAL TURBINE RESEARCH<br />
LU<br />
N/A<br />
13.83466667<br />
N/A<br />
9<br />
J.V.ENTERPRISE<br />
LU<br />
N/A<br />
0<br />
N/A<br />
10<br />
NORTHWIND ENERGY<br />
LU<br />
N/A<br />
6.435666667<br />
N/A<br />
11<br />
PATTERSON PASS WIND FARM LLC<br />
LU<br />
N/A<br />
13.0735<br />
N/A<br />
12<br />
SEA WEST ENERGY GROUP (TOTALS)<br />
LU<br />
N/A<br />
4.428083333<br />
N/A<br />
13<br />
TOWN OF SCOTIA COMPANY, LLC<br />
LU<br />
N/A<br />
22.492<br />
N/A<br />
14<br />
TRES VAQUEROS WIND FARMS, LLC<br />
LU<br />
N/A<br />
0<br />
N/A<br />
Total<br />
<strong>FERC</strong> FORM NO. 1 (ED. 12-90) Page 326.12
Name of Respondent<br />
PACIFIC GAS AND ELECTRIC COMPANY<br />
This Report Is:<br />
Date of Report<br />
(1) X An Original<br />
(Mo, Da, Yr)<br />
(2) A Resubmission<br />
04/08/2011<br />
PURCHASED POWER (Account 555)<br />
(Including power exchanges)<br />
Year/Period of Report<br />
End of <strong>2010</strong>/Q4<br />
1. Report all power purchases made during the year. Also report exchanges of electricity (i.e., transactions involving a balancing of<br />
debits <strong>and</strong> credits for energy, capacity, etc.) <strong>and</strong> any settlements for imbalanced exchanges.<br />
2. Enter the name of the seller or other party in an exchange transaction in column (a). Do not abbreviate or truncate the name or use<br />
acronyms. Explain in a footnote any ownership interest or affiliation the respondent has with the seller.<br />
3. In column (b), enter a Statistical Classification Code based on the original contractual terms <strong>and</strong> conditions of the service as follows:<br />
RQ - for requirements service. Requirements service is service which the supplier plans to provide on an ongoing basis (i.e., the<br />
supplier includes projects load for this service in its system resource planning). In addition, the reliability of requirement service must<br />
be the same as, or second only to, the supplier’s service to its own ultimate consumers.<br />
LF - for long-term firm service. "Long-term" means five years or longer <strong>and</strong> "firm" means that service cannot be interrupted for<br />
economic reasons <strong>and</strong> is intended to remain reliable even under adverse conditions (e.g., the supplier must attempt to buy emergency<br />
energy from third parties to maintain deliveries of LF service). This category should not be used for long-term firm service firm service<br />
which meets the definition of RQ service. For all transaction identified as LF, provide in a footnote the termination date of the contract<br />
defined as the earliest date that either buyer or seller can unilaterally get out of the contract.<br />
IF - for intermediate-term firm service. The same as LF service expect that "intermediate-term" means longer than one year but less<br />
than five years.<br />
SF - for short-term service. Use this category for all firm services, where the duration of each period of commitment for service is one<br />
year or less.<br />
LU - for long-term service from a designated generating unit. "Long-term" means five years or longer. The availability <strong>and</strong> reliability of<br />
service, aside from transmission constraints, must match the availability <strong>and</strong> reliability of the designated unit.<br />
IU - for intermediate-term service from a designated generating unit. The same as LU service expect that "intermediate-term" means<br />
longer than one year but less than five years.<br />
EX - For exchanges of electricity. Use this category for transactions involving a balancing of debits <strong>and</strong> credits for energy, capacity, etc.<br />
<strong>and</strong> any settlements for imbalanced exchanges.<br />
OS - for other service. Use this category only for those services which cannot be placed in the above-defined categories, such as all<br />
non-firm service regardless of the Length of the contract <strong>and</strong> service from designated units of Less than one year. Describe the nature<br />
of the service in a footnote for each adjustment.<br />
Line<br />
No.<br />
Name of <strong>Company</strong> or Public Authority<br />
(Footnote Affiliations)<br />
(a)<br />
Statistical<br />
Classification<br />
(b)<br />
<strong>FERC</strong> Rate<br />
Schedule or<br />
Tariff Number<br />
(c)<br />
Average<br />
Monthly Billing<br />
Dem<strong>and</strong> (MW)<br />
(d)<br />
Actual Dem<strong>and</strong> (MW)<br />
Average<br />
Average<br />
Monthly NCP Dem<strong>and</strong> Monthly CP Dem<strong>and</strong><br />
(e)<br />
(f)<br />
1<br />
THERMAL: BIOMASS<br />
<strong>2010</strong><br />
2<br />
SIERRA PACIFIC IND. (ANDERSON)<br />
LU<br />
N/A<br />
2.512833333<br />
N/A<br />
3<br />
SIERRA PACIFIC IND. (SONORA)<br />
LU<br />
N/A<br />
0<br />
N/A<br />
4<br />
THERMAL: ENHANCED OIL RECOVERY<br />
<strong>2010</strong><br />
5<br />
BERRY PETROLEUM COGEN<br />
LU<br />
N/A<br />
37.10875<br />
N/A<br />
6<br />
CHEVRON U.S.A. INC. (NORTH MIDWAY)<br />
LU<br />
N/A<br />
0.172833333<br />
N/A<br />
7<br />
THERMAL: COGENERATION<br />
<strong>2010</strong><br />
8<br />
CHEVRON RICHMOND REFINERY<br />
LU<br />
N/A<br />
13.92<br />
N/A<br />
9<br />
UCSF<br />
LU<br />
N/A<br />
2.422166667<br />
N/A<br />
10<br />
SMALL POWER PRODUCERS -<br />
11<br />
AMERICAN ENERGY, INC. (SAN LUIS<br />
LU<br />
N/A<br />
0<br />
N/A<br />
12<br />
AMERICAN ENERGY, INC. ( WOLFSEN<br />
LU<br />
N/A<br />
0.213416667<br />
N/A<br />
13<br />
ARBUCKLE MOUNTAIN HYDRO<br />
LU<br />
N/A<br />
0.152916667<br />
N/A<br />
14<br />
BAILEY CREEK RANCH<br />
LU<br />
N/A<br />
0.232916667<br />
N/A<br />
Total<br />
<strong>FERC</strong> FORM NO. 1 (ED. 12-90) Page 326.13
Name of Respondent<br />
PACIFIC GAS AND ELECTRIC COMPANY<br />
This Report Is:<br />
Date of Report<br />
(1) X An Original<br />
(Mo, Da, Yr)<br />
(2) A Resubmission<br />
04/08/2011<br />
PURCHASED POWER (Account 555)<br />
(Including power exchanges)<br />
Year/Period of Report<br />
End of <strong>2010</strong>/Q4<br />
1. Report all power purchases made during the year. Also report exchanges of electricity (i.e., transactions involving a balancing of<br />
debits <strong>and</strong> credits for energy, capacity, etc.) <strong>and</strong> any settlements for imbalanced exchanges.<br />
2. Enter the name of the seller or other party in an exchange transaction in column (a). Do not abbreviate or truncate the name or use<br />
acronyms. Explain in a footnote any ownership interest or affiliation the respondent has with the seller.<br />
3. In column (b), enter a Statistical Classification Code based on the original contractual terms <strong>and</strong> conditions of the service as follows:<br />
RQ - for requirements service. Requirements service is service which the supplier plans to provide on an ongoing basis (i.e., the<br />
supplier includes projects load for this service in its system resource planning). In addition, the reliability of requirement service must<br />
be the same as, or second only to, the supplier’s service to its own ultimate consumers.<br />
LF - for long-term firm service. "Long-term" means five years or longer <strong>and</strong> "firm" means that service cannot be interrupted for<br />
economic reasons <strong>and</strong> is intended to remain reliable even under adverse conditions (e.g., the supplier must attempt to buy emergency<br />
energy from third parties to maintain deliveries of LF service). This category should not be used for long-term firm service firm service<br />
which meets the definition of RQ service. For all transaction identified as LF, provide in a footnote the termination date of the contract<br />
defined as the earliest date that either buyer or seller can unilaterally get out of the contract.<br />
IF - for intermediate-term firm service. The same as LF service expect that "intermediate-term" means longer than one year but less<br />
than five years.<br />
SF - for short-term service. Use this category for all firm services, where the duration of each period of commitment for service is one<br />
year or less.<br />
LU - for long-term service from a designated generating unit. "Long-term" means five years or longer. The availability <strong>and</strong> reliability of<br />
service, aside from transmission constraints, must match the availability <strong>and</strong> reliability of the designated unit.<br />
IU - for intermediate-term service from a designated generating unit. The same as LU service expect that "intermediate-term" means<br />
longer than one year but less than five years.<br />
EX - For exchanges of electricity. Use this category for transactions involving a balancing of debits <strong>and</strong> credits for energy, capacity, etc.<br />
<strong>and</strong> any settlements for imbalanced exchanges.<br />
OS - for other service. Use this category only for those services which cannot be placed in the above-defined categories, such as all<br />
non-firm service regardless of the Length of the contract <strong>and</strong> service from designated units of Less than one year. Describe the nature<br />
of the service in a footnote for each adjustment.<br />
Line<br />
No.<br />
Name of <strong>Company</strong> or Public Authority<br />
(Footnote Affiliations)<br />
(a)<br />
Statistical<br />
Classification<br />
(b)<br />
<strong>FERC</strong> Rate<br />
Schedule or<br />
Tariff Number<br />
(c)<br />
Average<br />
Monthly Billing<br />
Dem<strong>and</strong> (MW)<br />
(d)<br />
Actual Dem<strong>and</strong> (MW)<br />
Average<br />
Average<br />
Monthly NCP Dem<strong>and</strong> Monthly CP Dem<strong>and</strong><br />
(e)<br />
(f)<br />
1<br />
BROWNS VALLEY IRRIGATION DISTRICT<br />
LU<br />
N/A<br />
0.4395<br />
N/A<br />
2<br />
CALAVERAS YUBA HYDRO #1<br />
LU<br />
N/A<br />
0.051003083<br />
N/A<br />
3<br />
CALAVERAS YUBA HYDRO #2<br />
LU<br />
N/A<br />
0.047900167<br />
N/A<br />
4<br />
CALAVERAS YUBA HYDRO #3<br />
LU<br />
N/A<br />
0.02676675<br />
N/A<br />
5<br />
CANAL CREEK POWER PLANT (RETA)<br />
LU<br />
N/A<br />
0.30625<br />
N/A<br />
6<br />
CHARCOAL RAVINE<br />
LU<br />
N/A<br />
0.00512025<br />
N/A<br />
7<br />
CITY OF WATSONVILLE<br />
LU<br />
N/A<br />
0.09575<br />
N/A<br />
8<br />
COVANTA POWER PACIFIC, STOCKTON<br />
LU<br />
N/A<br />
0.766916667<br />
N/A<br />
9<br />
DAVID O. HARDE<br />
LU<br />
N/A<br />
0.0011655<br />
N/A<br />
10<br />
DIGGER CREEK RANCH<br />
LU<br />
N/A<br />
0.4535<br />
N/A<br />
11<br />
DONALD R. CHENOWETH<br />
LU<br />
N/A<br />
0.000188417<br />
N/A<br />
12<br />
E J M MCFADDEN<br />
LU<br />
N/A<br />
0.0895<br />
N/A<br />
13<br />
EAGLE HYDRO<br />
LU<br />
N/A<br />
0.446166667<br />
N/A<br />
14<br />
ERIC AND DEBBIE WATTENBURG<br />
LU<br />
N/A<br />
0.060166667<br />
N/A<br />
Total<br />
<strong>FERC</strong> FORM NO. 1 (ED. 12-90) Page 326.14
Name of Respondent<br />
PACIFIC GAS AND ELECTRIC COMPANY<br />
This Report Is:<br />
Date of Report<br />
(1) X An Original<br />
(Mo, Da, Yr)<br />
(2) A Resubmission<br />
04/08/2011<br />
PURCHASED POWER (Account 555)<br />
(Including power exchanges)<br />
Year/Period of Report<br />
End of <strong>2010</strong>/Q4<br />
1. Report all power purchases made during the year. Also report exchanges of electricity (i.e., transactions involving a balancing of<br />
debits <strong>and</strong> credits for energy, capacity, etc.) <strong>and</strong> any settlements for imbalanced exchanges.<br />
2. Enter the name of the seller or other party in an exchange transaction in column (a). Do not abbreviate or truncate the name or use<br />
acronyms. Explain in a footnote any ownership interest or affiliation the respondent has with the seller.<br />
3. In column (b), enter a Statistical Classification Code based on the original contractual terms <strong>and</strong> conditions of the service as follows:<br />
RQ - for requirements service. Requirements service is service which the supplier plans to provide on an ongoing basis (i.e., the<br />
supplier includes projects load for this service in its system resource planning). In addition, the reliability of requirement service must<br />
be the same as, or second only to, the supplier’s service to its own ultimate consumers.<br />
LF - for long-term firm service. "Long-term" means five years or longer <strong>and</strong> "firm" means that service cannot be interrupted for<br />
economic reasons <strong>and</strong> is intended to remain reliable even under adverse conditions (e.g., the supplier must attempt to buy emergency<br />
energy from third parties to maintain deliveries of LF service). This category should not be used for long-term firm service firm service<br />
which meets the definition of RQ service. For all transaction identified as LF, provide in a footnote the termination date of the contract<br />
defined as the earliest date that either buyer or seller can unilaterally get out of the contract.<br />
IF - for intermediate-term firm service. The same as LF service expect that "intermediate-term" means longer than one year but less<br />
than five years.<br />
SF - for short-term service. Use this category for all firm services, where the duration of each period of commitment for service is one<br />
year or less.<br />
LU - for long-term service from a designated generating unit. "Long-term" means five years or longer. The availability <strong>and</strong> reliability of<br />
service, aside from transmission constraints, must match the availability <strong>and</strong> reliability of the designated unit.<br />
IU - for intermediate-term service from a designated generating unit. The same as LU service expect that "intermediate-term" means<br />
longer than one year but less than five years.<br />
EX - For exchanges of electricity. Use this category for transactions involving a balancing of debits <strong>and</strong> credits for energy, capacity, etc.<br />
<strong>and</strong> any settlements for imbalanced exchanges.<br />
OS - for other service. Use this category only for those services which cannot be placed in the above-defined categories, such as all<br />
non-firm service regardless of the Length of the contract <strong>and</strong> service from designated units of Less than one year. Describe the nature<br />
of the service in a footnote for each adjustment.<br />
Line<br />
No.<br />
Name of <strong>Company</strong> or Public Authority<br />
(Footnote Affiliations)<br />
(a)<br />
Statistical<br />
Classification<br />
(b)<br />
<strong>FERC</strong> Rate<br />
Schedule or<br />
Tariff Number<br />
(c)<br />
Average<br />
Monthly Billing<br />
Dem<strong>and</strong> (MW)<br />
(d)<br />
Actual Dem<strong>and</strong> (MW)<br />
Average<br />
Average<br />
Monthly NCP Dem<strong>and</strong> Monthly CP Dem<strong>and</strong><br />
(e)<br />
(f)<br />
1<br />
FAIRFIELD POWER PLANT (PAPAZIAN)<br />
LU<br />
N/A<br />
0.425666667<br />
N/A<br />
2<br />
FAR WEST POWER CORPORATION<br />
LU<br />
N/A<br />
0.058636667<br />
N/A<br />
3<br />
FIVE BEARS HYDROELECTRIC<br />
LU<br />
N/A<br />
0.14525<br />
N/A<br />
4<br />
GAS RECOVERY SYSTEMS, INC [SANTA<br />
LU<br />
0.632<br />
0<br />
N/A<br />
5<br />
HAT CREEK HEREFORD RANCH<br />
LU<br />
N/A<br />
0.038101333<br />
N/A<br />
6<br />
HENWOOD ASSOCIATES<br />
LU<br />
N/A<br />
0.386083333<br />
N/A<br />
7<br />
JACKSON VALLEY IRRIGATION DIST<br />
LU<br />
N/A<br />
0.079166667<br />
N/A<br />
8<br />
JAMES B. PETER<br />
LU<br />
N/A<br />
0.016568333<br />
N/A<br />
9<br />
JAMES CRANE HYDRO<br />
LU<br />
N/A<br />
0.00111225<br />
N/A<br />
10<br />
JOHN NEERHOUT JR.<br />
LU<br />
N/A<br />
0.015545<br />
N/A<br />
11<br />
KAREN RIPPEY<br />
LU<br />
N/A<br />
0<br />
N/A<br />
12<br />
KINGS RIVER HYDRO CO.<br />
LU<br />
N/A<br />
0.298666667<br />
N/A<br />
13<br />
L.P. REINHARD<br />
LU<br />
N/A<br />
0<br />
N/A<br />
14<br />
LANGERWERF DAIRY<br />
LU<br />
N/A<br />
0.043416667<br />
N/A<br />
Total<br />
<strong>FERC</strong> FORM NO. 1 (ED. 12-90) Page 326.15
Name of Respondent<br />
PACIFIC GAS AND ELECTRIC COMPANY<br />
This Report Is:<br />
Date of Report<br />
(1) X An Original<br />
(Mo, Da, Yr)<br />
(2) A Resubmission<br />
04/08/2011<br />
PURCHASED POWER (Account 555)<br />
(Including power exchanges)<br />
Year/Period of Report<br />
End of <strong>2010</strong>/Q4<br />
1. Report all power purchases made during the year. Also report exchanges of electricity (i.e., transactions involving a balancing of<br />
debits <strong>and</strong> credits for energy, capacity, etc.) <strong>and</strong> any settlements for imbalanced exchanges.<br />
2. Enter the name of the seller or other party in an exchange transaction in column (a). Do not abbreviate or truncate the name or use<br />
acronyms. Explain in a footnote any ownership interest or affiliation the respondent has with the seller.<br />
3. In column (b), enter a Statistical Classification Code based on the original contractual terms <strong>and</strong> conditions of the service as follows:<br />
RQ - for requirements service. Requirements service is service which the supplier plans to provide on an ongoing basis (i.e., the<br />
supplier includes projects load for this service in its system resource planning). In addition, the reliability of requirement service must<br />
be the same as, or second only to, the supplier’s service to its own ultimate consumers.<br />
LF - for long-term firm service. "Long-term" means five years or longer <strong>and</strong> "firm" means that service cannot be interrupted for<br />
economic reasons <strong>and</strong> is intended to remain reliable even under adverse conditions (e.g., the supplier must attempt to buy emergency<br />
energy from third parties to maintain deliveries of LF service). This category should not be used for long-term firm service firm service<br />
which meets the definition of RQ service. For all transaction identified as LF, provide in a footnote the termination date of the contract<br />
defined as the earliest date that either buyer or seller can unilaterally get out of the contract.<br />
IF - for intermediate-term firm service. The same as LF service expect that "intermediate-term" means longer than one year but less<br />
than five years.<br />
SF - for short-term service. Use this category for all firm services, where the duration of each period of commitment for service is one<br />
year or less.<br />
LU - for long-term service from a designated generating unit. "Long-term" means five years or longer. The availability <strong>and</strong> reliability of<br />
service, aside from transmission constraints, must match the availability <strong>and</strong> reliability of the designated unit.<br />
IU - for intermediate-term service from a designated generating unit. The same as LU service expect that "intermediate-term" means<br />
longer than one year but less than five years.<br />
EX - For exchanges of electricity. Use this category for transactions involving a balancing of debits <strong>and</strong> credits for energy, capacity, etc.<br />
<strong>and</strong> any settlements for imbalanced exchanges.<br />
OS - for other service. Use this category only for those services which cannot be placed in the above-defined categories, such as all<br />
non-firm service regardless of the Length of the contract <strong>and</strong> service from designated units of Less than one year. Describe the nature<br />
of the service in a footnote for each adjustment.<br />
Line<br />
No.<br />
Name of <strong>Company</strong> or Public Authority<br />
(Footnote Affiliations)<br />
(a)<br />
Statistical<br />
Classification<br />
(b)<br />
<strong>FERC</strong> Rate<br />
Schedule or<br />
Tariff Number<br />
(c)<br />
Average<br />
Monthly Billing<br />
Dem<strong>and</strong> (MW)<br />
(d)<br />
Actual Dem<strong>and</strong> (MW)<br />
Average<br />
Average<br />
Monthly NCP Dem<strong>and</strong> Monthly CP Dem<strong>and</strong><br />
(e)<br />
(f)<br />
1<br />
LASSEN STATION HYDRO<br />
LU<br />
N/A<br />
0.785083333<br />
N/A<br />
2<br />
LOFTON RANCH<br />
LU<br />
N/A<br />
0.085<br />
N/A<br />
3<br />
MADERA CANAL (1174 + 84)<br />
LU<br />
N/A<br />
0.291305<br />
N/A<br />
4<br />
MADERA CANAL (1923)<br />
LU<br />
N/A<br />
0.412743333<br />
N/A<br />
5<br />
MADERA CANAL STATION 1302<br />
LU<br />
N/A<br />
0.14553<br />
N/A<br />
6<br />
MEGA HYDRO #1 (CLOVER CREEK)<br />
LU<br />
N/A<br />
0.69825<br />
N/A<br />
7<br />
MEGA HYDRO (GOOSE VALLEY RANCH)<br />
LU<br />
N/A<br />
0.06825<br />
N/A<br />
8<br />
MEGA RENEWABLES (SILVER SPRINGS)<br />
LU<br />
N/A<br />
0.2485<br />
N/A<br />
9<br />
MICHAEL W. STEPHENS<br />
LU<br />
N/A<br />
0<br />
N/A<br />
10<br />
MILL & SULPHUR CREEK<br />
LU<br />
N/A<br />
0.701666667<br />
N/A<br />
11<br />
NID/SCOTTS FLAT<br />
LU<br />
N/A<br />
0.600416667<br />
N/A<br />
12<br />
ORANGE COVE IRRIGATION DIST.<br />
LU<br />
N/A<br />
0.416916667<br />
N/A<br />
13<br />
PAN PACIFIC (WEBER FLAT)<br />
LU<br />
N/A<br />
0<br />
N/A<br />
14<br />
PLACER COUNTY WATER AGENCY<br />
LU<br />
N/A<br />
0.329959667<br />
N/A<br />
Total<br />
<strong>FERC</strong> FORM NO. 1 (ED. 12-90) Page 326.16
Name of Respondent<br />
PACIFIC GAS AND ELECTRIC COMPANY<br />
This Report Is:<br />
Date of Report<br />
(1) X An Original<br />
(Mo, Da, Yr)<br />
(2) A Resubmission<br />
04/08/2011<br />
PURCHASED POWER (Account 555)<br />
(Including power exchanges)<br />
Year/Period of Report<br />
End of <strong>2010</strong>/Q4<br />
1. Report all power purchases made during the year. Also report exchanges of electricity (i.e., transactions involving a balancing of<br />
debits <strong>and</strong> credits for energy, capacity, etc.) <strong>and</strong> any settlements for imbalanced exchanges.<br />
2. Enter the name of the seller or other party in an exchange transaction in column (a). Do not abbreviate or truncate the name or use<br />
acronyms. Explain in a footnote any ownership interest or affiliation the respondent has with the seller.<br />
3. In column (b), enter a Statistical Classification Code based on the original contractual terms <strong>and</strong> conditions of the service as follows:<br />
RQ - for requirements service. Requirements service is service which the supplier plans to provide on an ongoing basis (i.e., the<br />
supplier includes projects load for this service in its system resource planning). In addition, the reliability of requirement service must<br />
be the same as, or second only to, the supplier’s service to its own ultimate consumers.<br />
LF - for long-term firm service. "Long-term" means five years or longer <strong>and</strong> "firm" means that service cannot be interrupted for<br />
economic reasons <strong>and</strong> is intended to remain reliable even under adverse conditions (e.g., the supplier must attempt to buy emergency<br />
energy from third parties to maintain deliveries of LF service). This category should not be used for long-term firm service firm service<br />
which meets the definition of RQ service. For all transaction identified as LF, provide in a footnote the termination date of the contract<br />
defined as the earliest date that either buyer or seller can unilaterally get out of the contract.<br />
IF - for intermediate-term firm service. The same as LF service expect that "intermediate-term" means longer than one year but less<br />
than five years.<br />
SF - for short-term service. Use this category for all firm services, where the duration of each period of commitment for service is one<br />
year or less.<br />
LU - for long-term service from a designated generating unit. "Long-term" means five years or longer. The availability <strong>and</strong> reliability of<br />
service, aside from transmission constraints, must match the availability <strong>and</strong> reliability of the designated unit.<br />
IU - for intermediate-term service from a designated generating unit. The same as LU service expect that "intermediate-term" means<br />
longer than one year but less than five years.<br />
EX - For exchanges of electricity. Use this category for transactions involving a balancing of debits <strong>and</strong> credits for energy, capacity, etc.<br />
<strong>and</strong> any settlements for imbalanced exchanges.<br />
OS - for other service. Use this category only for those services which cannot be placed in the above-defined categories, such as all<br />
non-firm service regardless of the Length of the contract <strong>and</strong> service from designated units of Less than one year. Describe the nature<br />
of the service in a footnote for each adjustment.<br />
Line<br />
No.<br />
Name of <strong>Company</strong> or Public Authority<br />
(Footnote Affiliations)<br />
(a)<br />
Statistical<br />
Classification<br />
(b)<br />
<strong>FERC</strong> Rate<br />
Schedule or<br />
Tariff Number<br />
(c)<br />
Average<br />
Monthly Billing<br />
Dem<strong>and</strong> (MW)<br />
(d)<br />
Actual Dem<strong>and</strong> (MW)<br />
Average<br />
Average<br />
Monthly NCP Dem<strong>and</strong> Monthly CP Dem<strong>and</strong><br />
(e)<br />
(f)<br />
1<br />
REAL GOODS TRADING CORP.<br />
LU<br />
N/A<br />
0<br />
N/A<br />
2<br />
ROBERT AND JOYCE VIEUX<br />
LU<br />
N/A<br />
0<br />
N/A<br />
3<br />
ROBERT W. LEE<br />
LU<br />
N/A<br />
0<br />
N/A<br />
4<br />
ROBIN WILLIAMS SOLAR POWER GEN<br />
LU<br />
N/A<br />
0.000249833<br />
N/A<br />
5<br />
ROCK CREEK WATER DISTRICT<br />
LU<br />
N/A<br />
0.1845<br />
N/A<br />
6<br />
SANTA CLARA VALLEY WATER DIST.<br />
LU<br />
0.8<br />
0.054166667<br />
N/A<br />
7<br />
SCHAADS HYDRO<br />
LU<br />
N/A<br />
0.155916667<br />
N/A<br />
8<br />
SHAMROCK UTILITIES (CEDAR FLAT)<br />
LU<br />
N/A<br />
0.263333333<br />
N/A<br />
9<br />
SHAMROCK UTILITIES (CLOVER LEAF)<br />
LU<br />
N/A<br />
0.131916667<br />
N/A<br />
10<br />
SHEILA ST. GERMAIN<br />
LU<br />
N/A<br />
0<br />
N/A<br />
11<br />
SIERRA ENERGY<br />
LU<br />
N/A<br />
0.077333333<br />
N/A<br />
12<br />
SNOW MOUNTAIN HYDRO LLC (LOST<br />
LU<br />
N/A<br />
0.399128167<br />
N/A<br />
13<br />
SOUTH SUTTER WATER<br />
LU<br />
N/A<br />
0.093166667<br />
N/A<br />
14<br />
STEVE & BONNIE TETRICK<br />
LU<br />
N/A<br />
0.0000075<br />
N/A<br />
Total<br />
<strong>FERC</strong> FORM NO. 1 (ED. 12-90) Page 326.17
Name of Respondent<br />
PACIFIC GAS AND ELECTRIC COMPANY<br />
This Report Is:<br />
Date of Report<br />
(1) X An Original<br />
(Mo, Da, Yr)<br />
(2) A Resubmission<br />
04/08/2011<br />
PURCHASED POWER (Account 555)<br />
(Including power exchanges)<br />
Year/Period of Report<br />
End of <strong>2010</strong>/Q4<br />
1. Report all power purchases made during the year. Also report exchanges of electricity (i.e., transactions involving a balancing of<br />
debits <strong>and</strong> credits for energy, capacity, etc.) <strong>and</strong> any settlements for imbalanced exchanges.<br />
2. Enter the name of the seller or other party in an exchange transaction in column (a). Do not abbreviate or truncate the name or use<br />
acronyms. Explain in a footnote any ownership interest or affiliation the respondent has with the seller.<br />
3. In column (b), enter a Statistical Classification Code based on the original contractual terms <strong>and</strong> conditions of the service as follows:<br />
RQ - for requirements service. Requirements service is service which the supplier plans to provide on an ongoing basis (i.e., the<br />
supplier includes projects load for this service in its system resource planning). In addition, the reliability of requirement service must<br />
be the same as, or second only to, the supplier’s service to its own ultimate consumers.<br />
LF - for long-term firm service. "Long-term" means five years or longer <strong>and</strong> "firm" means that service cannot be interrupted for<br />
economic reasons <strong>and</strong> is intended to remain reliable even under adverse conditions (e.g., the supplier must attempt to buy emergency<br />
energy from third parties to maintain deliveries of LF service). This category should not be used for long-term firm service firm service<br />
which meets the definition of RQ service. For all transaction identified as LF, provide in a footnote the termination date of the contract<br />
defined as the earliest date that either buyer or seller can unilaterally get out of the contract.<br />
IF - for intermediate-term firm service. The same as LF service expect that "intermediate-term" means longer than one year but less<br />
than five years.<br />
SF - for short-term service. Use this category for all firm services, where the duration of each period of commitment for service is one<br />
year or less.<br />
LU - for long-term service from a designated generating unit. "Long-term" means five years or longer. The availability <strong>and</strong> reliability of<br />
service, aside from transmission constraints, must match the availability <strong>and</strong> reliability of the designated unit.<br />
IU - for intermediate-term service from a designated generating unit. The same as LU service expect that "intermediate-term" means<br />
longer than one year but less than five years.<br />
EX - For exchanges of electricity. Use this category for transactions involving a balancing of debits <strong>and</strong> credits for energy, capacity, etc.<br />
<strong>and</strong> any settlements for imbalanced exchanges.<br />
OS - for other service. Use this category only for those services which cannot be placed in the above-defined categories, such as all<br />
non-firm service regardless of the Length of the contract <strong>and</strong> service from designated units of Less than one year. Describe the nature<br />
of the service in a footnote for each adjustment.<br />
Line<br />
No.<br />
Name of <strong>Company</strong> or Public Authority<br />
(Footnote Affiliations)<br />
(a)<br />
Statistical<br />
Classification<br />
(b)<br />
<strong>FERC</strong> Rate<br />
Schedule or<br />
Tariff Number<br />
(c)<br />
Average<br />
Monthly Billing<br />
Dem<strong>and</strong> (MW)<br />
(d)<br />
Actual Dem<strong>and</strong> (MW)<br />
Average<br />
Average<br />
Monthly NCP Dem<strong>and</strong> Monthly CP Dem<strong>and</strong><br />
(e)<br />
(f)<br />
1<br />
STEVEN SPELLENBERG HYDRO<br />
LU<br />
N/A<br />
0<br />
N/A<br />
2<br />
SUTTER'S MILL<br />
LU<br />
N/A<br />
0.096448333<br />
N/A<br />
3<br />
SWISS AMERICA<br />
LU<br />
N/A<br />
0.0261555<br />
N/A<br />
4<br />
TOM BENNINGHOVEN<br />
LU<br />
N/A<br />
0.01383525<br />
N/A<br />
5<br />
VECINO VINEYARDS LLC<br />
LU<br />
N/A<br />
0.036416667<br />
N/A<br />
6<br />
WATER WHEEL RANCH<br />
LU<br />
N/A<br />
0.615916667<br />
N/A<br />
7<br />
WENDEL ENERGY OPERATIONS 1,LLC<br />
LU<br />
0.213<br />
0.71575<br />
N/A<br />
8<br />
WRIGHT RANCH HYDROELECTRIC<br />
LU<br />
N/A<br />
0.005282333<br />
N/A<br />
9<br />
YOUTH WITH A MISSION/SPRINGS OF<br />
LU<br />
N/A<br />
0.079666667<br />
N/A<br />
10<br />
YUBA COUNTY WATER AGENCY<br />
0.13<br />
0.135485<br />
N/A<br />
11<br />
SMALL POWER PRODUCERS - THERMAL<br />
12<br />
1080 CHESTNUT CORP. LU<br />
N/A<br />
0.00036325<br />
N/A<br />
13<br />
AIRPORT CLUB<br />
LU<br />
N/A<br />
0<br />
N/A<br />
14<br />
ARDEN WOOD BENEVOLENT ASSOC.<br />
LU<br />
N/A<br />
0.000240917<br />
N/A<br />
Total<br />
<strong>FERC</strong> FORM NO. 1 (ED. 12-90) Page 326.18
Name of Respondent<br />
PACIFIC GAS AND ELECTRIC COMPANY<br />
This Report Is:<br />
Date of Report<br />
(1) X An Original<br />
(Mo, Da, Yr)<br />
(2) A Resubmission<br />
04/08/2011<br />
PURCHASED POWER (Account 555)<br />
(Including power exchanges)<br />
Year/Period of Report<br />
End of <strong>2010</strong>/Q4<br />
1. Report all power purchases made during the year. Also report exchanges of electricity (i.e., transactions involving a balancing of<br />
debits <strong>and</strong> credits for energy, capacity, etc.) <strong>and</strong> any settlements for imbalanced exchanges.<br />
2. Enter the name of the seller or other party in an exchange transaction in column (a). Do not abbreviate or truncate the name or use<br />
acronyms. Explain in a footnote any ownership interest or affiliation the respondent has with the seller.<br />
3. In column (b), enter a Statistical Classification Code based on the original contractual terms <strong>and</strong> conditions of the service as follows:<br />
RQ - for requirements service. Requirements service is service which the supplier plans to provide on an ongoing basis (i.e., the<br />
supplier includes projects load for this service in its system resource planning). In addition, the reliability of requirement service must<br />
be the same as, or second only to, the supplier’s service to its own ultimate consumers.<br />
LF - for long-term firm service. "Long-term" means five years or longer <strong>and</strong> "firm" means that service cannot be interrupted for<br />
economic reasons <strong>and</strong> is intended to remain reliable even under adverse conditions (e.g., the supplier must attempt to buy emergency<br />
energy from third parties to maintain deliveries of LF service). This category should not be used for long-term firm service firm service<br />
which meets the definition of RQ service. For all transaction identified as LF, provide in a footnote the termination date of the contract<br />
defined as the earliest date that either buyer or seller can unilaterally get out of the contract.<br />
IF - for intermediate-term firm service. The same as LF service expect that "intermediate-term" means longer than one year but less<br />
than five years.<br />
SF - for short-term service. Use this category for all firm services, where the duration of each period of commitment for service is one<br />
year or less.<br />
LU - for long-term service from a designated generating unit. "Long-term" means five years or longer. The availability <strong>and</strong> reliability of<br />
service, aside from transmission constraints, must match the availability <strong>and</strong> reliability of the designated unit.<br />
IU - for intermediate-term service from a designated generating unit. The same as LU service expect that "intermediate-term" means<br />
longer than one year but less than five years.<br />
EX - For exchanges of electricity. Use this category for transactions involving a balancing of debits <strong>and</strong> credits for energy, capacity, etc.<br />
<strong>and</strong> any settlements for imbalanced exchanges.<br />
OS - for other service. Use this category only for those services which cannot be placed in the above-defined categories, such as all<br />
non-firm service regardless of the Length of the contract <strong>and</strong> service from designated units of Less than one year. Describe the nature<br />
of the service in a footnote for each adjustment.<br />
Line<br />
No.<br />
Name of <strong>Company</strong> or Public Authority<br />
(Footnote Affiliations)<br />
(a)<br />
Statistical<br />
Classification<br />
(b)<br />
<strong>FERC</strong> Rate<br />
Schedule or<br />
Tariff Number<br />
(c)<br />
Average<br />
Monthly Billing<br />
Dem<strong>and</strong> (MW)<br />
(d)<br />
Actual Dem<strong>and</strong> (MW)<br />
Average<br />
Average<br />
Monthly NCP Dem<strong>and</strong> Monthly CP Dem<strong>and</strong><br />
(e)<br />
(f)<br />
1<br />
CITY OF FAIRFIELD<br />
LU<br />
N/A<br />
0.050916667<br />
N/A<br />
2<br />
CITY OF MILPITAS<br />
LU<br />
N/A<br />
0.02207925<br />
N/A<br />
3<br />
GREATER VALLEJO RECREATION<br />
LU<br />
N/A<br />
0.005450417<br />
N/A<br />
4<br />
COUNTY OF SANTA CRUZ ( WATER ST.<br />
LU<br />
N/A<br />
0.005833333<br />
N/A<br />
5<br />
DOLE ENTERPRISES, INC<br />
LU<br />
N/A<br />
0.029831083<br />
N/A<br />
6<br />
HAYWARD AREA REC & PARK DIST.<br />
LU<br />
N/A<br />
0.038901417<br />
N/A<br />
7<br />
NIHONMACHI TERRACE<br />
LU<br />
N/A<br />
0<br />
N/A<br />
8<br />
OCCIDENTAL OF ELK HILLS<br />
LU<br />
N/A<br />
0<br />
N/A<br />
9<br />
ORINDA SENIOR VILLAGE<br />
LU<br />
N/A<br />
0.001901667<br />
N/A<br />
10<br />
RED BLUFF UNION HIGH SCHOOL<br />
LU<br />
N/A<br />
0<br />
N/A<br />
11<br />
SATELLITE SENIOR HOMES<br />
LU<br />
N/A<br />
0.000583333<br />
N/A<br />
12<br />
STANFORD ENERGY GROUP<br />
LU<br />
N/A<br />
0<br />
N/A<br />
13<br />
UCSC PHYSICAL PLANT<br />
LU<br />
N/A<br />
0<br />
N/A<br />
14<br />
YOUNG RADIO INC.<br />
LU<br />
N/A<br />
0<br />
N/A<br />
Total<br />
<strong>FERC</strong> FORM NO. 1 (ED. 12-90) Page 326.19
Name of Respondent<br />
PACIFIC GAS AND ELECTRIC COMPANY<br />
This Report Is:<br />
Date of Report<br />
(1) X An Original<br />
(Mo, Da, Yr)<br />
(2) A Resubmission<br />
04/08/2011<br />
PURCHASED POWER (Account 555)<br />
(Including power exchanges)<br />
Year/Period of Report<br />
End of <strong>2010</strong>/Q4<br />
1. Report all power purchases made during the year. Also report exchanges of electricity (i.e., transactions involving a balancing of<br />
debits <strong>and</strong> credits for energy, capacity, etc.) <strong>and</strong> any settlements for imbalanced exchanges.<br />
2. Enter the name of the seller or other party in an exchange transaction in column (a). Do not abbreviate or truncate the name or use<br />
acronyms. Explain in a footnote any ownership interest or affiliation the respondent has with the seller.<br />
3. In column (b), enter a Statistical Classification Code based on the original contractual terms <strong>and</strong> conditions of the service as follows:<br />
RQ - for requirements service. Requirements service is service which the supplier plans to provide on an ongoing basis (i.e., the<br />
supplier includes projects load for this service in its system resource planning). In addition, the reliability of requirement service must<br />
be the same as, or second only to, the supplier’s service to its own ultimate consumers.<br />
LF - for long-term firm service. "Long-term" means five years or longer <strong>and</strong> "firm" means that service cannot be interrupted for<br />
economic reasons <strong>and</strong> is intended to remain reliable even under adverse conditions (e.g., the supplier must attempt to buy emergency<br />
energy from third parties to maintain deliveries of LF service). This category should not be used for long-term firm service firm service<br />
which meets the definition of RQ service. For all transaction identified as LF, provide in a footnote the termination date of the contract<br />
defined as the earliest date that either buyer or seller can unilaterally get out of the contract.<br />
IF - for intermediate-term firm service. The same as LF service expect that "intermediate-term" means longer than one year but less<br />
than five years.<br />
SF - for short-term service. Use this category for all firm services, where the duration of each period of commitment for service is one<br />
year or less.<br />
LU - for long-term service from a designated generating unit. "Long-term" means five years or longer. The availability <strong>and</strong> reliability of<br />
service, aside from transmission constraints, must match the availability <strong>and</strong> reliability of the designated unit.<br />
IU - for intermediate-term service from a designated generating unit. The same as LU service expect that "intermediate-term" means<br />
longer than one year but less than five years.<br />
EX - For exchanges of electricity. Use this category for transactions involving a balancing of debits <strong>and</strong> credits for energy, capacity, etc.<br />
<strong>and</strong> any settlements for imbalanced exchanges.<br />
OS - for other service. Use this category only for those services which cannot be placed in the above-defined categories, such as all<br />
non-firm service regardless of the Length of the contract <strong>and</strong> service from designated units of Less than one year. Describe the nature<br />
of the service in a footnote for each adjustment.<br />
Line<br />
No.<br />
Name of <strong>Company</strong> or Public Authority<br />
(Footnote Affiliations)<br />
(a)<br />
Statistical<br />
Classification<br />
(b)<br />
<strong>FERC</strong> Rate<br />
Schedule or<br />
Tariff Number<br />
(c)<br />
Average<br />
Monthly Billing<br />
Dem<strong>and</strong> (MW)<br />
(d)<br />
Actual Dem<strong>and</strong> (MW)<br />
Average<br />
Average<br />
Monthly NCP Dem<strong>and</strong> Monthly CP Dem<strong>and</strong><br />
(e)<br />
(f)<br />
1<br />
YUBA CITY RACQUET CLUB<br />
LU<br />
N/A<br />
0.010976<br />
N/A<br />
2<br />
BILATERAL CONTRACTS:<br />
3<br />
- RENEWABLE CONTRACTS<br />
4<br />
NEVADA IRRIGATION DISTRICT NORTH OS 6<br />
N/A<br />
N/A<br />
N/A<br />
5<br />
SEMPRA EL DORADO SOLAR IMPORT OS 6<br />
N/A<br />
N/A<br />
N/A<br />
6<br />
NEVADA IRRIGATION DISTRICT SOUTH OS 6<br />
N/A<br />
N/A<br />
N/A<br />
7<br />
ETIWANDA POWER PLANT OS 6<br />
N/A<br />
N/A<br />
N/A<br />
8<br />
WOODLAND BIOMASS OS 6<br />
N/A<br />
N/A<br />
N/A<br />
9<br />
BIG CREEK WATER WORKS, LTD. OS 6<br />
N/A<br />
N/A<br />
N/A<br />
10<br />
BONNEVILLE POWER ADMINSTRATION OS 6<br />
N/A<br />
N/A<br />
N/A<br />
11<br />
NEVADA IRRIGATION DISTRICT SCOTTS OS 6<br />
N/A<br />
N/A<br />
N/A<br />
12<br />
EL DORADO IRRIGATION OS 6<br />
N/A<br />
N/A<br />
N/A<br />
13<br />
SOUTH FEATHER WATER AND POWER OS 6<br />
N/A<br />
N/A<br />
N/A<br />
14<br />
SHELL ENERGY OS 6<br />
N/A<br />
N/A<br />
N/A<br />
Total<br />
<strong>FERC</strong> FORM NO. 1 (ED. 12-90) Page 326.20
Name of Respondent<br />
PACIFIC GAS AND ELECTRIC COMPANY<br />
This Report Is:<br />
Date of Report<br />
(1) X An Original<br />
(Mo, Da, Yr)<br />
(2) A Resubmission<br />
04/08/2011<br />
PURCHASED POWER (Account 555)<br />
(Including power exchanges)<br />
Year/Period of Report<br />
End of <strong>2010</strong>/Q4<br />
1. Report all power purchases made during the year. Also report exchanges of electricity (i.e., transactions involving a balancing of<br />
debits <strong>and</strong> credits for energy, capacity, etc.) <strong>and</strong> any settlements for imbalanced exchanges.<br />
2. Enter the name of the seller or other party in an exchange transaction in column (a). Do not abbreviate or truncate the name or use<br />
acronyms. Explain in a footnote any ownership interest or affiliation the respondent has with the seller.<br />
3. In column (b), enter a Statistical Classification Code based on the original contractual terms <strong>and</strong> conditions of the service as follows:<br />
RQ - for requirements service. Requirements service is service which the supplier plans to provide on an ongoing basis (i.e., the<br />
supplier includes projects load for this service in its system resource planning). In addition, the reliability of requirement service must<br />
be the same as, or second only to, the supplier’s service to its own ultimate consumers.<br />
LF - for long-term firm service. "Long-term" means five years or longer <strong>and</strong> "firm" means that service cannot be interrupted for<br />
economic reasons <strong>and</strong> is intended to remain reliable even under adverse conditions (e.g., the supplier must attempt to buy emergency<br />
energy from third parties to maintain deliveries of LF service). This category should not be used for long-term firm service firm service<br />
which meets the definition of RQ service. For all transaction identified as LF, provide in a footnote the termination date of the contract<br />
defined as the earliest date that either buyer or seller can unilaterally get out of the contract.<br />
IF - for intermediate-term firm service. The same as LF service expect that "intermediate-term" means longer than one year but less<br />
than five years.<br />
SF - for short-term service. Use this category for all firm services, where the duration of each period of commitment for service is one<br />
year or less.<br />
LU - for long-term service from a designated generating unit. "Long-term" means five years or longer. The availability <strong>and</strong> reliability of<br />
service, aside from transmission constraints, must match the availability <strong>and</strong> reliability of the designated unit.<br />
IU - for intermediate-term service from a designated generating unit. The same as LU service expect that "intermediate-term" means<br />
longer than one year but less than five years.<br />
EX - For exchanges of electricity. Use this category for transactions involving a balancing of debits <strong>and</strong> credits for energy, capacity, etc.<br />
<strong>and</strong> any settlements for imbalanced exchanges.<br />
OS - for other service. Use this category only for those services which cannot be placed in the above-defined categories, such as all<br />
non-firm service regardless of the Length of the contract <strong>and</strong> service from designated units of Less than one year. Describe the nature<br />
of the service in a footnote for each adjustment.<br />
Line<br />
No.<br />
Name of <strong>Company</strong> or Public Authority<br />
(Footnote Affiliations)<br />
(a)<br />
Statistical<br />
Classification<br />
(b)<br />
<strong>FERC</strong> Rate<br />
Schedule or<br />
Tariff Number<br />
(c)<br />
Average<br />
Monthly Billing<br />
Dem<strong>and</strong> (MW)<br />
(d)<br />
Actual Dem<strong>and</strong> (MW)<br />
Average<br />
Average<br />
Monthly NCP Dem<strong>and</strong> Monthly CP Dem<strong>and</strong><br />
(e)<br />
(f)<br />
1<br />
LOST CREEK OS 6<br />
N/A<br />
N/A<br />
N/A<br />
2<br />
WADHAM ENERGY LTD. PART. OS 6<br />
N/A<br />
N/A<br />
N/A<br />
3<br />
IBERDROLA RENEWABLES (AKA PPM OS 6<br />
N/A<br />
N/A<br />
N/A<br />
4<br />
PACIFICORP OS 6<br />
N/A<br />
N/A<br />
N/A<br />
5<br />
VANTAGE WIND (POWEREX S&F) OS 6<br />
N/A<br />
N/A<br />
N/A<br />
6<br />
COMMUNITY RENEWABLE ENERGY OS 6<br />
N/A<br />
N/A<br />
N/A<br />
7<br />
SIERRA POWER CORPORATION OS 6<br />
N/A<br />
N/A<br />
N/A<br />
8<br />
MADERA RENEWABLE OS 6<br />
N/A<br />
N/A<br />
N/A<br />
9<br />
FPLE DIABLO WINDS OS 6<br />
N/A<br />
N/A<br />
N/A<br />
10<br />
BARCLAYS-NINE CANYON CONFIRM OS 6<br />
N/A<br />
N/A<br />
N/A<br />
11<br />
BIG VALLEY POWER, LLC OS 6<br />
N/A<br />
N/A<br />
N/A<br />
12<br />
CASTELANELLI BROS. BIOGAS OS 6<br />
N/A<br />
N/A<br />
N/A<br />
13<br />
BUENA VISTA ENERGY, LLC OS 6<br />
N/A<br />
N/A<br />
N/A<br />
14<br />
BOTTLE ROCK OS 6<br />
N/A<br />
N/A<br />
N/A<br />
Total<br />
<strong>FERC</strong> FORM NO. 1 (ED. 12-90) Page 326.21
Name of Respondent<br />
PACIFIC GAS AND ELECTRIC COMPANY<br />
This Report Is:<br />
Date of Report<br />
(1) X An Original<br />
(Mo, Da, Yr)<br />
(2) A Resubmission<br />
04/08/2011<br />
PURCHASED POWER (Account 555)<br />
(Including power exchanges)<br />
Year/Period of Report<br />
End of <strong>2010</strong>/Q4<br />
1. Report all power purchases made during the year. Also report exchanges of electricity (i.e., transactions involving a balancing of<br />
debits <strong>and</strong> credits for energy, capacity, etc.) <strong>and</strong> any settlements for imbalanced exchanges.<br />
2. Enter the name of the seller or other party in an exchange transaction in column (a). Do not abbreviate or truncate the name or use<br />
acronyms. Explain in a footnote any ownership interest or affiliation the respondent has with the seller.<br />
3. In column (b), enter a Statistical Classification Code based on the original contractual terms <strong>and</strong> conditions of the service as follows:<br />
RQ - for requirements service. Requirements service is service which the supplier plans to provide on an ongoing basis (i.e., the<br />
supplier includes projects load for this service in its system resource planning). In addition, the reliability of requirement service must<br />
be the same as, or second only to, the supplier’s service to its own ultimate consumers.<br />
LF - for long-term firm service. "Long-term" means five years or longer <strong>and</strong> "firm" means that service cannot be interrupted for<br />
economic reasons <strong>and</strong> is intended to remain reliable even under adverse conditions (e.g., the supplier must attempt to buy emergency<br />
energy from third parties to maintain deliveries of LF service). This category should not be used for long-term firm service firm service<br />
which meets the definition of RQ service. For all transaction identified as LF, provide in a footnote the termination date of the contract<br />
defined as the earliest date that either buyer or seller can unilaterally get out of the contract.<br />
IF - for intermediate-term firm service. The same as LF service expect that "intermediate-term" means longer than one year but less<br />
than five years.<br />
SF - for short-term service. Use this category for all firm services, where the duration of each period of commitment for service is one<br />
year or less.<br />
LU - for long-term service from a designated generating unit. "Long-term" means five years or longer. The availability <strong>and</strong> reliability of<br />
service, aside from transmission constraints, must match the availability <strong>and</strong> reliability of the designated unit.<br />
IU - for intermediate-term service from a designated generating unit. The same as LU service expect that "intermediate-term" means<br />
longer than one year but less than five years.<br />
EX - For exchanges of electricity. Use this category for transactions involving a balancing of debits <strong>and</strong> credits for energy, capacity, etc.<br />
<strong>and</strong> any settlements for imbalanced exchanges.<br />
OS - for other service. Use this category only for those services which cannot be placed in the above-defined categories, such as all<br />
non-firm service regardless of the Length of the contract <strong>and</strong> service from designated units of Less than one year. Describe the nature<br />
of the service in a footnote for each adjustment.<br />
Line<br />
No.<br />
Name of <strong>Company</strong> or Public Authority<br />
(Footnote Affiliations)<br />
(a)<br />
Statistical<br />
Classification<br />
(b)<br />
<strong>FERC</strong> Rate<br />
Schedule or<br />
Tariff Number<br />
(c)<br />
Average<br />
Monthly Billing<br />
Dem<strong>and</strong> (MW)<br />
(d)<br />
Actual Dem<strong>and</strong> (MW)<br />
Average<br />
Average<br />
Monthly NCP Dem<strong>and</strong> Monthly CP Dem<strong>and</strong><br />
(e)<br />
(f)<br />
1<br />
CALPINE GEYSERS OS 6<br />
N/A<br />
N/A<br />
N/A<br />
2<br />
GLOBAL AMPERSAND OS 6<br />
N/A<br />
N/A<br />
N/A<br />
3<br />
IBERDROLA KLONDIKE (AKA PPM OS 6<br />
N/A<br />
N/A<br />
N/A<br />
4<br />
SHILOH I WIND PROJECT LLC OS 6<br />
N/A<br />
N/A<br />
N/A<br />
5<br />
TUNNEL HILL HYDROELECTRIC PROJECT OS 6<br />
N/A<br />
N/A<br />
N/A<br />
6<br />
SHILOH II WIND (AKA ENXCO) OS 6<br />
N/A<br />
N/A<br />
N/A<br />
7<br />
ARLINGTON WIND POWER PROJECT OS 6<br />
N/A<br />
N/A<br />
N/A<br />
8<br />
SEMPRA COPPER MOUNTAIN SOLAR OS 6<br />
N/A<br />
N/A<br />
N/A<br />
9<br />
IBERDROLA RENEWABLES (AKA PPM OS 6<br />
N/A<br />
N/A<br />
N/A<br />
10<br />
VANTAGE WIND ENERGY LLC OS 6<br />
N/A<br />
N/A<br />
N/A<br />
11<br />
SIERRA GREEN ENERGY LLC OS 6<br />
N/A<br />
N/A<br />
N/A<br />
12<br />
CAL RENEW (AKA CLEAN TECH) - COD: OS 6<br />
N/A<br />
N/A<br />
N/A<br />
13<br />
HATCHET RIDGE WIND LLC OS 6<br />
N/A<br />
N/A<br />
N/A<br />
14<br />
SANTA MARIA II LFG POWER PLANT OS 6<br />
N/A<br />
N/A<br />
N/A<br />
Total<br />
<strong>FERC</strong> FORM NO. 1 (ED. 12-90) Page 326.22
Name of Respondent<br />
PACIFIC GAS AND ELECTRIC COMPANY<br />
This Report Is:<br />
Date of Report<br />
(1) X An Original<br />
(Mo, Da, Yr)<br />
(2) A Resubmission<br />
04/08/2011<br />
PURCHASED POWER (Account 555)<br />
(Including power exchanges)<br />
Year/Period of Report<br />
End of <strong>2010</strong>/Q4<br />
1. Report all power purchases made during the year. Also report exchanges of electricity (i.e., transactions involving a balancing of<br />
debits <strong>and</strong> credits for energy, capacity, etc.) <strong>and</strong> any settlements for imbalanced exchanges.<br />
2. Enter the name of the seller or other party in an exchange transaction in column (a). Do not abbreviate or truncate the name or use<br />
acronyms. Explain in a footnote any ownership interest or affiliation the respondent has with the seller.<br />
3. In column (b), enter a Statistical Classification Code based on the original contractual terms <strong>and</strong> conditions of the service as follows:<br />
RQ - for requirements service. Requirements service is service which the supplier plans to provide on an ongoing basis (i.e., the<br />
supplier includes projects load for this service in its system resource planning). In addition, the reliability of requirement service must<br />
be the same as, or second only to, the supplier’s service to its own ultimate consumers.<br />
LF - for long-term firm service. "Long-term" means five years or longer <strong>and</strong> "firm" means that service cannot be interrupted for<br />
economic reasons <strong>and</strong> is intended to remain reliable even under adverse conditions (e.g., the supplier must attempt to buy emergency<br />
energy from third parties to maintain deliveries of LF service). This category should not be used for long-term firm service firm service<br />
which meets the definition of RQ service. For all transaction identified as LF, provide in a footnote the termination date of the contract<br />
defined as the earliest date that either buyer or seller can unilaterally get out of the contract.<br />
IF - for intermediate-term firm service. The same as LF service expect that "intermediate-term" means longer than one year but less<br />
than five years.<br />
SF - for short-term service. Use this category for all firm services, where the duration of each period of commitment for service is one<br />
year or less.<br />
LU - for long-term service from a designated generating unit. "Long-term" means five years or longer. The availability <strong>and</strong> reliability of<br />
service, aside from transmission constraints, must match the availability <strong>and</strong> reliability of the designated unit.<br />
IU - for intermediate-term service from a designated generating unit. The same as LU service expect that "intermediate-term" means<br />
longer than one year but less than five years.<br />
EX - For exchanges of electricity. Use this category for transactions involving a balancing of debits <strong>and</strong> credits for energy, capacity, etc.<br />
<strong>and</strong> any settlements for imbalanced exchanges.<br />
OS - for other service. Use this category only for those services which cannot be placed in the above-defined categories, such as all<br />
non-firm service regardless of the Length of the contract <strong>and</strong> service from designated units of Less than one year. Describe the nature<br />
of the service in a footnote for each adjustment.<br />
Line<br />
No.<br />
Name of <strong>Company</strong> or Public Authority<br />
(Footnote Affiliations)<br />
(a)<br />
Statistical<br />
Classification<br />
(b)<br />
<strong>FERC</strong> Rate<br />
Schedule or<br />
Tariff Number<br />
(c)<br />
Average<br />
Monthly Billing<br />
Dem<strong>and</strong> (MW)<br />
(d)<br />
Actual Dem<strong>and</strong> (MW)<br />
Average<br />
Average<br />
Monthly NCP Dem<strong>and</strong> Monthly CP Dem<strong>and</strong><br />
(e)<br />
(f)<br />
1<br />
NEXTERA MONTEZUMA WIND OS 6<br />
N/A<br />
N/A<br />
N/A<br />
2<br />
BLAKE'S LANDING FARMS, INC OS 6<br />
N/A<br />
N/A<br />
N/A<br />
3<br />
BILATERAL CONTRACTS: OS 6<br />
N/A<br />
N/A<br />
N/A<br />
4<br />
-WSPP/EEI OS 6<br />
N/A<br />
N/A<br />
N/A<br />
5<br />
SEMPRA ENERGY TRADING CORP. OS 6<br />
N/A<br />
N/A<br />
N/A<br />
6<br />
BP ENERGY COMPANY OS 6<br />
N/A<br />
N/A<br />
N/A<br />
7<br />
BONNEVILLE POWER ADMINISTRATION OS 6<br />
N/A<br />
N/A<br />
N/A<br />
8<br />
PORTLAND GENERAL OS 6<br />
N/A<br />
N/A<br />
N/A<br />
9<br />
CITY OF SANTA CLARA (SVP MUNI) OS 6<br />
N/A<br />
N/A<br />
N/A<br />
10<br />
SEATTLE CITY LIGHT OS 6<br />
N/A<br />
N/A<br />
N/A<br />
11<br />
CORAL POWER LLC (SHELL ENERGY LLC) OS 6<br />
N/A<br />
N/A<br />
N/A<br />
12<br />
SOUTHERN CALIFORNIA EDISON OS 6<br />
N/A<br />
N/A<br />
N/A<br />
13<br />
DYNEGY, INC. OS 6<br />
N/A<br />
N/A<br />
N/A<br />
14<br />
CALPINE ENERGY SERVICES L.P. OS 6<br />
N/A<br />
N/A<br />
N/A<br />
Total<br />
<strong>FERC</strong> FORM NO. 1 (ED. 12-90) Page 326.23
Name of Respondent<br />
PACIFIC GAS AND ELECTRIC COMPANY<br />
This Report Is:<br />
Date of Report<br />
(1) X An Original<br />
(Mo, Da, Yr)<br />
(2) A Resubmission<br />
04/08/2011<br />
PURCHASED POWER (Account 555)<br />
(Including power exchanges)<br />
Year/Period of Report<br />
End of <strong>2010</strong>/Q4<br />
1. Report all power purchases made during the year. Also report exchanges of electricity (i.e., transactions involving a balancing of<br />
debits <strong>and</strong> credits for energy, capacity, etc.) <strong>and</strong> any settlements for imbalanced exchanges.<br />
2. Enter the name of the seller or other party in an exchange transaction in column (a). Do not abbreviate or truncate the name or use<br />
acronyms. Explain in a footnote any ownership interest or affiliation the respondent has with the seller.<br />
3. In column (b), enter a Statistical Classification Code based on the original contractual terms <strong>and</strong> conditions of the service as follows:<br />
RQ - for requirements service. Requirements service is service which the supplier plans to provide on an ongoing basis (i.e., the<br />
supplier includes projects load for this service in its system resource planning). In addition, the reliability of requirement service must<br />
be the same as, or second only to, the supplier’s service to its own ultimate consumers.<br />
LF - for long-term firm service. "Long-term" means five years or longer <strong>and</strong> "firm" means that service cannot be interrupted for<br />
economic reasons <strong>and</strong> is intended to remain reliable even under adverse conditions (e.g., the supplier must attempt to buy emergency<br />
energy from third parties to maintain deliveries of LF service). This category should not be used for long-term firm service firm service<br />
which meets the definition of RQ service. For all transaction identified as LF, provide in a footnote the termination date of the contract<br />
defined as the earliest date that either buyer or seller can unilaterally get out of the contract.<br />
IF - for intermediate-term firm service. The same as LF service expect that "intermediate-term" means longer than one year but less<br />
than five years.<br />
SF - for short-term service. Use this category for all firm services, where the duration of each period of commitment for service is one<br />
year or less.<br />
LU - for long-term service from a designated generating unit. "Long-term" means five years or longer. The availability <strong>and</strong> reliability of<br />
service, aside from transmission constraints, must match the availability <strong>and</strong> reliability of the designated unit.<br />
IU - for intermediate-term service from a designated generating unit. The same as LU service expect that "intermediate-term" means<br />
longer than one year but less than five years.<br />
EX - For exchanges of electricity. Use this category for transactions involving a balancing of debits <strong>and</strong> credits for energy, capacity, etc.<br />
<strong>and</strong> any settlements for imbalanced exchanges.<br />
OS - for other service. Use this category only for those services which cannot be placed in the above-defined categories, such as all<br />
non-firm service regardless of the Length of the contract <strong>and</strong> service from designated units of Less than one year. Describe the nature<br />
of the service in a footnote for each adjustment.<br />
Line<br />
No.<br />
Name of <strong>Company</strong> or Public Authority<br />
(Footnote Affiliations)<br />
(a)<br />
Statistical<br />
Classification<br />
(b)<br />
<strong>FERC</strong> Rate<br />
Schedule or<br />
Tariff Number<br />
(c)<br />
Average<br />
Monthly Billing<br />
Dem<strong>and</strong> (MW)<br />
(d)<br />
Actual Dem<strong>and</strong> (MW)<br />
Average<br />
Average<br />
Monthly NCP Dem<strong>and</strong> Monthly CP Dem<strong>and</strong><br />
(e)<br />
(f)<br />
1<br />
IBERDROLA RENEWABLES (PPM OS 6<br />
N/A<br />
N/A<br />
N/A<br />
2<br />
PACIFICORP OS 6<br />
N/A<br />
N/A<br />
N/A<br />
3<br />
POWEREX CORP OS 6<br />
N/A<br />
N/A<br />
N/A<br />
4<br />
CONSTELLATION ENERGY OS 6<br />
N/A<br />
N/A<br />
N/A<br />
5<br />
PACIFIC SUMMIT ENERGY LLC OS 6<br />
N/A<br />
N/A<br />
N/A<br />
6<br />
BARCLAYS BANK PLC OS 6<br />
N/A<br />
N/A<br />
N/A<br />
7<br />
MORGAN STANLEY CAPITAL GROUP OS 6<br />
N/A<br />
N/A<br />
N/A<br />
8<br />
JP MORGAN VENTURES ENERGY CORP OS 6<br />
N/A<br />
N/A<br />
N/A<br />
9<br />
SACRAMENTO MUNICIPAL UTILITY OS 6<br />
N/A<br />
N/A<br />
N/A<br />
10<br />
CITIGROUP ENERGY INC OS 6<br />
N/A<br />
N/A<br />
N/A<br />
11<br />
IBERDROLA RENEWABLES (PPM OS 6<br />
N/A<br />
N/A<br />
N/A<br />
12<br />
TRANSALTA ENERGY MARKETING US OS 6<br />
N/A<br />
N/A<br />
N/A<br />
13<br />
BILATERAL CONTRACTS:<br />
14<br />
- SUPPLEMENTAL ENERGY:<br />
Total<br />
<strong>FERC</strong> FORM NO. 1 (ED. 12-90) Page 326.24
Name of Respondent<br />
PACIFIC GAS AND ELECTRIC COMPANY<br />
This Report Is:<br />
Date of Report<br />
(1) X An Original<br />
(Mo, Da, Yr)<br />
(2) A Resubmission<br />
04/08/2011<br />
PURCHASED POWER (Account 555)<br />
(Including power exchanges)<br />
Year/Period of Report<br />
End of <strong>2010</strong>/Q4<br />
1. Report all power purchases made during the year. Also report exchanges of electricity (i.e., transactions involving a balancing of<br />
debits <strong>and</strong> credits for energy, capacity, etc.) <strong>and</strong> any settlements for imbalanced exchanges.<br />
2. Enter the name of the seller or other party in an exchange transaction in column (a). Do not abbreviate or truncate the name or use<br />
acronyms. Explain in a footnote any ownership interest or affiliation the respondent has with the seller.<br />
3. In column (b), enter a Statistical Classification Code based on the original contractual terms <strong>and</strong> conditions of the service as follows:<br />
RQ - for requirements service. Requirements service is service which the supplier plans to provide on an ongoing basis (i.e., the<br />
supplier includes projects load for this service in its system resource planning). In addition, the reliability of requirement service must<br />
be the same as, or second only to, the supplier’s service to its own ultimate consumers.<br />
LF - for long-term firm service. "Long-term" means five years or longer <strong>and</strong> "firm" means that service cannot be interrupted for<br />
economic reasons <strong>and</strong> is intended to remain reliable even under adverse conditions (e.g., the supplier must attempt to buy emergency<br />
energy from third parties to maintain deliveries of LF service). This category should not be used for long-term firm service firm service<br />
which meets the definition of RQ service. For all transaction identified as LF, provide in a footnote the termination date of the contract<br />
defined as the earliest date that either buyer or seller can unilaterally get out of the contract.<br />
IF - for intermediate-term firm service. The same as LF service expect that "intermediate-term" means longer than one year but less<br />
than five years.<br />
SF - for short-term service. Use this category for all firm services, where the duration of each period of commitment for service is one<br />
year or less.<br />
LU - for long-term service from a designated generating unit. "Long-term" means five years or longer. The availability <strong>and</strong> reliability of<br />
service, aside from transmission constraints, must match the availability <strong>and</strong> reliability of the designated unit.<br />
IU - for intermediate-term service from a designated generating unit. The same as LU service expect that "intermediate-term" means<br />
longer than one year but less than five years.<br />
EX - For exchanges of electricity. Use this category for transactions involving a balancing of debits <strong>and</strong> credits for energy, capacity, etc.<br />
<strong>and</strong> any settlements for imbalanced exchanges.<br />
OS - for other service. Use this category only for those services which cannot be placed in the above-defined categories, such as all<br />
non-firm service regardless of the Length of the contract <strong>and</strong> service from designated units of Less than one year. Describe the nature<br />
of the service in a footnote for each adjustment.<br />
Line<br />
No.<br />
Name of <strong>Company</strong> or Public Authority<br />
(Footnote Affiliations)<br />
(a)<br />
Statistical<br />
Classification<br />
(b)<br />
<strong>FERC</strong> Rate<br />
Schedule or<br />
Tariff Number<br />
(c)<br />
Average<br />
Monthly Billing<br />
Dem<strong>and</strong> (MW)<br />
(d)<br />
Actual Dem<strong>and</strong> (MW)<br />
Average<br />
Average<br />
Monthly NCP Dem<strong>and</strong> Monthly CP Dem<strong>and</strong><br />
(e)<br />
(f)<br />
1<br />
POTRERO 3 - RMR MIRANT OS 6<br />
N/A<br />
N/A<br />
N/A<br />
2<br />
CALPINE PEAKERS OS 6<br />
N/A<br />
N/A<br />
N/A<br />
3<br />
BILATERAL CONTRACTS:<br />
4<br />
- RESOURCE ADEQUACY:<br />
5<br />
RRI ENERGY SERVICES JUL-SEP <strong>2010</strong> RA OS 6<br />
N/A<br />
N/A<br />
N/A<br />
6<br />
SOUTH FEATHER WATER AND POWER OS 6<br />
N/A<br />
N/A<br />
N/A<br />
7<br />
LA PALOMA GENERATING COMPANY OS 6<br />
N/A<br />
N/A<br />
N/A<br />
8<br />
MIRANT DELTA TOLLING 2008 - 2012 OS 6<br />
N/A<br />
N/A<br />
N/A<br />
9<br />
CALPINE LOS MEDANOS RA 2008-2012 OS 6<br />
N/A<br />
N/A<br />
N/A<br />
10<br />
LA PALOMA GENERATING COMPANY OS 6<br />
N/A<br />
N/A<br />
N/A<br />
11<br />
ELK HILLS POWER LLC JUL-SEP <strong>2010</strong> RA OS 6<br />
N/A<br />
N/A<br />
N/A<br />
12<br />
MORGAN STANLEY CAPITAL GROUP OS 6<br />
N/A<br />
N/A<br />
N/A<br />
13<br />
DYNEGY POWER MARKETING JUL-AUG OS 6<br />
N/A<br />
N/A<br />
N/A<br />
14<br />
CALPINE GEYSERS (200/425 MW) OS 6<br />
N/A<br />
N/A<br />
N/A<br />
Total<br />
<strong>FERC</strong> FORM NO. 1 (ED. 12-90) Page 326.25
Name of Respondent<br />
PACIFIC GAS AND ELECTRIC COMPANY<br />
This Report Is:<br />
Date of Report<br />
(1) X An Original<br />
(Mo, Da, Yr)<br />
(2) A Resubmission<br />
04/08/2011<br />
PURCHASED POWER (Account 555)<br />
(Including power exchanges)<br />
Year/Period of Report<br />
End of <strong>2010</strong>/Q4<br />
1. Report all power purchases made during the year. Also report exchanges of electricity (i.e., transactions involving a balancing of<br />
debits <strong>and</strong> credits for energy, capacity, etc.) <strong>and</strong> any settlements for imbalanced exchanges.<br />
2. Enter the name of the seller or other party in an exchange transaction in column (a). Do not abbreviate or truncate the name or use<br />
acronyms. Explain in a footnote any ownership interest or affiliation the respondent has with the seller.<br />
3. In column (b), enter a Statistical Classification Code based on the original contractual terms <strong>and</strong> conditions of the service as follows:<br />
RQ - for requirements service. Requirements service is service which the supplier plans to provide on an ongoing basis (i.e., the<br />
supplier includes projects load for this service in its system resource planning). In addition, the reliability of requirement service must<br />
be the same as, or second only to, the supplier’s service to its own ultimate consumers.<br />
LF - for long-term firm service. "Long-term" means five years or longer <strong>and</strong> "firm" means that service cannot be interrupted for<br />
economic reasons <strong>and</strong> is intended to remain reliable even under adverse conditions (e.g., the supplier must attempt to buy emergency<br />
energy from third parties to maintain deliveries of LF service). This category should not be used for long-term firm service firm service<br />
which meets the definition of RQ service. For all transaction identified as LF, provide in a footnote the termination date of the contract<br />
defined as the earliest date that either buyer or seller can unilaterally get out of the contract.<br />
IF - for intermediate-term firm service. The same as LF service expect that "intermediate-term" means longer than one year but less<br />
than five years.<br />
SF - for short-term service. Use this category for all firm services, where the duration of each period of commitment for service is one<br />
year or less.<br />
LU - for long-term service from a designated generating unit. "Long-term" means five years or longer. The availability <strong>and</strong> reliability of<br />
service, aside from transmission constraints, must match the availability <strong>and</strong> reliability of the designated unit.<br />
IU - for intermediate-term service from a designated generating unit. The same as LU service expect that "intermediate-term" means<br />
longer than one year but less than five years.<br />
EX - For exchanges of electricity. Use this category for transactions involving a balancing of debits <strong>and</strong> credits for energy, capacity, etc.<br />
<strong>and</strong> any settlements for imbalanced exchanges.<br />
OS - for other service. Use this category only for those services which cannot be placed in the above-defined categories, such as all<br />
non-firm service regardless of the Length of the contract <strong>and</strong> service from designated units of Less than one year. Describe the nature<br />
of the service in a footnote for each adjustment.<br />
Line<br />
No.<br />
Name of <strong>Company</strong> or Public Authority<br />
(Footnote Affiliations)<br />
(a)<br />
Statistical<br />
Classification<br />
(b)<br />
<strong>FERC</strong> Rate<br />
Schedule or<br />
Tariff Number<br />
(c)<br />
Average<br />
Monthly Billing<br />
Dem<strong>and</strong> (MW)<br />
(d)<br />
Actual Dem<strong>and</strong> (MW)<br />
Average<br />
Average<br />
Monthly NCP Dem<strong>and</strong> Monthly CP Dem<strong>and</strong><br />
(e)<br />
(f)<br />
1<br />
CALPINE LOS MEDANOS RA 2008-2012 OS 6<br />
N/A<br />
N/A<br />
N/A<br />
2<br />
CALPINE METCALF RA 2008-2012 OS 6<br />
N/A<br />
N/A<br />
N/A<br />
3<br />
BILATERAL CONTRACTS:<br />
4<br />
- LONG-TERM WHOLESALE<br />
5<br />
MIDWAY SUNSET PPA OS 6<br />
N/A<br />
N/A<br />
N/A<br />
6<br />
MIRANT DELTA TOLLING 2008 - 2012 OS 6<br />
N/A<br />
N/A<br />
N/A<br />
7<br />
CALPINE PEAKERS OS 6<br />
N/A<br />
N/A<br />
N/A<br />
8<br />
GWF OS 6<br />
N/A<br />
N/A<br />
N/A<br />
9<br />
DYNEGY MOSS LANDING UNITS 6&8 OS 6<br />
N/A<br />
N/A<br />
N/A<br />
10<br />
JR SIMPLOT OS 6<br />
N/A<br />
N/A<br />
N/A<br />
11<br />
EIF PANOCHE OS 6<br />
N/A<br />
N/A<br />
N/A<br />
12<br />
STARWOOD POWER MIDWAY, LLC OS 6<br />
N/A<br />
N/A<br />
N/A<br />
13<br />
SOUTH FEATHER WATER AND POWER OS 6<br />
N/A<br />
N/A<br />
N/A<br />
14<br />
BILATERAL CONTRACTS:<br />
Total<br />
<strong>FERC</strong> FORM NO. 1 (ED. 12-90) Page 326.26
Name of Respondent<br />
PACIFIC GAS AND ELECTRIC COMPANY<br />
This Report Is:<br />
Date of Report<br />
(1) X An Original<br />
(Mo, Da, Yr)<br />
(2) A Resubmission<br />
04/08/2011<br />
PURCHASED POWER (Account 555)<br />
(Including power exchanges)<br />
Year/Period of Report<br />
End of <strong>2010</strong>/Q4<br />
1. Report all power purchases made during the year. Also report exchanges of electricity (i.e., transactions involving a balancing of<br />
debits <strong>and</strong> credits for energy, capacity, etc.) <strong>and</strong> any settlements for imbalanced exchanges.<br />
2. Enter the name of the seller or other party in an exchange transaction in column (a). Do not abbreviate or truncate the name or use<br />
acronyms. Explain in a footnote any ownership interest or affiliation the respondent has with the seller.<br />
3. In column (b), enter a Statistical Classification Code based on the original contractual terms <strong>and</strong> conditions of the service as follows:<br />
RQ - for requirements service. Requirements service is service which the supplier plans to provide on an ongoing basis (i.e., the<br />
supplier includes projects load for this service in its system resource planning). In addition, the reliability of requirement service must<br />
be the same as, or second only to, the supplier’s service to its own ultimate consumers.<br />
LF - for long-term firm service. "Long-term" means five years or longer <strong>and</strong> "firm" means that service cannot be interrupted for<br />
economic reasons <strong>and</strong> is intended to remain reliable even under adverse conditions (e.g., the supplier must attempt to buy emergency<br />
energy from third parties to maintain deliveries of LF service). This category should not be used for long-term firm service firm service<br />
which meets the definition of RQ service. For all transaction identified as LF, provide in a footnote the termination date of the contract<br />
defined as the earliest date that either buyer or seller can unilaterally get out of the contract.<br />
IF - for intermediate-term firm service. The same as LF service expect that "intermediate-term" means longer than one year but less<br />
than five years.<br />
SF - for short-term service. Use this category for all firm services, where the duration of each period of commitment for service is one<br />
year or less.<br />
LU - for long-term service from a designated generating unit. "Long-term" means five years or longer. The availability <strong>and</strong> reliability of<br />
service, aside from transmission constraints, must match the availability <strong>and</strong> reliability of the designated unit.<br />
IU - for intermediate-term service from a designated generating unit. The same as LU service expect that "intermediate-term" means<br />
longer than one year but less than five years.<br />
EX - For exchanges of electricity. Use this category for transactions involving a balancing of debits <strong>and</strong> credits for energy, capacity, etc.<br />
<strong>and</strong> any settlements for imbalanced exchanges.<br />
OS - for other service. Use this category only for those services which cannot be placed in the above-defined categories, such as all<br />
non-firm service regardless of the Length of the contract <strong>and</strong> service from designated units of Less than one year. Describe the nature<br />
of the service in a footnote for each adjustment.<br />
Line<br />
No.<br />
Name of <strong>Company</strong> or Public Authority<br />
(Footnote Affiliations)<br />
(a)<br />
Statistical<br />
Classification<br />
(b)<br />
<strong>FERC</strong> Rate<br />
Schedule or<br />
Tariff Number<br />
(c)<br />
Average<br />
Monthly Billing<br />
Dem<strong>and</strong> (MW)<br />
(d)<br />
Actual Dem<strong>and</strong> (MW)<br />
Average<br />
Average<br />
Monthly NCP Dem<strong>and</strong> Monthly CP Dem<strong>and</strong><br />
(e)<br />
(f)<br />
1<br />
- DEMAND RESPONSE AGREEMENTS:<br />
2<br />
C Powered OS 6<br />
N/A<br />
N/A<br />
N/A<br />
3<br />
Alternative Energy Resources OS 6<br />
N/A<br />
N/A<br />
N/A<br />
4<br />
Energy Connect OS 6<br />
N/A<br />
N/A<br />
N/A<br />
5<br />
EnerNoc OS 6<br />
N/A<br />
N/A<br />
N/A<br />
6<br />
Energy Curtailment OS 6<br />
N/A<br />
N/A<br />
N/A<br />
7<br />
BILATERAL CONTRACTS:<br />
8<br />
- OTHERS:<br />
9<br />
Hedging Activity OS 6<br />
N/A<br />
N/A<br />
N/A<br />
10<br />
Non-UEG Costs OS 6<br />
N/A<br />
N/A<br />
N/A<br />
11<br />
Non-CTC Costs OS 6<br />
N/A<br />
N/A<br />
N/A<br />
12<br />
Interstate gas pipeline charges OS 6<br />
N/A<br />
N/A<br />
N/A<br />
13<br />
Broker/Management <strong>and</strong> Other OS 6<br />
N/A<br />
N/A<br />
N/A<br />
14<br />
UFE OS 6<br />
N/A<br />
N/A<br />
N/A<br />
Total<br />
<strong>FERC</strong> FORM NO. 1 (ED. 12-90) Page 326.27
Name of Respondent<br />
PACIFIC GAS AND ELECTRIC COMPANY<br />
This Report Is:<br />
Date of Report<br />
(1) X An Original<br />
(Mo, Da, Yr)<br />
(2) A Resubmission<br />
04/08/2011<br />
PURCHASED POWER (Account 555)<br />
(Including power exchanges)<br />
Year/Period of Report<br />
End of <strong>2010</strong>/Q4<br />
1. Report all power purchases made during the year. Also report exchanges of electricity (i.e., transactions involving a balancing of<br />
debits <strong>and</strong> credits for energy, capacity, etc.) <strong>and</strong> any settlements for imbalanced exchanges.<br />
2. Enter the name of the seller or other party in an exchange transaction in column (a). Do not abbreviate or truncate the name or use<br />
acronyms. Explain in a footnote any ownership interest or affiliation the respondent has with the seller.<br />
3. In column (b), enter a Statistical Classification Code based on the original contractual terms <strong>and</strong> conditions of the service as follows:<br />
RQ - for requirements service. Requirements service is service which the supplier plans to provide on an ongoing basis (i.e., the<br />
supplier includes projects load for this service in its system resource planning). In addition, the reliability of requirement service must<br />
be the same as, or second only to, the supplier’s service to its own ultimate consumers.<br />
LF - for long-term firm service. "Long-term" means five years or longer <strong>and</strong> "firm" means that service cannot be interrupted for<br />
economic reasons <strong>and</strong> is intended to remain reliable even under adverse conditions (e.g., the supplier must attempt to buy emergency<br />
energy from third parties to maintain deliveries of LF service). This category should not be used for long-term firm service firm service<br />
which meets the definition of RQ service. For all transaction identified as LF, provide in a footnote the termination date of the contract<br />
defined as the earliest date that either buyer or seller can unilaterally get out of the contract.<br />
IF - for intermediate-term firm service. The same as LF service expect that "intermediate-term" means longer than one year but less<br />
than five years.<br />
SF - for short-term service. Use this category for all firm services, where the duration of each period of commitment for service is one<br />
year or less.<br />
LU - for long-term service from a designated generating unit. "Long-term" means five years or longer. The availability <strong>and</strong> reliability of<br />
service, aside from transmission constraints, must match the availability <strong>and</strong> reliability of the designated unit.<br />
IU - for intermediate-term service from a designated generating unit. The same as LU service expect that "intermediate-term" means<br />
longer than one year but less than five years.<br />
EX - For exchanges of electricity. Use this category for transactions involving a balancing of debits <strong>and</strong> credits for energy, capacity, etc.<br />
<strong>and</strong> any settlements for imbalanced exchanges.<br />
OS - for other service. Use this category only for those services which cannot be placed in the above-defined categories, such as all<br />
non-firm service regardless of the Length of the contract <strong>and</strong> service from designated units of Less than one year. Describe the nature<br />
of the service in a footnote for each adjustment.<br />
Line<br />
No.<br />
Name of <strong>Company</strong> or Public Authority<br />
(Footnote Affiliations)<br />
(a)<br />
Statistical<br />
Classification<br />
(b)<br />
<strong>FERC</strong> Rate<br />
Schedule or<br />
Tariff Number<br />
(c)<br />
Average<br />
Monthly Billing<br />
Dem<strong>and</strong> (MW)<br />
(d)<br />
Actual Dem<strong>and</strong> (MW)<br />
Average<br />
Average<br />
Monthly NCP Dem<strong>and</strong> Monthly CP Dem<strong>and</strong><br />
(e)<br />
(f)<br />
1<br />
California Independent System Operator OS 6<br />
N/A<br />
N/A<br />
N/A<br />
2<br />
Day Ahead Market Purchases OS 6<br />
N/A<br />
N/A<br />
N/A<br />
3<br />
Miscellaneous Items<br />
4<br />
5<br />
6<br />
7<br />
8<br />
9<br />
10<br />
11<br />
12<br />
13<br />
14<br />
Total<br />
<strong>FERC</strong> FORM NO. 1 (ED. 12-90) Page 326.28
Name of Respondent<br />
PACIFIC GAS AND ELECTRIC COMPANY<br />
This Report Is:<br />
Date of Report<br />
(1) X An Original<br />
(Mo, Da, Yr)<br />
(2) A Resubmission<br />
04/08/2011<br />
PURCHASED POWER(Account 555) (Continued)<br />
(Including power exchanges)<br />
Year/Period of Report<br />
End of <strong>2010</strong>/Q4<br />
AD - for out-of-period adjustment. Use this code for any accounting adjustments or "true-ups" for service provided in prior reporting<br />
years. Provide an explanation in a footnote for each adjustment.<br />
4. In column (c), identify the <strong>FERC</strong> Rate Schedule Number or Tariff, or, for non-<strong>FERC</strong> jurisdictional sellers, include an appropriate<br />
designation for the contract. On separate lines, list all <strong>FERC</strong> rate schedules, tariffs or contract designations under which service, as<br />
identified in column (b), is provided.<br />
5. For requirements RQ purchases <strong>and</strong> any type of service involving dem<strong>and</strong> charges imposed on a monnthly (or longer) basis, enter<br />
the monthly average billing dem<strong>and</strong> in column (d), the average monthly non-coincident peak (NCP) dem<strong>and</strong> in column (e), <strong>and</strong> the<br />
average monthly coincident peak (CP) dem<strong>and</strong> in column (f). For all other types of service, enter NA in columns (d), (e) <strong>and</strong> (f). Monthly<br />
NCP dem<strong>and</strong> is the maximum metered hourly (60-minute integration) dem<strong>and</strong> in a month. Monthly CP dem<strong>and</strong> is the metered dem<strong>and</strong><br />
during the hour (60-minute integration) in which the supplier's system reaches its monthly peak. Dem<strong>and</strong> reported in columns (e) <strong>and</strong> (f)<br />
must be in megawatts. Footnote any dem<strong>and</strong> not stated on a megawatt basis <strong>and</strong> explain.<br />
6. Report in column (g) the megawatthours shown on bills rendered to the respondent. Report in columns (h) <strong>and</strong> (i) the megawatthours<br />
of power exchanges received <strong>and</strong> delivered, used as the basis for settlement. Do not report net exchange.<br />
7. Report dem<strong>and</strong> charges in column (j), energy charges in column (k), <strong>and</strong> the total of any other types of charges, including<br />
out-of-period adjustments, in column (l). Explain in a footnote all components of the amount shown in column (l). Report in column (m)<br />
the total charge shown on bills received as settlement by the respondent. For power exchanges, report in column (m) the settlement<br />
amount for the net receipt of energy. If more energy was delivered than received, enter a negative amount. If the settlement amount (l)<br />
include credits or charges other than incremental generation expenses, or (2) excludes certain credits or charges covered by the<br />
agreement, provide an explanatory footnote.<br />
8. The data in column (g) through (m) must be totalled on the last line of the schedule. The total amount in column (g) must be<br />
reported as Purchases on Page 401, line 10. The total amount in column (h) must be reported as Exchange Received on Page 401,<br />
line 12. The total amount in column (i) must be reported as Exchange Delivered on Page 401, line 13.<br />
9. Footnote entries as required <strong>and</strong> provide explanations following all required data.<br />
POWER EXCHANGES<br />
MegaWatt Hours<br />
MegaWatt Hours MegaWatt Hours<br />
Purchased<br />
Received<br />
Delivered<br />
(g)<br />
(h)<br />
(i)<br />
220,843<br />
42,384<br />
174,485<br />
92,684<br />
161,936<br />
63,203<br />
61,648<br />
68,881<br />
113,169<br />
180,705<br />
173,845<br />
COST/SETTLEMENT OF POWER<br />
Line<br />
Dem<strong>and</strong> Charges Energy Charges Other Charges Total (j+k+l) No.<br />
($) ($) ($)<br />
of Settlement ($)<br />
(j)<br />
(k)<br />
(l)<br />
(m)<br />
1<br />
2<br />
3<br />
5,753,537 14,536,038 20,289,575 4<br />
839,605 2,829,706 3,669,311 5<br />
4,895,130 11,797,324 16,692,454 6<br />
2,402,052 5,304,859 7,706,911 7<br />
3,619,498 7,387,632 11,007,130 8<br />
-98,045 7,525,150 7,427,105 9<br />
-103,810 7,345,860 7,242,050 10<br />
1,783,960 4,375,367 6,159,327 11<br />
2,779,794 7,357,364 10,137,158 12<br />
4,824,994 12,150,581 16,975,575 13<br />
4,858,435 11,689,014 16,547,449 14<br />
44,837,023 754,305,279 2,879,319,814 -87,416 3,633,537,677<br />
<strong>FERC</strong> FORM NO. 1 (ED. 12-90) Page 327
Name of Respondent<br />
PACIFIC GAS AND ELECTRIC COMPANY<br />
This Report Is:<br />
Date of Report<br />
(1) X An Original<br />
(Mo, Da, Yr)<br />
(2) A Resubmission<br />
04/08/2011<br />
PURCHASED POWER(Account 555) (Continued)<br />
(Including power exchanges)<br />
Year/Period of Report<br />
End of <strong>2010</strong>/Q4<br />
AD - for out-of-period adjustment. Use this code for any accounting adjustments or "true-ups" for service provided in prior reporting<br />
years. Provide an explanation in a footnote for each adjustment.<br />
4. In column (c), identify the <strong>FERC</strong> Rate Schedule Number or Tariff, or, for non-<strong>FERC</strong> jurisdictional sellers, include an appropriate<br />
designation for the contract. On separate lines, list all <strong>FERC</strong> rate schedules, tariffs or contract designations under which service, as<br />
identified in column (b), is provided.<br />
5. For requirements RQ purchases <strong>and</strong> any type of service involving dem<strong>and</strong> charges imposed on a monnthly (or longer) basis, enter<br />
the monthly average billing dem<strong>and</strong> in column (d), the average monthly non-coincident peak (NCP) dem<strong>and</strong> in column (e), <strong>and</strong> the<br />
average monthly coincident peak (CP) dem<strong>and</strong> in column (f). For all other types of service, enter NA in columns (d), (e) <strong>and</strong> (f). Monthly<br />
NCP dem<strong>and</strong> is the maximum metered hourly (60-minute integration) dem<strong>and</strong> in a month. Monthly CP dem<strong>and</strong> is the metered dem<strong>and</strong><br />
during the hour (60-minute integration) in which the supplier's system reaches its monthly peak. Dem<strong>and</strong> reported in columns (e) <strong>and</strong> (f)<br />
must be in megawatts. Footnote any dem<strong>and</strong> not stated on a megawatt basis <strong>and</strong> explain.<br />
6. Report in column (g) the megawatthours shown on bills rendered to the respondent. Report in columns (h) <strong>and</strong> (i) the megawatthours<br />
of power exchanges received <strong>and</strong> delivered, used as the basis for settlement. Do not report net exchange.<br />
7. Report dem<strong>and</strong> charges in column (j), energy charges in column (k), <strong>and</strong> the total of any other types of charges, including<br />
out-of-period adjustments, in column (l). Explain in a footnote all components of the amount shown in column (l). Report in column (m)<br />
the total charge shown on bills received as settlement by the respondent. For power exchanges, report in column (m) the settlement<br />
amount for the net receipt of energy. If more energy was delivered than received, enter a negative amount. If the settlement amount (l)<br />
include credits or charges other than incremental generation expenses, or (2) excludes certain credits or charges covered by the<br />
agreement, provide an explanatory footnote.<br />
8. The data in column (g) through (m) must be totalled on the last line of the schedule. The total amount in column (g) must be<br />
reported as Purchases on Page 401, line 10. The total amount in column (h) must be reported as Exchange Received on Page 401,<br />
line 12. The total amount in column (i) must be reported as Exchange Delivered on Page 401, line 13.<br />
9. Footnote entries as required <strong>and</strong> provide explanations following all required data.<br />
POWER EXCHANGES<br />
MegaWatt Hours<br />
MegaWatt Hours MegaWatt Hours<br />
Purchased<br />
Received<br />
Delivered<br />
(g)<br />
(h)<br />
(i)<br />
93,963<br />
78,669<br />
106,533<br />
146,162<br />
93,321<br />
397,686<br />
30,103<br />
17,955<br />
9,692<br />
COST/SETTLEMENT OF POWER<br />
Line<br />
Dem<strong>and</strong> Charges Energy Charges Other Charges Total (j+k+l) No.<br />
($) ($) ($)<br />
of Settlement ($)<br />
(j)<br />
(k)<br />
(l)<br />
(m)<br />
1,932,525 6,214,533 8,147,058 1<br />
1,571,410 5,169,859 6,741,269 2<br />
2,450,804 6,805,275 9,256,079 3<br />
4<br />
9 9 5<br />
3,077,016 9,730,763 12,807,779 6<br />
8,624,043 8,624,043 7<br />
8,996,049 26,440,623 35,436,672 8<br />
324,492 1,766,149 2,090,641 9<br />
10<br />
73,759 819,251 893,010 11<br />
12<br />
13<br />
40,815 425,692 466,507 14<br />
44,837,023 754,305,279 2,879,319,814 -87,416 3,633,537,677<br />
<strong>FERC</strong> FORM NO. 1 (ED. 12-90) Page 327.1
Name of Respondent<br />
PACIFIC GAS AND ELECTRIC COMPANY<br />
This Report Is:<br />
Date of Report<br />
(1) X An Original<br />
(Mo, Da, Yr)<br />
(2) A Resubmission<br />
04/08/2011<br />
PURCHASED POWER(Account 555) (Continued)<br />
(Including power exchanges)<br />
Year/Period of Report<br />
End of <strong>2010</strong>/Q4<br />
AD - for out-of-period adjustment. Use this code for any accounting adjustments or "true-ups" for service provided in prior reporting<br />
years. Provide an explanation in a footnote for each adjustment.<br />
4. In column (c), identify the <strong>FERC</strong> Rate Schedule Number or Tariff, or, for non-<strong>FERC</strong> jurisdictional sellers, include an appropriate<br />
designation for the contract. On separate lines, list all <strong>FERC</strong> rate schedules, tariffs or contract designations under which service, as<br />
identified in column (b), is provided.<br />
5. For requirements RQ purchases <strong>and</strong> any type of service involving dem<strong>and</strong> charges imposed on a monnthly (or longer) basis, enter<br />
the monthly average billing dem<strong>and</strong> in column (d), the average monthly non-coincident peak (NCP) dem<strong>and</strong> in column (e), <strong>and</strong> the<br />
average monthly coincident peak (CP) dem<strong>and</strong> in column (f). For all other types of service, enter NA in columns (d), (e) <strong>and</strong> (f). Monthly<br />
NCP dem<strong>and</strong> is the maximum metered hourly (60-minute integration) dem<strong>and</strong> in a month. Monthly CP dem<strong>and</strong> is the metered dem<strong>and</strong><br />
during the hour (60-minute integration) in which the supplier's system reaches its monthly peak. Dem<strong>and</strong> reported in columns (e) <strong>and</strong> (f)<br />
must be in megawatts. Footnote any dem<strong>and</strong> not stated on a megawatt basis <strong>and</strong> explain.<br />
6. Report in column (g) the megawatthours shown on bills rendered to the respondent. Report in columns (h) <strong>and</strong> (i) the megawatthours<br />
of power exchanges received <strong>and</strong> delivered, used as the basis for settlement. Do not report net exchange.<br />
7. Report dem<strong>and</strong> charges in column (j), energy charges in column (k), <strong>and</strong> the total of any other types of charges, including<br />
out-of-period adjustments, in column (l). Explain in a footnote all components of the amount shown in column (l). Report in column (m)<br />
the total charge shown on bills received as settlement by the respondent. For power exchanges, report in column (m) the settlement<br />
amount for the net receipt of energy. If more energy was delivered than received, enter a negative amount. If the settlement amount (l)<br />
include credits or charges other than incremental generation expenses, or (2) excludes certain credits or charges covered by the<br />
agreement, provide an explanatory footnote.<br />
8. The data in column (g) through (m) must be totalled on the last line of the schedule. The total amount in column (g) must be<br />
reported as Purchases on Page 401, line 10. The total amount in column (h) must be reported as Exchange Received on Page 401,<br />
line 12. The total amount in column (i) must be reported as Exchange Delivered on Page 401, line 13.<br />
9. Footnote entries as required <strong>and</strong> provide explanations following all required data.<br />
POWER EXCHANGES<br />
MegaWatt Hours<br />
MegaWatt Hours MegaWatt Hours<br />
Purchased<br />
Received<br />
Delivered<br />
(g)<br />
(h)<br />
(i)<br />
370,709<br />
391,204<br />
87,463<br />
348,196<br />
70,568<br />
31,802<br />
58,986<br />
25,246<br />
24,314<br />
11,205<br />
119,696<br />
30,773<br />
333,424<br />
230,679<br />
COST/SETTLEMENT OF POWER<br />
Line<br />
Dem<strong>and</strong> Charges Energy Charges Other Charges Total (j+k+l) No.<br />
($) ($) ($)<br />
of Settlement ($)<br />
(j)<br />
(k)<br />
(l)<br />
(m)<br />
9,733,184 16,822,779 26,555,963 1<br />
10,123,088 17,795,750 -87,416 27,831,422 2<br />
398,043 3,932,412 4,330,455 3<br />
5,238,368 15,870,940 21,109,308 4<br />
295,721 3,256,776 3,552,497 5<br />
160,980 1,434,434 1,595,414 6<br />
204,718 2,591,201 2,795,919 7<br />
133,189 1,073,666 1,206,855 8<br />
84,526 1,218,225 1,302,751 9<br />
39,864 551,804 591,668 10<br />
577,635 5,395,760 5,973,395 11<br />
133,248 1,473,587 1,606,835 12<br />
1,444,129 15,123,628 16,567,757 13<br />
2,857,796 10,461,823 13,319,619 14<br />
44,837,023 754,305,279 2,879,319,814 -87,416 3,633,537,677<br />
<strong>FERC</strong> FORM NO. 1 (ED. 12-90) Page 327.2
Name of Respondent<br />
PACIFIC GAS AND ELECTRIC COMPANY<br />
This Report Is:<br />
Date of Report<br />
(1) X An Original<br />
(Mo, Da, Yr)<br />
(2) A Resubmission<br />
04/08/2011<br />
PURCHASED POWER(Account 555) (Continued)<br />
(Including power exchanges)<br />
Year/Period of Report<br />
End of <strong>2010</strong>/Q4<br />
AD - for out-of-period adjustment. Use this code for any accounting adjustments or "true-ups" for service provided in prior reporting<br />
years. Provide an explanation in a footnote for each adjustment.<br />
4. In column (c), identify the <strong>FERC</strong> Rate Schedule Number or Tariff, or, for non-<strong>FERC</strong> jurisdictional sellers, include an appropriate<br />
designation for the contract. On separate lines, list all <strong>FERC</strong> rate schedules, tariffs or contract designations under which service, as<br />
identified in column (b), is provided.<br />
5. For requirements RQ purchases <strong>and</strong> any type of service involving dem<strong>and</strong> charges imposed on a monnthly (or longer) basis, enter<br />
the monthly average billing dem<strong>and</strong> in column (d), the average monthly non-coincident peak (NCP) dem<strong>and</strong> in column (e), <strong>and</strong> the<br />
average monthly coincident peak (CP) dem<strong>and</strong> in column (f). For all other types of service, enter NA in columns (d), (e) <strong>and</strong> (f). Monthly<br />
NCP dem<strong>and</strong> is the maximum metered hourly (60-minute integration) dem<strong>and</strong> in a month. Monthly CP dem<strong>and</strong> is the metered dem<strong>and</strong><br />
during the hour (60-minute integration) in which the supplier's system reaches its monthly peak. Dem<strong>and</strong> reported in columns (e) <strong>and</strong> (f)<br />
must be in megawatts. Footnote any dem<strong>and</strong> not stated on a megawatt basis <strong>and</strong> explain.<br />
6. Report in column (g) the megawatthours shown on bills rendered to the respondent. Report in columns (h) <strong>and</strong> (i) the megawatthours<br />
of power exchanges received <strong>and</strong> delivered, used as the basis for settlement. Do not report net exchange.<br />
7. Report dem<strong>and</strong> charges in column (j), energy charges in column (k), <strong>and</strong> the total of any other types of charges, including<br />
out-of-period adjustments, in column (l). Explain in a footnote all components of the amount shown in column (l). Report in column (m)<br />
the total charge shown on bills received as settlement by the respondent. For power exchanges, report in column (m) the settlement<br />
amount for the net receipt of energy. If more energy was delivered than received, enter a negative amount. If the settlement amount (l)<br />
include credits or charges other than incremental generation expenses, or (2) excludes certain credits or charges covered by the<br />
agreement, provide an explanatory footnote.<br />
8. The data in column (g) through (m) must be totalled on the last line of the schedule. The total amount in column (g) must be<br />
reported as Purchases on Page 401, line 10. The total amount in column (h) must be reported as Exchange Received on Page 401,<br />
line 12. The total amount in column (i) must be reported as Exchange Delivered on Page 401, line 13.<br />
9. Footnote entries as required <strong>and</strong> provide explanations following all required data.<br />
POWER EXCHANGES<br />
MegaWatt Hours<br />
MegaWatt Hours MegaWatt Hours<br />
Purchased<br />
Received<br />
Delivered<br />
(g)<br />
(h)<br />
(i)<br />
181,856<br />
139,241<br />
43,392<br />
48,952<br />
379,669<br />
362,510<br />
289,387<br />
38,586<br />
5,717<br />
5,275<br />
285,781<br />
271,494<br />
COST/SETTLEMENT OF POWER<br />
Line<br />
Dem<strong>and</strong> Charges Energy Charges Other Charges Total (j+k+l) No.<br />
($) ($) ($)<br />
of Settlement ($)<br />
(j)<br />
(k)<br />
(l)<br />
(m)<br />
4,275,042 8,670,776 12,945,818 1<br />
573,887 6,253,690 6,827,577 2<br />
4,275,042 2,026,275 6,301,317 3<br />
4<br />
4,275,042 2,242,080 6,517,122 5<br />
9,842,263 17,257,009 27,099,272 6<br />
9,814,294 16,559,037 26,373,331 7<br />
1,339,760 13,110,583 14,450,343 8<br />
375,045 1,981,097 2,356,142 9<br />
33,395 250,514 283,909 10<br />
18,751 242,813 261,564 11<br />
1,275,860 12,989,989 14,265,849 12<br />
1,231,002 12,345,548 13,576,550 13<br />
14<br />
44,837,023 754,305,279 2,879,319,814 -87,416 3,633,537,677<br />
<strong>FERC</strong> FORM NO. 1 (ED. 12-90) Page 327.3
Name of Respondent<br />
PACIFIC GAS AND ELECTRIC COMPANY<br />
This Report Is:<br />
Date of Report<br />
(1) X An Original<br />
(Mo, Da, Yr)<br />
(2) A Resubmission<br />
04/08/2011<br />
PURCHASED POWER(Account 555) (Continued)<br />
(Including power exchanges)<br />
Year/Period of Report<br />
End of <strong>2010</strong>/Q4<br />
AD - for out-of-period adjustment. Use this code for any accounting adjustments or "true-ups" for service provided in prior reporting<br />
years. Provide an explanation in a footnote for each adjustment.<br />
4. In column (c), identify the <strong>FERC</strong> Rate Schedule Number or Tariff, or, for non-<strong>FERC</strong> jurisdictional sellers, include an appropriate<br />
designation for the contract. On separate lines, list all <strong>FERC</strong> rate schedules, tariffs or contract designations under which service, as<br />
identified in column (b), is provided.<br />
5. For requirements RQ purchases <strong>and</strong> any type of service involving dem<strong>and</strong> charges imposed on a monnthly (or longer) basis, enter<br />
the monthly average billing dem<strong>and</strong> in column (d), the average monthly non-coincident peak (NCP) dem<strong>and</strong> in column (e), <strong>and</strong> the<br />
average monthly coincident peak (CP) dem<strong>and</strong> in column (f). For all other types of service, enter NA in columns (d), (e) <strong>and</strong> (f). Monthly<br />
NCP dem<strong>and</strong> is the maximum metered hourly (60-minute integration) dem<strong>and</strong> in a month. Monthly CP dem<strong>and</strong> is the metered dem<strong>and</strong><br />
during the hour (60-minute integration) in which the supplier's system reaches its monthly peak. Dem<strong>and</strong> reported in columns (e) <strong>and</strong> (f)<br />
must be in megawatts. Footnote any dem<strong>and</strong> not stated on a megawatt basis <strong>and</strong> explain.<br />
6. Report in column (g) the megawatthours shown on bills rendered to the respondent. Report in columns (h) <strong>and</strong> (i) the megawatthours<br />
of power exchanges received <strong>and</strong> delivered, used as the basis for settlement. Do not report net exchange.<br />
7. Report dem<strong>and</strong> charges in column (j), energy charges in column (k), <strong>and</strong> the total of any other types of charges, including<br />
out-of-period adjustments, in column (l). Explain in a footnote all components of the amount shown in column (l). Report in column (m)<br />
the total charge shown on bills received as settlement by the respondent. For power exchanges, report in column (m) the settlement<br />
amount for the net receipt of energy. If more energy was delivered than received, enter a negative amount. If the settlement amount (l)<br />
include credits or charges other than incremental generation expenses, or (2) excludes certain credits or charges covered by the<br />
agreement, provide an explanatory footnote.<br />
8. The data in column (g) through (m) must be totalled on the last line of the schedule. The total amount in column (g) must be<br />
reported as Purchases on Page 401, line 10. The total amount in column (h) must be reported as Exchange Received on Page 401,<br />
line 12. The total amount in column (i) must be reported as Exchange Delivered on Page 401, line 13.<br />
9. Footnote entries as required <strong>and</strong> provide explanations following all required data.<br />
POWER EXCHANGES<br />
MegaWatt Hours<br />
MegaWatt Hours MegaWatt Hours<br />
Purchased<br />
Received<br />
Delivered<br />
(g)<br />
(h)<br />
(i)<br />
32,580<br />
552,540<br />
67,421<br />
18,054<br />
170,763<br />
2,228<br />
10,167<br />
214,147<br />
1,449,711<br />
246,956<br />
261,927<br />
192,928<br />
COST/SETTLEMENT OF POWER<br />
Line<br />
Dem<strong>and</strong> Charges Energy Charges Other Charges Total (j+k+l) No.<br />
($) ($) ($)<br />
of Settlement ($)<br />
(j)<br />
(k)<br />
(l)<br />
(m)<br />
1<br />
56,287 1,210,681 1,266,968 2<br />
20,700,000 -570,561 20,129,439 3<br />
24,244,868 26,427,035 50,671,903 4<br />
1,484,238 3,478,827 4,963,065 5<br />
97,429 925,352 1,022,781 6<br />
866,617 7,667,248 8,533,865 7<br />
5,562 108,768 114,330 8<br />
7,308,797 335,723 7,644,520 9<br />
5,787,598 9,688,654 15,476,252 10<br />
52,979,480 66,150,759 119,130,239 11<br />
9,807,406 11,470,145 21,277,551 12<br />
10,109,554 11,914,056 22,023,610 13<br />
4,970,606 8,583,814 13,554,420 14<br />
44,837,023 754,305,279 2,879,319,814 -87,416 3,633,537,677<br />
<strong>FERC</strong> FORM NO. 1 (ED. 12-90) Page 327.4
Name of Respondent<br />
PACIFIC GAS AND ELECTRIC COMPANY<br />
This Report Is:<br />
Date of Report<br />
(1) X An Original<br />
(Mo, Da, Yr)<br />
(2) A Resubmission<br />
04/08/2011<br />
PURCHASED POWER(Account 555) (Continued)<br />
(Including power exchanges)<br />
Year/Period of Report<br />
End of <strong>2010</strong>/Q4<br />
AD - for out-of-period adjustment. Use this code for any accounting adjustments or "true-ups" for service provided in prior reporting<br />
years. Provide an explanation in a footnote for each adjustment.<br />
4. In column (c), identify the <strong>FERC</strong> Rate Schedule Number or Tariff, or, for non-<strong>FERC</strong> jurisdictional sellers, include an appropriate<br />
designation for the contract. On separate lines, list all <strong>FERC</strong> rate schedules, tariffs or contract designations under which service, as<br />
identified in column (b), is provided.<br />
5. For requirements RQ purchases <strong>and</strong> any type of service involving dem<strong>and</strong> charges imposed on a monnthly (or longer) basis, enter<br />
the monthly average billing dem<strong>and</strong> in column (d), the average monthly non-coincident peak (NCP) dem<strong>and</strong> in column (e), <strong>and</strong> the<br />
average monthly coincident peak (CP) dem<strong>and</strong> in column (f). For all other types of service, enter NA in columns (d), (e) <strong>and</strong> (f). Monthly<br />
NCP dem<strong>and</strong> is the maximum metered hourly (60-minute integration) dem<strong>and</strong> in a month. Monthly CP dem<strong>and</strong> is the metered dem<strong>and</strong><br />
during the hour (60-minute integration) in which the supplier's system reaches its monthly peak. Dem<strong>and</strong> reported in columns (e) <strong>and</strong> (f)<br />
must be in megawatts. Footnote any dem<strong>and</strong> not stated on a megawatt basis <strong>and</strong> explain.<br />
6. Report in column (g) the megawatthours shown on bills rendered to the respondent. Report in columns (h) <strong>and</strong> (i) the megawatthours<br />
of power exchanges received <strong>and</strong> delivered, used as the basis for settlement. Do not report net exchange.<br />
7. Report dem<strong>and</strong> charges in column (j), energy charges in column (k), <strong>and</strong> the total of any other types of charges, including<br />
out-of-period adjustments, in column (l). Explain in a footnote all components of the amount shown in column (l). Report in column (m)<br />
the total charge shown on bills received as settlement by the respondent. For power exchanges, report in column (m) the settlement<br />
amount for the net receipt of energy. If more energy was delivered than received, enter a negative amount. If the settlement amount (l)<br />
include credits or charges other than incremental generation expenses, or (2) excludes certain credits or charges covered by the<br />
agreement, provide an explanatory footnote.<br />
8. The data in column (g) through (m) must be totalled on the last line of the schedule. The total amount in column (g) must be<br />
reported as Purchases on Page 401, line 10. The total amount in column (h) must be reported as Exchange Received on Page 401,<br />
line 12. The total amount in column (i) must be reported as Exchange Delivered on Page 401, line 13.<br />
9. Footnote entries as required <strong>and</strong> provide explanations following all required data.<br />
POWER EXCHANGES<br />
MegaWatt Hours<br />
MegaWatt Hours MegaWatt Hours<br />
Purchased<br />
Received<br />
Delivered<br />
(g)<br />
(h)<br />
(i)<br />
10,911<br />
107,589<br />
96<br />
8,466<br />
189,286<br />
16,241<br />
132,636<br />
1,190<br />
309,754<br />
198,975<br />
150<br />
139,059<br />
COST/SETTLEMENT OF POWER<br />
Line<br />
Dem<strong>and</strong> Charges Energy Charges Other Charges Total (j+k+l) No.<br />
($) ($) ($)<br />
of Settlement ($)<br />
(j)<br />
(k)<br />
(l)<br />
(m)<br />
1,355,199 526,079 1,881,278 1<br />
8,422,546 5,232,132 13,654,678 2<br />
3<br />
68 4,440 4,508 4<br />
41,745 385,950 427,695 5<br />
4,768,210 8,206,056 12,974,266 6<br />
4,955,500 655,635 5,611,135 7<br />
10,629,862 6,887,638 17,517,500 8<br />
625 54,161 54,786 9<br />
10<br />
6,348,369 14,105,126 20,453,495 11<br />
4,689,994 9,036,514 13,726,508 12<br />
600 7,671 8,271 13<br />
7,949,734 6,596,172 14,545,906 14<br />
44,837,023 754,305,279 2,879,319,814 -87,416 3,633,537,677<br />
<strong>FERC</strong> FORM NO. 1 (ED. 12-90) Page 327.5
Name of Respondent<br />
PACIFIC GAS AND ELECTRIC COMPANY<br />
This Report Is:<br />
Date of Report<br />
(1) X An Original<br />
(Mo, Da, Yr)<br />
(2) A Resubmission<br />
04/08/2011<br />
PURCHASED POWER(Account 555) (Continued)<br />
(Including power exchanges)<br />
Year/Period of Report<br />
End of <strong>2010</strong>/Q4<br />
AD - for out-of-period adjustment. Use this code for any accounting adjustments or "true-ups" for service provided in prior reporting<br />
years. Provide an explanation in a footnote for each adjustment.<br />
4. In column (c), identify the <strong>FERC</strong> Rate Schedule Number or Tariff, or, for non-<strong>FERC</strong> jurisdictional sellers, include an appropriate<br />
designation for the contract. On separate lines, list all <strong>FERC</strong> rate schedules, tariffs or contract designations under which service, as<br />
identified in column (b), is provided.<br />
5. For requirements RQ purchases <strong>and</strong> any type of service involving dem<strong>and</strong> charges imposed on a monnthly (or longer) basis, enter<br />
the monthly average billing dem<strong>and</strong> in column (d), the average monthly non-coincident peak (NCP) dem<strong>and</strong> in column (e), <strong>and</strong> the<br />
average monthly coincident peak (CP) dem<strong>and</strong> in column (f). For all other types of service, enter NA in columns (d), (e) <strong>and</strong> (f). Monthly<br />
NCP dem<strong>and</strong> is the maximum metered hourly (60-minute integration) dem<strong>and</strong> in a month. Monthly CP dem<strong>and</strong> is the metered dem<strong>and</strong><br />
during the hour (60-minute integration) in which the supplier's system reaches its monthly peak. Dem<strong>and</strong> reported in columns (e) <strong>and</strong> (f)<br />
must be in megawatts. Footnote any dem<strong>and</strong> not stated on a megawatt basis <strong>and</strong> explain.<br />
6. Report in column (g) the megawatthours shown on bills rendered to the respondent. Report in columns (h) <strong>and</strong> (i) the megawatthours<br />
of power exchanges received <strong>and</strong> delivered, used as the basis for settlement. Do not report net exchange.<br />
7. Report dem<strong>and</strong> charges in column (j), energy charges in column (k), <strong>and</strong> the total of any other types of charges, including<br />
out-of-period adjustments, in column (l). Explain in a footnote all components of the amount shown in column (l). Report in column (m)<br />
the total charge shown on bills received as settlement by the respondent. For power exchanges, report in column (m) the settlement<br />
amount for the net receipt of energy. If more energy was delivered than received, enter a negative amount. If the settlement amount (l)<br />
include credits or charges other than incremental generation expenses, or (2) excludes certain credits or charges covered by the<br />
agreement, provide an explanatory footnote.<br />
8. The data in column (g) through (m) must be totalled on the last line of the schedule. The total amount in column (g) must be<br />
reported as Purchases on Page 401, line 10. The total amount in column (h) must be reported as Exchange Received on Page 401,<br />
line 12. The total amount in column (i) must be reported as Exchange Delivered on Page 401, line 13.<br />
9. Footnote entries as required <strong>and</strong> provide explanations following all required data.<br />
POWER EXCHANGES<br />
MegaWatt Hours<br />
MegaWatt Hours MegaWatt Hours<br />
Purchased<br />
Received<br />
Delivered<br />
(g)<br />
(h)<br />
(i)<br />
116<br />
12,683<br />
130,629<br />
863<br />
39,651<br />
2,374<br />
6,149<br />
18,349<br />
8,184<br />
23,195<br />
143,975<br />
COST/SETTLEMENT OF POWER<br />
Line<br />
Dem<strong>and</strong> Charges Energy Charges Other Charges Total (j+k+l) No.<br />
($) ($) ($)<br />
of Settlement ($)<br />
(j)<br />
(k)<br />
(l)<br />
(m)<br />
434 5,354 5,788 1<br />
39,995 532,275 572,270 2<br />
8,356,525 6,861,055 15,217,580 3<br />
4<br />
3,500 39,799 43,299 5<br />
6<br />
201,507 2,652,408 2,853,915 7<br />
8,427 112,911 121,338 8<br />
96,993 409,819 506,812 9<br />
300,712 1,227,488 1,528,200 10<br />
63,436 545,115 608,551 11<br />
12<br />
370,882 1,572,614 1,943,496 13<br />
3,801,482 9,674,806 13,476,288 14<br />
44,837,023 754,305,279 2,879,319,814 -87,416 3,633,537,677<br />
<strong>FERC</strong> FORM NO. 1 (ED. 12-90) Page 327.6
Name of Respondent<br />
PACIFIC GAS AND ELECTRIC COMPANY<br />
This Report Is:<br />
Date of Report<br />
(1) X An Original<br />
(Mo, Da, Yr)<br />
(2) A Resubmission<br />
04/08/2011<br />
PURCHASED POWER(Account 555) (Continued)<br />
(Including power exchanges)<br />
Year/Period of Report<br />
End of <strong>2010</strong>/Q4<br />
AD - for out-of-period adjustment. Use this code for any accounting adjustments or "true-ups" for service provided in prior reporting<br />
years. Provide an explanation in a footnote for each adjustment.<br />
4. In column (c), identify the <strong>FERC</strong> Rate Schedule Number or Tariff, or, for non-<strong>FERC</strong> jurisdictional sellers, include an appropriate<br />
designation for the contract. On separate lines, list all <strong>FERC</strong> rate schedules, tariffs or contract designations under which service, as<br />
identified in column (b), is provided.<br />
5. For requirements RQ purchases <strong>and</strong> any type of service involving dem<strong>and</strong> charges imposed on a monnthly (or longer) basis, enter<br />
the monthly average billing dem<strong>and</strong> in column (d), the average monthly non-coincident peak (NCP) dem<strong>and</strong> in column (e), <strong>and</strong> the<br />
average monthly coincident peak (CP) dem<strong>and</strong> in column (f). For all other types of service, enter NA in columns (d), (e) <strong>and</strong> (f). Monthly<br />
NCP dem<strong>and</strong> is the maximum metered hourly (60-minute integration) dem<strong>and</strong> in a month. Monthly CP dem<strong>and</strong> is the metered dem<strong>and</strong><br />
during the hour (60-minute integration) in which the supplier's system reaches its monthly peak. Dem<strong>and</strong> reported in columns (e) <strong>and</strong> (f)<br />
must be in megawatts. Footnote any dem<strong>and</strong> not stated on a megawatt basis <strong>and</strong> explain.<br />
6. Report in column (g) the megawatthours shown on bills rendered to the respondent. Report in columns (h) <strong>and</strong> (i) the megawatthours<br />
of power exchanges received <strong>and</strong> delivered, used as the basis for settlement. Do not report net exchange.<br />
7. Report dem<strong>and</strong> charges in column (j), energy charges in column (k), <strong>and</strong> the total of any other types of charges, including<br />
out-of-period adjustments, in column (l). Explain in a footnote all components of the amount shown in column (l). Report in column (m)<br />
the total charge shown on bills received as settlement by the respondent. For power exchanges, report in column (m) the settlement<br />
amount for the net receipt of energy. If more energy was delivered than received, enter a negative amount. If the settlement amount (l)<br />
include credits or charges other than incremental generation expenses, or (2) excludes certain credits or charges covered by the<br />
agreement, provide an explanatory footnote.<br />
8. The data in column (g) through (m) must be totalled on the last line of the schedule. The total amount in column (g) must be<br />
reported as Purchases on Page 401, line 10. The total amount in column (h) must be reported as Exchange Received on Page 401,<br />
line 12. The total amount in column (i) must be reported as Exchange Delivered on Page 401, line 13.<br />
9. Footnote entries as required <strong>and</strong> provide explanations following all required data.<br />
POWER EXCHANGES<br />
MegaWatt Hours<br />
MegaWatt Hours MegaWatt Hours<br />
Purchased<br />
Received<br />
Delivered<br />
(g)<br />
(h)<br />
(i)<br />
156,905<br />
143,749<br />
150,767<br />
156,655<br />
165,707<br />
37,474<br />
380<br />
5,420<br />
131,921<br />
343,742<br />
289,444<br />
COST/SETTLEMENT OF POWER<br />
Line<br />
Dem<strong>and</strong> Charges Energy Charges Other Charges Total (j+k+l) No.<br />
($) ($) ($)<br />
of Settlement ($)<br />
(j)<br />
(k)<br />
(l)<br />
(m)<br />
3,926,834 10,322,250 14,249,084 1<br />
3,799,463 9,668,848 13,468,311 2<br />
3,660,236 9,917,062 13,577,298 3<br />
3,950,017 10,335,924 14,285,941 4<br />
4,439,684 10,986,379 15,426,063 5<br />
152,816 3,289,716 3,442,532 6<br />
1,034 18,215 19,249 7<br />
8<br />
22,973 243,007 265,980 9<br />
10<br />
556,166 6,034,591 6,590,757 11<br />
12<br />
3,168,897 25,358,932 28,527,829 13<br />
27,276,984 27,276,984 14<br />
44,837,023 754,305,279 2,879,319,814 -87,416 3,633,537,677<br />
<strong>FERC</strong> FORM NO. 1 (ED. 12-90) Page 327.7
Name of Respondent<br />
PACIFIC GAS AND ELECTRIC COMPANY<br />
This Report Is:<br />
Date of Report<br />
(1) X An Original<br />
(Mo, Da, Yr)<br />
(2) A Resubmission<br />
04/08/2011<br />
PURCHASED POWER(Account 555) (Continued)<br />
(Including power exchanges)<br />
Year/Period of Report<br />
End of <strong>2010</strong>/Q4<br />
AD - for out-of-period adjustment. Use this code for any accounting adjustments or "true-ups" for service provided in prior reporting<br />
years. Provide an explanation in a footnote for each adjustment.<br />
4. In column (c), identify the <strong>FERC</strong> Rate Schedule Number or Tariff, or, for non-<strong>FERC</strong> jurisdictional sellers, include an appropriate<br />
designation for the contract. On separate lines, list all <strong>FERC</strong> rate schedules, tariffs or contract designations under which service, as<br />
identified in column (b), is provided.<br />
5. For requirements RQ purchases <strong>and</strong> any type of service involving dem<strong>and</strong> charges imposed on a monnthly (or longer) basis, enter<br />
the monthly average billing dem<strong>and</strong> in column (d), the average monthly non-coincident peak (NCP) dem<strong>and</strong> in column (e), <strong>and</strong> the<br />
average monthly coincident peak (CP) dem<strong>and</strong> in column (f). For all other types of service, enter NA in columns (d), (e) <strong>and</strong> (f). Monthly<br />
NCP dem<strong>and</strong> is the maximum metered hourly (60-minute integration) dem<strong>and</strong> in a month. Monthly CP dem<strong>and</strong> is the metered dem<strong>and</strong><br />
during the hour (60-minute integration) in which the supplier's system reaches its monthly peak. Dem<strong>and</strong> reported in columns (e) <strong>and</strong> (f)<br />
must be in megawatts. Footnote any dem<strong>and</strong> not stated on a megawatt basis <strong>and</strong> explain.<br />
6. Report in column (g) the megawatthours shown on bills rendered to the respondent. Report in columns (h) <strong>and</strong> (i) the megawatthours<br />
of power exchanges received <strong>and</strong> delivered, used as the basis for settlement. Do not report net exchange.<br />
7. Report dem<strong>and</strong> charges in column (j), energy charges in column (k), <strong>and</strong> the total of any other types of charges, including<br />
out-of-period adjustments, in column (l). Explain in a footnote all components of the amount shown in column (l). Report in column (m)<br />
the total charge shown on bills received as settlement by the respondent. For power exchanges, report in column (m) the settlement<br />
amount for the net receipt of energy. If more energy was delivered than received, enter a negative amount. If the settlement amount (l)<br />
include credits or charges other than incremental generation expenses, or (2) excludes certain credits or charges covered by the<br />
agreement, provide an explanatory footnote.<br />
8. The data in column (g) through (m) must be totalled on the last line of the schedule. The total amount in column (g) must be<br />
reported as Purchases on Page 401, line 10. The total amount in column (h) must be reported as Exchange Received on Page 401,<br />
line 12. The total amount in column (i) must be reported as Exchange Delivered on Page 401, line 13.<br />
9. Footnote entries as required <strong>and</strong> provide explanations following all required data.<br />
POWER EXCHANGES<br />
MegaWatt Hours<br />
MegaWatt Hours MegaWatt Hours<br />
Purchased<br />
Received<br />
Delivered<br />
(g)<br />
(h)<br />
(i)<br />
-37,439<br />
274,234<br />
1,038<br />
4,831<br />
612<br />
11,948<br />
78,111<br />
8,525<br />
8,689<br />
6,970<br />
62,855<br />
2,503<br />
COST/SETTLEMENT OF POWER<br />
Line<br />
Dem<strong>and</strong> Charges Energy Charges Other Charges Total (j+k+l) No.<br />
($) ($) ($)<br />
of Settlement ($)<br />
(j)<br />
(k)<br />
(l)<br />
(m)<br />
-91,770 -2,796,136 -2,887,906 1<br />
7,663,505 18,464,267 26,127,772 2<br />
3<br />
1,711 44,453 46,164 4<br />
5<br />
61,558 233,593 295,151 6<br />
3,778 27,761 31,539 7<br />
168,379 840,145 1,008,524 8<br />
1,932,941 4,803,132 6,736,073 9<br />
230,702 513,255 743,957 10<br />
217,318 534,769 752,087 11<br />
33,314 457,218 490,532 12<br />
710,441 2,712,271 3,422,712 13<br />
20,458 146,632 167,090 14<br />
44,837,023 754,305,279 2,879,319,814 -87,416 3,633,537,677<br />
<strong>FERC</strong> FORM NO. 1 (ED. 12-90) Page 327.8
Name of Respondent<br />
PACIFIC GAS AND ELECTRIC COMPANY<br />
This Report Is:<br />
Date of Report<br />
(1) X An Original<br />
(Mo, Da, Yr)<br />
(2) A Resubmission<br />
04/08/2011<br />
PURCHASED POWER(Account 555) (Continued)<br />
(Including power exchanges)<br />
Year/Period of Report<br />
End of <strong>2010</strong>/Q4<br />
AD - for out-of-period adjustment. Use this code for any accounting adjustments or "true-ups" for service provided in prior reporting<br />
years. Provide an explanation in a footnote for each adjustment.<br />
4. In column (c), identify the <strong>FERC</strong> Rate Schedule Number or Tariff, or, for non-<strong>FERC</strong> jurisdictional sellers, include an appropriate<br />
designation for the contract. On separate lines, list all <strong>FERC</strong> rate schedules, tariffs or contract designations under which service, as<br />
identified in column (b), is provided.<br />
5. For requirements RQ purchases <strong>and</strong> any type of service involving dem<strong>and</strong> charges imposed on a monnthly (or longer) basis, enter<br />
the monthly average billing dem<strong>and</strong> in column (d), the average monthly non-coincident peak (NCP) dem<strong>and</strong> in column (e), <strong>and</strong> the<br />
average monthly coincident peak (CP) dem<strong>and</strong> in column (f). For all other types of service, enter NA in columns (d), (e) <strong>and</strong> (f). Monthly<br />
NCP dem<strong>and</strong> is the maximum metered hourly (60-minute integration) dem<strong>and</strong> in a month. Monthly CP dem<strong>and</strong> is the metered dem<strong>and</strong><br />
during the hour (60-minute integration) in which the supplier's system reaches its monthly peak. Dem<strong>and</strong> reported in columns (e) <strong>and</strong> (f)<br />
must be in megawatts. Footnote any dem<strong>and</strong> not stated on a megawatt basis <strong>and</strong> explain.<br />
6. Report in column (g) the megawatthours shown on bills rendered to the respondent. Report in columns (h) <strong>and</strong> (i) the megawatthours<br />
of power exchanges received <strong>and</strong> delivered, used as the basis for settlement. Do not report net exchange.<br />
7. Report dem<strong>and</strong> charges in column (j), energy charges in column (k), <strong>and</strong> the total of any other types of charges, including<br />
out-of-period adjustments, in column (l). Explain in a footnote all components of the amount shown in column (l). Report in column (m)<br />
the total charge shown on bills received as settlement by the respondent. For power exchanges, report in column (m) the settlement<br />
amount for the net receipt of energy. If more energy was delivered than received, enter a negative amount. If the settlement amount (l)<br />
include credits or charges other than incremental generation expenses, or (2) excludes certain credits or charges covered by the<br />
agreement, provide an explanatory footnote.<br />
8. The data in column (g) through (m) must be totalled on the last line of the schedule. The total amount in column (g) must be<br />
reported as Purchases on Page 401, line 10. The total amount in column (h) must be reported as Exchange Received on Page 401,<br />
line 12. The total amount in column (i) must be reported as Exchange Delivered on Page 401, line 13.<br />
9. Footnote entries as required <strong>and</strong> provide explanations following all required data.<br />
POWER EXCHANGES<br />
MegaWatt Hours<br />
MegaWatt Hours MegaWatt Hours<br />
Purchased<br />
Received<br />
Delivered<br />
(g)<br />
(h)<br />
(i)<br />
34,112<br />
6,488<br />
30,134<br />
10,178<br />
25,474<br />
8,367<br />
5,444<br />
11,761<br />
4,024<br />
15,639<br />
2,547<br />
1,325<br />
8,491<br />
9,012<br />
COST/SETTLEMENT OF POWER<br />
Line<br />
Dem<strong>and</strong> Charges Energy Charges Other Charges Total (j+k+l) No.<br />
($) ($) ($)<br />
of Settlement ($)<br />
(j)<br />
(k)<br />
(l)<br />
(m)<br />
284,042 2,060,663 2,344,705 1<br />
167,678 393,049 560,727 2<br />
1,251,392 2,214,911 3,466,303 3<br />
188,778 463,482 652,260 4<br />
386,416 1,216,711 1,603,127 5<br />
114,510 406,175 520,685 6<br />
36,271 225,630 261,901 7<br />
80,781 502,470 583,251 8<br />
59,576 279,971 339,547 9<br />
327,190 988,861 1,316,051 10<br />
5,613 190,158 195,771 11<br />
6,678 89,191 95,869 12<br />
45,770 404,888 450,658 13<br />
161,476 412,772 574,248 14<br />
44,837,023 754,305,279 2,879,319,814 -87,416 3,633,537,677<br />
<strong>FERC</strong> FORM NO. 1 (ED. 12-90) Page 327.9
Name of Respondent<br />
PACIFIC GAS AND ELECTRIC COMPANY<br />
This Report Is:<br />
Date of Report<br />
(1) X An Original<br />
(Mo, Da, Yr)<br />
(2) A Resubmission<br />
04/08/2011<br />
PURCHASED POWER(Account 555) (Continued)<br />
(Including power exchanges)<br />
Year/Period of Report<br />
End of <strong>2010</strong>/Q4<br />
AD - for out-of-period adjustment. Use this code for any accounting adjustments or "true-ups" for service provided in prior reporting<br />
years. Provide an explanation in a footnote for each adjustment.<br />
4. In column (c), identify the <strong>FERC</strong> Rate Schedule Number or Tariff, or, for non-<strong>FERC</strong> jurisdictional sellers, include an appropriate<br />
designation for the contract. On separate lines, list all <strong>FERC</strong> rate schedules, tariffs or contract designations under which service, as<br />
identified in column (b), is provided.<br />
5. For requirements RQ purchases <strong>and</strong> any type of service involving dem<strong>and</strong> charges imposed on a monnthly (or longer) basis, enter<br />
the monthly average billing dem<strong>and</strong> in column (d), the average monthly non-coincident peak (NCP) dem<strong>and</strong> in column (e), <strong>and</strong> the<br />
average monthly coincident peak (CP) dem<strong>and</strong> in column (f). For all other types of service, enter NA in columns (d), (e) <strong>and</strong> (f). Monthly<br />
NCP dem<strong>and</strong> is the maximum metered hourly (60-minute integration) dem<strong>and</strong> in a month. Monthly CP dem<strong>and</strong> is the metered dem<strong>and</strong><br />
during the hour (60-minute integration) in which the supplier's system reaches its monthly peak. Dem<strong>and</strong> reported in columns (e) <strong>and</strong> (f)<br />
must be in megawatts. Footnote any dem<strong>and</strong> not stated on a megawatt basis <strong>and</strong> explain.<br />
6. Report in column (g) the megawatthours shown on bills rendered to the respondent. Report in columns (h) <strong>and</strong> (i) the megawatthours<br />
of power exchanges received <strong>and</strong> delivered, used as the basis for settlement. Do not report net exchange.<br />
7. Report dem<strong>and</strong> charges in column (j), energy charges in column (k), <strong>and</strong> the total of any other types of charges, including<br />
out-of-period adjustments, in column (l). Explain in a footnote all components of the amount shown in column (l). Report in column (m)<br />
the total charge shown on bills received as settlement by the respondent. For power exchanges, report in column (m) the settlement<br />
amount for the net receipt of energy. If more energy was delivered than received, enter a negative amount. If the settlement amount (l)<br />
include credits or charges other than incremental generation expenses, or (2) excludes certain credits or charges covered by the<br />
agreement, provide an explanatory footnote.<br />
8. The data in column (g) through (m) must be totalled on the last line of the schedule. The total amount in column (g) must be<br />
reported as Purchases on Page 401, line 10. The total amount in column (h) must be reported as Exchange Received on Page 401,<br />
line 12. The total amount in column (i) must be reported as Exchange Delivered on Page 401, line 13.<br />
9. Footnote entries as required <strong>and</strong> provide explanations following all required data.<br />
POWER EXCHANGES<br />
MegaWatt Hours<br />
MegaWatt Hours MegaWatt Hours<br />
Purchased<br />
Received<br />
Delivered<br />
(g)<br />
(h)<br />
(i)<br />
3,382<br />
3,917<br />
1,986<br />
19,361<br />
4,665<br />
13,902<br />
5,245<br />
1,606<br />
14,282<br />
1,695<br />
76,566<br />
3,202<br />
COST/SETTLEMENT OF POWER<br />
Line<br />
Dem<strong>and</strong> Charges Energy Charges Other Charges Total (j+k+l) No.<br />
($) ($) ($)<br />
of Settlement ($)<br />
(j)<br />
(k)<br />
(l)<br />
(m)<br />
69,343 226,471 295,814 1<br />
47,887 281,673 329,560 2<br />
3<br />
48,436 116,652 165,088 4<br />
274,845 1,327,631 1,602,476 5<br />
92,881 303,686 396,567 6<br />
80,877 606,290 687,167 7<br />
32,670 227,228 259,898 8<br />
17,790 116,507 134,297 9<br />
37,023 692,608 729,631 10<br />
18,108 121,827 139,935 11<br />
2,594,008 3,341,958 5,935,966 12<br />
13<br />
42,537 227,299 269,836 14<br />
44,837,023 754,305,279 2,879,319,814 -87,416 3,633,537,677<br />
<strong>FERC</strong> FORM NO. 1 (ED. 12-90) Page 327.10
Name of Respondent<br />
PACIFIC GAS AND ELECTRIC COMPANY<br />
This Report Is:<br />
Date of Report<br />
(1) X An Original<br />
(Mo, Da, Yr)<br />
(2) A Resubmission<br />
04/08/2011<br />
PURCHASED POWER(Account 555) (Continued)<br />
(Including power exchanges)<br />
Year/Period of Report<br />
End of <strong>2010</strong>/Q4<br />
AD - for out-of-period adjustment. Use this code for any accounting adjustments or "true-ups" for service provided in prior reporting<br />
years. Provide an explanation in a footnote for each adjustment.<br />
4. In column (c), identify the <strong>FERC</strong> Rate Schedule Number or Tariff, or, for non-<strong>FERC</strong> jurisdictional sellers, include an appropriate<br />
designation for the contract. On separate lines, list all <strong>FERC</strong> rate schedules, tariffs or contract designations under which service, as<br />
identified in column (b), is provided.<br />
5. For requirements RQ purchases <strong>and</strong> any type of service involving dem<strong>and</strong> charges imposed on a monnthly (or longer) basis, enter<br />
the monthly average billing dem<strong>and</strong> in column (d), the average monthly non-coincident peak (NCP) dem<strong>and</strong> in column (e), <strong>and</strong> the<br />
average monthly coincident peak (CP) dem<strong>and</strong> in column (f). For all other types of service, enter NA in columns (d), (e) <strong>and</strong> (f). Monthly<br />
NCP dem<strong>and</strong> is the maximum metered hourly (60-minute integration) dem<strong>and</strong> in a month. Monthly CP dem<strong>and</strong> is the metered dem<strong>and</strong><br />
during the hour (60-minute integration) in which the supplier's system reaches its monthly peak. Dem<strong>and</strong> reported in columns (e) <strong>and</strong> (f)<br />
must be in megawatts. Footnote any dem<strong>and</strong> not stated on a megawatt basis <strong>and</strong> explain.<br />
6. Report in column (g) the megawatthours shown on bills rendered to the respondent. Report in columns (h) <strong>and</strong> (i) the megawatthours<br />
of power exchanges received <strong>and</strong> delivered, used as the basis for settlement. Do not report net exchange.<br />
7. Report dem<strong>and</strong> charges in column (j), energy charges in column (k), <strong>and</strong> the total of any other types of charges, including<br />
out-of-period adjustments, in column (l). Explain in a footnote all components of the amount shown in column (l). Report in column (m)<br />
the total charge shown on bills received as settlement by the respondent. For power exchanges, report in column (m) the settlement<br />
amount for the net receipt of energy. If more energy was delivered than received, enter a negative amount. If the settlement amount (l)<br />
include credits or charges other than incremental generation expenses, or (2) excludes certain credits or charges covered by the<br />
agreement, provide an explanatory footnote.<br />
8. The data in column (g) through (m) must be totalled on the last line of the schedule. The total amount in column (g) must be<br />
reported as Purchases on Page 401, line 10. The total amount in column (h) must be reported as Exchange Received on Page 401,<br />
line 12. The total amount in column (i) must be reported as Exchange Delivered on Page 401, line 13.<br />
9. Footnote entries as required <strong>and</strong> provide explanations following all required data.<br />
POWER EXCHANGES<br />
MegaWatt Hours<br />
MegaWatt Hours MegaWatt Hours<br />
Purchased<br />
Received<br />
Delivered<br />
(g)<br />
(h)<br />
(i)<br />
9,915<br />
6,132<br />
30,014<br />
24,684<br />
21,293<br />
72,853<br />
9,177<br />
15,823<br />
COST/SETTLEMENT OF POWER<br />
Line<br />
Dem<strong>and</strong> Charges Energy Charges Other Charges Total (j+k+l) No.<br />
($) ($) ($)<br />
of Settlement ($)<br />
(j)<br />
(k)<br />
(l)<br />
(m)<br />
1<br />
2<br />
3<br />
4<br />
214,198 424,361 638,559 5<br />
109,293 366,300 475,593 6<br />
534,204 1,799,413 2,333,617 7<br />
467,559 1,484,155 1,951,714 8<br />
9<br />
10<br />
378,487 1,313,421 1,691,908 11<br />
1,590,651 4,393,965 5,984,616 12<br />
212,202 551,549 763,751 13<br />
333,629 962,125 1,295,754 14<br />
44,837,023 754,305,279 2,879,319,814 -87,416 3,633,537,677<br />
<strong>FERC</strong> FORM NO. 1 (ED. 12-90) Page 327.11
Name of Respondent<br />
PACIFIC GAS AND ELECTRIC COMPANY<br />
This Report Is:<br />
Date of Report<br />
(1) X An Original<br />
(Mo, Da, Yr)<br />
(2) A Resubmission<br />
04/08/2011<br />
PURCHASED POWER(Account 555) (Continued)<br />
(Including power exchanges)<br />
Year/Period of Report<br />
End of <strong>2010</strong>/Q4<br />
AD - for out-of-period adjustment. Use this code for any accounting adjustments or "true-ups" for service provided in prior reporting<br />
years. Provide an explanation in a footnote for each adjustment.<br />
4. In column (c), identify the <strong>FERC</strong> Rate Schedule Number or Tariff, or, for non-<strong>FERC</strong> jurisdictional sellers, include an appropriate<br />
designation for the contract. On separate lines, list all <strong>FERC</strong> rate schedules, tariffs or contract designations under which service, as<br />
identified in column (b), is provided.<br />
5. For requirements RQ purchases <strong>and</strong> any type of service involving dem<strong>and</strong> charges imposed on a monnthly (or longer) basis, enter<br />
the monthly average billing dem<strong>and</strong> in column (d), the average monthly non-coincident peak (NCP) dem<strong>and</strong> in column (e), <strong>and</strong> the<br />
average monthly coincident peak (CP) dem<strong>and</strong> in column (f). For all other types of service, enter NA in columns (d), (e) <strong>and</strong> (f). Monthly<br />
NCP dem<strong>and</strong> is the maximum metered hourly (60-minute integration) dem<strong>and</strong> in a month. Monthly CP dem<strong>and</strong> is the metered dem<strong>and</strong><br />
during the hour (60-minute integration) in which the supplier's system reaches its monthly peak. Dem<strong>and</strong> reported in columns (e) <strong>and</strong> (f)<br />
must be in megawatts. Footnote any dem<strong>and</strong> not stated on a megawatt basis <strong>and</strong> explain.<br />
6. Report in column (g) the megawatthours shown on bills rendered to the respondent. Report in columns (h) <strong>and</strong> (i) the megawatthours<br />
of power exchanges received <strong>and</strong> delivered, used as the basis for settlement. Do not report net exchange.<br />
7. Report dem<strong>and</strong> charges in column (j), energy charges in column (k), <strong>and</strong> the total of any other types of charges, including<br />
out-of-period adjustments, in column (l). Explain in a footnote all components of the amount shown in column (l). Report in column (m)<br />
the total charge shown on bills received as settlement by the respondent. For power exchanges, report in column (m) the settlement<br />
amount for the net receipt of energy. If more energy was delivered than received, enter a negative amount. If the settlement amount (l)<br />
include credits or charges other than incremental generation expenses, or (2) excludes certain credits or charges covered by the<br />
agreement, provide an explanatory footnote.<br />
8. The data in column (g) through (m) must be totalled on the last line of the schedule. The total amount in column (g) must be<br />
reported as Purchases on Page 401, line 10. The total amount in column (h) must be reported as Exchange Received on Page 401,<br />
line 12. The total amount in column (i) must be reported as Exchange Delivered on Page 401, line 13.<br />
9. Footnote entries as required <strong>and</strong> provide explanations following all required data.<br />
POWER EXCHANGES<br />
MegaWatt Hours<br />
MegaWatt Hours MegaWatt Hours<br />
Purchased<br />
Received<br />
Delivered<br />
(g)<br />
(h)<br />
(i)<br />
251,182<br />
15,895<br />
10,291<br />
23,872<br />
38,471<br />
1,937<br />
71,091<br />
23,068<br />
13,272<br />
31,497<br />
10,149<br />
177<br />
COST/SETTLEMENT OF POWER<br />
Line<br />
Dem<strong>and</strong> Charges Energy Charges Other Charges Total (j+k+l) No.<br />
($) ($) ($)<br />
of Settlement ($)<br />
(j)<br />
(k)<br />
(l)<br />
(m)<br />
5,015,507 14,379,099 19,394,606 1<br />
279,712 931,280 1,210,992 2<br />
229,581 619,233 848,814 3<br />
557,870 1,448,967 2,006,837 4<br />
913,530 2,332,043 3,245,573 5<br />
45,243 117,587 162,830 6<br />
1,670,578 4,287,213 5,957,791 7<br />
592,592 1,436,269 2,028,861 8<br />
9<br />
288,460 802,758 1,091,218 10<br />
635,331 1,910,479 2,545,810 11<br />
189,249 435,324 624,573 12<br />
11,887 11,887 13<br />
14<br />
44,837,023 754,305,279 2,879,319,814 -87,416 3,633,537,677<br />
<strong>FERC</strong> FORM NO. 1 (ED. 12-90) Page 327.12
Name of Respondent<br />
PACIFIC GAS AND ELECTRIC COMPANY<br />
This Report Is:<br />
Date of Report<br />
(1) X An Original<br />
(Mo, Da, Yr)<br />
(2) A Resubmission<br />
04/08/2011<br />
PURCHASED POWER(Account 555) (Continued)<br />
(Including power exchanges)<br />
Year/Period of Report<br />
End of <strong>2010</strong>/Q4<br />
AD - for out-of-period adjustment. Use this code for any accounting adjustments or "true-ups" for service provided in prior reporting<br />
years. Provide an explanation in a footnote for each adjustment.<br />
4. In column (c), identify the <strong>FERC</strong> Rate Schedule Number or Tariff, or, for non-<strong>FERC</strong> jurisdictional sellers, include an appropriate<br />
designation for the contract. On separate lines, list all <strong>FERC</strong> rate schedules, tariffs or contract designations under which service, as<br />
identified in column (b), is provided.<br />
5. For requirements RQ purchases <strong>and</strong> any type of service involving dem<strong>and</strong> charges imposed on a monnthly (or longer) basis, enter<br />
the monthly average billing dem<strong>and</strong> in column (d), the average monthly non-coincident peak (NCP) dem<strong>and</strong> in column (e), <strong>and</strong> the<br />
average monthly coincident peak (CP) dem<strong>and</strong> in column (f). For all other types of service, enter NA in columns (d), (e) <strong>and</strong> (f). Monthly<br />
NCP dem<strong>and</strong> is the maximum metered hourly (60-minute integration) dem<strong>and</strong> in a month. Monthly CP dem<strong>and</strong> is the metered dem<strong>and</strong><br />
during the hour (60-minute integration) in which the supplier's system reaches its monthly peak. Dem<strong>and</strong> reported in columns (e) <strong>and</strong> (f)<br />
must be in megawatts. Footnote any dem<strong>and</strong> not stated on a megawatt basis <strong>and</strong> explain.<br />
6. Report in column (g) the megawatthours shown on bills rendered to the respondent. Report in columns (h) <strong>and</strong> (i) the megawatthours<br />
of power exchanges received <strong>and</strong> delivered, used as the basis for settlement. Do not report net exchange.<br />
7. Report dem<strong>and</strong> charges in column (j), energy charges in column (k), <strong>and</strong> the total of any other types of charges, including<br />
out-of-period adjustments, in column (l). Explain in a footnote all components of the amount shown in column (l). Report in column (m)<br />
the total charge shown on bills received as settlement by the respondent. For power exchanges, report in column (m) the settlement<br />
amount for the net receipt of energy. If more energy was delivered than received, enter a negative amount. If the settlement amount (l)<br />
include credits or charges other than incremental generation expenses, or (2) excludes certain credits or charges covered by the<br />
agreement, provide an explanatory footnote.<br />
8. The data in column (g) through (m) must be totalled on the last line of the schedule. The total amount in column (g) must be<br />
reported as Purchases on Page 401, line 10. The total amount in column (h) must be reported as Exchange Received on Page 401,<br />
line 12. The total amount in column (i) must be reported as Exchange Delivered on Page 401, line 13.<br />
9. Footnote entries as required <strong>and</strong> provide explanations following all required data.<br />
POWER EXCHANGES<br />
MegaWatt Hours<br />
MegaWatt Hours MegaWatt Hours<br />
Purchased<br />
Received<br />
Delivered<br />
(g)<br />
(h)<br />
(i)<br />
5,862<br />
295,923<br />
1<br />
29,265<br />
5,611<br />
951<br />
704<br />
1,444<br />
COST/SETTLEMENT OF POWER<br />
Line<br />
Dem<strong>and</strong> Charges Energy Charges Other Charges Total (j+k+l) No.<br />
($) ($) ($)<br />
of Settlement ($)<br />
(j)<br />
(k)<br />
(l)<br />
(m)<br />
1<br />
22,211 308,673 330,884 2<br />
3<br />
4<br />
1,323,158 13,457,687 14,780,845 5<br />
38 38 6<br />
7<br />
1,219,976 1,219,976 8<br />
6,879 248,342 255,221 9<br />
10<br />
11<br />
6,826 41,655 48,481 12<br />
7,628 35,324 42,952 13<br />
7,620 64,340 71,960 14<br />
44,837,023 754,305,279 2,879,319,814 -87,416 3,633,537,677<br />
<strong>FERC</strong> FORM NO. 1 (ED. 12-90) Page 327.13
Name of Respondent<br />
PACIFIC GAS AND ELECTRIC COMPANY<br />
This Report Is:<br />
Date of Report<br />
(1) X An Original<br />
(Mo, Da, Yr)<br />
(2) A Resubmission<br />
04/08/2011<br />
PURCHASED POWER(Account 555) (Continued)<br />
(Including power exchanges)<br />
Year/Period of Report<br />
End of <strong>2010</strong>/Q4<br />
AD - for out-of-period adjustment. Use this code for any accounting adjustments or "true-ups" for service provided in prior reporting<br />
years. Provide an explanation in a footnote for each adjustment.<br />
4. In column (c), identify the <strong>FERC</strong> Rate Schedule Number or Tariff, or, for non-<strong>FERC</strong> jurisdictional sellers, include an appropriate<br />
designation for the contract. On separate lines, list all <strong>FERC</strong> rate schedules, tariffs or contract designations under which service, as<br />
identified in column (b), is provided.<br />
5. For requirements RQ purchases <strong>and</strong> any type of service involving dem<strong>and</strong> charges imposed on a monnthly (or longer) basis, enter<br />
the monthly average billing dem<strong>and</strong> in column (d), the average monthly non-coincident peak (NCP) dem<strong>and</strong> in column (e), <strong>and</strong> the<br />
average monthly coincident peak (CP) dem<strong>and</strong> in column (f). For all other types of service, enter NA in columns (d), (e) <strong>and</strong> (f). Monthly<br />
NCP dem<strong>and</strong> is the maximum metered hourly (60-minute integration) dem<strong>and</strong> in a month. Monthly CP dem<strong>and</strong> is the metered dem<strong>and</strong><br />
during the hour (60-minute integration) in which the supplier's system reaches its monthly peak. Dem<strong>and</strong> reported in columns (e) <strong>and</strong> (f)<br />
must be in megawatts. Footnote any dem<strong>and</strong> not stated on a megawatt basis <strong>and</strong> explain.<br />
6. Report in column (g) the megawatthours shown on bills rendered to the respondent. Report in columns (h) <strong>and</strong> (i) the megawatthours<br />
of power exchanges received <strong>and</strong> delivered, used as the basis for settlement. Do not report net exchange.<br />
7. Report dem<strong>and</strong> charges in column (j), energy charges in column (k), <strong>and</strong> the total of any other types of charges, including<br />
out-of-period adjustments, in column (l). Explain in a footnote all components of the amount shown in column (l). Report in column (m)<br />
the total charge shown on bills received as settlement by the respondent. For power exchanges, report in column (m) the settlement<br />
amount for the net receipt of energy. If more energy was delivered than received, enter a negative amount. If the settlement amount (l)<br />
include credits or charges other than incremental generation expenses, or (2) excludes certain credits or charges covered by the<br />
agreement, provide an explanatory footnote.<br />
8. The data in column (g) through (m) must be totalled on the last line of the schedule. The total amount in column (g) must be<br />
reported as Purchases on Page 401, line 10. The total amount in column (h) must be reported as Exchange Received on Page 401,<br />
line 12. The total amount in column (i) must be reported as Exchange Delivered on Page 401, line 13.<br />
9. Footnote entries as required <strong>and</strong> provide explanations following all required data.<br />
POWER EXCHANGES<br />
MegaWatt Hours<br />
MegaWatt Hours MegaWatt Hours<br />
Purchased<br />
Received<br />
Delivered<br />
(g)<br />
(h)<br />
(i)<br />
2,540<br />
352<br />
330<br />
168<br />
1,681<br />
35<br />
114<br />
10<br />
3,165<br />
457<br />
2,659<br />
164<br />
COST/SETTLEMENT OF POWER<br />
Line<br />
Dem<strong>and</strong> Charges Energy Charges Other Charges Total (j+k+l) No.<br />
($) ($) ($)<br />
of Settlement ($)<br />
(j)<br />
(k)<br />
(l)<br />
(m)<br />
15,586 109,126 124,712 1<br />
2,086 15,620 17,706 2<br />
1,944 14,646 16,590 3<br />
855 7,396 8,251 4<br />
11,837 72,450 84,287 5<br />
103 1,514 1,617 6<br />
107 5,612 5,719 7<br />
8<br />
24 465 489 9<br />
18,413 208,364 226,777 10<br />
20 20 11<br />
1,827 31,866 33,693 12<br />
12,296 183,606 195,902 13<br />
1,032 10,534 11,566 14<br />
44,837,023 754,305,279 2,879,319,814 -87,416 3,633,537,677<br />
<strong>FERC</strong> FORM NO. 1 (ED. 12-90) Page 327.14
Name of Respondent<br />
PACIFIC GAS AND ELECTRIC COMPANY<br />
This Report Is:<br />
Date of Report<br />
(1) X An Original<br />
(Mo, Da, Yr)<br />
(2) A Resubmission<br />
04/08/2011<br />
PURCHASED POWER(Account 555) (Continued)<br />
(Including power exchanges)<br />
Year/Period of Report<br />
End of <strong>2010</strong>/Q4<br />
AD - for out-of-period adjustment. Use this code for any accounting adjustments or "true-ups" for service provided in prior reporting<br />
years. Provide an explanation in a footnote for each adjustment.<br />
4. In column (c), identify the <strong>FERC</strong> Rate Schedule Number or Tariff, or, for non-<strong>FERC</strong> jurisdictional sellers, include an appropriate<br />
designation for the contract. On separate lines, list all <strong>FERC</strong> rate schedules, tariffs or contract designations under which service, as<br />
identified in column (b), is provided.<br />
5. For requirements RQ purchases <strong>and</strong> any type of service involving dem<strong>and</strong> charges imposed on a monnthly (or longer) basis, enter<br />
the monthly average billing dem<strong>and</strong> in column (d), the average monthly non-coincident peak (NCP) dem<strong>and</strong> in column (e), <strong>and</strong> the<br />
average monthly coincident peak (CP) dem<strong>and</strong> in column (f). For all other types of service, enter NA in columns (d), (e) <strong>and</strong> (f). Monthly<br />
NCP dem<strong>and</strong> is the maximum metered hourly (60-minute integration) dem<strong>and</strong> in a month. Monthly CP dem<strong>and</strong> is the metered dem<strong>and</strong><br />
during the hour (60-minute integration) in which the supplier's system reaches its monthly peak. Dem<strong>and</strong> reported in columns (e) <strong>and</strong> (f)<br />
must be in megawatts. Footnote any dem<strong>and</strong> not stated on a megawatt basis <strong>and</strong> explain.<br />
6. Report in column (g) the megawatthours shown on bills rendered to the respondent. Report in columns (h) <strong>and</strong> (i) the megawatthours<br />
of power exchanges received <strong>and</strong> delivered, used as the basis for settlement. Do not report net exchange.<br />
7. Report dem<strong>and</strong> charges in column (j), energy charges in column (k), <strong>and</strong> the total of any other types of charges, including<br />
out-of-period adjustments, in column (l). Explain in a footnote all components of the amount shown in column (l). Report in column (m)<br />
the total charge shown on bills received as settlement by the respondent. For power exchanges, report in column (m) the settlement<br />
amount for the net receipt of energy. If more energy was delivered than received, enter a negative amount. If the settlement amount (l)<br />
include credits or charges other than incremental generation expenses, or (2) excludes certain credits or charges covered by the<br />
agreement, provide an explanatory footnote.<br />
8. The data in column (g) through (m) must be totalled on the last line of the schedule. The total amount in column (g) must be<br />
reported as Purchases on Page 401, line 10. The total amount in column (h) must be reported as Exchange Received on Page 401,<br />
line 12. The total amount in column (i) must be reported as Exchange Delivered on Page 401, line 13.<br />
9. Footnote entries as required <strong>and</strong> provide explanations following all required data.<br />
POWER EXCHANGES<br />
MegaWatt Hours<br />
MegaWatt Hours MegaWatt Hours<br />
Purchased<br />
Received<br />
Delivered<br />
(g)<br />
(h)<br />
(i)<br />
2,680<br />
254<br />
156<br />
272<br />
2,372<br />
448<br />
118<br />
7<br />
108<br />
1,089<br />
170<br />
COST/SETTLEMENT OF POWER<br />
Line<br />
Dem<strong>and</strong> Charges Energy Charges Other Charges Total (j+k+l) No.<br />
($) ($) ($)<br />
of Settlement ($)<br />
(j)<br />
(k)<br />
(l)<br />
(m)<br />
18,955 114,304 133,259 1<br />
3,523 12,868 16,391 2<br />
1,989 11,133 13,122 3<br />
4<br />
577 12,668 13,245 5<br />
37,750 160,177 197,927 6<br />
2,291 19,225 21,516 7<br />
166 5,127 5,293 8<br />
16 602 618 9<br />
245 7,429 7,674 10<br />
11<br />
23,161 72,057 95,218 12<br />
13<br />
1,109 10,715 11,824 14<br />
44,837,023 754,305,279 2,879,319,814 -87,416 3,633,537,677<br />
<strong>FERC</strong> FORM NO. 1 (ED. 12-90) Page 327.15
Name of Respondent<br />
PACIFIC GAS AND ELECTRIC COMPANY<br />
This Report Is:<br />
Date of Report<br />
(1) X An Original<br />
(Mo, Da, Yr)<br />
(2) A Resubmission<br />
04/08/2011<br />
PURCHASED POWER(Account 555) (Continued)<br />
(Including power exchanges)<br />
Year/Period of Report<br />
End of <strong>2010</strong>/Q4<br />
AD - for out-of-period adjustment. Use this code for any accounting adjustments or "true-ups" for service provided in prior reporting<br />
years. Provide an explanation in a footnote for each adjustment.<br />
4. In column (c), identify the <strong>FERC</strong> Rate Schedule Number or Tariff, or, for non-<strong>FERC</strong> jurisdictional sellers, include an appropriate<br />
designation for the contract. On separate lines, list all <strong>FERC</strong> rate schedules, tariffs or contract designations under which service, as<br />
identified in column (b), is provided.<br />
5. For requirements RQ purchases <strong>and</strong> any type of service involving dem<strong>and</strong> charges imposed on a monnthly (or longer) basis, enter<br />
the monthly average billing dem<strong>and</strong> in column (d), the average monthly non-coincident peak (NCP) dem<strong>and</strong> in column (e), <strong>and</strong> the<br />
average monthly coincident peak (CP) dem<strong>and</strong> in column (f). For all other types of service, enter NA in columns (d), (e) <strong>and</strong> (f). Monthly<br />
NCP dem<strong>and</strong> is the maximum metered hourly (60-minute integration) dem<strong>and</strong> in a month. Monthly CP dem<strong>and</strong> is the metered dem<strong>and</strong><br />
during the hour (60-minute integration) in which the supplier's system reaches its monthly peak. Dem<strong>and</strong> reported in columns (e) <strong>and</strong> (f)<br />
must be in megawatts. Footnote any dem<strong>and</strong> not stated on a megawatt basis <strong>and</strong> explain.<br />
6. Report in column (g) the megawatthours shown on bills rendered to the respondent. Report in columns (h) <strong>and</strong> (i) the megawatthours<br />
of power exchanges received <strong>and</strong> delivered, used as the basis for settlement. Do not report net exchange.<br />
7. Report dem<strong>and</strong> charges in column (j), energy charges in column (k), <strong>and</strong> the total of any other types of charges, including<br />
out-of-period adjustments, in column (l). Explain in a footnote all components of the amount shown in column (l). Report in column (m)<br />
the total charge shown on bills received as settlement by the respondent. For power exchanges, report in column (m) the settlement<br />
amount for the net receipt of energy. If more energy was delivered than received, enter a negative amount. If the settlement amount (l)<br />
include credits or charges other than incremental generation expenses, or (2) excludes certain credits or charges covered by the<br />
agreement, provide an explanatory footnote.<br />
8. The data in column (g) through (m) must be totalled on the last line of the schedule. The total amount in column (g) must be<br />
reported as Purchases on Page 401, line 10. The total amount in column (h) must be reported as Exchange Received on Page 401,<br />
line 12. The total amount in column (i) must be reported as Exchange Delivered on Page 401, line 13.<br />
9. Footnote entries as required <strong>and</strong> provide explanations following all required data.<br />
POWER EXCHANGES<br />
MegaWatt Hours<br />
MegaWatt Hours MegaWatt Hours<br />
Purchased<br />
Received<br />
Delivered<br />
(g)<br />
(h)<br />
(i)<br />
3,009<br />
584<br />
1,848<br />
2,849<br />
895<br />
4,404<br />
328<br />
2,010<br />
2,805<br />
1,911<br />
COST/SETTLEMENT OF POWER<br />
Line<br />
Dem<strong>and</strong> Charges Energy Charges Other Charges Total (j+k+l) No.<br />
($) ($) ($)<br />
of Settlement ($)<br />
(j)<br />
(k)<br />
(l)<br />
(m)<br />
58,695 139,844 198,539 1<br />
2,308 25,176 27,484 2<br />
49,160 112,900 162,060 3<br />
78,406 172,915 251,321 4<br />
27,164 53,118 80,282 5<br />
72,144 207,905 280,049 6<br />
2,001 14,602 16,603 7<br />
43,245 91,320 134,565 8<br />
9<br />
33,752 137,931 171,683 10<br />
11<br />
12<br />
13<br />
6,728 90,820 97,548 14<br />
44,837,023 754,305,279 2,879,319,814 -87,416 3,633,537,677<br />
<strong>FERC</strong> FORM NO. 1 (ED. 12-90) Page 327.16
Name of Respondent<br />
PACIFIC GAS AND ELECTRIC COMPANY<br />
This Report Is:<br />
Date of Report<br />
(1) X An Original<br />
(Mo, Da, Yr)<br />
(2) A Resubmission<br />
04/08/2011<br />
PURCHASED POWER(Account 555) (Continued)<br />
(Including power exchanges)<br />
Year/Period of Report<br />
End of <strong>2010</strong>/Q4<br />
AD - for out-of-period adjustment. Use this code for any accounting adjustments or "true-ups" for service provided in prior reporting<br />
years. Provide an explanation in a footnote for each adjustment.<br />
4. In column (c), identify the <strong>FERC</strong> Rate Schedule Number or Tariff, or, for non-<strong>FERC</strong> jurisdictional sellers, include an appropriate<br />
designation for the contract. On separate lines, list all <strong>FERC</strong> rate schedules, tariffs or contract designations under which service, as<br />
identified in column (b), is provided.<br />
5. For requirements RQ purchases <strong>and</strong> any type of service involving dem<strong>and</strong> charges imposed on a monnthly (or longer) basis, enter<br />
the monthly average billing dem<strong>and</strong> in column (d), the average monthly non-coincident peak (NCP) dem<strong>and</strong> in column (e), <strong>and</strong> the<br />
average monthly coincident peak (CP) dem<strong>and</strong> in column (f). For all other types of service, enter NA in columns (d), (e) <strong>and</strong> (f). Monthly<br />
NCP dem<strong>and</strong> is the maximum metered hourly (60-minute integration) dem<strong>and</strong> in a month. Monthly CP dem<strong>and</strong> is the metered dem<strong>and</strong><br />
during the hour (60-minute integration) in which the supplier's system reaches its monthly peak. Dem<strong>and</strong> reported in columns (e) <strong>and</strong> (f)<br />
must be in megawatts. Footnote any dem<strong>and</strong> not stated on a megawatt basis <strong>and</strong> explain.<br />
6. Report in column (g) the megawatthours shown on bills rendered to the respondent. Report in columns (h) <strong>and</strong> (i) the megawatthours<br />
of power exchanges received <strong>and</strong> delivered, used as the basis for settlement. Do not report net exchange.<br />
7. Report dem<strong>and</strong> charges in column (j), energy charges in column (k), <strong>and</strong> the total of any other types of charges, including<br />
out-of-period adjustments, in column (l). Explain in a footnote all components of the amount shown in column (l). Report in column (m)<br />
the total charge shown on bills received as settlement by the respondent. For power exchanges, report in column (m) the settlement<br />
amount for the net receipt of energy. If more energy was delivered than received, enter a negative amount. If the settlement amount (l)<br />
include credits or charges other than incremental generation expenses, or (2) excludes certain credits or charges covered by the<br />
agreement, provide an explanatory footnote.<br />
8. The data in column (g) through (m) must be totalled on the last line of the schedule. The total amount in column (g) must be<br />
reported as Purchases on Page 401, line 10. The total amount in column (h) must be reported as Exchange Received on Page 401,<br />
line 12. The total amount in column (i) must be reported as Exchange Delivered on Page 401, line 13.<br />
9. Footnote entries as required <strong>and</strong> provide explanations following all required data.<br />
POWER EXCHANGES<br />
MegaWatt Hours<br />
MegaWatt Hours MegaWatt Hours<br />
Purchased<br />
Received<br />
Delivered<br />
(g)<br />
(h)<br />
(i)<br />
1<br />
636<br />
271<br />
898<br />
1,603<br />
855<br />
184<br />
509<br />
COST/SETTLEMENT OF POWER<br />
Line<br />
Dem<strong>and</strong> Charges Energy Charges Other Charges Total (j+k+l) No.<br />
($) ($) ($)<br />
of Settlement ($)<br />
(j)<br />
(k)<br />
(l)<br />
(m)<br />
1<br />
2<br />
3<br />
2 57 59 4<br />
4,096 27,529 31,625 5<br />
11,154 11,154 6<br />
3,269 41,625 44,894 7<br />
22,822 110,809 133,631 8<br />
13,721 57,977 71,698 9<br />
10<br />
506 9,290 9,796 11<br />
12<br />
3,570 22,012 25,582 13<br />
1 1 14<br />
44,837,023 754,305,279 2,879,319,814 -87,416 3,633,537,677<br />
<strong>FERC</strong> FORM NO. 1 (ED. 12-90) Page 327.17
Name of Respondent<br />
PACIFIC GAS AND ELECTRIC COMPANY<br />
This Report Is:<br />
Date of Report<br />
(1) X An Original<br />
(Mo, Da, Yr)<br />
(2) A Resubmission<br />
04/08/2011<br />
PURCHASED POWER(Account 555) (Continued)<br />
(Including power exchanges)<br />
Year/Period of Report<br />
End of <strong>2010</strong>/Q4<br />
AD - for out-of-period adjustment. Use this code for any accounting adjustments or "true-ups" for service provided in prior reporting<br />
years. Provide an explanation in a footnote for each adjustment.<br />
4. In column (c), identify the <strong>FERC</strong> Rate Schedule Number or Tariff, or, for non-<strong>FERC</strong> jurisdictional sellers, include an appropriate<br />
designation for the contract. On separate lines, list all <strong>FERC</strong> rate schedules, tariffs or contract designations under which service, as<br />
identified in column (b), is provided.<br />
5. For requirements RQ purchases <strong>and</strong> any type of service involving dem<strong>and</strong> charges imposed on a monnthly (or longer) basis, enter<br />
the monthly average billing dem<strong>and</strong> in column (d), the average monthly non-coincident peak (NCP) dem<strong>and</strong> in column (e), <strong>and</strong> the<br />
average monthly coincident peak (CP) dem<strong>and</strong> in column (f). For all other types of service, enter NA in columns (d), (e) <strong>and</strong> (f). Monthly<br />
NCP dem<strong>and</strong> is the maximum metered hourly (60-minute integration) dem<strong>and</strong> in a month. Monthly CP dem<strong>and</strong> is the metered dem<strong>and</strong><br />
during the hour (60-minute integration) in which the supplier's system reaches its monthly peak. Dem<strong>and</strong> reported in columns (e) <strong>and</strong> (f)<br />
must be in megawatts. Footnote any dem<strong>and</strong> not stated on a megawatt basis <strong>and</strong> explain.<br />
6. Report in column (g) the megawatthours shown on bills rendered to the respondent. Report in columns (h) <strong>and</strong> (i) the megawatthours<br />
of power exchanges received <strong>and</strong> delivered, used as the basis for settlement. Do not report net exchange.<br />
7. Report dem<strong>and</strong> charges in column (j), energy charges in column (k), <strong>and</strong> the total of any other types of charges, including<br />
out-of-period adjustments, in column (l). Explain in a footnote all components of the amount shown in column (l). Report in column (m)<br />
the total charge shown on bills received as settlement by the respondent. For power exchanges, report in column (m) the settlement<br />
amount for the net receipt of energy. If more energy was delivered than received, enter a negative amount. If the settlement amount (l)<br />
include credits or charges other than incremental generation expenses, or (2) excludes certain credits or charges covered by the<br />
agreement, provide an explanatory footnote.<br />
8. The data in column (g) through (m) must be totalled on the last line of the schedule. The total amount in column (g) must be<br />
reported as Purchases on Page 401, line 10. The total amount in column (h) must be reported as Exchange Received on Page 401,<br />
line 12. The total amount in column (i) must be reported as Exchange Delivered on Page 401, line 13.<br />
9. Footnote entries as required <strong>and</strong> provide explanations following all required data.<br />
POWER EXCHANGES<br />
MegaWatt Hours<br />
MegaWatt Hours MegaWatt Hours<br />
Purchased<br />
Received<br />
Delivered<br />
(g)<br />
(h)<br />
(i)<br />
725<br />
246<br />
91<br />
241<br />
3,611<br />
3,920<br />
31<br />
453<br />
1,109<br />
1<br />
2<br />
COST/SETTLEMENT OF POWER<br />
Line<br />
Dem<strong>and</strong> Charges Energy Charges Other Charges Total (j+k+l) No.<br />
($) ($) ($)<br />
of Settlement ($)<br />
(j)<br />
(k)<br />
(l)<br />
(m)<br />
1<br />
4,089 48,363 52,452 2<br />
1,312 10,531 11,843 3<br />
525 4,438 4,963 4<br />
1,147 10,060 11,207 5<br />
63,000 168,389 231,389 6<br />
64,714 263,907 328,621 7<br />
66 1,453 1,519 8<br />
1,087 23,206 24,293 9<br />
19,267 73,697 92,964 10<br />
11<br />
3 50 53 12<br />
13<br />
5 82 87 14<br />
44,837,023 754,305,279 2,879,319,814 -87,416 3,633,537,677<br />
<strong>FERC</strong> FORM NO. 1 (ED. 12-90) Page 327.18
Name of Respondent<br />
PACIFIC GAS AND ELECTRIC COMPANY<br />
This Report Is:<br />
Date of Report<br />
(1) X An Original<br />
(Mo, Da, Yr)<br />
(2) A Resubmission<br />
04/08/2011<br />
PURCHASED POWER(Account 555) (Continued)<br />
(Including power exchanges)<br />
Year/Period of Report<br />
End of <strong>2010</strong>/Q4<br />
AD - for out-of-period adjustment. Use this code for any accounting adjustments or "true-ups" for service provided in prior reporting<br />
years. Provide an explanation in a footnote for each adjustment.<br />
4. In column (c), identify the <strong>FERC</strong> Rate Schedule Number or Tariff, or, for non-<strong>FERC</strong> jurisdictional sellers, include an appropriate<br />
designation for the contract. On separate lines, list all <strong>FERC</strong> rate schedules, tariffs or contract designations under which service, as<br />
identified in column (b), is provided.<br />
5. For requirements RQ purchases <strong>and</strong> any type of service involving dem<strong>and</strong> charges imposed on a monnthly (or longer) basis, enter<br />
the monthly average billing dem<strong>and</strong> in column (d), the average monthly non-coincident peak (NCP) dem<strong>and</strong> in column (e), <strong>and</strong> the<br />
average monthly coincident peak (CP) dem<strong>and</strong> in column (f). For all other types of service, enter NA in columns (d), (e) <strong>and</strong> (f). Monthly<br />
NCP dem<strong>and</strong> is the maximum metered hourly (60-minute integration) dem<strong>and</strong> in a month. Monthly CP dem<strong>and</strong> is the metered dem<strong>and</strong><br />
during the hour (60-minute integration) in which the supplier's system reaches its monthly peak. Dem<strong>and</strong> reported in columns (e) <strong>and</strong> (f)<br />
must be in megawatts. Footnote any dem<strong>and</strong> not stated on a megawatt basis <strong>and</strong> explain.<br />
6. Report in column (g) the megawatthours shown on bills rendered to the respondent. Report in columns (h) <strong>and</strong> (i) the megawatthours<br />
of power exchanges received <strong>and</strong> delivered, used as the basis for settlement. Do not report net exchange.<br />
7. Report dem<strong>and</strong> charges in column (j), energy charges in column (k), <strong>and</strong> the total of any other types of charges, including<br />
out-of-period adjustments, in column (l). Explain in a footnote all components of the amount shown in column (l). Report in column (m)<br />
the total charge shown on bills received as settlement by the respondent. For power exchanges, report in column (m) the settlement<br />
amount for the net receipt of energy. If more energy was delivered than received, enter a negative amount. If the settlement amount (l)<br />
include credits or charges other than incremental generation expenses, or (2) excludes certain credits or charges covered by the<br />
agreement, provide an explanatory footnote.<br />
8. The data in column (g) through (m) must be totalled on the last line of the schedule. The total amount in column (g) must be<br />
reported as Purchases on Page 401, line 10. The total amount in column (h) must be reported as Exchange Received on Page 401,<br />
line 12. The total amount in column (i) must be reported as Exchange Delivered on Page 401, line 13.<br />
9. Footnote entries as required <strong>and</strong> provide explanations following all required data.<br />
POWER EXCHANGES<br />
MegaWatt Hours<br />
MegaWatt Hours MegaWatt Hours<br />
Purchased<br />
Received<br />
Delivered<br />
(g)<br />
(h)<br />
(i)<br />
123<br />
171<br />
42<br />
6<br />
239<br />
316<br />
12<br />
COST/SETTLEMENT OF POWER<br />
Line<br />
Dem<strong>and</strong> Charges Energy Charges Other Charges Total (j+k+l) No.<br />
($) ($) ($)<br />
of Settlement ($)<br />
(j)<br />
(k)<br />
(l)<br />
(m)<br />
545 5,552 6,097 1<br />
312 8,120 8,432 2<br />
75 2,025 2,100 3<br />
2 226 228 4<br />
564 11,216 11,780 5<br />
697 15,164 15,861 6<br />
7<br />
8<br />
22 589 611 9<br />
10<br />
3 3 11<br />
12<br />
13<br />
14<br />
44,837,023 754,305,279 2,879,319,814 -87,416 3,633,537,677<br />
<strong>FERC</strong> FORM NO. 1 (ED. 12-90) Page 327.19
Name of Respondent<br />
PACIFIC GAS AND ELECTRIC COMPANY<br />
This Report Is:<br />
Date of Report<br />
(1) X An Original<br />
(Mo, Da, Yr)<br />
(2) A Resubmission<br />
04/08/2011<br />
PURCHASED POWER(Account 555) (Continued)<br />
(Including power exchanges)<br />
Year/Period of Report<br />
End of <strong>2010</strong>/Q4<br />
AD - for out-of-period adjustment. Use this code for any accounting adjustments or "true-ups" for service provided in prior reporting<br />
years. Provide an explanation in a footnote for each adjustment.<br />
4. In column (c), identify the <strong>FERC</strong> Rate Schedule Number or Tariff, or, for non-<strong>FERC</strong> jurisdictional sellers, include an appropriate<br />
designation for the contract. On separate lines, list all <strong>FERC</strong> rate schedules, tariffs or contract designations under which service, as<br />
identified in column (b), is provided.<br />
5. For requirements RQ purchases <strong>and</strong> any type of service involving dem<strong>and</strong> charges imposed on a monnthly (or longer) basis, enter<br />
the monthly average billing dem<strong>and</strong> in column (d), the average monthly non-coincident peak (NCP) dem<strong>and</strong> in column (e), <strong>and</strong> the<br />
average monthly coincident peak (CP) dem<strong>and</strong> in column (f). For all other types of service, enter NA in columns (d), (e) <strong>and</strong> (f). Monthly<br />
NCP dem<strong>and</strong> is the maximum metered hourly (60-minute integration) dem<strong>and</strong> in a month. Monthly CP dem<strong>and</strong> is the metered dem<strong>and</strong><br />
during the hour (60-minute integration) in which the supplier's system reaches its monthly peak. Dem<strong>and</strong> reported in columns (e) <strong>and</strong> (f)<br />
must be in megawatts. Footnote any dem<strong>and</strong> not stated on a megawatt basis <strong>and</strong> explain.<br />
6. Report in column (g) the megawatthours shown on bills rendered to the respondent. Report in columns (h) <strong>and</strong> (i) the megawatthours<br />
of power exchanges received <strong>and</strong> delivered, used as the basis for settlement. Do not report net exchange.<br />
7. Report dem<strong>and</strong> charges in column (j), energy charges in column (k), <strong>and</strong> the total of any other types of charges, including<br />
out-of-period adjustments, in column (l). Explain in a footnote all components of the amount shown in column (l). Report in column (m)<br />
the total charge shown on bills received as settlement by the respondent. For power exchanges, report in column (m) the settlement<br />
amount for the net receipt of energy. If more energy was delivered than received, enter a negative amount. If the settlement amount (l)<br />
include credits or charges other than incremental generation expenses, or (2) excludes certain credits or charges covered by the<br />
agreement, provide an explanatory footnote.<br />
8. The data in column (g) through (m) must be totalled on the last line of the schedule. The total amount in column (g) must be<br />
reported as Purchases on Page 401, line 10. The total amount in column (h) must be reported as Exchange Received on Page 401,<br />
line 12. The total amount in column (i) must be reported as Exchange Delivered on Page 401, line 13.<br />
9. Footnote entries as required <strong>and</strong> provide explanations following all required data.<br />
POWER EXCHANGES<br />
MegaWatt Hours<br />
MegaWatt Hours MegaWatt Hours<br />
Purchased<br />
Received<br />
Delivered<br />
(g)<br />
(h)<br />
(i)<br />
88<br />
COST/SETTLEMENT OF POWER<br />
Line<br />
Dem<strong>and</strong> Charges Energy Charges Other Charges Total (j+k+l) No.<br />
($) ($) ($)<br />
of Settlement ($)<br />
(j)<br />
(k)<br />
(l)<br />
(m)<br />
171 3,948 4,119 1<br />
2<br />
3<br />
207,191 207,191 4<br />
167,217 167,217 5<br />
378,659 378,659 6<br />
1,463,527 1,463,527 7<br />
15,248,417 15,248,417 8<br />
216,327 216,327 9<br />
516,173 516,173 10<br />
287,683 287,683 11<br />
3,906,080 3,906,080 12<br />
320,835 1,868,860 2,189,695 13<br />
76,148,850 76,148,850 14<br />
44,837,023 754,305,279 2,879,319,814 -87,416 3,633,537,677<br />
<strong>FERC</strong> FORM NO. 1 (ED. 12-90) Page 327.20
Name of Respondent<br />
PACIFIC GAS AND ELECTRIC COMPANY<br />
This Report Is:<br />
Date of Report<br />
(1) X An Original<br />
(Mo, Da, Yr)<br />
(2) A Resubmission<br />
04/08/2011<br />
PURCHASED POWER(Account 555) (Continued)<br />
(Including power exchanges)<br />
Year/Period of Report<br />
End of <strong>2010</strong>/Q4<br />
AD - for out-of-period adjustment. Use this code for any accounting adjustments or "true-ups" for service provided in prior reporting<br />
years. Provide an explanation in a footnote for each adjustment.<br />
4. In column (c), identify the <strong>FERC</strong> Rate Schedule Number or Tariff, or, for non-<strong>FERC</strong> jurisdictional sellers, include an appropriate<br />
designation for the contract. On separate lines, list all <strong>FERC</strong> rate schedules, tariffs or contract designations under which service, as<br />
identified in column (b), is provided.<br />
5. For requirements RQ purchases <strong>and</strong> any type of service involving dem<strong>and</strong> charges imposed on a monnthly (or longer) basis, enter<br />
the monthly average billing dem<strong>and</strong> in column (d), the average monthly non-coincident peak (NCP) dem<strong>and</strong> in column (e), <strong>and</strong> the<br />
average monthly coincident peak (CP) dem<strong>and</strong> in column (f). For all other types of service, enter NA in columns (d), (e) <strong>and</strong> (f). Monthly<br />
NCP dem<strong>and</strong> is the maximum metered hourly (60-minute integration) dem<strong>and</strong> in a month. Monthly CP dem<strong>and</strong> is the metered dem<strong>and</strong><br />
during the hour (60-minute integration) in which the supplier's system reaches its monthly peak. Dem<strong>and</strong> reported in columns (e) <strong>and</strong> (f)<br />
must be in megawatts. Footnote any dem<strong>and</strong> not stated on a megawatt basis <strong>and</strong> explain.<br />
6. Report in column (g) the megawatthours shown on bills rendered to the respondent. Report in columns (h) <strong>and</strong> (i) the megawatthours<br />
of power exchanges received <strong>and</strong> delivered, used as the basis for settlement. Do not report net exchange.<br />
7. Report dem<strong>and</strong> charges in column (j), energy charges in column (k), <strong>and</strong> the total of any other types of charges, including<br />
out-of-period adjustments, in column (l). Explain in a footnote all components of the amount shown in column (l). Report in column (m)<br />
the total charge shown on bills received as settlement by the respondent. For power exchanges, report in column (m) the settlement<br />
amount for the net receipt of energy. If more energy was delivered than received, enter a negative amount. If the settlement amount (l)<br />
include credits or charges other than incremental generation expenses, or (2) excludes certain credits or charges covered by the<br />
agreement, provide an explanatory footnote.<br />
8. The data in column (g) through (m) must be totalled on the last line of the schedule. The total amount in column (g) must be<br />
reported as Purchases on Page 401, line 10. The total amount in column (h) must be reported as Exchange Received on Page 401,<br />
line 12. The total amount in column (i) must be reported as Exchange Delivered on Page 401, line 13.<br />
9. Footnote entries as required <strong>and</strong> provide explanations following all required data.<br />
MegaWatt Hours<br />
Purchased<br />
(g)<br />
POWER EXCHANGES<br />
MegaWatt Hours MegaWatt Hours<br />
Received<br />
(h)<br />
Delivered<br />
(i)<br />
COST/SETTLEMENT OF POWER<br />
Line<br />
Dem<strong>and</strong> Charges Energy Charges Other Charges Total (j+k+l) No.<br />
($) ($) ($)<br />
of Settlement ($)<br />
(j)<br />
(k)<br />
(l)<br />
(m)<br />
694,329 694,329 1<br />
14,886,584 14,886,584 2<br />
416,727 416,727 3<br />
54,459,475 54,459,475 4<br />
1,540,498 1,540,498 5<br />
1,668,910 3,666,937 5,335,847 6<br />
1,024,784 2,079,785 3,104,569 7<br />
2,211,140 5,699,916 7,911,056 8<br />
2,686,460 2,686,460 9<br />
9,201,355 9,201,355 10<br />
280,783 280,783 11<br />
131,279 131,279 12<br />
4,997,835 4,997,835 13<br />
6,206,824 6,206,824 14<br />
44,837,023 754,305,279 2,879,319,814 -87,416 3,633,537,677<br />
<strong>FERC</strong> FORM NO. 1 (ED. 12-90) Page 327.21
Name of Respondent<br />
PACIFIC GAS AND ELECTRIC COMPANY<br />
This Report Is:<br />
Date of Report<br />
(1) X An Original<br />
(Mo, Da, Yr)<br />
(2) A Resubmission<br />
04/08/2011<br />
PURCHASED POWER(Account 555) (Continued)<br />
(Including power exchanges)<br />
Year/Period of Report<br />
End of <strong>2010</strong>/Q4<br />
AD - for out-of-period adjustment. Use this code for any accounting adjustments or "true-ups" for service provided in prior reporting<br />
years. Provide an explanation in a footnote for each adjustment.<br />
4. In column (c), identify the <strong>FERC</strong> Rate Schedule Number or Tariff, or, for non-<strong>FERC</strong> jurisdictional sellers, include an appropriate<br />
designation for the contract. On separate lines, list all <strong>FERC</strong> rate schedules, tariffs or contract designations under which service, as<br />
identified in column (b), is provided.<br />
5. For requirements RQ purchases <strong>and</strong> any type of service involving dem<strong>and</strong> charges imposed on a monnthly (or longer) basis, enter<br />
the monthly average billing dem<strong>and</strong> in column (d), the average monthly non-coincident peak (NCP) dem<strong>and</strong> in column (e), <strong>and</strong> the<br />
average monthly coincident peak (CP) dem<strong>and</strong> in column (f). For all other types of service, enter NA in columns (d), (e) <strong>and</strong> (f). Monthly<br />
NCP dem<strong>and</strong> is the maximum metered hourly (60-minute integration) dem<strong>and</strong> in a month. Monthly CP dem<strong>and</strong> is the metered dem<strong>and</strong><br />
during the hour (60-minute integration) in which the supplier's system reaches its monthly peak. Dem<strong>and</strong> reported in columns (e) <strong>and</strong> (f)<br />
must be in megawatts. Footnote any dem<strong>and</strong> not stated on a megawatt basis <strong>and</strong> explain.<br />
6. Report in column (g) the megawatthours shown on bills rendered to the respondent. Report in columns (h) <strong>and</strong> (i) the megawatthours<br />
of power exchanges received <strong>and</strong> delivered, used as the basis for settlement. Do not report net exchange.<br />
7. Report dem<strong>and</strong> charges in column (j), energy charges in column (k), <strong>and</strong> the total of any other types of charges, including<br />
out-of-period adjustments, in column (l). Explain in a footnote all components of the amount shown in column (l). Report in column (m)<br />
the total charge shown on bills received as settlement by the respondent. For power exchanges, report in column (m) the settlement<br />
amount for the net receipt of energy. If more energy was delivered than received, enter a negative amount. If the settlement amount (l)<br />
include credits or charges other than incremental generation expenses, or (2) excludes certain credits or charges covered by the<br />
agreement, provide an explanatory footnote.<br />
8. The data in column (g) through (m) must be totalled on the last line of the schedule. The total amount in column (g) must be<br />
reported as Purchases on Page 401, line 10. The total amount in column (h) must be reported as Exchange Received on Page 401,<br />
line 12. The total amount in column (i) must be reported as Exchange Delivered on Page 401, line 13.<br />
9. Footnote entries as required <strong>and</strong> provide explanations following all required data.<br />
MegaWatt Hours<br />
Purchased<br />
(g)<br />
POWER EXCHANGES<br />
MegaWatt Hours MegaWatt Hours<br />
Received<br />
(h)<br />
Delivered<br />
(i)<br />
COST/SETTLEMENT OF POWER<br />
Line<br />
Dem<strong>and</strong> Charges Energy Charges Other Charges Total (j+k+l) No.<br />
($) ($) ($)<br />
of Settlement ($)<br />
(j)<br />
(k)<br />
(l)<br />
(m)<br />
239,573,078 239,573,078 1<br />
2,080,852 2,080,852 2<br />
28,838,202 28,838,202 3<br />
11,335,637 11,335,637 4<br />
361,539 361,539 5<br />
37,162,298 37,162,298 6<br />
20,793,318 20,793,318 7<br />
8,335,312 8,335,312 8<br />
4,704,024 4,704,024 9<br />
4,305,490 4,305,490 10<br />
4,759 4,759 11<br />
57,725 57,725 12<br />
2,931,387 2,931,387 13<br />
71,319 71,319 14<br />
44,837,023 754,305,279 2,879,319,814 -87,416 3,633,537,677<br />
<strong>FERC</strong> FORM NO. 1 (ED. 12-90) Page 327.22
Name of Respondent<br />
PACIFIC GAS AND ELECTRIC COMPANY<br />
This Report Is:<br />
Date of Report<br />
(1) X An Original<br />
(Mo, Da, Yr)<br />
(2) A Resubmission<br />
04/08/2011<br />
PURCHASED POWER(Account 555) (Continued)<br />
(Including power exchanges)<br />
Year/Period of Report<br />
End of <strong>2010</strong>/Q4<br />
AD - for out-of-period adjustment. Use this code for any accounting adjustments or "true-ups" for service provided in prior reporting<br />
years. Provide an explanation in a footnote for each adjustment.<br />
4. In column (c), identify the <strong>FERC</strong> Rate Schedule Number or Tariff, or, for non-<strong>FERC</strong> jurisdictional sellers, include an appropriate<br />
designation for the contract. On separate lines, list all <strong>FERC</strong> rate schedules, tariffs or contract designations under which service, as<br />
identified in column (b), is provided.<br />
5. For requirements RQ purchases <strong>and</strong> any type of service involving dem<strong>and</strong> charges imposed on a monnthly (or longer) basis, enter<br />
the monthly average billing dem<strong>and</strong> in column (d), the average monthly non-coincident peak (NCP) dem<strong>and</strong> in column (e), <strong>and</strong> the<br />
average monthly coincident peak (CP) dem<strong>and</strong> in column (f). For all other types of service, enter NA in columns (d), (e) <strong>and</strong> (f). Monthly<br />
NCP dem<strong>and</strong> is the maximum metered hourly (60-minute integration) dem<strong>and</strong> in a month. Monthly CP dem<strong>and</strong> is the metered dem<strong>and</strong><br />
during the hour (60-minute integration) in which the supplier's system reaches its monthly peak. Dem<strong>and</strong> reported in columns (e) <strong>and</strong> (f)<br />
must be in megawatts. Footnote any dem<strong>and</strong> not stated on a megawatt basis <strong>and</strong> explain.<br />
6. Report in column (g) the megawatthours shown on bills rendered to the respondent. Report in columns (h) <strong>and</strong> (i) the megawatthours<br />
of power exchanges received <strong>and</strong> delivered, used as the basis for settlement. Do not report net exchange.<br />
7. Report dem<strong>and</strong> charges in column (j), energy charges in column (k), <strong>and</strong> the total of any other types of charges, including<br />
out-of-period adjustments, in column (l). Explain in a footnote all components of the amount shown in column (l). Report in column (m)<br />
the total charge shown on bills received as settlement by the respondent. For power exchanges, report in column (m) the settlement<br />
amount for the net receipt of energy. If more energy was delivered than received, enter a negative amount. If the settlement amount (l)<br />
include credits or charges other than incremental generation expenses, or (2) excludes certain credits or charges covered by the<br />
agreement, provide an explanatory footnote.<br />
8. The data in column (g) through (m) must be totalled on the last line of the schedule. The total amount in column (g) must be<br />
reported as Purchases on Page 401, line 10. The total amount in column (h) must be reported as Exchange Received on Page 401,<br />
line 12. The total amount in column (i) must be reported as Exchange Delivered on Page 401, line 13.<br />
9. Footnote entries as required <strong>and</strong> provide explanations following all required data.<br />
MegaWatt Hours<br />
Purchased<br />
(g)<br />
POWER EXCHANGES<br />
MegaWatt Hours MegaWatt Hours<br />
Received<br />
(h)<br />
Delivered<br />
(i)<br />
COST/SETTLEMENT OF POWER<br />
Line<br />
Dem<strong>and</strong> Charges Energy Charges Other Charges Total (j+k+l) No.<br />
($) ($) ($)<br />
of Settlement ($)<br />
(j)<br />
(k)<br />
(l)<br />
(m)<br />
107,521 107,521 1<br />
1,952 1,952 2<br />
16,973,414 16,973,414 5<br />
10,458,777 10,458,777 6<br />
161,969 161,969 7<br />
158,004 158,004 8<br />
-6,000 -6,000 9<br />
45,194 45,194 10<br />
6,229,424 6,229,424 11<br />
196,250 196,250 12<br />
1,109,200 1,109,200 13<br />
155,501 155,501 14<br />
3<br />
4<br />
44,837,023 754,305,279 2,879,319,814 -87,416 3,633,537,677<br />
<strong>FERC</strong> FORM NO. 1 (ED. 12-90) Page 327.23
Name of Respondent<br />
PACIFIC GAS AND ELECTRIC COMPANY<br />
This Report Is:<br />
Date of Report<br />
(1) X An Original<br />
(Mo, Da, Yr)<br />
(2) A Resubmission<br />
04/08/2011<br />
PURCHASED POWER(Account 555) (Continued)<br />
(Including power exchanges)<br />
Year/Period of Report<br />
End of <strong>2010</strong>/Q4<br />
AD - for out-of-period adjustment. Use this code for any accounting adjustments or "true-ups" for service provided in prior reporting<br />
years. Provide an explanation in a footnote for each adjustment.<br />
4. In column (c), identify the <strong>FERC</strong> Rate Schedule Number or Tariff, or, for non-<strong>FERC</strong> jurisdictional sellers, include an appropriate<br />
designation for the contract. On separate lines, list all <strong>FERC</strong> rate schedules, tariffs or contract designations under which service, as<br />
identified in column (b), is provided.<br />
5. For requirements RQ purchases <strong>and</strong> any type of service involving dem<strong>and</strong> charges imposed on a monnthly (or longer) basis, enter<br />
the monthly average billing dem<strong>and</strong> in column (d), the average monthly non-coincident peak (NCP) dem<strong>and</strong> in column (e), <strong>and</strong> the<br />
average monthly coincident peak (CP) dem<strong>and</strong> in column (f). For all other types of service, enter NA in columns (d), (e) <strong>and</strong> (f). Monthly<br />
NCP dem<strong>and</strong> is the maximum metered hourly (60-minute integration) dem<strong>and</strong> in a month. Monthly CP dem<strong>and</strong> is the metered dem<strong>and</strong><br />
during the hour (60-minute integration) in which the supplier's system reaches its monthly peak. Dem<strong>and</strong> reported in columns (e) <strong>and</strong> (f)<br />
must be in megawatts. Footnote any dem<strong>and</strong> not stated on a megawatt basis <strong>and</strong> explain.<br />
6. Report in column (g) the megawatthours shown on bills rendered to the respondent. Report in columns (h) <strong>and</strong> (i) the megawatthours<br />
of power exchanges received <strong>and</strong> delivered, used as the basis for settlement. Do not report net exchange.<br />
7. Report dem<strong>and</strong> charges in column (j), energy charges in column (k), <strong>and</strong> the total of any other types of charges, including<br />
out-of-period adjustments, in column (l). Explain in a footnote all components of the amount shown in column (l). Report in column (m)<br />
the total charge shown on bills received as settlement by the respondent. For power exchanges, report in column (m) the settlement<br />
amount for the net receipt of energy. If more energy was delivered than received, enter a negative amount. If the settlement amount (l)<br />
include credits or charges other than incremental generation expenses, or (2) excludes certain credits or charges covered by the<br />
agreement, provide an explanatory footnote.<br />
8. The data in column (g) through (m) must be totalled on the last line of the schedule. The total amount in column (g) must be<br />
reported as Purchases on Page 401, line 10. The total amount in column (h) must be reported as Exchange Received on Page 401,<br />
line 12. The total amount in column (i) must be reported as Exchange Delivered on Page 401, line 13.<br />
9. Footnote entries as required <strong>and</strong> provide explanations following all required data.<br />
MegaWatt Hours<br />
Purchased<br />
(g)<br />
POWER EXCHANGES<br />
MegaWatt Hours MegaWatt Hours<br />
Received<br />
(h)<br />
Delivered<br />
(i)<br />
COST/SETTLEMENT OF POWER<br />
Line<br />
Dem<strong>and</strong> Charges Energy Charges Other Charges Total (j+k+l) No.<br />
($) ($) ($)<br />
of Settlement ($)<br />
(j)<br />
(k)<br />
(l)<br />
(m)<br />
5,354,997 5,354,997 1<br />
74,499 74,499 2<br />
7,994,011 7,994,011 3<br />
599,174 599,174 4<br />
47,484,385 47,484,385 5<br />
52,011,965 52,011,965 7<br />
-8,197 -8,197 8<br />
27,600 27,600 9<br />
20,925,770 20,925,770 10<br />
2,427,736 2,427,736 11<br />
-10,900 -10,900 12<br />
6<br />
13<br />
14<br />
44,837,023 754,305,279 2,879,319,814 -87,416 3,633,537,677<br />
<strong>FERC</strong> FORM NO. 1 (ED. 12-90) Page 327.24
Name of Respondent<br />
PACIFIC GAS AND ELECTRIC COMPANY<br />
This Report Is:<br />
Date of Report<br />
(1) X An Original<br />
(Mo, Da, Yr)<br />
(2) A Resubmission<br />
04/08/2011<br />
PURCHASED POWER(Account 555) (Continued)<br />
(Including power exchanges)<br />
Year/Period of Report<br />
End of <strong>2010</strong>/Q4<br />
AD - for out-of-period adjustment. Use this code for any accounting adjustments or "true-ups" for service provided in prior reporting<br />
years. Provide an explanation in a footnote for each adjustment.<br />
4. In column (c), identify the <strong>FERC</strong> Rate Schedule Number or Tariff, or, for non-<strong>FERC</strong> jurisdictional sellers, include an appropriate<br />
designation for the contract. On separate lines, list all <strong>FERC</strong> rate schedules, tariffs or contract designations under which service, as<br />
identified in column (b), is provided.<br />
5. For requirements RQ purchases <strong>and</strong> any type of service involving dem<strong>and</strong> charges imposed on a monnthly (or longer) basis, enter<br />
the monthly average billing dem<strong>and</strong> in column (d), the average monthly non-coincident peak (NCP) dem<strong>and</strong> in column (e), <strong>and</strong> the<br />
average monthly coincident peak (CP) dem<strong>and</strong> in column (f). For all other types of service, enter NA in columns (d), (e) <strong>and</strong> (f). Monthly<br />
NCP dem<strong>and</strong> is the maximum metered hourly (60-minute integration) dem<strong>and</strong> in a month. Monthly CP dem<strong>and</strong> is the metered dem<strong>and</strong><br />
during the hour (60-minute integration) in which the supplier's system reaches its monthly peak. Dem<strong>and</strong> reported in columns (e) <strong>and</strong> (f)<br />
must be in megawatts. Footnote any dem<strong>and</strong> not stated on a megawatt basis <strong>and</strong> explain.<br />
6. Report in column (g) the megawatthours shown on bills rendered to the respondent. Report in columns (h) <strong>and</strong> (i) the megawatthours<br />
of power exchanges received <strong>and</strong> delivered, used as the basis for settlement. Do not report net exchange.<br />
7. Report dem<strong>and</strong> charges in column (j), energy charges in column (k), <strong>and</strong> the total of any other types of charges, including<br />
out-of-period adjustments, in column (l). Explain in a footnote all components of the amount shown in column (l). Report in column (m)<br />
the total charge shown on bills received as settlement by the respondent. For power exchanges, report in column (m) the settlement<br />
amount for the net receipt of energy. If more energy was delivered than received, enter a negative amount. If the settlement amount (l)<br />
include credits or charges other than incremental generation expenses, or (2) excludes certain credits or charges covered by the<br />
agreement, provide an explanatory footnote.<br />
8. The data in column (g) through (m) must be totalled on the last line of the schedule. The total amount in column (g) must be<br />
reported as Purchases on Page 401, line 10. The total amount in column (h) must be reported as Exchange Received on Page 401,<br />
line 12. The total amount in column (i) must be reported as Exchange Delivered on Page 401, line 13.<br />
9. Footnote entries as required <strong>and</strong> provide explanations following all required data.<br />
MegaWatt Hours<br />
Purchased<br />
(g)<br />
POWER EXCHANGES<br />
MegaWatt Hours MegaWatt Hours<br />
Received<br />
(h)<br />
Delivered<br />
(i)<br />
COST/SETTLEMENT OF POWER<br />
Line<br />
Dem<strong>and</strong> Charges Energy Charges Other Charges Total (j+k+l) No.<br />
($) ($) ($)<br />
of Settlement ($)<br />
(j)<br />
(k)<br />
(l)<br />
(m)<br />
13,594,889 461,197 14,056,086 1<br />
-1,344,627 -1,344,627 2<br />
3,787,379 3,787,379 5<br />
1,450,000 1,450,000 6<br />
409,966 409,966 7<br />
34,740,800 34,740,800 8<br />
1,657,600 1,657,600 9<br />
95,550 95,550 10<br />
760,000 760,000 11<br />
138,999 138,999 12<br />
359,750 359,750 13<br />
15,308,940 15,308,940 14<br />
3<br />
4<br />
44,837,023 754,305,279 2,879,319,814 -87,416 3,633,537,677<br />
<strong>FERC</strong> FORM NO. 1 (ED. 12-90) Page 327.25
Name of Respondent<br />
PACIFIC GAS AND ELECTRIC COMPANY<br />
This Report Is:<br />
Date of Report<br />
(1) X An Original<br />
(Mo, Da, Yr)<br />
(2) A Resubmission<br />
04/08/2011<br />
PURCHASED POWER(Account 555) (Continued)<br />
(Including power exchanges)<br />
Year/Period of Report<br />
End of <strong>2010</strong>/Q4<br />
AD - for out-of-period adjustment. Use this code for any accounting adjustments or "true-ups" for service provided in prior reporting<br />
years. Provide an explanation in a footnote for each adjustment.<br />
4. In column (c), identify the <strong>FERC</strong> Rate Schedule Number or Tariff, or, for non-<strong>FERC</strong> jurisdictional sellers, include an appropriate<br />
designation for the contract. On separate lines, list all <strong>FERC</strong> rate schedules, tariffs or contract designations under which service, as<br />
identified in column (b), is provided.<br />
5. For requirements RQ purchases <strong>and</strong> any type of service involving dem<strong>and</strong> charges imposed on a monnthly (or longer) basis, enter<br />
the monthly average billing dem<strong>and</strong> in column (d), the average monthly non-coincident peak (NCP) dem<strong>and</strong> in column (e), <strong>and</strong> the<br />
average monthly coincident peak (CP) dem<strong>and</strong> in column (f). For all other types of service, enter NA in columns (d), (e) <strong>and</strong> (f). Monthly<br />
NCP dem<strong>and</strong> is the maximum metered hourly (60-minute integration) dem<strong>and</strong> in a month. Monthly CP dem<strong>and</strong> is the metered dem<strong>and</strong><br />
during the hour (60-minute integration) in which the supplier's system reaches its monthly peak. Dem<strong>and</strong> reported in columns (e) <strong>and</strong> (f)<br />
must be in megawatts. Footnote any dem<strong>and</strong> not stated on a megawatt basis <strong>and</strong> explain.<br />
6. Report in column (g) the megawatthours shown on bills rendered to the respondent. Report in columns (h) <strong>and</strong> (i) the megawatthours<br />
of power exchanges received <strong>and</strong> delivered, used as the basis for settlement. Do not report net exchange.<br />
7. Report dem<strong>and</strong> charges in column (j), energy charges in column (k), <strong>and</strong> the total of any other types of charges, including<br />
out-of-period adjustments, in column (l). Explain in a footnote all components of the amount shown in column (l). Report in column (m)<br />
the total charge shown on bills received as settlement by the respondent. For power exchanges, report in column (m) the settlement<br />
amount for the net receipt of energy. If more energy was delivered than received, enter a negative amount. If the settlement amount (l)<br />
include credits or charges other than incremental generation expenses, or (2) excludes certain credits or charges covered by the<br />
agreement, provide an explanatory footnote.<br />
8. The data in column (g) through (m) must be totalled on the last line of the schedule. The total amount in column (g) must be<br />
reported as Purchases on Page 401, line 10. The total amount in column (h) must be reported as Exchange Received on Page 401,<br />
line 12. The total amount in column (i) must be reported as Exchange Delivered on Page 401, line 13.<br />
9. Footnote entries as required <strong>and</strong> provide explanations following all required data.<br />
MegaWatt Hours<br />
Purchased<br />
(g)<br />
POWER EXCHANGES<br />
MegaWatt Hours MegaWatt Hours<br />
Received<br />
(h)<br />
Delivered<br />
(i)<br />
COST/SETTLEMENT OF POWER<br />
Line<br />
Dem<strong>and</strong> Charges Energy Charges Other Charges Total (j+k+l) No.<br />
($) ($) ($)<br />
of Settlement ($)<br />
(j)<br />
(k)<br />
(l)<br />
(m)<br />
19,062,400 19,062,400 1<br />
21,941,000 21,941,000 2<br />
2,778,300 7,367,452 10,145,752 5<br />
56,027,529 -4,870,374 51,157,155 6<br />
25,399,654 986,812 26,386,466 7<br />
13,126,030 -149,738 12,976,292 8<br />
83,379,721 3,185,114 86,564,835 9<br />
71,782 71,782 10<br />
51,672,158 1,893,844 53,566,002 11<br />
13,002,816 349,442 13,352,258 12<br />
290,000 7,465,219 7,755,219 13<br />
3<br />
4<br />
14<br />
44,837,023 754,305,279 2,879,319,814 -87,416 3,633,537,677<br />
<strong>FERC</strong> FORM NO. 1 (ED. 12-90) Page 327.26
Name of Respondent<br />
PACIFIC GAS AND ELECTRIC COMPANY<br />
This Report Is:<br />
Date of Report<br />
(1) X An Original<br />
(Mo, Da, Yr)<br />
(2) A Resubmission<br />
04/08/2011<br />
PURCHASED POWER(Account 555) (Continued)<br />
(Including power exchanges)<br />
Year/Period of Report<br />
End of <strong>2010</strong>/Q4<br />
AD - for out-of-period adjustment. Use this code for any accounting adjustments or "true-ups" for service provided in prior reporting<br />
years. Provide an explanation in a footnote for each adjustment.<br />
4. In column (c), identify the <strong>FERC</strong> Rate Schedule Number or Tariff, or, for non-<strong>FERC</strong> jurisdictional sellers, include an appropriate<br />
designation for the contract. On separate lines, list all <strong>FERC</strong> rate schedules, tariffs or contract designations under which service, as<br />
identified in column (b), is provided.<br />
5. For requirements RQ purchases <strong>and</strong> any type of service involving dem<strong>and</strong> charges imposed on a monnthly (or longer) basis, enter<br />
the monthly average billing dem<strong>and</strong> in column (d), the average monthly non-coincident peak (NCP) dem<strong>and</strong> in column (e), <strong>and</strong> the<br />
average monthly coincident peak (CP) dem<strong>and</strong> in column (f). For all other types of service, enter NA in columns (d), (e) <strong>and</strong> (f). Monthly<br />
NCP dem<strong>and</strong> is the maximum metered hourly (60-minute integration) dem<strong>and</strong> in a month. Monthly CP dem<strong>and</strong> is the metered dem<strong>and</strong><br />
during the hour (60-minute integration) in which the supplier's system reaches its monthly peak. Dem<strong>and</strong> reported in columns (e) <strong>and</strong> (f)<br />
must be in megawatts. Footnote any dem<strong>and</strong> not stated on a megawatt basis <strong>and</strong> explain.<br />
6. Report in column (g) the megawatthours shown on bills rendered to the respondent. Report in columns (h) <strong>and</strong> (i) the megawatthours<br />
of power exchanges received <strong>and</strong> delivered, used as the basis for settlement. Do not report net exchange.<br />
7. Report dem<strong>and</strong> charges in column (j), energy charges in column (k), <strong>and</strong> the total of any other types of charges, including<br />
out-of-period adjustments, in column (l). Explain in a footnote all components of the amount shown in column (l). Report in column (m)<br />
the total charge shown on bills received as settlement by the respondent. For power exchanges, report in column (m) the settlement<br />
amount for the net receipt of energy. If more energy was delivered than received, enter a negative amount. If the settlement amount (l)<br />
include credits or charges other than incremental generation expenses, or (2) excludes certain credits or charges covered by the<br />
agreement, provide an explanatory footnote.<br />
8. The data in column (g) through (m) must be totalled on the last line of the schedule. The total amount in column (g) must be<br />
reported as Purchases on Page 401, line 10. The total amount in column (h) must be reported as Exchange Received on Page 401,<br />
line 12. The total amount in column (i) must be reported as Exchange Delivered on Page 401, line 13.<br />
9. Footnote entries as required <strong>and</strong> provide explanations following all required data.<br />
POWER EXCHANGES<br />
MegaWatt Hours<br />
MegaWatt Hours MegaWatt Hours<br />
Purchased<br />
Received<br />
Delivered<br />
(g)<br />
(h)<br />
(i)<br />
24,945,160<br />
4,410,945<br />
932,409<br />
-80,053<br />
COST/SETTLEMENT OF POWER<br />
Line<br />
Dem<strong>and</strong> Charges Energy Charges Other Charges Total (j+k+l) No.<br />
($) ($) ($)<br />
of Settlement ($)<br />
(j)<br />
(k)<br />
(l)<br />
(m)<br />
1<br />
97,310 10,299 107,609 2<br />
4,304,869 54,895 4,359,764 3<br />
1,668,493 16,438 1,684,931 4<br />
3,577,902 49,664 3,627,566 5<br />
2,895,200 21,810 2,917,010 6<br />
469,309,542 469,309,542 9<br />
39,740,350 39,740,350 10<br />
69,503,871 69,503,871 11<br />
2,015,239 2,015,239 12<br />
1,304,413 1,304,413 13<br />
7<br />
8<br />
14<br />
44,837,023 754,305,279 2,879,319,814 -87,416 3,633,537,677<br />
<strong>FERC</strong> FORM NO. 1 (ED. 12-90) Page 327.27
Name of Respondent<br />
PACIFIC GAS AND ELECTRIC COMPANY<br />
This Report Is:<br />
Date of Report<br />
(1) X An Original<br />
(Mo, Da, Yr)<br />
(2) A Resubmission<br />
04/08/2011<br />
PURCHASED POWER(Account 555) (Continued)<br />
(Including power exchanges)<br />
Year/Period of Report<br />
End of <strong>2010</strong>/Q4<br />
AD - for out-of-period adjustment. Use this code for any accounting adjustments or "true-ups" for service provided in prior reporting<br />
years. Provide an explanation in a footnote for each adjustment.<br />
4. In column (c), identify the <strong>FERC</strong> Rate Schedule Number or Tariff, or, for non-<strong>FERC</strong> jurisdictional sellers, include an appropriate<br />
designation for the contract. On separate lines, list all <strong>FERC</strong> rate schedules, tariffs or contract designations under which service, as<br />
identified in column (b), is provided.<br />
5. For requirements RQ purchases <strong>and</strong> any type of service involving dem<strong>and</strong> charges imposed on a monnthly (or longer) basis, enter<br />
the monthly average billing dem<strong>and</strong> in column (d), the average monthly non-coincident peak (NCP) dem<strong>and</strong> in column (e), <strong>and</strong> the<br />
average monthly coincident peak (CP) dem<strong>and</strong> in column (f). For all other types of service, enter NA in columns (d), (e) <strong>and</strong> (f). Monthly<br />
NCP dem<strong>and</strong> is the maximum metered hourly (60-minute integration) dem<strong>and</strong> in a month. Monthly CP dem<strong>and</strong> is the metered dem<strong>and</strong><br />
during the hour (60-minute integration) in which the supplier's system reaches its monthly peak. Dem<strong>and</strong> reported in columns (e) <strong>and</strong> (f)<br />
must be in megawatts. Footnote any dem<strong>and</strong> not stated on a megawatt basis <strong>and</strong> explain.<br />
6. Report in column (g) the megawatthours shown on bills rendered to the respondent. Report in columns (h) <strong>and</strong> (i) the megawatthours<br />
of power exchanges received <strong>and</strong> delivered, used as the basis for settlement. Do not report net exchange.<br />
7. Report dem<strong>and</strong> charges in column (j), energy charges in column (k), <strong>and</strong> the total of any other types of charges, including<br />
out-of-period adjustments, in column (l). Explain in a footnote all components of the amount shown in column (l). Report in column (m)<br />
the total charge shown on bills received as settlement by the respondent. For power exchanges, report in column (m) the settlement<br />
amount for the net receipt of energy. If more energy was delivered than received, enter a negative amount. If the settlement amount (l)<br />
include credits or charges other than incremental generation expenses, or (2) excludes certain credits or charges covered by the<br />
agreement, provide an explanatory footnote.<br />
8. The data in column (g) through (m) must be totalled on the last line of the schedule. The total amount in column (g) must be<br />
reported as Purchases on Page 401, line 10. The total amount in column (h) must be reported as Exchange Received on Page 401,<br />
line 12. The total amount in column (i) must be reported as Exchange Delivered on Page 401, line 13.<br />
9. Footnote entries as required <strong>and</strong> provide explanations following all required data.<br />
MegaWatt Hours<br />
Purchased<br />
(g)<br />
POWER EXCHANGES<br />
MegaWatt Hours MegaWatt Hours<br />
Received<br />
(h)<br />
Delivered<br />
(i)<br />
COST/SETTLEMENT OF POWER<br />
Line<br />
Dem<strong>and</strong> Charges Energy Charges Other Charges Total (j+k+l) No.<br />
($) ($) ($)<br />
of Settlement ($)<br />
(j)<br />
(k)<br />
(l)<br />
(m)<br />
741,949,363 741,949,363 1<br />
13,378,758 13,378,758 3<br />
2<br />
4<br />
5<br />
6<br />
7<br />
8<br />
9<br />
10<br />
11<br />
12<br />
13<br />
14<br />
44,837,023 754,305,279 2,879,319,814 -87,416 3,633,537,677<br />
<strong>FERC</strong> FORM NO. 1 (ED. 12-90) Page 327.28
Name of Respondent<br />
PACIFIC GAS AND ELECTRIC COMPANY<br />
This Report is:<br />
(1) X An Original<br />
(2) A Resubmission<br />
Date of Report<br />
(Mo, Da, Yr)<br />
04/08/2011<br />
Year/Period of Report<br />
<strong>2010</strong>/Q4<br />
FOOTNOTE DATA<br />
Schedule Page: 326 Line No.: 1 Column: c<br />
No <strong>FERC</strong> rate schedules are provided in column (c) for QF's <strong>and</strong> Independent Power Producers<br />
because these companies are non-<strong>FERC</strong> jurisdictional sellers.<br />
Schedule Page: 326.13 Line No.: 1 Column: a<br />
The following is a list of QF's under 1 MW:<br />
AMERICAN ENERGY, INC. (SAN LUIS<br />
BYPASS)<br />
AMERICAN ENERGY, INC. ( WOLFSEN<br />
BYPASS )<br />
ARBUCKLE MOUNTAIN HYDRO<br />
BAILEY CREEK RANCH<br />
BROWNS VALLEY IRRIGATION DISTRICT<br />
CALAVERAS YUBA HYDRO #1<br />
CALAVERAS YUBA HYDRO #2<br />
CALAVERAS YUBA HYDRO #3<br />
CANAL CREEK POWER PLANT (RETA)<br />
CHARCOAL RAVINE<br />
CITY OF WATSONVILLE<br />
COVANTA POWER PACIFIC, STOCKTON<br />
DAVID O. HARDE<br />
DIGGER CREEK RANCH<br />
DONALD R. CHENOWETH<br />
E J M MCFADDEN<br />
EAGLE HYDRO<br />
ERIC AND DEBBIE WATTENBURG<br />
FAIRFIELD POWER PLANT (PAPAZIAN)<br />
FAR WEST POWER CORPORATION<br />
FIVE BEARS HYDROELECTRIC<br />
GAS RECOVERY SYSTEMS, INC [SANTA<br />
CRUZ]<br />
HAT CREEK HEREFORD RANCH<br />
HENWOOD ASSOCIATES<br />
JACKSON VALLEY IRRIGATION DIST<br />
JAMES B. PETER<br />
JAMES CRANE HYDRO<br />
JOHN NEERHOUT JR.<br />
KAREN RIPPEY<br />
KINGS RIVER HYDRO CO.<br />
L.P. REINHARD<br />
LANGERWERF DAIRY<br />
LASSEN STATION HYDRO<br />
LOFTON RANCH<br />
MADERA CANAL (1174 + 84)<br />
MADERA CANAL (1923)<br />
MADERA CANAL STATION 1302<br />
MEGA HYDRO #1 (CLOVER CREEK)<br />
MEGA HYDRO (GOOSE VALLEY RANCH)<br />
<strong>FERC</strong> FORM NO. 1 (ED. 12-87) Page 450.1
Name of Respondent<br />
PACIFIC GAS AND ELECTRIC COMPANY<br />
This Report is:<br />
(1) X An Original<br />
(2) A Resubmission<br />
Date of Report<br />
(Mo, Da, Yr)<br />
04/08/2011<br />
Year/Period of Report<br />
<strong>2010</strong>/Q4<br />
FOOTNOTE DATA<br />
MEGA RENEWABLES (SILVER SPRINGS)<br />
MICHAEL W. STEPHENS<br />
MILL & SULPHUR CREEK<br />
NID/SCOTTS FLAT<br />
ORANGE COVE IRRIGATION DIST.<br />
PAN PACIFIC (WEBER FLAT)<br />
PLACER COUNTY WATER AGENCY<br />
REAL GOODS TRADING CORP.<br />
ROBERT AND JOYCE VIEUX<br />
ROBERT W. LEE<br />
ROBIN WILLIAMS SOLAR POWER GEN<br />
ROCK CREEK WATER DISTRICT<br />
SANTA CLARA VALLEY WATER DIST.<br />
SCHAADS HYDRO<br />
SHAMROCK UTILITIES (CEDAR FLAT)<br />
SHAMROCK UTILITIES (CLOVER LEAF)<br />
SHEILA ST. GERMAIN<br />
SIERRA ENERGY<br />
SNOW MOUNTAIN HYDRO LLC (LOST<br />
CREEK 2)<br />
SOUTH SUTTER WATER<br />
STEVE & BONNIE TETRICK<br />
STEVEN SPELLENBERG HYDRO<br />
SUTTER'S MILL<br />
SWISS AMERICA<br />
TOM BENNINGHOVEN<br />
VECINO VINEYARDS LLC<br />
WATER WHEEL RANCH<br />
WENDEL ENERGY OPERATIONS 1,LLC<br />
WRIGHT RANCH HYDROELECTRIC<br />
YOUTH WITH A MISSION/SPRINGS OF<br />
LIVING WATERS<br />
YUBA COUNTY WATER AGENCY<br />
1080 CHESTNUT CORP.<br />
AIRPORT CLUB<br />
ARDEN WOOD BENEVOLENT ASSOC.<br />
CITY OF FAIRFIELD<br />
CITY OF MILPITAS<br />
GREATER VALLEJO RECREATION<br />
DISTRICT<br />
COUNTY OF SANTA CRUZ ( WATER ST.<br />
JAIL)<br />
DOLE ENTERPRISES, INC<br />
HAYWARD AREA REC & PARK DIST.<br />
NIHONMACHI TERRACE<br />
OCCIDENTAL OF ELK HILLS<br />
ORINDA SENIOR VILLAGE<br />
RED BLUFF UNION HIGH SCHOOL<br />
<strong>FERC</strong> FORM NO. 1 (ED. 12-87) Page 450.2
Name of Respondent<br />
PACIFIC GAS AND ELECTRIC COMPANY<br />
This Report is:<br />
(1) X An Original<br />
(2) A Resubmission<br />
Date of Report<br />
(Mo, Da, Yr)<br />
04/08/2011<br />
Year/Period of Report<br />
<strong>2010</strong>/Q4<br />
FOOTNOTE DATA<br />
SATELLITE SENIOR HOMES<br />
STANFORD ENERGY GROUP<br />
UCSC PHYSICAL PLANT<br />
YOUNG RADIO INC.<br />
YUBA CITY RACQUET CLUB<br />
Schedule Page: 326.27 Line No.: 10 Column: a<br />
The Non-UEG fuel costs is gas purchased for the bilateral contracts (tolling agreements)<br />
with LSP Morro Bay, LSP Moss L<strong>and</strong>ing, <strong>and</strong> Mirant Pittsburg <strong>and</strong> Contra Costa.<br />
Schedule Page: 326.28 Line No.: 3 Column: a<br />
These expenses consist of Transmission Service Costs related to power losses, PX Admin<br />
Fees, Circuit Leases, Other Consulting Services (Independent Evaluator costs), <strong>and</strong><br />
miscellaneous expenses.<br />
<strong>FERC</strong> FORM NO. 1 (ED. 12-87) Page 450.3
Name of Respondent<br />
This Report Is:<br />
Date of Report<br />
(1) X An Original<br />
(Mo, Da, Yr)<br />
PACIFIC GAS AND ELECTRIC COMPANY<br />
(2) A Resubmission<br />
04/08/2011<br />
TRANSMISSION OF ELECTRICITY FOR OTHERS (Account 456.1)<br />
(Including transactions referred to as 'wheeling')<br />
Year/Period of Report<br />
End of <strong>2010</strong>/Q4<br />
1. Report all transmission of electricity, i.e., wheeling, provided for other electric utilities, cooperatives, other public authorities,<br />
qualifying facilities, non-traditional utility suppliers <strong>and</strong> ultimate customers for the quarter.<br />
2. Use a separate line of data for each distinct type of transmission service involving the entities listed in column (a), (b) <strong>and</strong> (c).<br />
3. Report in column (a) the company or public authority that paid for the transmission service. Report in column (b) the company or<br />
public authority that the energy was received from <strong>and</strong> in column (c) the company or public authority that the energy was delivered to.<br />
Provide the full name of each company or public authority. Do not abbreviate or truncate name or use acronyms. Explain in a footnote<br />
any ownership interest in or affiliation the respondent has with the entities listed in columns (a), (b) or (c)<br />
4. In column (d) enter a Statistical Classification code based on the original contractual terms <strong>and</strong> conditions of the service as follows:<br />
FNO - Firm Network Service for Others, FNS - Firm Network Transmission Service for Self, LFP - "Long-Term Firm Point to Point<br />
Transmission Service, OLF - Other Long-Term Firm Transmission Service, SFP - Short-Term Firm Point to Point Transmission<br />
Reservation, NF - non-firm transmission service, OS - Other Transmission Service <strong>and</strong> AD - Out-of-Period Adjustments. Use this code<br />
for any accounting adjustments or "true-ups" for service provided in prior reporting periods. Provide an explanation in a footnote for<br />
each adjustment. See General Instruction for definitions of codes.<br />
Line<br />
No.<br />
1<br />
2<br />
3<br />
4<br />
5<br />
6<br />
7<br />
8<br />
9<br />
10<br />
11<br />
12<br />
13<br />
14<br />
15<br />
16<br />
17<br />
18<br />
19<br />
20<br />
21<br />
22<br />
23<br />
24<br />
25<br />
26<br />
27<br />
28<br />
29<br />
30<br />
31<br />
32<br />
33<br />
34<br />
Payment By<br />
(<strong>Company</strong> of Public Authority)<br />
Energy Received From<br />
(<strong>Company</strong> of Public Authority)<br />
Energy Delivered To<br />
(<strong>Company</strong> of Public Authority)<br />
(Footnote Affiliation)<br />
(Footnote Affiliation)<br />
(Footnote Affiliation)<br />
(a)<br />
(b)<br />
(c)<br />
WESTERN AREA POWER<br />
ADMINISTRATION (WAPA)<br />
CONTRACT 2207A WAPA Various LFP<br />
WHOLESALE DISTRIBUTION TARIFF,<br />
SERVICE AGREEMENT NO. 17 WAPA Various LFP<br />
CITY & COUNTY OF SAN<br />
FRANCISCO (CCSF)<br />
TRANSMISSION CCSF CCSF LFP<br />
INTERRUPTIBLE TRANSMISSION Various CCSF NF<br />
CALIFORNIA DEPARTMENT OF WATER<br />
RESOURCES (DWR)<br />
HIGH VOLTAGE<br />
LOW VOLTAGE<br />
TO WAMP DWR Various LFP<br />
WAPA DWR Various LFP<br />
TO/FROM N/W DWR Various LFP<br />
TO LMUD DWR LMUD LFP<br />
TO MID DWR MID LFP<br />
TO NCPA DWR NCPA LFP<br />
TO CCSF DWR CCSF LFP<br />
TO TID DWR TID LFP<br />
TO ETAWANDA DWR ETAWANDA LFP<br />
TO SVP DWR SVP LFP<br />
SF BAY AREA RAPID TRANSIT (BART) NCPA/WAPA SF BART LFP<br />
TRANSMISSION AGENCY OF<br />
NORTHERN CALIFORNIA (TANC) Various Various LFP<br />
Statistical<br />
Classification<br />
(d)<br />
TOTAL<br />
<strong>FERC</strong> FORM NO. 1 (ED. 12-90) Page 328
Name of Respondent<br />
This Report Is:<br />
Date of Report<br />
(1) X An Original<br />
(Mo, Da, Yr)<br />
PACIFIC GAS AND ELECTRIC COMPANY<br />
(2) A Resubmission<br />
04/08/2011<br />
TRANSMISSION OF ELECTRICITY FOR OTHERS (Account 456)(Continued)<br />
(Including transactions reffered to as 'wheeling')<br />
Year/Period of Report<br />
End of <strong>2010</strong>/Q4<br />
5. In column (e), identify the <strong>FERC</strong> Rate Schedule or Tariff Number, On separate lines, list all <strong>FERC</strong> rate schedules or contract<br />
designations under which service, as identified in column (d), is provided.<br />
6. Report receipt <strong>and</strong> delivery locations for all single contract path, "point to point" transmission service. In column (f), report the<br />
designation for the substation, or other appropriate identification for where energy was received as specified in the contract. In column<br />
(g) report the designation for the substation, or other appropriate identification for where energy was delivered as specified in the<br />
contract.<br />
7. Report in column (h) the number of megawatts of billing dem<strong>and</strong> that is specified in the firm transmission service contract. Dem<strong>and</strong><br />
reported in column (h) must be in megawatts. Footnote any dem<strong>and</strong> not stated on a megawatts basis <strong>and</strong> explain.<br />
8. Report in column (i) <strong>and</strong> (j) the total megawatthours received <strong>and</strong> delivered.<br />
<strong>FERC</strong> Rate Point of Receipt<br />
Point of Delivery<br />
Billing<br />
TRANSFER OF ENERGY Line<br />
Schedule of (Subsatation or Other (Substation or Other<br />
Dem<strong>and</strong><br />
MegaWatt Hours MegaWatt Hours No.<br />
Tariff Number Designation)<br />
Designation)<br />
(MW)<br />
Received<br />
Delivered<br />
(e)<br />
(f)<br />
(g)<br />
(h)<br />
(i)<br />
(j)<br />
1<br />
2<br />
3<br />
227 Various<br />
Various 41 136,465 130,716 4<br />
5<br />
SA17 Various<br />
Various 6<br />
7<br />
8<br />
9<br />
114 Newark<br />
Various 175 905,746 888,980 10<br />
114 Newark<br />
Various 11<br />
12<br />
13<br />
14<br />
1,300 578,483 562,453 15<br />
53,747 52,257 16<br />
77 Various<br />
Various 17<br />
77 Various<br />
Various 18<br />
77 Various<br />
Malin 19<br />
77 Various<br />
Various 20<br />
77 Various<br />
Tracy 21<br />
77 Various<br />
Various 22<br />
77 Various<br />
Various 23<br />
77 Various<br />
Tracy 24<br />
77 Various<br />
Various 25<br />
77 Various<br />
Various 26<br />
27<br />
SA 30 COTP Terminus/-<br />
Various 62 358,086 348,163 28<br />
Tracy Substation 29<br />
30<br />
143 Midway<br />
Various 233 409,341 401,512 31<br />
32<br />
33<br />
34<br />
1,811 2,441,868 2,384,081<br />
<strong>FERC</strong> FORM NO. 1 (ED. 12-90) Page 329
Name of Respondent<br />
This Report Is:<br />
Date of Report<br />
(1) X An Original<br />
(Mo, Da, Yr)<br />
PACIFIC GAS AND ELECTRIC COMPANY<br />
(2) A Resubmission<br />
04/08/2011<br />
TRANSMISSION OF ELECTRICITY FOR OTHERS (Account 456) (Continued)<br />
(Including transactions reffered to as 'wheeling')<br />
Year/Period of Report<br />
End of <strong>2010</strong>/Q4<br />
9. In column (k) through (n), report the revenue amounts as shown on bills or vouchers. In column (k), provide revenues from dem<strong>and</strong><br />
charges related to the billing dem<strong>and</strong> reported in column (h). In column (I), provide revenues from energy charges related to the<br />
amount of energy transferred. In column (m), provide the total revenues from all other charges on bills or vouchers rendered, including<br />
out of period adjustments. Explain in a footnote all components of the amount shown in column (m). Report in column (n) the total<br />
charge shown on bills rendered to the entity Listed in column (a). If no monetary settlement was made, enter zero (11011) in column<br />
(n). Provide a footnote explaining the nature of the non-monetary settlement, including the amount <strong>and</strong> type of energy or service<br />
rendered.<br />
10. The total amounts in columns (i) <strong>and</strong> (j) must be reported as Transmission Received <strong>and</strong> Transmission Delivered for annual report<br />
purposes only on Page 401, Lines 16 <strong>and</strong> 17, respectively.<br />
11. Footnote entries <strong>and</strong> provide explanations following all required data.<br />
Dem<strong>and</strong> Charges<br />
($)<br />
(k)<br />
REVENUE FROM TRANSMISSION OF ELECTRICITY FOR OTHERS<br />
Energy Charges<br />
($)<br />
(Other Charges)<br />
($)<br />
Total Revenues ($)<br />
(k+l+m)<br />
Line<br />
No.<br />
(l)<br />
(m)<br />
(n)<br />
1<br />
2<br />
3<br />
61,900 43,569 19,986<br />
125,455 4<br />
5<br />
6<br />
7<br />
8<br />
9<br />
4,668,670 172,141<br />
4,840,811 10<br />
11<br />
12<br />
13<br />
14<br />
2,169,929 186,768<br />
2,356,697 15<br />
202,758 202,758 16<br />
17<br />
18<br />
19<br />
20<br />
21<br />
22<br />
23<br />
24<br />
25<br />
26<br />
27<br />
2,869,271 -4,893 2,864,378 28<br />
29<br />
30<br />
1,477,564 -11,641<br />
1,465,923 31<br />
32<br />
33<br />
34<br />
2,931,171 8,562,490<br />
362,361<br />
11,856,022<br />
<strong>FERC</strong> FORM NO. 1 (ED. 12-90) Page 330
Name of Respondent<br />
PACIFIC GAS AND ELECTRIC COMPANY<br />
This Report is:<br />
(1) X An Original<br />
(2) A Resubmission<br />
Date of Report<br />
(Mo, Da, Yr)<br />
04/08/2011<br />
Year/Period of Report<br />
<strong>2010</strong>/Q4<br />
FOOTNOTE DATA<br />
Schedule Page: 328 Line No.: 1 Column: a<br />
<strong>Company</strong> or Public Authority<br />
Termination<br />
Date<br />
WESTERN AREA POWER ADMINISTRATION<br />
CONTRACT 2207A 03/31/2016<br />
CITY & COUNTY OF SAN FRANCISCO<br />
TRANSMISSION 07/01/2015<br />
INTERRUPTIBLE TRANSMISSION 07/01/2015<br />
CALIFORNIA DEPARTMENT OF WATER RESOURCES<br />
TO WAMP 12/31/2014<br />
WAPA 12/31/2014<br />
TO/FROM N/W 12/31/2014<br />
TO LMUD 12/31/2014<br />
TO MID 12/31/2014<br />
TO NCPA 12/31/2014<br />
TO CCSF 12/31/2014<br />
TO TID 12/31/2014<br />
TO ETAWANDA 12/31/2014<br />
TO SVP 12/31/2014<br />
SF BAY AREA RAPID TRANSIT 10/01/2016<br />
TRANSMISSION AGENCY OF NORTHERN CALIFORNIA *<br />
*(This contract is effective until a successor transmission<br />
service agreement is executed by the Utility <strong>and</strong> TANC.)<br />
Schedule Page: 328 Line No.: 4 Column: m<br />
Other charges ($11,986) represent booking estimate adjustments. Other Charges also include<br />
$8,000 in revenue erroneously booked to the WAPA account. This amount should have been<br />
excluded as it goes through the Transmission Revenue Balancing Account not this account.<br />
Schedule Page: 328 Line No.: 10 Column: m<br />
Other Charges represent booking estimate adjustments. In September 2003 the Utility<br />
changed billing methodology using energy as billing determinants rather than contract<br />
dem<strong>and</strong>. The change was pursuant to the TO6 Settlement Agreement under <strong>FERC</strong> Docket No.<br />
ER03-666-000.<br />
Schedule Page: 328 Line No.: 10 Column: n<br />
Revenue data represent transmission only.<br />
Schedule Page: 328 Line No.: 13 Column: a<br />
The DWR acts as its own Scheduling Coordinator <strong>and</strong>, as such, is charged losses by the<br />
California Independent System Operator ("CAISO"). The Utility does not have access to DWR<br />
loss data under the CAISO. The losses shown here are estimates based on the Utility's<br />
system average losses of 2.85%.<br />
Further, the DWR acting as its own Scheduling Coordinator is not obligated to provide the<br />
Utility with individual schedules. Without these schedules, the Utility cannot determine<br />
the revenue or energy attributable to each delivery point.<br />
Schedule Page: 328 Line No.: 15 Column: m<br />
Other Charges represent booking estimate adjustments. In September 2003 the Utility<br />
changed billing methodology using energy as billing determinants rather than contract<br />
dem<strong>and</strong>. The change was pursuant to the TO6 Settlement Agreement under <strong>FERC</strong> Docket No.<br />
ER03-666-000.<br />
Schedule Page: 328 Line No.: 28 Column: e<br />
Transmission is provided under the Open Access Tariff, Docket No. OA96-28-000 (<strong>FERC</strong><br />
<strong>Electric</strong> Tariff Original Volume No. 3). Service Agreement (SA) No. 30, Docket<br />
ER97-4393-000.<br />
<strong>FERC</strong> FORM NO. 1 (ED. 12-87) Page 450.1
Name of Respondent<br />
PACIFIC GAS AND ELECTRIC COMPANY<br />
This Report is:<br />
(1) X An Original<br />
(2) A Resubmission<br />
Date of Report<br />
(Mo, Da, Yr)<br />
04/08/2011<br />
Year/Period of Report<br />
<strong>2010</strong>/Q4<br />
FOOTNOTE DATA<br />
Schedule Page: 328 Line No.: 28 Column: h<br />
BART's Network Transmission dem<strong>and</strong> is an average of twelve monthly dem<strong>and</strong>s.<br />
Schedule Page: 328 Line No.: 28 Column: m<br />
Other charges represent booking estimate adjustments.<br />
Schedule Page: 328 Line No.: 30 Column: a<br />
Transmission is provided under the Midway Transmission Service.<br />
Recorded here are the Midway Transmission Service data for TANC members which include<br />
Modesto Irrigation District, Sacramento Municipal Utility District, City of Redding, <strong>and</strong><br />
the Turlock Irrigation District.<br />
Schedule Page: 328 Line No.: 31 Column: m<br />
Other Charges represent booking estimate adjustments. In September 2003 the Utility<br />
changed billing methodology using energy as billing determinants rather than contract<br />
dem<strong>and</strong>. The change was pursuant to the TO6 Settlement Agreement under <strong>FERC</strong> Docket No.<br />
ER03-666-000.<br />
<strong>FERC</strong> FORM NO. 1 (ED. 12-87) Page 450.2
Name of Respondent<br />
PACIFIC GAS AND ELECTRIC COMPANY<br />
This Report Is:<br />
Date of Report<br />
(1) X An Original<br />
(Mo, Da, Yr)<br />
(2) A Resubmission<br />
04/08/2011<br />
TRANSMISSION OF ELECTRICITY BY OTHERS (Account 565)<br />
(Including transactions referred to as "wheeling")<br />
Year/Period of Report<br />
End of <strong>2010</strong>/Q4<br />
1. Report all transmission, i.e. wheeling or electricity provided by other electric utilities, cooperatives, municipalities, other public<br />
authorities, qualifying facilities, <strong>and</strong> others for the quarter.<br />
2. In column (a) report each company or public authority that provided transmission service. Provide the full name of the company,<br />
abbreviate if necessary, but do not truncate name or use acronyms. Explain in a footnote any ownership interest in or affiliation with the<br />
transmission service provider. Use additional columns as necessary to report all companies or public authorities that provided<br />
transmission service for the quarter reported.<br />
3. In column (b) enter a Statistical Classification code based on the original contractual terms <strong>and</strong> conditions of the service as follows:<br />
FNS - Firm Network Transmission Service for Self, LFP - Long-Term Firm Point-to-Point Transmission Reservations. OLF - Other<br />
Long-Term Firm Transmission Service, SFP - Short-Term Firm Point-to- Point Transmission Reservations, NF - Non-Firm Transmission<br />
Service, <strong>and</strong> OS - Other Transmission Service. See General Instructions for definitions of statistical classifications.<br />
4. Report in column (c) <strong>and</strong> (d) the total megawatt hours received <strong>and</strong> delivered by the provider of the transmission service.<br />
5. Report in column (e), (f) <strong>and</strong> (g) expenses as shown on bills or vouchers rendered to the respondent. In column (e) report the<br />
dem<strong>and</strong> charges <strong>and</strong> in column (f) energy charges related to the amount of energy transferred. On column (g) report the total of all<br />
other charges on bills or vouchers rendered to the respondent, including any out of period adjustments. Explain in a footnote all<br />
components of the amount shown in column (g). Report in column (h) the total charge shown on bills rendered to the respondent. If no<br />
monetary settlement was made, enter zero in column (h). Provide a footnote explaining the nature of the non-monetary settlement,<br />
including the amount <strong>and</strong> type of energy or service rendered.<br />
6. Enter "TOTAL" in column (a) as the last line.<br />
7. Footnote entries <strong>and</strong> provide explanations following all required data.<br />
Line<br />
No.<br />
1<br />
2<br />
3<br />
4<br />
5<br />
6<br />
7<br />
8<br />
9<br />
10<br />
11<br />
12<br />
13<br />
14<br />
15<br />
16<br />
Name of <strong>Company</strong> or Public<br />
Authority (Footnote Affiliations)<br />
(a)<br />
California - Oregon<br />
Transmission Project<br />
<strong>Pacific</strong>orp<br />
Sacramento Municipal<br />
Utility District<br />
Western Area Power<br />
Administration<br />
California-Oregon<br />
Intertie<br />
Other<br />
Statistical<br />
Classification<br />
(b)<br />
TRANSFER OF ENERGY<br />
Magawatthours<br />
hours<br />
Magawatt-<br />
Received Delivered<br />
(c)<br />
(d)<br />
EXPENSES FOR TRANSMISSION OF ELECTRICITY BY OTHERS<br />
Dem<strong>and</strong> Energy<br />
Other Total Cost of<br />
Charges Charges Charges<br />
($)<br />
($)<br />
($)<br />
Transmission<br />
($)<br />
(e)<br />
(f)<br />
(g)<br />
(h)<br />
OS 223,601<br />
223,601<br />
OS 20,000,000<br />
372,135<br />
20,372,135<br />
OS 100,992<br />
100,992<br />
OS 1,222<br />
192,000<br />
193,222<br />
OS 680,417<br />
680,417<br />
OS 2,045<br />
2,045<br />
TOTAL<br />
20,102,214 1,470,198 21,572,412<br />
<strong>FERC</strong> FORM NO. 1/3-Q (REV. 02-04) Page 332
Name of Respondent<br />
PACIFIC GAS AND ELECTRIC COMPANY<br />
This Report is:<br />
(1) X An Original<br />
(2) A Resubmission<br />
Date of Report<br />
(Mo, Da, Yr)<br />
04/08/2011<br />
Year/Period of Report<br />
<strong>2010</strong>/Q4<br />
FOOTNOTE DATA<br />
Schedule Page: 332 Line No.: 2 Column: g<br />
Represents operation <strong>and</strong> maintenance costs.<br />
Schedule Page: 332 Line No.: 3 Column: e<br />
Represents payments for lease of transmission capacity.<br />
Schedule Page: 332 Line No.: 3 Column: g<br />
Represents operation <strong>and</strong> maintenance costs.<br />
Schedule Page: 332 Line No.: 5 Column: e<br />
Represents payments for lease of transmission capacity.<br />
Schedule Page: 332 Line No.: 7 Column: e<br />
Represents payments for lease of transmission capacity.<br />
Schedule Page: 332 Line No.: 7 Column: g<br />
Represents operation <strong>and</strong> maintenance costs.<br />
Schedule Page: 332 Line No.: 9 Column: g<br />
Represents payments for administrative costs for scheduling services provided by the<br />
California Independent System Operator.<br />
Schedule Page: 332 Line No.: 10 Column: g<br />
Represents other administrative costs<br />
<strong>FERC</strong> FORM NO. 1 (ED. 12-87) Page 450.1
Name of Respondent<br />
This Report Is:<br />
Date of Report<br />
Year/Period of Report<br />
(1) An Original<br />
(Mo, Da, Yr)<br />
PACIFIC GAS AND ELECTRIC COMPANY<br />
X<br />
End of <strong>2010</strong>/Q4<br />
(2) A Resubmission<br />
04/08/2011<br />
MISCELLANEOUS GENERAL EXPENSES (Account 930.2) (ELECTRIC)<br />
Line Description Amount<br />
No.<br />
(a)<br />
(b)<br />
1 Industry Association Dues<br />
2 Nuclear Power Research Expenses<br />
3 Other Experimental <strong>and</strong> General Research Expenses<br />
4 Pub & Dist Info to Stkhldrs...expn servicing outst<strong>and</strong>ing Securities<br />
5 Oth Expn >=5,000 show purpose, recipient, amount. Group if < $5,000<br />
6<br />
7 Bank Service Fees<br />
3,089,316<br />
8 Intervenor Compensation<br />
1,648,797<br />
9 MCI-PG&E Exchange Rights<br />
864,577<br />
10 Consulting Services, Outside Attorney Fees, <strong>and</strong> Cs<br />
279,056<br />
11 Write off from miscellaneous reconciliations<br />
113,756<br />
12 Intercompany Billings Timing Difference<br />
86,013<br />
13 Clearing Account Adjustments<br />
-1,266,320<br />
14 Cash bonus from procurement card usage<br />
-89,675<br />
15 Cost adjustments<br />
-85,649<br />
16 Miscellaneous cash receipt (recovery of unclaimed)<br />
-10,503<br />
17 Restituition Cash Receipts from Employees<br />
-6,825<br />
18<br />
19<br />
20<br />
21<br />
22<br />
23<br />
24<br />
25<br />
26<br />
27<br />
28<br />
29<br />
30<br />
31<br />
32<br />
33<br />
34<br />
35<br />
36<br />
37<br />
38<br />
39<br />
40<br />
41<br />
42<br />
43<br />
44<br />
45<br />
5,649<br />
46 TOTAL<br />
4,628,192<br />
<strong>FERC</strong> FORM NO. 1 (ED. 12-94) Page 335
Name of Respondent<br />
This Report Is:<br />
Date of Report<br />
Year/Period of Report<br />
(1) X An Original<br />
(Mo, Da, Yr)<br />
PACIFIC GAS AND ELECTRIC COMPANY<br />
End of <strong>2010</strong>/Q4<br />
(2) A Resubmission<br />
04/08/2011<br />
DEPRECIATION AND AMORTIZATION OF ELECTRIC PLANT (Account 403, 404, 405)<br />
(Except amortization of aquisition adjustments)<br />
1. Report in section A for the year the amounts for : (b) Depreciation Expense (Account 403; (c) Depreciation Expense for Asset<br />
Retirement Costs (Account 403.1; (d) Amortization of Limited-Term <strong>Electric</strong> Plant (Account 404); <strong>and</strong> (e) Amortization of Other <strong>Electric</strong><br />
Plant (Account 405).<br />
2. Report in Section 8 the rates used to compute amortization charges for electric plant (Accounts 404 <strong>and</strong> 405). State the basis used to<br />
compute charges <strong>and</strong> whether any changes have been made in the basis or rates used from the preceding report year.<br />
3. Report all available information called for in Section C every fifth year beginning with report year 1971, reporting annually only changes<br />
to columns (c) through (g) from the complete report of the preceding year.<br />
Unless composite depreciation accounting for total depreciable plant is followed, list numerically in column (a) each plant subaccount,<br />
account or functional classification, as appropriate, to which a rate is applied. Identify at the bottom of Section C the type of plant<br />
included in any sub-account used.<br />
In column (b) report all depreciable plant balances to which rates are applied showing subtotals by functional Classifications <strong>and</strong> showing<br />
composite total. Indicate at the bottom of section C the manner in which column balances are obtained. If average balances, state the<br />
method of averaging used.<br />
For columns (c), (d), <strong>and</strong> (e) report available information for each plant subaccount, account or functional classification Listed in column<br />
(a). If plant mortality studies are prepared to assist in estimating average service Lives, show in column (f) the type mortality curve<br />
selected as most appropriate for the account <strong>and</strong> in column (g), if available, the weighted average remaining life of surviving plant. If<br />
composite depreciation accounting is used, report available information called for in columns (b) through (g) on this basis.<br />
4. If provisions for depreciation were made during the year in addition to depreciation provided by application of reported rates, state at<br />
the bottom of section C the amounts <strong>and</strong> nature of the provisions <strong>and</strong> the plant items to which related.<br />
A. Summary of Depreciation <strong>and</strong> Amortization Charges<br />
Depreciation Amortization of<br />
Line<br />
Depreciation Expense for Asset Limited Term Amortization of<br />
Functional Classification<br />
Expense Retirement Costs <strong>Electric</strong> Plant Other <strong>Electric</strong><br />
No.<br />
(Account 403) (Account 403.1) (Account 404) Plant (Acc 405)<br />
(a)<br />
(b)<br />
(c)<br />
(d)<br />
(e)<br />
1 Intangible Plant<br />
4,186,300<br />
2 Steam Production Plant<br />
-17,140,033 7,952,886<br />
3 Nuclear Production Plant<br />
58,804,251 38,730,540<br />
4 Hydraulic Production Plant-Conventional<br />
40,772,871 13,229,406<br />
5 Hydraulic Production Plant-Pumped Storage<br />
1,395,497 7,789,695<br />
6 Other Production Plant<br />
8,315,682 2,549,350<br />
7 Transmission Plant<br />
156,059,818<br />
8 Distribution Plant<br />
640,614,067<br />
9 Regional Transmission <strong>and</strong> Market Operation<br />
10 General Plant<br />
5,230,670<br />
11 Common Plant-<strong>Electric</strong><br />
109,080,147 60,626,565<br />
12 TOTAL<br />
1,003,132,970 64,812,865 70,251,877<br />
Total<br />
(f)<br />
4,186,300<br />
-9,187,147<br />
97,534,791<br />
54,002,277<br />
9,185,192<br />
10,865,032<br />
156,059,818<br />
640,614,067<br />
5,230,670<br />
169,706,712<br />
1,138,197,712<br />
B. Basis for Amortization Charges<br />
<strong>FERC</strong> FORM NO. 1 (REV. 12-03) Page 336
Name of Respondent<br />
This Report Is:<br />
Date of Report<br />
(1) X An Original<br />
(Mo, Da, Yr)<br />
PACIFIC GAS AND ELECTRIC COMPANY<br />
(2) A Resubmission<br />
04/08/2011<br />
DEPRECIATION AND AMORTIZATION OF ELECTRIC PLANT (Continued)<br />
Year/Period of Report<br />
End of <strong>2010</strong>/Q4<br />
C. Factors Used in Estimating Depreciation Charges<br />
Line<br />
Depreciable<br />
Estimated Net Applied<br />
Mortality<br />
Average<br />
No. Account No.<br />
Plant Base Avg. Service Salvage Depr. rates<br />
Curve<br />
Remaining<br />
(In Thous<strong>and</strong>s)<br />
Life<br />
(Percent) (Percent)<br />
Type<br />
Life<br />
(a) (b)<br />
(c)<br />
(d) (e)<br />
(f)<br />
(g)<br />
12<br />
13 Intangible Plant<br />
14 302 105,037<br />
3.97 16.70<br />
15 303 9,655<br />
10.00 13.13<br />
16 SUBTOTAL 114,692<br />
17 Steam Prdction -Fossil<br />
18 Steam Production<br />
19 311 11,381<br />
30.00 3.33 R5<br />
29.50<br />
20 312 12,137<br />
30.00 3.33 R5<br />
29.50<br />
21 313 892<br />
30.00 3.33 R5<br />
29.50<br />
22 314 7,123<br />
30.00 3.33 R5<br />
29.50<br />
23 315 2,613<br />
30.00 3.33 R5<br />
29.50<br />
24 316 4,706<br />
30.00 3.33 R5<br />
29.50<br />
25 SUBTOTAL 38,852<br />
26 Hydraulic Production<br />
27 Hydraulic Production<br />
28 331 300,862<br />
-12.00 1.78 19.00<br />
29 332 1,416,934<br />
-12.00 1.78 19.00<br />
30 333 470,459<br />
-12.00 1.78 19.00<br />
31 334 157,156<br />
-12.00 1.78 19.00<br />
32 335 53,904<br />
-12.00 1.78 19.00<br />
33 336 45,775<br />
-12.00 1.78 19.00<br />
34 SUBTOTAL 2,445,090<br />
35<br />
36 Nuclear Production -<br />
37 Diablo Canyon<br />
38 321 973,297<br />
0.67 16.00<br />
39 322 3,096,889<br />
0.67 16.00<br />
40 323 1,123,290<br />
0.67 16.00<br />
41 324 827,796<br />
0.67 16.00<br />
42 325 596,769<br />
0.67 16.00<br />
43 SUBTOTAL 6,618,041<br />
44<br />
45<br />
46<br />
47<br />
48<br />
49<br />
50<br />
<strong>FERC</strong> FORM NO. 1 (REV. 12-03) Page 337
Name of Respondent<br />
This Report Is:<br />
Date of Report<br />
(1) X An Original<br />
(Mo, Da, Yr)<br />
PACIFIC GAS AND ELECTRIC COMPANY<br />
(2) A Resubmission<br />
04/08/2011<br />
DEPRECIATION AND AMORTIZATION OF ELECTRIC PLANT (Continued)<br />
Year/Period of Report<br />
End of <strong>2010</strong>/Q4<br />
C. Factors Used in Estimating Depreciation Charges<br />
Line<br />
Depreciable<br />
Estimated Net Applied<br />
No. Account No.<br />
Plant Base Avg. Service Salvage Depr. rates<br />
(In Thous<strong>and</strong>s)<br />
Life<br />
(Percent) (Percent)<br />
(a) (b)<br />
(c)<br />
(d) (e)<br />
12 Other Production<br />
13 341 266<br />
14 342 19<br />
15.00 R2<br />
15 343 485<br />
15.00 2.77 R2<br />
16 344 7,826<br />
17 345 1,453<br />
18 346 28,529<br />
19 SUBTOTAL 38,578<br />
20<br />
21 Transmission<br />
22 352 200,280<br />
23 353 2,893,773<br />
24 354 464,692<br />
25 355 471,835<br />
26 356 811,707<br />
27 357 310,416<br />
28 358 158,695<br />
29 359 46,661<br />
30 SUBTOTAL 5,358,059<br />
31<br />
32 Transmission -<br />
33 Diablo Canyon<br />
34 352 4,853<br />
2.31<br />
35 353 70,589<br />
2.00<br />
36 SUBTOTAL 75,442<br />
37<br />
38<br />
39<br />
40<br />
41<br />
42<br />
43<br />
44<br />
45<br />
46<br />
47<br />
48<br />
49<br />
50<br />
Mortality<br />
Curve<br />
Type<br />
(f)<br />
Average<br />
Remaining<br />
Life<br />
(g)<br />
25.00 4.63 R2<br />
7.60<br />
25.00 1.89 R2<br />
10.34<br />
15.00 0.24 R2<br />
11.40<br />
19.00 3.58 R2<br />
18.90<br />
60.00 -20.00 2.10 R3<br />
47.52<br />
40.00 -21.00 3.07 S1.5,S0<br />
29.15<br />
69.00 -45.00 1.82 S4,R5<br />
42.56<br />
46.00 -67.00 3.01 R2.5<br />
33.90<br />
54.00 -49.00 2.35 S6,R5<br />
34.49<br />
60.00 1.23 R5<br />
52.77<br />
50.00 1.34 R3<br />
41.14<br />
60.00 1.36 R5<br />
51.80<br />
<strong>FERC</strong> FORM NO. 1 (REV. 12-03) Page 337.1
Name of Respondent<br />
This Report Is:<br />
Date of Report<br />
(1) X An Original<br />
(Mo, Da, Yr)<br />
PACIFIC GAS AND ELECTRIC COMPANY<br />
(2) A Resubmission<br />
04/08/2011<br />
DEPRECIATION AND AMORTIZATION OF ELECTRIC PLANT (Continued)<br />
Year/Period of Report<br />
End of <strong>2010</strong>/Q4<br />
C. Factors Used in Estimating Depreciation Charges<br />
Line<br />
Depreciable<br />
Estimated Net Applied<br />
Mortality<br />
Average<br />
No. Account No.<br />
Plant Base Avg. Service Salvage Depr. rates<br />
Curve<br />
Remaining<br />
(In Thous<strong>and</strong>s)<br />
Life<br />
(Percent) (Percent)<br />
Type<br />
Life<br />
(a) (b)<br />
(c)<br />
(d) (e)<br />
(f)<br />
(g)<br />
12 Distribution<br />
13 361 199,271<br />
55.00 -20.00 2.31 L5<br />
38.05<br />
14 362 1,906,093<br />
41.00 -15.00 2.88 S1<br />
27.67<br />
15 363 335<br />
10.00<br />
16 364 2,454,182<br />
40.00 -80.00 4.42 R1<br />
25.47<br />
17 365 2,877,248<br />
40.00 -77.00 4.45 R1.5<br />
25.39<br />
18 366 2,126,134<br />
58.00 -20.00 2.21 L3<br />
43.31<br />
19 367 2,978,537<br />
36.00 -30.00 3.50 R4<br />
21.40<br />
20 368 1,738,434<br />
31.00 3.41 R2.5, S1.5<br />
17.97<br />
21 369 2,527,889<br />
48.00 -54.00 3.06 R2.5, R4<br />
30.71<br />
22 370 835,327<br />
30.00 -7.00 3.27 R1.5, S3<br />
19.42<br />
23 371 27,314<br />
40.00 S1<br />
13.70<br />
24 372 895<br />
16.00 83.29 S1<br />
25 373 157,262<br />
24.00 2.00 1.57 R0.5, L2, L0, S3<br />
6.77<br />
26 SUBTOTAL 17,828,921<br />
27<br />
28 General Plant<br />
29 390 7,675<br />
31.00 -5.00 2.74 S2<br />
12.37<br />
30 391 17,167<br />
30.00 20.00 2.67 17.78<br />
31 394 51,362<br />
15.00 10.00 6.00 7.64<br />
32 395 12,457<br />
30.00 3.33 11.17<br />
33 396 328<br />
20.00 10.00 4.50 7.60<br />
34 397 7,051<br />
15.00 -4.00 6.93 7.77<br />
35 398 10,086<br />
15.00 20.00 5.33 4.91<br />
36 SUBTOTAL 106,126<br />
37<br />
38 General Plant -<br />
39 Diablo Canyon<br />
40 389 4<br />
41 391<br />
2.67<br />
42 398<br />
5.33<br />
43 399 468,499<br />
44 SUBTOTAL 468,503<br />
45<br />
46 TOTAL 33,092,304<br />
47<br />
48<br />
49<br />
50<br />
<strong>FERC</strong> FORM NO. 1 (REV. 12-03) Page 337.2
Name of Respondent<br />
PACIFIC GAS AND ELECTRIC COMPANY<br />
This Report is:<br />
(1) X An Original<br />
(2) A Resubmission<br />
Date of Report<br />
(Mo, Da, Yr)<br />
04/08/2011<br />
Year/Period of Report<br />
<strong>2010</strong>/Q4<br />
FOOTNOTE DATA<br />
Schedule Page: 336 Line No.: 12 Column: a<br />
Section C excludes SFAS 143 Asset Retirement Cost depreciation <strong>and</strong> Utility Retained<br />
Generation plant regulatory asset amortization.<br />
Schedule Page: 336 Line No.: 12 Column: e<br />
Plant depreciation parameters <strong>and</strong> rates (other than for fossil, hydro, <strong>and</strong> Diablo Canyon)<br />
are based on mortality characteristics adopted in CPUC Decisions 07-03-044 <strong>and</strong> 04-12-050.<br />
Depreciation rates for fossil, hydro, <strong>and</strong> Diablo Canyon are based on the estimated<br />
remaining useful life of the power plants, as required by CPUC Decisions 07-03-044 <strong>and</strong><br />
04-12-050.<br />
This column reflects accrual rates based on CPUC jurisdictional Transmisssion Plant <strong>and</strong><br />
CPUC authorized depreciation parameters in CPUC Decision 07-03-044 <strong>and</strong> does not include<br />
any <strong>FERC</strong> authorized transmission rates.<br />
Schedule Page: 336.2 Line No.: 46 Column: b<br />
Amounts in column (b) were obtained from depreciable <strong>and</strong> amortizable plant account<br />
balances as of December 31, <strong>2010</strong>.<br />
<strong>FERC</strong> FORM NO. 1 (ED. 12-87) Page 450.1
Name of Respondent<br />
PACIFIC GAS AND ELECTRIC COMPANY<br />
This Report Is:<br />
Date of Report<br />
(1) X An Original<br />
(Mo, Da, Yr)<br />
(2) A Resubmission<br />
04/08/2011<br />
REGULATORY COMMISSION EXPENSES<br />
Line<br />
Description<br />
Assessed by<br />
Expenses<br />
Total<br />
No. (Furnish name of regulatory commission or body the Regulatory<br />
of<br />
Expense for<br />
docket or case number <strong>and</strong> a description of the case) Commission Current Year<br />
Utility<br />
(b) + (c)<br />
(a)<br />
(b)<br />
(c)<br />
(d)<br />
1 Annual licensing fee to the U.S. Nuclear Reg 9,649,731 9,649,731<br />
2 Commission (NRC) for Diablo Canyon Nuclear<br />
3 Power Plant (DCPP) in accordance with 10 CFR .<br />
4<br />
5<br />
6<br />
7<br />
8 'Fees for review of Part 50 Application for 3,472,976 3,472,976<br />
9 Reactor License, Inspections <strong>and</strong> Operator exam<br />
10 from the NRC for DCPP in accordance with<br />
11 10 CFR 170.21.<br />
12<br />
13<br />
14<br />
15 Fees for review of Part 55 Application for 141,838 141,838<br />
16 Reactor Operator exams from the NRC for DCPP<br />
17 in accordance with 10 CFR 170.21.<br />
18<br />
19 Fees for review of Part 50 Application for 3,237,832 3,237,832<br />
20 Reactor License, Inspections <strong>and</strong> Operator<br />
21 exams from the NRC for DCPP in accordance<br />
22 with 10 CFR 170.21.<br />
23<br />
24 Other miscellaneous 3,727 3,727<br />
25<br />
26 Annual fee to the NRC for Humboldt Bay Nuclear -132,500 -132,500<br />
27 Power Plant (HBPP) in accordance with 10 CFR .<br />
28<br />
29 Fees for review of Part 50 Application for 192,010 192,010<br />
30 Reactor License, Inspections <strong>and</strong> Operator<br />
31 exams from the NRC for HBPP in accordance<br />
32 with 10 CFR 170.21.<br />
33<br />
34<br />
35<br />
36<br />
37<br />
38<br />
39<br />
40<br />
41<br />
42<br />
43<br />
44<br />
45<br />
Year/Period of Report<br />
End of <strong>2010</strong>/Q4<br />
1. Report particulars (details) of regulatory commission expenses incurred during the current year (or incurred in previous years, if<br />
being amortized) relating to format cases before a regulatory body, or cases in which such a body was a party.<br />
2. Report in columns (b) <strong>and</strong> (c), only the current year's expenses that are not deferred <strong>and</strong> the current year's amortization of amounts<br />
deferred in previous years.<br />
Deferred<br />
in Account<br />
182.3 at<br />
Beginning of Year<br />
(e)<br />
46 TOTAL 16,565,614 16,565,614<br />
<strong>FERC</strong> FORM NO. 1 (ED. 12-96) Page 350
Name of Respondent<br />
PACIFIC GAS AND ELECTRIC COMPANY<br />
This Report Is:<br />
Date of Report<br />
(1) X An Original<br />
(Mo, Da, Yr)<br />
(2) A Resubmission<br />
04/08/2011<br />
REGULATORY COMMISSION EXPENSES (Continued)<br />
Year/Period of Report<br />
End of <strong>2010</strong>/Q4<br />
3. Show in column (k) any expenses incurred in prior years which are being amortized. List in column (a) the period of amortization.<br />
4. List in column (f), (g), <strong>and</strong> (h) expenses incurred during year which were charged currently to income, plant, or other accounts.<br />
5. Minor items (less than $25,000) may be grouped.<br />
EXPENSES INCURRED DURING YEAR<br />
AMORTIZED DURING YEAR<br />
CURRENTLY CHARGED TO<br />
Deferred to Contra<br />
Amount<br />
Deferred in<br />
Department Account<br />
Amount<br />
No.<br />
Account 182.3 Account<br />
Account 182.3<br />
End of Year<br />
(f) (g)<br />
(h)<br />
(i)<br />
(j)<br />
(k) (l)<br />
<strong>Electric</strong> 524<br />
9,649,731<br />
1<br />
2<br />
3<br />
4<br />
5<br />
6<br />
7<br />
<strong>Electric</strong> 524<br />
3,472,976<br />
8<br />
9<br />
10<br />
11<br />
12<br />
13<br />
14<br />
<strong>Electric</strong> 524<br />
141,838<br />
15<br />
16<br />
17<br />
18<br />
<strong>Electric</strong> 930<br />
3,237,832<br />
19<br />
20<br />
21<br />
22<br />
23<br />
<strong>Electric</strong> 930<br />
3,727<br />
24<br />
25<br />
<strong>Electric</strong> 524<br />
-132,500<br />
26<br />
27<br />
28<br />
<strong>Electric</strong> 524<br />
192,010<br />
29<br />
30<br />
31<br />
32<br />
33<br />
34<br />
35<br />
36<br />
37<br />
38<br />
39<br />
40<br />
41<br />
42<br />
43<br />
44<br />
45<br />
Line<br />
No.<br />
16,565,614<br />
46<br />
<strong>FERC</strong> FORM NO. 1 (ED. 12-96) Page 351
Name of Respondent<br />
PACIFIC GAS AND ELECTRIC COMPANY<br />
Line<br />
No.<br />
Classification<br />
(a)<br />
This Report Is:<br />
Date of Report<br />
(1) X An Original<br />
(Mo, Da, Yr)<br />
(2) A Resubmission<br />
04/08/2011<br />
RESEARCH, DEVELOPMENT, AND DEMONSTRATION ACTIVITIES<br />
Description<br />
(b)<br />
Year/Period of Report<br />
End of <strong>2010</strong>/Q4<br />
1. Describe <strong>and</strong> show below costs incurred <strong>and</strong> accounts charged during the year for technological research, development, <strong>and</strong> demonstration (R, D &<br />
D) project initiated, continued or concluded during the year. Report also support given to others during the year for jointly-sponsored projects.(Identify<br />
recipient regardless of affiliation.) For any R, D & D work carried with others, show separately the respondent's cost for the year <strong>and</strong> cost chargeable to<br />
others (See definition of research, development, <strong>and</strong> demonstration in Uniform System of Accounts).<br />
2. Indicate in column (a) the applicable classification, as shown below:<br />
Classifications:<br />
A. <strong>Electric</strong> R, D & D Performed Internally: a. Overhead<br />
(1) Generation b. Underground<br />
a. hydroelectric (3) Distribution<br />
i. Recreation fish <strong>and</strong> wildlife (4) Regional Transmission <strong>and</strong> Market Operation<br />
ii Other hydroelectric (5) Environment (other than equipment)<br />
b. Fossil-fuel steam (6) Other (Classify <strong>and</strong> include items in excess of $50,000.)<br />
c. Internal combustion or gas turbine (7) Total Cost Incurred<br />
d. Nuclear B. <strong>Electric</strong>, R, D & D Performed Externally:<br />
e. Unconventional generation (1) Research Support to the electrical Research Council or the <strong>Electric</strong><br />
f. Siting <strong>and</strong> heat rejection Power Research Institute<br />
(2) Transmission<br />
1 NONE<br />
2<br />
3<br />
4<br />
5<br />
6<br />
7<br />
8<br />
9<br />
10<br />
11<br />
12<br />
13<br />
14<br />
15<br />
16<br />
17<br />
18<br />
19<br />
20<br />
21<br />
22<br />
23<br />
24<br />
25<br />
26<br />
27<br />
28<br />
29<br />
30<br />
31<br />
32<br />
33<br />
34<br />
35<br />
36<br />
37<br />
38<br />
<strong>FERC</strong> FORM NO. 1 (ED. 12-87) Page 352
Name of Respondent<br />
This Report Is:<br />
Date of Report<br />
(1) X An Original<br />
(Mo, Da, Yr)<br />
PACIFIC GAS AND ELECTRIC COMPANY<br />
(2) A Resubmission<br />
04/08/2011<br />
RESEARCH, DEVELOPMENT, AND DEMONSTRATION ACTIVITIES (Continued)<br />
Year/Period of Report<br />
End of <strong>2010</strong>/Q4<br />
(2) Research Support to Edison <strong>Electric</strong> Institute<br />
(3) Research Support to Nuclear Power Groups<br />
(4) Research Support to Others (Classify)<br />
(5) Total Cost Incurred<br />
3. Include in column (c) all R, D & D items performed internally <strong>and</strong> in column (d) those items performed outside the company costing $50,000 or more,<br />
briefly describing the specific area of R, D & D (such as safety, corrosion control, pollution, automation, measurement, insulation, type of appliance, etc.).<br />
Group items under $50,000 by classifications <strong>and</strong> indicate the number of items grouped. Under Other, (A (6) <strong>and</strong> B (4)) classify items by type of R, D &<br />
D activity.<br />
4. Show in column (e) the account number charged with expenses during the year or the account to which amounts were capitalized during the year,<br />
listing Account 107, Construction Work in Progress, first. Show in column (f) the amounts related to the account charged in column (e)<br />
5. Show in column (g) the total unamortized accumulating of costs of projects. This total must equal the balance in Account 188, Research,<br />
Development, <strong>and</strong> Demonstration Expenditures, Outst<strong>and</strong>ing at the end of the year.<br />
6. If costs have not been segregated for R, D &D activities or projects, submit estimates for columns (c), (d), <strong>and</strong> (f) with such amounts identified by<br />
"Est."<br />
7. Report separately research <strong>and</strong> related testing facilities operated by the respondent.<br />
Costs Incurred Internally<br />
Current Year<br />
(c)<br />
Costs Incurred Externally<br />
Current Year<br />
(d)<br />
AMOUNTS CHARGED IN CURRENT YEAR<br />
Account<br />
(e)<br />
Amount<br />
(f)<br />
Unamortized<br />
Accumulation<br />
(g)<br />
Line<br />
No.<br />
1<br />
2<br />
3<br />
4<br />
5<br />
6<br />
7<br />
8<br />
9<br />
10<br />
11<br />
12<br />
13<br />
14<br />
15<br />
16<br />
17<br />
18<br />
19<br />
20<br />
21<br />
22<br />
23<br />
24<br />
25<br />
26<br />
27<br />
28<br />
29<br />
30<br />
31<br />
32<br />
33<br />
34<br />
35<br />
36<br />
37<br />
38<br />
<strong>FERC</strong> FORM NO. 1 (ED. 12-87) Page 353
Name of Respondent<br />
PACIFIC GAS AND ELECTRIC COMPANY<br />
This Report Is:<br />
Date of Report<br />
(1) X An Original<br />
(Mo, Da, Yr)<br />
(2) A Resubmission<br />
04/08/2011<br />
DISTRIBUTION OF SALARIES AND WAGES<br />
Year/Period of Report<br />
End of <strong>2010</strong>/Q4<br />
Report below the distribution of total salaries <strong>and</strong> wages for the year. Segregate amounts originally charged to clearing accounts to<br />
Utility Departments, Construction, Plant Removals, <strong>and</strong> Other Accounts, <strong>and</strong> enter such amounts in the appropriate lines <strong>and</strong> columns<br />
provided. In determining this segregation of salaries <strong>and</strong> wages originally charged to clearing accounts, a method of approximation<br />
giving substantially correct results may be used.<br />
Line<br />
No.<br />
1<br />
2<br />
3<br />
4<br />
5<br />
6<br />
7<br />
8<br />
9<br />
10<br />
11<br />
12<br />
13<br />
14<br />
15<br />
16<br />
17<br />
18<br />
19<br />
20<br />
21<br />
22<br />
23<br />
24<br />
25<br />
26<br />
27<br />
28<br />
29<br />
30<br />
31<br />
32<br />
33<br />
34<br />
35<br />
36<br />
37<br />
38<br />
39<br />
40<br />
41<br />
42<br />
43<br />
44<br />
45<br />
46<br />
47<br />
Classification<br />
(a)<br />
<strong>Electric</strong><br />
Operation<br />
Production<br />
Transmission<br />
Regional Market<br />
Distribution<br />
Customer Accounts<br />
Customer Service <strong>and</strong> Informational<br />
Sales<br />
Administrative <strong>and</strong> General<br />
TOTAL Operation (Enter Total of lines 3 thru 10)<br />
Maintenance<br />
Production<br />
Transmission<br />
Regional Market<br />
Distribution<br />
Administrative <strong>and</strong> General<br />
TOTAL Maintenance (Total of lines 13 thru 17)<br />
Total Operation <strong>and</strong> Maintenance<br />
Production (Enter Total of lines 3 <strong>and</strong> 13)<br />
Transmission (Enter Total of lines 4 <strong>and</strong> 14)<br />
Regional Market (Enter Total of Lines 5 <strong>and</strong> 15)<br />
Distribution (Enter Total of lines 6 <strong>and</strong> 16)<br />
Customer Accounts (Transcribe from line 7)<br />
Customer Service <strong>and</strong> Informational (Transcribe from line 8)<br />
Sales (Transcribe from line 9)<br />
Administrative <strong>and</strong> General (Enter Total of lines 10 <strong>and</strong> 17)<br />
TOTAL Oper. <strong>and</strong> Maint. (Total of lines 20 thru 27)<br />
<strong>Gas</strong><br />
Operation<br />
Production-Manufactured <strong>Gas</strong><br />
Production-Nat. <strong>Gas</strong> (Including Expl. <strong>and</strong> Dev.)<br />
Other <strong>Gas</strong> Supply<br />
Storage, LNG Terminaling <strong>and</strong> Processing<br />
Transmission<br />
Distribution<br />
Customer Accounts<br />
Customer Service <strong>and</strong> Informational<br />
Sales<br />
Administrative <strong>and</strong> General<br />
TOTAL Operation (Enter Total of lines 31 thru 40)<br />
Maintenance<br />
Production-Manufactured <strong>Gas</strong><br />
Production-Natural <strong>Gas</strong> (Including Exploration <strong>and</strong> Development)<br />
Other <strong>Gas</strong> Supply<br />
Storage, LNG Terminaling <strong>and</strong> Processing<br />
Transmission<br />
Direct Payroll<br />
Distribution<br />
(b)<br />
166,228,686<br />
47,061,630<br />
122,082,443<br />
121,095,703<br />
92,453,305<br />
1,963,232<br />
201,894,362<br />
752,779,361<br />
90,769,180<br />
24,681,118<br />
133,374,155<br />
248,824,453<br />
256,997,866<br />
71,742,748<br />
255,456,598<br />
121,095,703<br />
92,453,305<br />
1,963,232<br />
201,894,362<br />
1,001,603,814<br />
4,109,263<br />
3,902,814<br />
24,872,292<br />
93,104,181<br />
87,248,664<br />
15,640,463<br />
5,790,295<br />
79,182,429<br />
313,850,401<br />
556,660<br />
2,423,133<br />
12,038,673<br />
Allocation of<br />
Payroll charged for<br />
Clearing Accounts<br />
(c)<br />
Total<br />
(d)<br />
1,001,603,814<br />
<strong>FERC</strong> FORM NO. 1 (ED. 12-88) Page 354
Name of Respondent<br />
PACIFIC GAS AND ELECTRIC COMPANY<br />
This Report Is:<br />
Date of Report<br />
(1) X An Original<br />
(Mo, Da, Yr)<br />
(2) A Resubmission<br />
04/08/2011<br />
DISTRIBUTION OF SALARIES AND WAGES (Continued)<br />
Year/Period of Report<br />
End of <strong>2010</strong>/Q4<br />
Line<br />
No.<br />
48<br />
49<br />
50<br />
51<br />
52<br />
53<br />
54<br />
55<br />
56<br />
57<br />
58<br />
59<br />
60<br />
61<br />
62<br />
63<br />
64<br />
65<br />
66<br />
67<br />
68<br />
69<br />
70<br />
71<br />
72<br />
73<br />
74<br />
75<br />
76<br />
77<br />
78<br />
79<br />
80<br />
81<br />
82<br />
83<br />
84<br />
85<br />
86<br />
87<br />
88<br />
89<br />
90<br />
91<br />
92<br />
93<br />
94<br />
95<br />
96<br />
Classification<br />
(a)<br />
Distribution<br />
Administrative <strong>and</strong> General<br />
TOTAL Maint. (Enter Total of lines 43 thru 49)<br />
Total Operation <strong>and</strong> Maintenance<br />
Production-Manufactured <strong>Gas</strong> (Enter Total of lines 31 <strong>and</strong> 43)<br />
Production-Natural <strong>Gas</strong> (Including Expl. <strong>and</strong> Dev.) (Total lines 32,<br />
Other <strong>Gas</strong> Supply (Enter Total of lines 33 <strong>and</strong> 45)<br />
Storage, LNG Terminaling <strong>and</strong> Processing (Total of lines 31 thru<br />
Transmission (Lines 35 <strong>and</strong> 47)<br />
Distribution (Lines 36 <strong>and</strong> 48)<br />
Customer Accounts (Line 37)<br />
Customer Service <strong>and</strong> Informational (Line 38)<br />
Sales (Line 39)<br />
Administrative <strong>and</strong> General (Lines 40 <strong>and</strong> 49)<br />
TOTAL Operation <strong>and</strong> Maint. (Total of lines 52 thru 61)<br />
Other Utility Departments<br />
Operation <strong>and</strong> Maintenance<br />
TOTAL All Utility Dept. (Total of lines 28, 62, <strong>and</strong> 64)<br />
Utility Plant<br />
Construction (By Utility Departments)<br />
<strong>Electric</strong> Plant<br />
<strong>Gas</strong> Plant<br />
Other (provide details in footnote):<br />
TOTAL Construction (Total of lines 68 thru 70)<br />
Plant Removal (By Utility Departments)<br />
<strong>Electric</strong> Plant<br />
<strong>Gas</strong> Plant<br />
Other (provide details in footnote):<br />
TOTAL Plant Removal (Total of lines 73 thru 75)<br />
Other Accounts (Specify, provide details in footnote):<br />
TOTAL Other Accounts<br />
TOTAL SALARIES AND WAGES<br />
Direct Payroll<br />
Distribution<br />
(b)<br />
46,673,621<br />
61,692,087<br />
4,665,923<br />
6,325,947<br />
36,910,965<br />
139,777,802<br />
87,248,664<br />
15,640,463<br />
5,790,295<br />
79,182,429<br />
375,542,488<br />
1,377,146,302<br />
367,907,023<br />
73,720,782<br />
56,149,252<br />
497,777,057<br />
212,430,741<br />
175,222,279<br />
1,556,839<br />
389,209,859<br />
4,806,896<br />
4,806,896<br />
2,268,940,114<br />
Allocation of<br />
Payroll charged for<br />
Clearing Accounts<br />
(c)<br />
Total<br />
(d)<br />
375,542,488<br />
1,377,146,302<br />
367,907,023<br />
73,720,782<br />
56,149,252<br />
497,777,057<br />
212,430,741<br />
175,222,279<br />
1,556,839<br />
389,209,859<br />
4,806,896<br />
4,806,896<br />
2,268,940,114<br />
<strong>FERC</strong> FORM NO. 1 (ED. 12-88) Page 355
Name of Respondent<br />
PACIFIC GAS AND ELECTRIC COMPANY<br />
This Report Is:<br />
(1) X An Original<br />
(2) A Resubmission<br />
Date of Report<br />
(Mo, Da, Yr)<br />
04/08/2011<br />
Year/Period of Report<br />
End of<br />
<strong>2010</strong>/Q4<br />
COMMON UTILITY PLANT AND EXPENSES<br />
1. Describe the property carried in the utility's accounts as common utility plant <strong>and</strong> show the book cost of such plant at end of year classified by<br />
accounts as provided by Plant Instruction 13, Common Utility Plant, of the Uniform System of Accounts. Also show the allocation of such plant costs to<br />
the respective departments using the common utility plant <strong>and</strong> explain the basis of allocation used, giving the allocation factors.<br />
2. Furnish the accumulated provisions for depreciation <strong>and</strong> amortization at end of year, showing the amounts <strong>and</strong> classifications of such accumulated<br />
provisions, <strong>and</strong> amounts allocated to utility departments using the Common utility plant to which such accumulated provisions relate, including<br />
explanation of basis of allocation <strong>and</strong> factors used.<br />
3. Give for the year the expenses of operation, maintenance, rents, depreciation, <strong>and</strong> amortization for common utility plant classified by accounts as<br />
provided by the Uniform System of Accounts. Show the allocation of such expenses to the departments using the common utility plant to which such<br />
expenses are related. Explain the basis of allocation used <strong>and</strong> give the factors of allocation.<br />
4. Give date of approval by the Commission for use of the common utility plant classification <strong>and</strong> reference to order of the Commission or other<br />
authorization.<br />
COMMON UTILITY PLANT IN SERVICE<br />
-------------------------------<br />
Balance Transfers Balance<br />
Acct Beginning <strong>and</strong> End<br />
No. Description of Year Additions Retirements Adjustments of Year<br />
---- -------------------------- ------------- ----------- ----------- ------------ -------------<br />
301 Organization 132,410 18,753 0 0 151,163<br />
302 Franchises/Consents 0 102,806 0 0 102,806<br />
303 Intangible Plant 853,390,259 111,071,209 -9,037,023 -417,866 955,006,579<br />
------------- ----------- ----------- ------------ -------------<br />
Total Intangible Plant 853,522,669 111,192,768 -9,037,023 -417,866 955,260,548<br />
------------- ----------- ----------- ------------ -------------<br />
389 L<strong>and</strong> <strong>and</strong> L<strong>and</strong> Rights 79,357,259 135,449 0 -3,493 79,489,215<br />
------------- ----------- ----------- ------------ -------------<br />
390 Structures <strong>and</strong> Improvements 1,090,144,145 32,158,508 -2,692,893 -467,621 1,119,142,139<br />
391 Personal Computer Hardware 55,745,825 24,686,864 -7,501,357 -103,983 72,827,349<br />
391 Office Machines 307,219,522 28,377,895 -26,891,985 0 308,705,432<br />
391 Office Furniture & Equipment 218,121,035 7,244,509 -1,141,081 0 224,224,463<br />
392 Transportation Equipment 600,920,065 53,038,207 -30,894,922 -13,250 623,050,100<br />
393 Stores Equipment 9,916,894 485,879 -241,356 0 10,161,417<br />
394 Tools, Shop, & Garage Equipment 53,321,321 3,425,425 -2,390,237 -14,821 54,341,688<br />
395 Laboratory Equipment 24,375,072 3,014,838 -466,703 0 26,923,207<br />
397 Communication Equipment 682,269,744 192,413,734 -43,781,046 -2,043,517 828,858,915<br />
398 Miscellaneous Equipment 20,394,752 2,226,385 -126,241 0 22,494,896<br />
399 Other Tangible Property 495,750 0 -406,091 0 89,659<br />
396 Power Operated Equipment 95,498,973 10,496,340 -4,585,403 0 101,409,910<br />
------------- ----------- ----------- ------------ -------------<br />
Total Non-L<strong>and</strong>ed 3,158,423,098 357,568,584 -143,383,639 -2,643,192 3,392,229,174<br />
------------- ----------- ----------- ------------ -------------<br />
Total 4,091,303,026 468,896,801 -189,216,338 -3,064,551 4,426,978,938<br />
------------- ----------- ----------- ------------ -------------<br />
101.1 Property Under Capital Leases 0 0 0 0 0<br />
------------- ----------- ----------- ------------ -------------<br />
Total Common Utility Plant in Service 4,091,303,026 468,896,801 -195,763,108 -3,064,551 4,426,978,938<br />
107 Construction Work in Progress-<br />
Common Utility Plant 160,786,201 132,037,856 0 0 292,824,057<br />
------------- ----------- ----------- ------------ -------------<br />
Total Common Utility Plant 4,252,089,227 600,934,657 -195,763,108 -3,064,551 4,719,802,995<br />
============= =========== =========== =========== =============<br />
<strong>FERC</strong> FORM NO. 1 (ED. 12-87) Page 356
Name of Respondent<br />
PACIFIC GAS AND ELECTRIC COMPANY<br />
This Report Is:<br />
(1) X An Original<br />
(2) A Resubmission<br />
Date of Report<br />
(Mo, Da, Yr)<br />
04/08/2011<br />
Year/Period of Report<br />
End of<br />
<strong>2010</strong>/Q4<br />
COMMON UTILITY PLANT AND EXPENSES<br />
1. Describe the property carried in the utility's accounts as common utility plant <strong>and</strong> show the book cost of such plant at end of year classified by<br />
accounts as provided by Plant Instruction 13, Common Utility Plant, of the Uniform System of Accounts. Also show the allocation of such plant costs to<br />
the respective departments using the common utility plant <strong>and</strong> explain the basis of allocation used, giving the allocation factors.<br />
2. Furnish the accumulated provisions for depreciation <strong>and</strong> amortization at end of year, showing the amounts <strong>and</strong> classifications of such accumulated<br />
provisions, <strong>and</strong> amounts allocated to utility departments using the Common utility plant to which such accumulated provisions relate, including<br />
explanation of basis of allocation <strong>and</strong> factors used.<br />
3. Give for the year the expenses of operation, maintenance, rents, depreciation, <strong>and</strong> amortization for common utility plant classified by accounts as<br />
provided by the Uniform System of Accounts. Show the allocation of such expenses to the departments using the common utility plant to which such<br />
expenses are related. Explain the basis of allocation used <strong>and</strong> give the factors of allocation.<br />
4. Give date of approval by the Commission for use of the common utility plant classification <strong>and</strong> reference to order of the Commission or other<br />
authorization.<br />
ALLOCATION OF COMMON UTILITY PLANT AND<br />
ACCUMULATED PROVISION FOR DEPRECIATION BASED<br />
ON THE COST SEPARATION ADOPTED BY THE CPUC<br />
--------------------------------------------<br />
Description Total <strong>Electric</strong> <strong>Gas</strong><br />
----------- ------------- ------------- -------------<br />
Common Utility Plant in Service (a) 4,426,978,938 2,801,392,271 1,625,586,666<br />
Accumulated Provision for Depreciation (a) 1,700,936,099 1,125,849,603 575,086,495<br />
ALLOCATION OF AD VALOREM TAXES APPLICABLE TO COMMON UTILITY PLANT<br />
BASED ON THE COST SEPARATION ADOPTED BY THE CPUC<br />
------------------------------------------------<br />
Amount Account 408<br />
Charged -----------------------------<br />
Description During Year <strong>Electric</strong> <strong>Gas</strong><br />
----------- ------------- ------------- -------------<br />
Taxes<br />
Operative Property (b) 248,392,558 195,683,548 52,709,010<br />
(from page 262-263)<br />
Common Utility Plant (a) 16,314,001 10,323,500 5,990,501<br />
included in above amount<br />
NOTES:<br />
(a) 2009 allocations are based on the methodology of unbundling Common Plant as approved<br />
in the cost separation filing <strong>and</strong> adopted in the 2003 General Rate Case (GRC).<br />
<strong>Electric</strong><br />
<strong>Gas</strong><br />
------------- -------------<br />
Common Plant in Service Allocation Factors 63.28% 36.72%<br />
Common Plant Accumulated Depreciation Allocation Factors 66.19% 33.81%<br />
(b) Amounts are based on direct charges. Not included in the total was $307,415 charged to others.<br />
ALLOCATION OF DEPRECIATION EXPENSE APPLICABLE TO COMMON<br />
<strong>FERC</strong> FORM NO. 1 (ED. 12-87) Page 356.1
Name of Respondent<br />
PACIFIC GAS AND ELECTRIC COMPANY<br />
This Report Is:<br />
(1) X An Original<br />
(2) A Resubmission<br />
Date of Report<br />
(Mo, Da, Yr)<br />
04/08/2011<br />
Year/Period of Report<br />
End of<br />
<strong>2010</strong>/Q4<br />
COMMON UTILITY PLANT AND EXPENSES<br />
1. Describe the property carried in the utility's accounts as common utility plant <strong>and</strong> show the book cost of such plant at end of year classified by<br />
accounts as provided by Plant Instruction 13, Common Utility Plant, of the Uniform System of Accounts. Also show the allocation of such plant costs to<br />
the respective departments using the common utility plant <strong>and</strong> explain the basis of allocation used, giving the allocation factors.<br />
2. Furnish the accumulated provisions for depreciation <strong>and</strong> amortization at end of year, showing the amounts <strong>and</strong> classifications of such accumulated<br />
provisions, <strong>and</strong> amounts allocated to utility departments using the Common utility plant to which such accumulated provisions relate, including<br />
explanation of basis of allocation <strong>and</strong> factors used.<br />
3. Give for the year the expenses of operation, maintenance, rents, depreciation, <strong>and</strong> amortization for common utility plant classified by accounts as<br />
provided by the Uniform System of Accounts. Show the allocation of such expenses to the departments using the common utility plant to which such<br />
expenses are related. Explain the basis of allocation used <strong>and</strong> give the factors of allocation.<br />
4. Give date of approval by the Commission for use of the common utility plant classification <strong>and</strong> reference to order of the Commission or other<br />
authorization.<br />
UTILITY PLANT BASED ON THE COST SEPARATION ADOPTED BY THE CPUC<br />
--------------------------------------------------------------<br />
Amount Account 403<br />
Charged -----------------------------<br />
Description Account During Year <strong>Electric</strong> <strong>Gas</strong><br />
----------- ------- ------------- ------------- -------------<br />
Depreciation 403 160,500,054 109,080,147 51,419,907<br />
Amortization 404 93,805,609 60,626,565 33,179,044<br />
------------- ------------ -------------<br />
Total 254,305,663 169,706,712 84,598,951<br />
============= ============ =============<br />
ALLOCATION OF MAINTENANCE EXPENSES OF COMMON UTILITY<br />
PLANT BASED ON THE COST SEPARATION ADOPTED BY THE CPUC<br />
------------------------------------------------------<br />
Amount Account 935<br />
Charged -----------------------------<br />
Description During Year <strong>Electric</strong> <strong>Gas</strong><br />
----------- ------------- ------------- -------------<br />
Maintenance of General Plant 15,411,323 11,056,083 4,355,240<br />
Note:<br />
Operation expense data was not available.<br />
CONSTRUCTION WORK IN PROGRESS - COMMON (ACCOUNT 107)<br />
----------------------------------------------------<br />
Description of Project<br />
Amount<br />
<strong>FERC</strong> FORM NO. 1 (ED. 12-87) Page 356.2
Name of Respondent<br />
PACIFIC GAS AND ELECTRIC COMPANY<br />
This Report Is:<br />
(1) X An Original<br />
(2) A Resubmission<br />
Date of Report<br />
(Mo, Da, Yr)<br />
04/08/2011<br />
Year/Period of Report<br />
End of<br />
<strong>2010</strong>/Q4<br />
COMMON UTILITY PLANT AND EXPENSES<br />
1. Describe the property carried in the utility's accounts as common utility plant <strong>and</strong> show the book cost of such plant at end of year classified by<br />
accounts as provided by Plant Instruction 13, Common Utility Plant, of the Uniform System of Accounts. Also show the allocation of such plant costs to<br />
the respective departments using the common utility plant <strong>and</strong> explain the basis of allocation used, giving the allocation factors.<br />
2. Furnish the accumulated provisions for depreciation <strong>and</strong> amortization at end of year, showing the amounts <strong>and</strong> classifications of such accumulated<br />
provisions, <strong>and</strong> amounts allocated to utility departments using the Common utility plant to which such accumulated provisions relate, including<br />
explanation of basis of allocation <strong>and</strong> factors used.<br />
3. Give for the year the expenses of operation, maintenance, rents, depreciation, <strong>and</strong> amortization for common utility plant classified by accounts as<br />
provided by the Uniform System of Accounts. Show the allocation of such expenses to the departments using the common utility plant to which such<br />
expenses are related. Explain the basis of allocation used <strong>and</strong> give the factors of allocation.<br />
4. Give date of approval by the Commission for use of the common utility plant classification <strong>and</strong> reference to order of the Commission or other<br />
authorization.<br />
----------------------------------------------------------------------------- -------------<br />
Dynamic Pricing Phase 1-Peak Day Pricing IT Multiple Counties 49,438,791<br />
Radio Network Refresh/Consolidation Multiple Counties 18,513,356<br />
Web Improvement Project (WIP) Multiple Counties 17,480,748<br />
Mapping & Facility Management Automation San Francisco County 11,518,628<br />
Enterprise Security Risk Management Project San Francisco County 10,708,900<br />
ADAPT Program San Francisco County 7,471,224<br />
Condition Based Maintenance San Francisco County 7,432,809<br />
Enterprise Information Protection (EIP) Release 1.0,1.1,3.2 Multiple Counties 7,345,076<br />
Warehous & Meter Mgmnt Sys Repl&Ntw San Francisco County 6,597,062<br />
Veg Management Application Replacem Multiple Counties 6,453,901<br />
Market Redesign <strong>and</strong> Technology Upgrade MAP San Francisco County 5,874,210<br />
ETC Pay Statement Opt-out & Enhance San Francisco County 5,772,333<br />
LAN/WAN Lifecycle Multiple Counties 5,665,554<br />
Common Facilities Lifecycle Multiple Counties 5,006,388<br />
SAP Learning Mgmt Solution (Capital) San Francisco County 4,792,559<br />
ISO Real Time Settlements San Francisco County 4,601,129<br />
Lifecycle Program Management (cap) Multiple Counties 4,139,129<br />
Santa Rosa SC - Remodel Bldgs 7549, Sonoma County 3,948,864<br />
Smart Meter - O&M Process Improvement (Release O) San Francisco County 3,880,864<br />
MobileConnect Release 3 San Francisco County 3,683,543<br />
Stockton SC - Remodel Bldg 2 #6350 San Joaquin County 3,613,972<br />
San Francisco SC Garage-Seismic Upgrade San Francisco County 3,440,776<br />
San Francisco SC MEP Replacement San Francisco County 3,371,312<br />
SM - Performance Engineering (Release X) San Francisco County 3,349,447<br />
Dynamic Pricing Phase 1-Peak Day Pricing IT San Francisco County 3,229,245<br />
Enterprise Information Protection (EIP) Release 1.0,1.1,3.2 San Francisco County 3,203,185<br />
FA IT ENT: Enterprise Content Mngmn Multiple Counties 3,158,030<br />
Wintel Server Lifecycle Multiple Counties 2,904,840<br />
Smart Meter - Operations Center Capital Phase 2 Contra Costa County 2,762,060<br />
Capital Asset Expense Planning Phase San Francisco County 2,744,728<br />
Wireless Lifecycle Multiple Counties 2,699,286<br />
PowerPlant Asset Accounting System Multiple Counties 2,633,963<br />
General Office - GENSET San Francisco County 2,514,359<br />
Operational Reporting Initiative San Francisco County 2,432,435<br />
SAP Upgrade - HR Enterprise Structure San Francisco County 2,154,442<br />
Capital Asset Expense Planning Phase Multiple Counties 2,038,245<br />
Business Intelligence Program/Platform Enhancements San Francisco County 1,767,481<br />
Warehous & Meter Mgmnt Sys Repl&Ntw Multiple Counties 1,660,635<br />
Fleet Capital Tools & Equipment Yolo County 1,658,462<br />
LAN/WAN Lifecycle San Francisco County 1,618,196<br />
Business Intelligence Program-HR BW Enhancements San Francisco County 1,581,792<br />
ADAPT Program Multiple Counties 1,565,930<br />
Workforce Time <strong>and</strong> Attendance Module San Francisco County 1,531,896<br />
Storage Refresh/Capacity Solano County 1,469,751<br />
Smart Meter - Business Process Release I San Francisco County 1,419,775<br />
<strong>FERC</strong> FORM NO. 1 (ED. 12-87) Page 356.3
Name of Respondent<br />
PACIFIC GAS AND ELECTRIC COMPANY<br />
This Report Is:<br />
(1) X An Original<br />
(2) A Resubmission<br />
Date of Report<br />
(Mo, Da, Yr)<br />
04/08/2011<br />
Year/Period of Report<br />
End of<br />
<strong>2010</strong>/Q4<br />
COMMON UTILITY PLANT AND EXPENSES<br />
1. Describe the property carried in the utility's accounts as common utility plant <strong>and</strong> show the book cost of such plant at end of year classified by<br />
accounts as provided by Plant Instruction 13, Common Utility Plant, of the Uniform System of Accounts. Also show the allocation of such plant costs to<br />
the respective departments using the common utility plant <strong>and</strong> explain the basis of allocation used, giving the allocation factors.<br />
2. Furnish the accumulated provisions for depreciation <strong>and</strong> amortization at end of year, showing the amounts <strong>and</strong> classifications of such accumulated<br />
provisions, <strong>and</strong> amounts allocated to utility departments using the Common utility plant to which such accumulated provisions relate, including<br />
explanation of basis of allocation <strong>and</strong> factors used.<br />
3. Give for the year the expenses of operation, maintenance, rents, depreciation, <strong>and</strong> amortization for common utility plant classified by accounts as<br />
provided by the Uniform System of Accounts. Show the allocation of such expenses to the departments using the common utility plant to which such<br />
expenses are related. Explain the basis of allocation used <strong>and</strong> give the factors of allocation.<br />
4. Give date of approval by the Commission for use of the common utility plant classification <strong>and</strong> reference to order of the Commission or other<br />
authorization.<br />
Call Efficiency Improvements Phase San Francisco County 1,381,684<br />
EPI Renewable Energy Trading Settle San Francisco County 1,363,884<br />
MobileConnect Release 3 Multiple Counties 1,307,799<br />
Invest in Buildings-VP Div Ops Facilities Tuolumne County 1,262,625<br />
63-SCADA <strong>Electric</strong> Trans - SCADA Com Alameda County 1,236,437<br />
SAP Upgrade - SAP Automation San Francisco County 1,234,911<br />
Mapping & Facility Management Automation Multiple Counties 1,152,235<br />
Smart Meter - Business Process (Release O) San Francisco County 1,079,700<br />
Fleet Mgmt System Implementation R1 Multiple Counties 997,449<br />
Corporate Real Estate - Interiors San Francisco County 996,316<br />
Smart Meter - Release X Phase 2 San Francisco County 987,491<br />
Bakersfield SC - Remodel Bldgs Kern County 986,315<br />
Unix Server Refresh/Capacity Multiple Counties 972,569<br />
SAP Upgrade - Capital Multiple Counties 949,826<br />
63-SCADA <strong>Electric</strong> Trans - SCADA MS Multiple Counties 836,887<br />
Transmission Lifecycle Multiple Counties 769,110<br />
Smart Meter - Business Process (Replan) San Francisco County 762,316<br />
BI Program - BPC/IPS Phase 1 San Francisco County 742,053<br />
SM - Outage Restoration Replan (Rel J) San Francisco County 683,707<br />
Cinnabar SC - Replace HVAC Units Santa Clara County 676,139<br />
Technical School Infrastructure Upgrade Alameda County 658,267<br />
Smart Meter - MDMS 2.7.3 San Francisco County 647,954<br />
General Office - Replace Strobes System San Francisco County 598,222<br />
Transmission Lifecycle Butte County 596,422<br />
Risk Control Infrastructure Improvements Multiple Counties 546,300<br />
Smart Meter - Restoration Validation (Release J) San Francisco County 527,387<br />
SCADA <strong>Electric</strong> Dist - Comm Sonoma County 509,798<br />
Smart Meter - IT Core Team Activity San Francisco County 505,231<br />
IT Facility Refresh (CAP) Kern County 503,343<br />
63-SCADA <strong>Electric</strong> Trans - SCADA MS San Francisco County 495,916<br />
Risk Control Infrastructure Improvements San Francisco County 488,652<br />
Repl Security Server & Oprtng Platform San Luis Obispo County 471,527<br />
SCADA <strong>Electric</strong> Dist - Comm Multiple Counties 436,292<br />
IT Facility Refresh (CAP) Calaveras County 421,843<br />
Invest in Buildings-VP Div Ops Facilities Contra Costa County 410,536<br />
Smart Meter - Operations Center Capital (Phase 2) San Francisco County 407,622<br />
IT Facility Refresh (CAP) San Joaquin County 403,452<br />
Habitat Conservation Portal Enhance San Francisco County 396,542<br />
Invest in Buildings-VP Div Ops Facilities Multiple Counties 377,306<br />
Invest in Buildings-VP Div Ops Facilities Shasta County 374,858<br />
Condition Based Maintenance Multiple Counties 372,051<br />
Data Center Facilities Lifecycle Solano County 371,825<br />
Smart Meter - Release X Hardware (Phase 2) Multiple Counties 336,003<br />
DP2_IT Real Time Pricing Multiple Counties 322,368<br />
Transmission Lifecycle Kern County 319,243<br />
GSM, Terminal Reliability Multiple Counties 315,276<br />
<strong>FERC</strong> FORM NO. 1 (ED. 12-87) Page 356.4
Name of Respondent<br />
PACIFIC GAS AND ELECTRIC COMPANY<br />
This Report Is:<br />
(1) X An Original<br />
(2) A Resubmission<br />
Date of Report<br />
(Mo, Da, Yr)<br />
04/08/2011<br />
Year/Period of Report<br />
End of<br />
<strong>2010</strong>/Q4<br />
COMMON UTILITY PLANT AND EXPENSES<br />
1. Describe the property carried in the utility's accounts as common utility plant <strong>and</strong> show the book cost of such plant at end of year classified by<br />
accounts as provided by Plant Instruction 13, Common Utility Plant, of the Uniform System of Accounts. Also show the allocation of such plant costs to<br />
the respective departments using the common utility plant <strong>and</strong> explain the basis of allocation used, giving the allocation factors.<br />
2. Furnish the accumulated provisions for depreciation <strong>and</strong> amortization at end of year, showing the amounts <strong>and</strong> classifications of such accumulated<br />
provisions, <strong>and</strong> amounts allocated to utility departments using the Common utility plant to which such accumulated provisions relate, including<br />
explanation of basis of allocation <strong>and</strong> factors used.<br />
3. Give for the year the expenses of operation, maintenance, rents, depreciation, <strong>and</strong> amortization for common utility plant classified by accounts as<br />
provided by the Uniform System of Accounts. Show the allocation of such expenses to the departments using the common utility plant to which such<br />
expenses are related. Explain the basis of allocation used <strong>and</strong> give the factors of allocation.<br />
4. Give date of approval by the Commission for use of the common utility plant classification <strong>and</strong> reference to order of the Commission or other<br />
authorization.<br />
Corporate Real Estate - Roofing San Francisco County 308,135<br />
<strong>2010</strong> ED Control Ctr Consolidation Contra Costa County 287,634<br />
Smart Meter - System Integration & Test San Francisco County 284,690<br />
DCPP Reporting Enhancements San Luis Obispo County 281,807<br />
CGT-Systemwide SCADA RTU Replacement -WK Tehama County 272,849<br />
63-SCADA <strong>Electric</strong> Trans - SCADA Com Tehama County 259,942<br />
Capital Conservation Multiple Counties 256,962<br />
Invest in Buildings-VP Div Ops Facilities Mendocino County 251,698<br />
-----------<br />
Subtotal- Projects with more than $250,000<br />
in actual costs in CWIP, excluding Research,<br />
Development, & Demonstration jobs 285,246,717<br />
Projects with less than $250,000 in actual<br />
costs in CWIP, including credits representing<br />
preliminary billings 7,577,340<br />
-----------<br />
TOTAL CWIP - COMMON 292,824,057<br />
===========<br />
<strong>FERC</strong> FORM NO. 1 (ED. 12-87) Page 356.5
Name of Respondent<br />
PACIFIC GAS AND ELECTRIC COMPANY<br />
This Report Is:<br />
(1) X An Original<br />
(2) A Resubmission<br />
Date of Report<br />
(Mo, Da, Yr)<br />
04/08/2011<br />
Year/Period of Report<br />
End of <strong>2010</strong>/Q4<br />
AMOUNTS INCLUDED IN ISO/RTO SETTLEMENT STATEMENTS<br />
1. The respondent shall report below the details called for concerning amounts it recorded in Account 555, Purchase Power, <strong>and</strong> Account 447, Sales for<br />
Resale, for items shown on ISO/RTO Settlement Statements. Transactions should be separately netted for each ISO/RTO administered energy market<br />
for purposes of determining whether an entity is a net seller or purchaser in a given hour. Net megawatt hours are to be used as the basis for determining<br />
whether a net purchase or sale has occurred. In each monthly reporting period, the hourly sale <strong>and</strong> purchase net amounts are to be aggregated <strong>and</strong><br />
separately reported in Account 447, Sales for Resale, or Account 555, Purchased Power, respectively.<br />
Line<br />
Description of Item(s)<br />
No.<br />
(a)<br />
1 Energy<br />
2 Net Purchases (Account 555)<br />
3 Net Sales (Account 447)<br />
4 Transmission Rights<br />
Balance at End of Balance at End of<br />
Quarter 1 Quarter 2<br />
(b)<br />
(c)<br />
Balance at End of<br />
Quarter 3<br />
(d)<br />
Balance at End of<br />
Year<br />
(e)<br />
5 Ancillary Services<br />
1,218,265 1,113,463 697,690<br />
4,414,846<br />
6 Other Items (list separately)<br />
7 Grid Management<br />
13,000,110 13,106,328 19,768,771 61,396,810<br />
8 <strong>FERC</strong> Fees<br />
1,073,299 1,048,634 2,548,280<br />
5,891,935<br />
9 ISO Congestion<br />
10 Unaccounted for Energy<br />
( 5,797,804) 26,359,941 ( 3,760,029)<br />
3,627,241<br />
11 Congestion Revenue Rights -Hedge<br />
( 23,958) ( 7,449,477) ( 8,288,902) ( 21,287,336)<br />
12 Congestion Revenue Rights -Auction<br />
767,881 ( 276,333) 351,721<br />
1,132,180<br />
13 Other ISO related charges:<br />
14 Neutrality<br />
1,167,865 12,405,364 12,614,241 40,655,988<br />
15 Voltage Support<br />
16 Other<br />
( 14,615,504) ( 14,813,691) ( 6,664,672) ( 47,177,583)<br />
17 Cost Recovery<br />
6,044,027 11,902,094 2,262,582 33,476,811<br />
18 Inter Day Ahead SC Trade<br />
( 125,370,100) ( 90,512,206) ( 86,017,953) ( 418,347,633)<br />
19 Inter Real Time SC Trade<br />
( 3,276,217) ( 10,037,969) ( 10,958,125) ( 28,464,724)<br />
20 Interest<br />
( 9,905) ( 11,048) ( 27,162) ( 106,835)<br />
21 Energy<br />
22 ISO Spot Market Purchases<br />
17,577,792 10,515,224 24,230,354 81,105,763<br />
23 ISO Spot Market Sales<br />
( 8,952,754) ( 25,968,529) ( 6,356,084) ( 55,366,979)<br />
24 Day Ahead Market Purchases<br />
323,447,809 190,659,072 268,000,728 1,087,590,858<br />
25 Day Ahead Market Sales<br />
392,436 ( 128,215) ( 4,699,569) ( 6,759,334)<br />
26<br />
27<br />
28<br />
29<br />
30<br />
31<br />
32<br />
33<br />
34<br />
35<br />
36<br />
37<br />
38<br />
39<br />
40<br />
41<br />
42<br />
43<br />
44<br />
45<br />
46 TOTAL<br />
206,643,242 117,912,652 203,701,871<br />
741,782,008<br />
<strong>FERC</strong> FORM NO. 1/3-Q (NEW. 12-05) Page 397
Name of Respondent<br />
PACIFIC GAS AND ELECTRIC COMPANY<br />
This Report Is:<br />
Date of Report<br />
(1) X An Original<br />
(Mo, Da, Yr)<br />
(2) A Resubmission<br />
04/08/2011<br />
PURCHASES AND SALES OF ANCILLARY SERVICES<br />
Year/Period of Report<br />
End of <strong>2010</strong>/Q4<br />
Report the amounts for each type of ancillary service shown in column (a) for the year as specified in Order No. 888 <strong>and</strong> defined in the<br />
respondents Open Access Transmission Tariff.<br />
In columns for usage, report usage-related billing determinant <strong>and</strong> the unit of measure.<br />
(1) On line 1 columns (b), (c), (d), (e), (f) <strong>and</strong> (g) report the amount of ancillary services purchased <strong>and</strong> sold during the year.<br />
(2) On line 2 columns (b) (c), (d), (e), (f), <strong>and</strong> (g) report the amount of reactive supply <strong>and</strong> voltage control services purchased <strong>and</strong> sold<br />
during the year.<br />
(3) On line 3 columns (b) (c), (d), (e), (f), <strong>and</strong> (g) report the amount of regulation <strong>and</strong> frequency response services purchased <strong>and</strong> sold<br />
during the year.<br />
(4) On line 4 columns (b), (c), (d), (e), (f), <strong>and</strong> (g) report the amount of energy imbalance services purchased <strong>and</strong> sold during the year.<br />
(5) On lines 5 <strong>and</strong> 6, columns (b), (c), (d), (e), (f), <strong>and</strong> (g) report the amount of operating reserve spinning <strong>and</strong> supplement services<br />
purchased <strong>and</strong> sold during the period.<br />
(6) On line 7 columns (b), (c), (d), (e), (f), <strong>and</strong> (g) report the total amount of all other types ancillary services purchased or sold during<br />
the year. Include in a footnote <strong>and</strong> specify the amount for each type of other ancillary service provided.<br />
Line<br />
No.<br />
Type of Ancillary Service<br />
(a)<br />
1 Scheduling, System Control <strong>and</strong> Dispatch<br />
2 Reactive Supply <strong>and</strong> Voltage<br />
3 Regulation <strong>and</strong> Frequency Response<br />
4 Energy Imbalance<br />
5 Operating Reserve - Spinning<br />
6 Operating Reserve - Supplement<br />
7 Other<br />
8 Total (Lines 1 thru 7)<br />
Amount Purchased for the Year<br />
Usage - Related Billing Determinant<br />
Unit of<br />
Number of Units Measure Dollars<br />
(b) (c) (d)<br />
Various<br />
4,651,062<br />
4,651,062<br />
Amount Sold for the Year<br />
Usage - Related Billing Determinant<br />
Unit of<br />
Number of Units Measure Dollars<br />
(e) (f) (g)<br />
859,303<br />
835,017<br />
1,129,123<br />
835,017<br />
835,017<br />
4,493,477<br />
NA<br />
kW-Month<br />
kW-Month<br />
kWh<br />
kW-Month<br />
kW-Month<br />
Various<br />
<strong>FERC</strong> FORM NO. 1 (New 2-04) Page 398
Name of Respondent<br />
PACIFIC GAS AND ELECTRIC COMPANY<br />
This Report is:<br />
(1) X An Original<br />
(2) A Resubmission<br />
Date of Report<br />
(Mo, Da, Yr)<br />
04/08/2011<br />
Year/Period of Report<br />
<strong>2010</strong>/Q4<br />
FOOTNOTE DATA<br />
Schedule Page: 398 Line No.: 1 Column: b<br />
With the exception of the Utility's contracts with BART <strong>and</strong> Minnesota Methane (OAT<br />
Tarriff) that are reported In Lines 1 - 6, all Ancillary Services (AS) purchases <strong>and</strong> sales<br />
are covered under the <strong>FERC</strong> approved ISO Tariff. Definitions of AS under Order No. 888 <strong>and</strong><br />
the ISO Tariff are not consistent with one another. In order to avoid confusion as to<br />
meanings <strong>and</strong> terminologies, ISO AS amounts are not included on these lines but are<br />
reported on Line 7.<br />
Schedule Page: 398 Line No.: 7 Column: b<br />
This line includes Ancillary Services as follows:<br />
AS under gr<strong>and</strong>fathered existing<br />
contracts<br />
Regulation Service<br />
Charge<br />
- -<br />
-<br />
Flat<br />
Charge<br />
0<br />
ISO related AS activities<br />
Retail ISO Purchases <strong>and</strong> Sales <strong>and</strong><br />
Existing Transmission Contracts (ETC) (a)<br />
- Various 4,651,062 - Various 236,216<br />
Total 4,651,062 236,216<br />
(a) This comprised of various billing determinants which the ISO uses to calculate the amounts of AS sold or<br />
purchased.<br />
This item also includes ISO AS purchases/sales by the Utility in its role as Scheduling Coordinator for<br />
ETCs.<br />
<strong>FERC</strong> FORM NO. 1 (ED. 12-87) Page 450.1
Name of Respondent<br />
PACIFIC GAS AND ELECTRIC COMPANY<br />
This Report Is:<br />
Date of Report<br />
(1) X An Original<br />
(Mo, Da, Yr)<br />
(2) A Resubmission<br />
04/08/2011<br />
MONTHLY TRANSMISSION SYSTEM PEAK LOAD<br />
Year/Period of Report<br />
End of <strong>2010</strong>/Q4<br />
(1) Report the monthly peak load on the respondent's transmission system. If the respondent has two or more power systems which are not physically<br />
integrated, furnish the required information for each non-integrated system.<br />
(2) Report on Column (b) by month the transmission system's peak load.<br />
(3) Report on Columns (c ) <strong>and</strong> (d) the specified information for each monthly transmission - system peak load reported on Column (b).<br />
(4) Report on Columns (e) through (j) by month the system' monthly maximum megawatt load by statistical classifications. See General Instruction for<br />
the definition of each statistical classification.<br />
NAME OF SYSTEM:<br />
Line<br />
No.<br />
1 January<br />
Month<br />
(a)<br />
2 February<br />
3 March<br />
4 Total for Quarter 1<br />
5 April<br />
6 May<br />
7 June<br />
8 Total for Quarter 2<br />
9 July<br />
10 August<br />
11 September<br />
12 Total for Quarter 3<br />
13 October<br />
14 November<br />
15 December<br />
16 Total for Quarter 4<br />
Monthly Peak<br />
MW - Total<br />
(b)<br />
14,226<br />
14,008<br />
13,683<br />
41,917<br />
12,659<br />
12,290<br />
18,902<br />
43,851<br />
19,308<br />
20,975<br />
19,286<br />
59,569<br />
15,975<br />
14,790<br />
14,492<br />
45,257<br />
Day of<br />
Monthly<br />
Peak<br />
(c)<br />
21<br />
23<br />
9<br />
19<br />
3<br />
28<br />
15<br />
25<br />
2<br />
14<br />
29<br />
16<br />
Hour of<br />
Monthly<br />
Peak<br />
(d)<br />
1800<br />
1900<br />
1900<br />
2000<br />
1400<br />
1700<br />
1700<br />
1700<br />
1600<br />
1600<br />
1800<br />
1800<br />
Firm Network<br />
Service for Self<br />
(e)<br />
11,416<br />
11,576<br />
11,144<br />
34,136<br />
10,410<br />
10,785<br />
15,940<br />
37,135<br />
15,901<br />
17,538<br />
16,125<br />
49,564<br />
13,246<br />
11,650<br />
11,541<br />
36,437<br />
Firm Network<br />
Service for<br />
Others<br />
(f)<br />
70<br />
68<br />
62<br />
200<br />
62<br />
47<br />
43<br />
152<br />
66<br />
68<br />
68<br />
202<br />
60<br />
60<br />
71<br />
191<br />
Long-Term Firm<br />
Point-to-point<br />
Reservations<br />
(g)<br />
Other Long-<br />
Term Firm<br />
Short-Term Firm<br />
Point-to-point<br />
Other<br />
Service<br />
Service<br />
(h)<br />
Reservation<br />
(i)<br />
(j)<br />
1,710 1,030<br />
1,711 653<br />
1,711 766<br />
5,132 2,449<br />
1,702 486<br />
960 498<br />
1,712 1,207<br />
4,374 2,191<br />
435 2,905<br />
426 2,943<br />
632 2,461<br />
1,493 8,309<br />
550 2,119<br />
482 2,598<br />
522 2,358<br />
1,554 7,075<br />
17 Total Year to<br />
Date/Year<br />
190,594<br />
157,272<br />
745<br />
12,553 20,024<br />
<strong>FERC</strong> FORM NO. 1/3-Q (NEW. 07-04) Page 400
Name of Respondent<br />
PACIFIC GAS AND ELECTRIC COMPANY<br />
This Report is:<br />
(1) X An Original<br />
(2) A Resubmission<br />
Date of Report<br />
(Mo, Da, Yr)<br />
04/08/2011<br />
Year/Period of Report<br />
<strong>2010</strong>/Q4<br />
FOOTNOTE DATA<br />
Schedule Page: 400 Line No.: 1 Column: b<br />
The source of the entries in this column are the metered data from <strong>Pacific</strong> <strong>Gas</strong> <strong>and</strong><br />
<strong>Electric</strong> <strong>Company</strong>'s (the "Utility") Daily Service Report, Line 9.<br />
Schedule Page: 400 Line No.: 1 Column: f<br />
Entries here represent Open Access Transmission Tariff Network Service to the Bay Area<br />
Rapid Transit District.<br />
Schedule Page: 400 Line No.: 1 Column: h<br />
Entries here represent transmission service to the following Existing Transmission<br />
Contract customers:<br />
California Department of Water Resources<br />
City <strong>and</strong> County of San Francisco ("CCSF")<br />
Transmission Agency of Northern California ("TANC")<br />
Western Area Power Administration ("WAPA")<br />
Contract dem<strong>and</strong> is used as a proxy for coincident peaks for CCSF <strong>and</strong> TANC. WAPA coincident<br />
peaks are estimated.<br />
Schedule Page: 400 Line No.: 1 Column: j<br />
Transmission services utilizing the Utility's transmission system are also sold by the<br />
California Independent System Operator ("ISO") to other wholesale entities. The ISO tracks<br />
this data <strong>and</strong> reports it sepearately to the <strong>FERC</strong>. The Utility does not have access to this<br />
data. The ISO numbers reported in this column were derived by subtracting columns (e)-(i)<br />
from column (b).<br />
<strong>FERC</strong> FORM NO. 1 (ED. 12-87) Page 450.1
Name of Respondent<br />
This Report Is:<br />
Date of Report<br />
Year/Period of Report<br />
(1) X An Original<br />
(Mo, Da, Yr)<br />
PACIFIC GAS AND ELECTRIC COMPANY<br />
End of <strong>2010</strong>/Q4<br />
(2) A Resubmission<br />
04/08/2011<br />
ELECTRIC ENERGY ACCOUNT<br />
Report below the information called for concerning the disposition of electric energy generated, purchased, exchanged <strong>and</strong> wheeled during the year.<br />
Line<br />
No.<br />
Item<br />
(a)<br />
1 SOURCES OF ENERGY<br />
2 Generation (Excluding Station Use):<br />
3 Steam<br />
4 Nuclear<br />
5 Hydro-Conventional<br />
6 Hydro-Pumped Storage<br />
7 Other<br />
8 Less Energy for Pumping<br />
9 Net Generation (Enter Total of lines 3<br />
through 8)<br />
10 Purchases<br />
11 Power Exchanges:<br />
12 Received<br />
13 Delivered<br />
14 Net Exchanges (Line 12 minus line 13)<br />
15 Transmission For Other (Wheeling)<br />
16 Received<br />
17 Delivered<br />
18 Net Transmission for Other (Line 16 minus<br />
line 17)<br />
19 Transmission By Others Losses<br />
20 TOTAL (Enter Total of lines 9, 10, 14, 18<br />
<strong>and</strong> 19)<br />
MegaWatt Hours<br />
Line<br />
Item MegaWatt Hours<br />
No.<br />
(b)<br />
(a)<br />
(b)<br />
21 DISPOSITION OF ENERGY<br />
22 Sales to Ultimate Consumers (Including<br />
84,064,481<br />
3,546,966 Interdepartmental Sales)<br />
18,430,538 23 Requirements Sales for Resale (See<br />
1,607,595<br />
10,376,222 instruction 4, page 311.)<br />
583,878 24 Non-Requirements Sales for Resale (See<br />
138,282 instruction 4, page 311.)<br />
899,141 25 Energy Furnished Without Charge<br />
32,176,745 26 Energy Used by the <strong>Company</strong> (<strong>Electric</strong><br />
Dept Only, Excluding Station Use)<br />
58,828,998<br />
2,441,868<br />
2,384,081<br />
57,787<br />
91,063,530<br />
27 Total Energy Losses<br />
28 TOTAL (Enter Total of Lines 22 Through<br />
27) (MUST EQUAL LINE 20)<br />
5,391,454<br />
91,063,530<br />
<strong>FERC</strong> FORM NO. 1 (ED. 12-90) Page 401a
Name of Respondent<br />
PACIFIC GAS AND ELECTRIC COMPANY<br />
This<br />
(1)<br />
Report<br />
X<br />
Is:<br />
An Original<br />
(2) A Resubmission<br />
MONTHLY PEAKS AND OUTPUT<br />
Date of Report<br />
(Mo, Da, Yr)<br />
04/08/2011<br />
Year/Period of Report<br />
End of <strong>2010</strong>/Q4<br />
1. Report the monthly peak load <strong>and</strong> energy output. If the respondent has two or more power which are not physically integrated, furnish the required<br />
information for each non- integrated system.<br />
2. Report in column (b) by month the system’s output in Megawatt hours for each month.<br />
3. Report in column (c) by month the non-requirements sales for resale. Include in the monthly amounts any energy losses associated with the sales.<br />
4. Report in column (d) by month the system’s monthly maximum megawatt load (60 minute integration) associated with the system.<br />
5. Report in column (e) <strong>and</strong> (f) the specified information for each monthly peak load reported in column (d).<br />
NAME OF SYSTEM: <strong>Pacific</strong> <strong>Gas</strong> <strong>and</strong> <strong>Electric</strong> <strong>Company</strong><br />
Monthly Non-Requirments<br />
Line<br />
MONTHLY PEAK<br />
Sales for Resale &<br />
No. Month Total Monthly Energy Associated Losses Megawatts (See Instr. 4) Day of Month<br />
Hour<br />
(a)<br />
(b)<br />
(c)<br />
(d)<br />
(e)<br />
(f)<br />
29 January<br />
7,514,915<br />
13,181 21<br />
1800<br />
30 February<br />
6,645,928<br />
12,868 23<br />
1900<br />
31 March<br />
7,384,859<br />
12,725 9<br />
1900<br />
32 April<br />
7,038,424<br />
11,753 19<br />
2000<br />
33 May<br />
7,350,355<br />
11,851 3<br />
2100<br />
34 June<br />
8,081,128<br />
17,641 28<br />
1700<br />
35 July<br />
8,968,964<br />
17,767 15<br />
1700<br />
36 August<br />
8,755,624<br />
19,286 25<br />
1700<br />
37 September<br />
8,201,029<br />
17,677 2<br />
1600<br />
38 October<br />
7,654,567<br />
14,755 14<br />
1600<br />
39 November<br />
7,372,216<br />
13,383 29<br />
1800<br />
40 December<br />
7,681,834<br />
13,207 16<br />
1800<br />
41 TOTAL 92,649,843<br />
<strong>FERC</strong> FORM NO. 1 (ED. 12-90) Page 401b
Name of Respondent<br />
PACIFIC GAS AND ELECTRIC COMPANY<br />
This Report is:<br />
(1) X An Original<br />
(2) A Resubmission<br />
Date of Report<br />
(Mo, Da, Yr)<br />
04/08/2011<br />
Year/Period of Report<br />
<strong>2010</strong>/Q4<br />
FOOTNOTE DATA<br />
Schedule Page: 401 Line No.: 3 Column: b<br />
This includes conventional plants only. It does not include combustion turbines, which is<br />
shown separately on Line 7.<br />
Schedule Page: 401 Line No.: 7 Column: b<br />
This includes combustion turbines <strong>and</strong> photo voltaic generation of 133,677 MWH <strong>and</strong> 4,605<br />
MWH, respectively.<br />
Schedule Page: 401 Line No.: 10 Column: b<br />
Actual purchases from pages 326-327 were 44,837,023 MWH. For purposes only of accounting<br />
for the total energy that went through the Utility's electric system, the MWH for Direct<br />
Access ("DA") of 4,192,541 MWH <strong>and</strong> California Department of Water Resources ("DWR")<br />
deliveries of 9,799,434 MWH were added to this line item. It should be noted that DA <strong>and</strong><br />
DWR megawatts are not Utility purchases <strong>and</strong> were reported here only because page 401 of<br />
the <strong>Form</strong> 1 does not have any other available line where DA <strong>and</strong> DWR deliveries can be shown<br />
more appropriately.<br />
The Utility acts as a pass-through entity for electricity purchased by the DWR that is<br />
sold to the Utility's customers. Although charges for electricity provided by the DWR are<br />
included in the amounts the Utility bills its customers, the Utility deducts from<br />
electricity revenues amounts passed through to the DWR. The pass-through amounts are based<br />
on the quantities of electricity provided by the DWR that are consumed by customers,<br />
priced at the related CPUC-approved remittance rate. These pass-through amounts are<br />
excluded from the Utility's electricity revenues in its Statement of Income.<br />
Schedule Page: 401 Line No.: 22 Column: b<br />
This includes MWH sales for DWR <strong>and</strong> DA as discussed in the footnote to Line 10, column b.<br />
Schedule Page: 401 Line No.: 26 Column: b<br />
Data for energy used by the electric department is not separately available but is<br />
included on Line 22.<br />
Schedule Page: 401 Line No.: 29 Column: b<br />
The values shown in Lines 29-40, column b, include correction of data previously reported<br />
in <strong>Form</strong> 3-Q for the first three quarters of <strong>2010</strong>.<br />
Schedule Page: 401 Line No.: 29 Column: c<br />
The values shown in Lines 29-40, column c, include correction of data previously reported<br />
in <strong>Form</strong> 3-Q for the first three quarters of <strong>2010</strong>.<br />
<strong>FERC</strong> FORM NO. 1 (ED. 12-87) Page 450.1
Name of Respondent<br />
PACIFIC GAS AND ELECTRIC COMPANY<br />
This Report Is:<br />
(1) X An Original<br />
(2) A Resubmission<br />
Date of Report<br />
(Mo, Da, Yr)<br />
04/08/2011<br />
Year/Period of Report<br />
End of<br />
<strong>2010</strong>/Q4<br />
STEAM-ELECTRIC GENERATING PLANT STATISTICS (Large Plants)<br />
1. Report data for plant in Service only. 2. Large plants are steam plants with installed capacity (name plate rating) of 25,000 Kw or more. Report in<br />
this page gas-turbine <strong>and</strong> internal combustion plants of 10,000 Kw or more, <strong>and</strong> nuclear plants. 3. Indicate by a footnote any plant leased or operated<br />
as a joint facility. 4. If net peak dem<strong>and</strong> for 60 minutes is not available, give data which is available, specifying period. 5. If any employees attend<br />
more than one plant, report on line 11 the approximate average number of employees assignable to each plant. 6. If gas is used <strong>and</strong> purchased on a<br />
therm basis report the Btu content or the gas <strong>and</strong> the quantity of fuel burned converted to Mct. 7. Quantities of fuel burned (Line 38) <strong>and</strong> average cost<br />
per unit of fuel burned (Line 41) must be consistent with charges to expense accounts 501 <strong>and</strong> 547 (Line 42) as show on Line 20. 8. If more than one<br />
fuel is burned in a plant furnish only the composite heat rate for all fuels burned.<br />
Line<br />
No.<br />
Item<br />
(a)<br />
Plant<br />
Name: DIABLO CANYON 1 & 2<br />
(b)<br />
Plant<br />
Name: HUMBOLDT BAY 1 & 2<br />
(c)<br />
1 Kind of Plant (Internal Comb, <strong>Gas</strong> Turb, Nuclear<br />
2 Type of Constr (Conventional, Outdoor, Boiler, etc)<br />
3 Year Originally Constructed<br />
4 Year Last Unit was Installed<br />
5 Total Installed Cap (Max Gen Name Plate Ratings-MW)<br />
6 Net Peak Dem<strong>and</strong> on Plant - MW (60 minutes)<br />
7 Plant Hours Connected to Load<br />
8 Net Continuous Plant Capability (Megawatts)<br />
9 When Not Limited by Condenser Water<br />
10 When Limited by Condenser Water<br />
11 Average Number of Employees<br />
12 Net Generation, Exclusive of Plant Use - KWh<br />
13 Cost of Plant: L<strong>and</strong> <strong>and</strong> L<strong>and</strong> Rights<br />
14 Structures <strong>and</strong> Improvements<br />
15 Equipment Costs<br />
16 Asset Retirement Costs<br />
17 Total Cost<br />
18 Cost per KW of Installed Capacity (line 17/5) Including<br />
19 Production Expenses: Oper, Supv, & Engr<br />
20 Fuel<br />
21 Coolants <strong>and</strong> Water (Nuclear Plants Only)<br />
22 Steam Expenses<br />
23 Steam From Other Sources<br />
24 Steam Transferred (Cr)<br />
25 <strong>Electric</strong> Expenses<br />
26 Misc Steam (or Nuclear) Power Expenses<br />
27 Rents<br />
28 Allowances<br />
29 Maintenance Supervision <strong>and</strong> Engineering<br />
30 Maintenance of Structures<br />
31 Maintenance of Boiler (or reactor) Plant<br />
32 Maintenance of <strong>Electric</strong> Plant<br />
33 Maintenance of Misc Steam (or Nuclear) Plant<br />
34 Total Production Expenses<br />
35 Expenses per Net KWh<br />
36 Fuel: Kind (Coal, <strong>Gas</strong>, Oil, or Nuclear)<br />
37 Unit (Coal-tons/Oil-barrel/<strong>Gas</strong>-mcf/Nuclear-indicate)<br />
38 Quantity (Units) of Fuel Burned<br />
39 Avg Heat Cont - Fuel Burned (btu/indicate if nuclear)<br />
40 Avg Cost of Fuel/unit, as Delvd f.o.b. during year<br />
41 Average Cost of Fuel per Unit Burned<br />
42 Average Cost of Fuel Burned per Million BTU<br />
43 Average Cost of Fuel Burned per KWh Net Gen<br />
44 Average BTU per KWh Net Generation<br />
Nuclear<br />
Steam<br />
Conventional<br />
Semi-Outdoor<br />
1968<br />
1956<br />
1986<br />
1958<br />
2323.00<br />
102.40<br />
2240<br />
105<br />
8760<br />
6544<br />
0<br />
0<br />
2240<br />
105<br />
2240<br />
0<br />
1439<br />
45<br />
18430537775<br />
379721293<br />
26285591<br />
218631<br />
977695407<br />
11748462<br />
6326554765<br />
29088315<br />
0<br />
23866669<br />
7330535763<br />
64922077<br />
3155.6331<br />
634.0047<br />
0<br />
0<br />
105267617<br />
28132140<br />
29049330<br />
0<br />
49020065<br />
27550<br />
0<br />
0<br />
0<br />
0<br />
1620980<br />
21730<br />
80412389<br />
2358076<br />
0<br />
0<br />
0<br />
0<br />
0<br />
0<br />
8515850<br />
300<br />
33840917<br />
1128<br />
40039351<br />
1332886<br />
18618116<br />
2454685<br />
366384615<br />
34328495<br />
0.0199<br />
0.0904<br />
Nuclear<br />
<strong>Gas</strong><br />
MWD<br />
Mcf<br />
0 2306350 0 0 4872508 0<br />
0 0 0 0 1019889 0<br />
0.000 0.000 0.000 0.000 4.940 0.000<br />
0.000 45.647 0.000 0.000 5.440 0.000<br />
0.000 0.557 0.000 0.000 5.330 0.000<br />
0.000 0.006 0.000 0.000 0.070 0.000<br />
0.000 10247.676 0.000 0.000 13218.000 0.000<br />
<strong>FERC</strong> FORM NO. 1 (REV. 12-03) Page 402
Name of Respondent<br />
PACIFIC GAS AND ELECTRIC COMPANY<br />
This Report Is:<br />
(1) X An Original<br />
(2) A Resubmission<br />
Date of Report<br />
(Mo, Da, Yr)<br />
04/08/2011<br />
Year/Period of Report<br />
End of<br />
<strong>2010</strong>/Q4<br />
STEAM-ELECTRIC GENERATING PLANT STATISTICS (Large Plants) (Continued)<br />
1. Report data for plant in Service only. 2. Large plants are steam plants with installed capacity (name plate rating) of 25,000 Kw or more. Report in<br />
this page gas-turbine <strong>and</strong> internal combustion plants of 10,000 Kw or more, <strong>and</strong> nuclear plants. 3. Indicate by a footnote any plant leased or operated<br />
as a joint facility. 4. If net peak dem<strong>and</strong> for 60 minutes is not available, give data which is available, specifying period. 5. If any employees attend<br />
more than one plant, report on line 11 the approximate average number of employees assignable to each plant. 6. If gas is used <strong>and</strong> purchased on a<br />
therm basis report the Btu content or the gas <strong>and</strong> the quantity of fuel burned converted to Mct. 7. Quantities of fuel burned (Line 38) <strong>and</strong> average cost<br />
per unit of fuel burned (Line 41) must be consistent with charges to expense accounts 501 <strong>and</strong> 547 (Line 42) as show on Line 20. 8. If more than one<br />
fuel is burned in a plant furnish only the composite heat rate for all fuels burned.<br />
Line<br />
No.<br />
Item<br />
(a)<br />
Plant<br />
Name: Colusa Gen Station<br />
(b)<br />
Plant<br />
Name: Humboldt Gen Station<br />
(c)<br />
1 Kind of Plant (Internal Comb, <strong>Gas</strong> Turb, Nuclear<br />
2 Type of Constr (Conventional, Outdoor, Boiler, etc)<br />
3 Year Originally Constructed<br />
4 Year Last Unit was Installed<br />
5 Total Installed Cap (Max Gen Name Plate Ratings-MW)<br />
6 Net Peak Dem<strong>and</strong> on Plant - MW (60 minutes)<br />
7 Plant Hours Connected to Load<br />
8 Net Continuous Plant Capability (Megawatts)<br />
9 When Not Limited by Condenser Water<br />
10 When Limited by Condenser Water<br />
11 Average Number of Employees<br />
12 Net Generation, Exclusive of Plant Use - KWh<br />
13 Cost of Plant: L<strong>and</strong> <strong>and</strong> L<strong>and</strong> Rights<br />
14 Structures <strong>and</strong> Improvements<br />
15 Equipment Costs<br />
16 Asset Retirement Costs<br />
17 Total Cost<br />
18 Cost per KW of Installed Capacity (line 17/5) Including<br />
19 Production Expenses: Oper, Supv, & Engr<br />
20 Fuel<br />
21 Coolants <strong>and</strong> Water (Nuclear Plants Only)<br />
22 Steam Expenses<br />
23 Steam From Other Sources<br />
24 Steam Transferred (Cr)<br />
25 <strong>Electric</strong> Expenses<br />
26 Misc Steam (or Nuclear) Power Expenses<br />
27 Rents<br />
28 Allowances<br />
29 Maintenance Supervision <strong>and</strong> Engineering<br />
30 Maintenance of Structures<br />
31 Maintenance of Boiler (or reactor) Plant<br />
32 Maintenance of <strong>Electric</strong> Plant<br />
33 Maintenance of Misc Steam (or Nuclear) Plant<br />
34 Total Production Expenses<br />
35 Expenses per Net KWh<br />
36 Fuel: Kind (Coal, <strong>Gas</strong>, Oil, or Nuclear)<br />
37 Unit (Coal-tons/Oil-barrel/<strong>Gas</strong>-mcf/Nuclear-indicate)<br />
38 Quantity (Units) of Fuel Burned<br />
39 Avg Heat Cont - Fuel Burned (btu/indicate if nuclear)<br />
40 Avg Cost of Fuel/unit, as Delvd f.o.b. during year<br />
41 Average Cost of Fuel per Unit Burned<br />
42 Average Cost of Fuel Burned per Million BTU<br />
43 Average Cost of Fuel Burned per KWh Net Gen<br />
44 Average BTU per KWh Net Generation<br />
Combined Cycle<br />
Internal Comb Recip<br />
Outdoor<br />
Indoor<br />
<strong>2010</strong><br />
<strong>2010</strong><br />
<strong>2010</strong><br />
2011<br />
711.45<br />
146.43<br />
659<br />
146<br />
157<br />
2239<br />
0<br />
0<br />
0<br />
0<br />
0<br />
0<br />
23<br />
18<br />
67868256<br />
129784500<br />
6214498<br />
0<br />
110713282<br />
60184243<br />
521199372<br />
130214429<br />
6893077<br />
2957716<br />
645020229<br />
193356388<br />
906.6276<br />
1320.4698<br />
0<br />
0<br />
1906662<br />
4040723<br />
0<br />
0<br />
0<br />
0<br />
0<br />
0<br />
0<br />
0<br />
10306<br />
8450<br />
-560139<br />
656939<br />
0<br />
0<br />
0<br />
0<br />
0<br />
0<br />
143<br />
43980<br />
535<br />
439<br />
632129<br />
614035<br />
3428<br />
2811<br />
1993064<br />
5367377<br />
0.0294<br />
0.0414<br />
<strong>Gas</strong><br />
<strong>Gas</strong><br />
Mcf<br />
Mcf<br />
0 459541 0 0 1128157 0<br />
0 1018000 0 0 1023500 0<br />
0.000 4.360 0.000 0.000 4.350 0.000<br />
0.000 4.340 0.000 0.000 4.590 0.000<br />
0.000 4.350 0.000 0.000 4.430 0.000<br />
0.000 0.030 0.000 0.000 0.040 0.000<br />
0.000 6893.000 0.000 0.000 8945.000 0.000<br />
<strong>FERC</strong> FORM NO. 1 (REV. 12-03) Page 402.1
Name of Respondent<br />
This Report Is:<br />
Date of Report<br />
(1) X An Original<br />
(Mo, Da, Yr)<br />
PACIFIC GAS AND ELECTRIC COMPANY<br />
(2) A Resubmission<br />
04/08/2011<br />
STEAM-ELECTRIC GENERATING PLANT STATISTICS (Large Plants) (Continued)<br />
9. Items under Cost of Plant are based on U. S. of A. Accounts. Production expenses do not include Purchased Power, System Control <strong>and</strong> Load<br />
Dispatching, <strong>and</strong> Other Expenses Classified as Other Power Supply Expenses. 10. For IC <strong>and</strong> GT plants, report Operating Expenses, Account Nos.<br />
547 <strong>and</strong> 549 on Line 25 "<strong>Electric</strong> Expenses," <strong>and</strong> Maintenance Account Nos. 553 <strong>and</strong> 554 on Line 32, "Maintenance of <strong>Electric</strong> Plant." Indicate plants<br />
designed for peak load service. Designate automatically operated plants. 11. For a plant equipped with combinations of fossil fuel steam, nuclear<br />
steam, hydro, internal combustion or gas-turbine equipment, report each as a separate plant. However, if a gas-turbine unit functions in a combined<br />
cycle operation with a conventional steam unit, include the gas-turbine with the steam plant. 12. If a nuclear power generating plant, briefly explain by<br />
footnote (a) accounting method for cost of power generated including any excess costs attributed to research <strong>and</strong> development; (b) types of cost units<br />
used for the various components of fuel cost; <strong>and</strong> (c) any other informative data concerning plant type fuel used, fuel enrichment type <strong>and</strong> quantity for the<br />
report period <strong>and</strong> other physical <strong>and</strong> operating characteristics of plant.<br />
Plant<br />
Name:<br />
Mobile Unit 2<br />
(d)<br />
Plant<br />
Name:<br />
Mobile Unit 3<br />
(e)<br />
Plant<br />
Name:<br />
Gateway Gen Station<br />
(f)<br />
Year/Period of Report<br />
End of<br />
<strong>2010</strong>/Q4<br />
Line<br />
No.<br />
Oil<br />
Bbl<br />
<strong>Gas</strong> Turbine <strong>Gas</strong> Turbine Combined Cycle 1<br />
Mobile Mobile Outdoor 2<br />
1976 1976 2009 3<br />
1976 1976 2009 4<br />
13.30 13.30 613.00 5<br />
15 15 580 6<br />
121 204 6922 7<br />
0 0 0 8<br />
15 15 0 9<br />
0 0 0 10<br />
0 0 21 11<br />
2631563 1260789 3099376275 12<br />
0 0 5040000 13<br />
0 1399 69543039 14<br />
3189457 4354025 365773242 15<br />
0 0 5198961 16<br />
3189457 4355424 445555242 17<br />
239.8088 327.4755 726.8438 18<br />
0 0 0 19<br />
1611518 1201526 112397632 20<br />
0 0 0 21<br />
879 880 0 22<br />
0 0 0 23<br />
0 0 0 24<br />
694 693 121340 25<br />
73555 73555 -6530590 26<br />
0 0 0 27<br />
0 0 0 28<br />
0 0 0 29<br />
10 9 641499 30<br />
36 36 1573580 31<br />
42539 42538 9340121 32<br />
56465 306602 1836759 33<br />
1785696 1625839 119380341 34<br />
0.6786 1.2895 0.0385 35<br />
Oil <strong>Gas</strong><br />
36<br />
Bbl Mcf<br />
37<br />
0 7871 0 0 3349 0 0 22952623 0<br />
38<br />
0 5809455 0 0 5809455 0 0 1027500 0<br />
39<br />
0.000 105.840 0.000 0.000 105.840 0.000 0.000 4.840 0.000<br />
40<br />
0.000 104.990 0.000 0.000 104.990 0.000 0.000 4.910 0.000<br />
41<br />
0.000 18.070 0.000 0.000 18.070 0.000 0.000 4.640 0.000<br />
42<br />
0.000 0.314 0.000 0.000 0.279 0.000 0.000 0.035 0.000<br />
43<br />
0.000 17376.000 0.000 0.000 15433.000 0.000 0.000 7609.000 0.000<br />
44<br />
<strong>FERC</strong> FORM NO. 1 (REV. 12-03) Page 403
Name of Respondent<br />
This Report Is:<br />
Date of Report<br />
(1) X An Original<br />
(Mo, Da, Yr)<br />
PACIFIC GAS AND ELECTRIC COMPANY<br />
(2) A Resubmission<br />
04/08/2011<br />
STEAM-ELECTRIC GENERATING PLANT STATISTICS (Large Plants) (Continued)<br />
Year/Period of Report<br />
9. Items under Cost of Plant are based on U. S. of A. Accounts. Production expenses do not include Purchased Power, System Control <strong>and</strong> Load<br />
Dispatching, <strong>and</strong> Other Expenses Classified as Other Power Supply Expenses. 10. For IC <strong>and</strong> GT plants, report Operating Expenses, Account Nos.<br />
547 <strong>and</strong> 549 on Line 25 "<strong>Electric</strong> Expenses," <strong>and</strong> Maintenance Account Nos. 553 <strong>and</strong> 554 on Line 32, "Maintenance of <strong>Electric</strong> Plant." Indicate plants<br />
designed for peak load service. Designate automatically operated plants. 11. For a plant equipped with combinations of fossil fuel steam, nuclear<br />
steam, hydro, internal combustion or gas-turbine equipment, report each as a separate plant. However, if a gas-turbine unit functions in a combined<br />
cycle operation with a conventional steam unit, include the gas-turbine with the steam plant. 12. If a nuclear power generating plant, briefly explain by<br />
footnote (a) accounting method for cost of power generated including any excess costs attributed to research <strong>and</strong> development; (b) types of cost units<br />
used for the various components of fuel cost; <strong>and</strong> (c) any other informative data concerning plant type fuel used, fuel enrichment type <strong>and</strong> quantity for the<br />
report period <strong>and</strong> other physical <strong>and</strong> operating characteristics of plant.<br />
Plant<br />
Name:<br />
(d)<br />
Plant<br />
Name:<br />
(e)<br />
Plant<br />
Name:<br />
(f)<br />
End of<br />
<strong>2010</strong>/Q4<br />
Line<br />
No.<br />
0.00 0.00 0.00 5<br />
0 0 0 6<br />
0 0 0 7<br />
0 0 0 8<br />
0 0 0 9<br />
0 0 0 10<br />
0 0 0 11<br />
0 0 0 12<br />
0 0 0 13<br />
0 0 0 14<br />
0 0 0 15<br />
0 0 0 16<br />
0 0 0 17<br />
0.0000 0.0000 0.0000 18<br />
0 0 0 19<br />
0 0 0 20<br />
0 0 0 21<br />
0 0 0 22<br />
0 0 0 23<br />
0 0 0 24<br />
0 0 0 25<br />
0 0 0 26<br />
0 0 0 27<br />
0 0 0 28<br />
0 0 0 29<br />
0 0 0 30<br />
0 0 0 31<br />
0 0 0 32<br />
0 0 0 33<br />
0 0 0 34<br />
0.0000 0.0000 0.0000 35<br />
0 0 0 0 0 0 0 0 0<br />
38<br />
0 0 0 0 0 0 0 0 0<br />
39<br />
0.000 0.000 0.000 0.000 0.000 0.000 0.000 0.000 0.000<br />
40<br />
0.000 0.000 0.000 0.000 0.000 0.000 0.000 0.000 0.000<br />
41<br />
0.000 0.000 0.000 0.000 0.000 0.000 0.000 0.000 0.000<br />
42<br />
0.000 0.000 0.000 0.000 0.000 0.000 0.000 0.000 0.000<br />
43<br />
0.000 0.000 0.000 0.000 0.000 0.000 0.000 0.000 0.000<br />
44<br />
1<br />
2<br />
3<br />
4<br />
36<br />
37<br />
<strong>FERC</strong> FORM NO. 1 (REV. 12-03) Page 403.1
Name of Respondent<br />
PACIFIC GAS AND ELECTRIC COMPANY<br />
This Report is:<br />
(1) X An Original<br />
(2) A Resubmission<br />
Date of Report<br />
(Mo, Da, Yr)<br />
04/08/2011<br />
Year/Period of Report<br />
<strong>2010</strong>/Q4<br />
FOOTNOTE DATA<br />
Schedule Page: 402 Line No.: -1 Column: c<br />
Humboldt Bay Units 1 & 2 were retired September 30, <strong>2010</strong>.<br />
Schedule Page: 402 Line No.: -1 Column: d<br />
Mobile Unit 1 was salvaged <strong>and</strong> scrapped out in 2008.<br />
Schedule Page: 402 Line No.: -1 Column: e<br />
Mobile Unit 2 <strong>and</strong> Mobile Unit 3 were retired September 24, <strong>2010</strong>.<br />
Schedule Page: 402 Line No.: 11 Column: d<br />
Operated <strong>and</strong> maintained by employees stationed at Humboldt Bay Power Plant.<br />
Schedule Page: 402 Line No.: 11 Column: e<br />
Operated <strong>and</strong> maintained by employees stationed at Humboldt Bay Power Plant.<br />
Schedule Page: 402 Line No.: 17 Column: c<br />
Total costs for all steam power plants exclude primarily those relating to asset<br />
retirement costs for the non-operational Humboldt Bay Unit 3 plant <strong>and</strong> other miscellaneous<br />
costs not tied to any existing generating plants.<br />
Schedule Page: 402 Line No.: 34 Column: c<br />
Total production expenses for all steam power plants exclude certain expenses for the<br />
non-operational Humboldt Bay Unit 3 plant <strong>and</strong> other miscellaneous costs not tied to any<br />
existing generating plant<br />
<strong>FERC</strong> FORM NO. 1 (ED. 12-87) Page 450.1
<strong>FERC</strong> FORM NO. 1 (REV. 12-03) Page 406<br />
Name of Respondent<br />
This Report Is:<br />
Date of Report<br />
(1) X An Original<br />
(Mo, Da, Yr)<br />
PACIFIC GAS AND ELECTRIC COMPANY<br />
(2) A Resubmission<br />
04/08/2011<br />
HYDROELECTRIC GENERATING PLANT STATISTICS (Large Plants)<br />
Year/Period of Report<br />
End of<br />
<strong>2010</strong>/Q4<br />
1. Large plants are hydro plants of 10,000 Kw or more of installed capacity (name plate ratings)<br />
2. If any plant is leased, operated under a license from the Federal Energy Regulatory Commission, or operated as a joint facility, indicate such facts in<br />
a footnote. If licensed project, give project number.<br />
3. If net peak dem<strong>and</strong> for 60 minutes is not available, give that which is available specifying period.<br />
4. If a group of employees attends more than one generating plant, report on line 11 the approximate average number of employees assignable to each<br />
plant.<br />
Line<br />
No.<br />
Item<br />
(a)<br />
<strong>FERC</strong> Licensed Project No.<br />
Plant Name: BALCH NO. 1<br />
(b)<br />
175<br />
<strong>FERC</strong> Licensed Project No.<br />
Plant Name: BALCH NO. 2<br />
(c)<br />
175<br />
1 Kind of Plant (Run-of-River or Storage)<br />
R of R/Storage R of R/Storage<br />
2 Plant Construction type (Conventional or Outdoor)<br />
Conventional Outdoor<br />
3 Year Originally Constructed<br />
1927 1958<br />
4 Year Last Unit was Installed<br />
1927 1958<br />
5 Total installed cap (Gen name plate Rating in MW)<br />
31.00 97.20<br />
6 Net Peak Dem<strong>and</strong> on Plant-Megawatts (60 minutes)<br />
34 105<br />
7 Plant Hours Connect to Load<br />
7,250 8,754<br />
8 Net Plant Capability (in megawatts)<br />
9 (a) Under Most Favorable Oper Conditions<br />
34 105<br />
10 (b) Under the Most Adverse Oper Conditions<br />
34 104<br />
11 Average Number of Employees<br />
0 0<br />
12 Net Generation, Exclusive of Plant Use - Kwh<br />
144,643,669 559,392,475<br />
13 Cost of Plant<br />
14 L<strong>and</strong> <strong>and</strong> L<strong>and</strong> Rights<br />
7,714 1,112<br />
15 Structures <strong>and</strong> Improvements<br />
0 2,897,151<br />
16 Reservoirs, Dams, <strong>and</strong> Waterways<br />
9,683,062 5,321,106<br />
17 Equipment Costs<br />
6,956,037 13,747,748<br />
18 Roads, Railroads, <strong>and</strong> Bridges<br />
623,794 0<br />
19 Asset Retirement Costs<br />
0 0<br />
20 TOTAL cost (Total of 14 thru 19)<br />
17,270,607 21,967,117<br />
21 Cost per KW of Installed Capacity (line 20 / 5)<br />
557.1164 225.9991<br />
22 Production Expenses<br />
23 Operation Supervision <strong>and</strong> Engineering<br />
0 0<br />
24 Water for Power<br />
13,819 78,255<br />
25 Hydraulic Expenses<br />
21,841 68,021<br />
26 <strong>Electric</strong> Expenses<br />
123,546 265,060<br />
27 Misc Hydraulic Power Generation Expenses<br />
172,597 533,023<br />
28 Rents<br />
19,274 59,523<br />
29 Maintenance Supervision <strong>and</strong> Engineering<br />
0 0<br />
30 Maintenance of Structures<br />
150,428 467,077<br />
31 Maintenance of Reservoirs, Dams, <strong>and</strong> Waterways<br />
119,311 248,295<br />
32 Maintenance of <strong>Electric</strong> Plant<br />
797,545 614,602<br />
33 Maintenance of Misc Hydraulic Plant<br />
158,259 141,700<br />
34 Total Production Expenses (total 23 thru 33)<br />
1,576,620 2,475,556<br />
35 Expenses per net KWh<br />
0.0109 0.0044
<strong>FERC</strong> FORM NO. 1 (REV. 12-03) Page 406.1<br />
Name of Respondent<br />
This Report Is:<br />
Date of Report<br />
(1) X An Original<br />
(Mo, Da, Yr)<br />
PACIFIC GAS AND ELECTRIC COMPANY<br />
(2) A Resubmission<br />
04/08/2011<br />
HYDROELECTRIC GENERATING PLANT STATISTICS (Large Plants)<br />
Year/Period of Report<br />
End of<br />
<strong>2010</strong>/Q4<br />
1. Large plants are hydro plants of 10,000 Kw or more of installed capacity (name plate ratings)<br />
2. If any plant is leased, operated under a license from the Federal Energy Regulatory Commission, or operated as a joint facility, indicate such facts in<br />
a footnote. If licensed project, give project number.<br />
3. If net peak dem<strong>and</strong> for 60 minutes is not available, give that which is available specifying period.<br />
4. If a group of employees attends more than one generating plant, report on line 11 the approximate average number of employees assignable to each<br />
plant.<br />
Line<br />
No.<br />
Item<br />
(a)<br />
<strong>FERC</strong> Licensed Project No.<br />
Plant Name: BUTT VALLEY<br />
(b)<br />
2105<br />
<strong>FERC</strong> Licensed Project No. 2105<br />
Plant Name: CARIBOU NO. 1<br />
(c)<br />
1 Kind of Plant (Run-of-River or Storage)<br />
R of R/Storage R of R/Storage<br />
2 Plant Construction type (Conventional or Outdoor)<br />
Outdoor Conventional<br />
3 Year Originally Constructed<br />
1958 1921<br />
4 Year Last Unit was Installed<br />
1958 1924<br />
5 Total installed cap (Gen name plate Rating in MW)<br />
40.00 73.85<br />
6 Net Peak Dem<strong>and</strong> on Plant-Megawatts (60 minutes)<br />
41 75<br />
7 Plant Hours Connect to Load<br />
6,530 7,901<br />
8 Net Plant Capability (in megawatts)<br />
9 (a) Under Most Favorable Oper Conditions<br />
41 75<br />
10 (b) Under the Most Adverse Oper Conditions<br />
38 74<br />
11 Average Number of Employees<br />
0 6<br />
12 Net Generation, Exclusive of Plant Use - Kwh<br />
116,480,191 99,181,363<br />
13 Cost of Plant<br />
14 L<strong>and</strong> <strong>and</strong> L<strong>and</strong> Rights<br />
502,332 346,421<br />
15 Structures <strong>and</strong> Improvements<br />
1,274,550 3,787,151<br />
16 Reservoirs, Dams, <strong>and</strong> Waterways<br />
37,442,234 27,109,412<br />
17 Equipment Costs<br />
15,179,906 14,679,294<br />
18 Roads, Railroads, <strong>and</strong> Bridges<br />
601,748 346,067<br />
19 Asset Retirement Costs<br />
0 0<br />
20 TOTAL cost (Total of 14 thru 19)<br />
55,000,770 46,268,345<br />
21 Cost per KW of Installed Capacity (line 20 / 5)<br />
1,375.0193 626.5179<br />
22 Production Expenses<br />
23 Operation Supervision <strong>and</strong> Engineering<br />
0 0<br />
24 Water for Power<br />
36,244 66,436<br />
25 Hydraulic Expenses<br />
11,408 19,509<br />
26 <strong>Electric</strong> Expenses<br />
131,247 1,047,458<br />
27 Misc Hydraulic Power Generation Expenses<br />
224,949 409,385<br />
28 Rents<br />
8,168 15,307<br />
29 Maintenance Supervision <strong>and</strong> Engineering<br />
0 0<br />
30 Maintenance of Structures<br />
22,894 97,348<br />
31 Maintenance of Reservoirs, Dams, <strong>and</strong> Waterways<br />
193,686 208,539<br />
32 Maintenance of <strong>Electric</strong> Plant<br />
169,641 704,960<br />
33 Maintenance of Misc Hydraulic Plant<br />
134,012 223,657<br />
34 Total Production Expenses (total 23 thru 33)<br />
932,249 2,792,599<br />
35 Expenses per net KWh<br />
0.0080 0.0282
<strong>FERC</strong> FORM NO. 1 (REV. 12-03) Page 406.2<br />
Name of Respondent<br />
This Report Is:<br />
Date of Report<br />
(1) X An Original<br />
(Mo, Da, Yr)<br />
PACIFIC GAS AND ELECTRIC COMPANY<br />
(2) A Resubmission<br />
04/08/2011<br />
HYDROELECTRIC GENERATING PLANT STATISTICS (Large Plants)<br />
Year/Period of Report<br />
End of<br />
<strong>2010</strong>/Q4<br />
1. Large plants are hydro plants of 10,000 Kw or more of installed capacity (name plate ratings)<br />
2. If any plant is leased, operated under a license from the Federal Energy Regulatory Commission, or operated as a joint facility, indicate such facts in<br />
a footnote. If licensed project, give project number.<br />
3. If net peak dem<strong>and</strong> for 60 minutes is not available, give that which is available specifying period.<br />
4. If a group of employees attends more than one generating plant, report on line 11 the approximate average number of employees assignable to each<br />
plant.<br />
Line<br />
No.<br />
Item<br />
(a)<br />
<strong>FERC</strong> Licensed Project No.<br />
Plant Name: DE SABLA<br />
(b)<br />
803<br />
<strong>FERC</strong> Licensed Project No.<br />
Plant Name: DRUM NO. 1<br />
(c)<br />
2310<br />
1 Kind of Plant (Run-of-River or Storage)<br />
R of R/Storage R of R/Storage<br />
2 Plant Construction type (Conventional or Outdoor)<br />
Outdoor Conventional<br />
3 Year Originally Constructed<br />
1963 1913<br />
4 Year Last Unit was Installed<br />
1963 1928<br />
5 Total installed cap (Gen name plate Rating in MW)<br />
18.45 49.20<br />
6 Net Peak Dem<strong>and</strong> on Plant-Megawatts (60 minutes)<br />
19 54<br />
7 Plant Hours Connect to Load<br />
7,604 4,050<br />
8 Net Plant Capability (in megawatts)<br />
9 (a) Under Most Favorable Oper Conditions<br />
19 54<br />
10 (b) Under the Most Adverse Oper Conditions<br />
19 54<br />
11 Average Number of Employees<br />
0 6<br />
12 Net Generation, Exclusive of Plant Use - Kwh<br />
79,357,287 87,703,003<br />
13 Cost of Plant<br />
14 L<strong>and</strong> <strong>and</strong> L<strong>and</strong> Rights<br />
145,157 1,610,547<br />
15 Structures <strong>and</strong> Improvements<br />
2,267,852 2,507,598<br />
16 Reservoirs, Dams, <strong>and</strong> Waterways<br />
30,955,103 13,390,359<br />
17 Equipment Costs<br />
3,993,854 16,071,705<br />
18 Roads, Railroads, <strong>and</strong> Bridges<br />
2,271,774 1,022,736<br />
19 Asset Retirement Costs<br />
0 0<br />
20 TOTAL cost (Total of 14 thru 19)<br />
39,633,740 34,602,945<br />
21 Cost per KW of Installed Capacity (line 20 / 5)<br />
2,148.1702 703.3119<br />
22 Production Expenses<br />
23 Operation Supervision <strong>and</strong> Engineering<br />
0 0<br />
24 Water for Power<br />
15,368 81,387<br />
25 Hydraulic Expenses<br />
68,336 370,927<br />
26 <strong>Electric</strong> Expenses<br />
246,845 862,478<br />
27 Misc Hydraulic Power Generation Expenses<br />
222,769 569,964<br />
28 Rents<br />
13,872 70,205<br />
29 Maintenance Supervision <strong>and</strong> Engineering<br />
0 0<br />
30 Maintenance of Structures<br />
16,261 55,755<br />
31 Maintenance of Reservoirs, Dams, <strong>and</strong> Waterways<br />
744,590 676,369<br />
32 Maintenance of <strong>Electric</strong> Plant<br />
137,789 360,017<br />
33 Maintenance of Misc Hydraulic Plant<br />
155,644 165,393<br />
34 Total Production Expenses (total 23 thru 33)<br />
1,621,474 3,212,495<br />
35 Expenses per net KWh<br />
0.0204 0.0366
<strong>FERC</strong> FORM NO. 1 (REV. 12-03) Page 406.3<br />
Name of Respondent<br />
This Report Is:<br />
Date of Report<br />
(1) X An Original<br />
(Mo, Da, Yr)<br />
PACIFIC GAS AND ELECTRIC COMPANY<br />
(2) A Resubmission<br />
04/08/2011<br />
HYDROELECTRIC GENERATING PLANT STATISTICS (Large Plants)<br />
Year/Period of Report<br />
End of<br />
<strong>2010</strong>/Q4<br />
1. Large plants are hydro plants of 10,000 Kw or more of installed capacity (name plate ratings)<br />
2. If any plant is leased, operated under a license from the Federal Energy Regulatory Commission, or operated as a joint facility, indicate such facts in<br />
a footnote. If licensed project, give project number.<br />
3. If net peak dem<strong>and</strong> for 60 minutes is not available, give that which is available specifying period.<br />
4. If a group of employees attends more than one generating plant, report on line 11 the approximate average number of employees assignable to each<br />
plant.<br />
Line<br />
No.<br />
Item<br />
(a)<br />
<strong>FERC</strong> Licensed Project No.<br />
Plant Name: HAAS<br />
(b)<br />
1988<br />
<strong>FERC</strong> Licensed Project No.<br />
Plant Name: HALSEY<br />
(c)<br />
2130<br />
1 Kind of Plant (Run-of-River or Storage)<br />
R of R/Storage R of R/Storage<br />
2 Plant Construction type (Conventional or Outdoor)<br />
Conventional Conventional<br />
3 Year Originally Constructed<br />
1958 1916<br />
4 Year Last Unit was Installed<br />
1958 1916<br />
5 Total installed cap (Gen name plate Rating in MW)<br />
135.00 13.60<br />
6 Net Peak Dem<strong>and</strong> on Plant-Megawatts (60 minutes)<br />
144 11<br />
7 Plant Hours Connect to Load<br />
8,659 7,879<br />
8 Net Plant Capability (in megawatts)<br />
9 (a) Under Most Favorable Oper Conditions<br />
144 11<br />
10 (b) Under the Most Adverse Oper Conditions<br />
138 11<br />
11 Average Number of Employees<br />
0 0<br />
12 Net Generation, Exclusive of Plant Use - Kwh<br />
624,935,810 56,480,683<br />
13 Cost of Plant<br />
14 L<strong>and</strong> <strong>and</strong> L<strong>and</strong> Rights<br />
29,498 885,301<br />
15 Structures <strong>and</strong> Improvements<br />
6,619,522 480,241<br />
16 Reservoirs, Dams, <strong>and</strong> Waterways<br />
28,440,696 12,308,042<br />
17 Equipment Costs<br />
17,319,835 4,355,434<br />
18 Roads, Railroads, <strong>and</strong> Bridges<br />
152,179 12,048<br />
19 Asset Retirement Costs<br />
0 0<br />
20 TOTAL cost (Total of 14 thru 19)<br />
52,561,730 18,041,066<br />
21 Cost per KW of Installed Capacity (line 20 / 5)<br />
389.3461 1,326.5490<br />
22 Production Expenses<br />
23 Operation Supervision <strong>and</strong> Engineering<br />
0 0<br />
24 Water for Power<br />
58,529 16,574<br />
25 Hydraulic Expenses<br />
96,845 206,157<br />
26 <strong>Electric</strong> Expenses<br />
348,973 223,888<br />
27 Misc Hydraulic Power Generation Expenses<br />
709,445 124,067<br />
28 Rents<br />
428,314 14,298<br />
29 Maintenance Supervision <strong>and</strong> Engineering<br />
0 0<br />
30 Maintenance of Structures<br />
142,073 64,531<br />
31 Maintenance of Reservoirs, Dams, <strong>and</strong> Waterways<br />
237,698 541,275<br />
32 Maintenance of <strong>Electric</strong> Plant<br />
527,641 155,724<br />
33 Maintenance of Misc Hydraulic Plant<br />
200,902 41,195<br />
34 Total Production Expenses (total 23 thru 33)<br />
2,750,420 1,387,709<br />
35 Expenses per net KWh<br />
0.0044 0.0246
<strong>FERC</strong> FORM NO. 1 (REV. 12-03) Page 406.4<br />
Name of Respondent<br />
This Report Is:<br />
Date of Report<br />
(1) X An Original<br />
(Mo, Da, Yr)<br />
PACIFIC GAS AND ELECTRIC COMPANY<br />
(2) A Resubmission<br />
04/08/2011<br />
HYDROELECTRIC GENERATING PLANT STATISTICS (Large Plants)<br />
Year/Period of Report<br />
End of<br />
<strong>2010</strong>/Q4<br />
1. Large plants are hydro plants of 10,000 Kw or more of installed capacity (name plate ratings)<br />
2. If any plant is leased, operated under a license from the Federal Energy Regulatory Commission, or operated as a joint facility, indicate such facts in<br />
a footnote. If licensed project, give project number.<br />
3. If net peak dem<strong>and</strong> for 60 minutes is not available, give that which is available specifying period.<br />
4. If a group of employees attends more than one generating plant, report on line 11 the approximate average number of employees assignable to each<br />
plant.<br />
Line<br />
No.<br />
Item<br />
(a)<br />
<strong>FERC</strong> Licensed Project No. 96<br />
Plant Name: KERCKHOFF NO. 2<br />
(b)<br />
<strong>FERC</strong> Licensed Project No. 1988<br />
Plant Name: KINGS RIVER<br />
(c)<br />
1 Kind of Plant (Run-of-River or Storage)<br />
R of R/Storage R of R/Storage<br />
2 Plant Construction type (Conventional or Outdoor)<br />
Underground Semi-Outdoor<br />
3 Year Originally Constructed<br />
1983 1962<br />
4 Year Last Unit was Installed<br />
1983 1962<br />
5 Total installed cap (Gen name plate Rating in MW)<br />
139.50 48.60<br />
6 Net Peak Dem<strong>and</strong> on Plant-Megawatts (60 minutes)<br />
155 52<br />
7 Plant Hours Connect to Load<br />
6,971 7,029<br />
8 Net Plant Capability (in megawatts)<br />
9 (a) Under Most Favorable Oper Conditions<br />
155 52<br />
10 (b) Under the Most Adverse Oper Conditions<br />
151 52<br />
11 Average Number of Employees<br />
0 0<br />
12 Net Generation, Exclusive of Plant Use - Kwh<br />
551,886,124 222,499,802<br />
13 Cost of Plant<br />
14 L<strong>and</strong> <strong>and</strong> L<strong>and</strong> Rights<br />
578,362 14,097<br />
15 Structures <strong>and</strong> Improvements<br />
37,879,761 1,957,755<br />
16 Reservoirs, Dams, <strong>and</strong> Waterways<br />
76,084,473 13,614,121<br />
17 Equipment Costs<br />
37,107,248 7,966,816<br />
18 Roads, Railroads, <strong>and</strong> Bridges<br />
7,535,859 40,813<br />
19 Asset Retirement Costs<br />
0 0<br />
20 TOTAL cost (Total of 14 thru 19)<br />
159,185,703 23,593,602<br />
21 Cost per KW of Installed Capacity (line 20 / 5)<br />
1,141.1162 485.4651<br />
22 Production Expenses<br />
23 Operation Supervision <strong>and</strong> Engineering<br />
0 0<br />
24 Water for Power<br />
388,328 56,713<br />
25 Hydraulic Expenses<br />
93,687 33,404<br />
26 <strong>Electric</strong> Expenses<br />
339,497 147,254<br />
27 Misc Hydraulic Power Generation Expenses<br />
749,171 256,184<br />
28 Rents<br />
57,980 154,665<br />
29 Maintenance Supervision <strong>and</strong> Engineering<br />
0 0<br />
30 Maintenance of Structures<br />
82,356 27,564<br />
31 Maintenance of Reservoirs, Dams, <strong>and</strong> Waterways<br />
358,683 698,076<br />
32 Maintenance of <strong>Electric</strong> Plant<br />
836,148 278,061<br />
33 Maintenance of Misc Hydraulic Plant<br />
120,747 59,849<br />
34 Total Production Expenses (total 23 thru 33)<br />
3,026,597 1,711,770<br />
35 Expenses per net KWh<br />
0.0055 0.0077
<strong>FERC</strong> FORM NO. 1 (REV. 12-03) Page 406.5<br />
Name of Respondent<br />
This Report Is:<br />
Date of Report<br />
(1) X An Original<br />
(Mo, Da, Yr)<br />
PACIFIC GAS AND ELECTRIC COMPANY<br />
(2) A Resubmission<br />
04/08/2011<br />
HYDROELECTRIC GENERATING PLANT STATISTICS (Large Plants)<br />
Year/Period of Report<br />
End of<br />
<strong>2010</strong>/Q4<br />
1. Large plants are hydro plants of 10,000 Kw or more of installed capacity (name plate ratings)<br />
2. If any plant is leased, operated under a license from the Federal Energy Regulatory Commission, or operated as a joint facility, indicate such facts in<br />
a footnote. If licensed project, give project number.<br />
3. If net peak dem<strong>and</strong> for 60 minutes is not available, give that which is available specifying period.<br />
4. If a group of employees attends more than one generating plant, report on line 11 the approximate average number of employees assignable to each<br />
plant.<br />
Line<br />
No.<br />
Item<br />
(a)<br />
<strong>FERC</strong> Licensed Project No.<br />
Plant Name: PIT NO. 3<br />
(b)<br />
233<br />
<strong>FERC</strong> Licensed Project No.<br />
Plant Name: PIT NO. 4<br />
(c)<br />
233<br />
1 Kind of Plant (Run-of-River or Storage)<br />
R of R/Storage R of R/Storage<br />
2 Plant Construction type (Conventional or Outdoor)<br />
Conventional Conventional<br />
3 Year Originally Constructed<br />
1925 1955<br />
4 Year Last Unit was Installed<br />
1925 1955<br />
5 Total installed cap (Gen name plate Rating in MW)<br />
80.19 103.50<br />
6 Net Peak Dem<strong>and</strong> on Plant-Megawatts (60 minutes)<br />
70 95<br />
7 Plant Hours Connect to Load<br />
8,689 8,757<br />
8 Net Plant Capability (in megawatts)<br />
9 (a) Under Most Favorable Oper Conditions<br />
70 95<br />
10 (b) Under the Most Adverse Oper Conditions<br />
70 95<br />
11 Average Number of Employees<br />
6 0<br />
12 Net Generation, Exclusive of Plant Use - Kwh<br />
283,586,734 407,561,527<br />
13 Cost of Plant<br />
14 L<strong>and</strong> <strong>and</strong> L<strong>and</strong> Rights<br />
3,625,208 291,717<br />
15 Structures <strong>and</strong> Improvements<br />
494,004 1,461,956<br />
16 Reservoirs, Dams, <strong>and</strong> Waterways<br />
50,024,273 40,501,467<br />
17 Equipment Costs<br />
9,169,331 16,320,270<br />
18 Roads, Railroads, <strong>and</strong> Bridges<br />
1,303,689 219,591<br />
19 Asset Retirement Costs<br />
0 0<br />
20 TOTAL cost (Total of 14 thru 19)<br />
64,616,505 58,795,001<br />
21 Cost per KW of Installed Capacity (line 20 / 5)<br />
805.7926 568.0676<br />
22 Production Expenses<br />
23 Operation Supervision <strong>and</strong> Engineering<br />
0 0<br />
24 Water for Power<br />
45,076 57,483<br />
25 Hydraulic Expenses<br />
9,190 12,477<br />
26 <strong>Electric</strong> Expenses<br />
1,201,216 156,067<br />
27 Misc Hydraulic Power Generation Expenses<br />
1,437,063 2,084,029<br />
28 Rents<br />
15,667 21,260<br />
29 Maintenance Supervision <strong>and</strong> Engineering<br />
0 0<br />
30 Maintenance of Structures<br />
39,015 131,283<br />
31 Maintenance of Reservoirs, Dams, <strong>and</strong> Waterways<br />
774,878 129,998<br />
32 Maintenance of <strong>Electric</strong> Plant<br />
478,380 528,179<br />
33 Maintenance of Misc Hydraulic Plant<br />
171,008 127,151<br />
34 Total Production Expenses (total 23 thru 33)<br />
4,171,493 3,247,927<br />
35 Expenses per net KWh<br />
0.0147 0.0080
<strong>FERC</strong> FORM NO. 1 (REV. 12-03) Page 406.6<br />
Name of Respondent<br />
This Report Is:<br />
Date of Report<br />
(1) X An Original<br />
(Mo, Da, Yr)<br />
PACIFIC GAS AND ELECTRIC COMPANY<br />
(2) A Resubmission<br />
04/08/2011<br />
HYDROELECTRIC GENERATING PLANT STATISTICS (Large Plants)<br />
Year/Period of Report<br />
End of<br />
<strong>2010</strong>/Q4<br />
1. Large plants are hydro plants of 10,000 Kw or more of installed capacity (name plate ratings)<br />
2. If any plant is leased, operated under a license from the Federal Energy Regulatory Commission, or operated as a joint facility, indicate such facts in<br />
a footnote. If licensed project, give project number.<br />
3. If net peak dem<strong>and</strong> for 60 minutes is not available, give that which is available specifying period.<br />
4. If a group of employees attends more than one generating plant, report on line 11 the approximate average number of employees assignable to each<br />
plant.<br />
Line<br />
No.<br />
Item<br />
(a)<br />
<strong>FERC</strong> Licensed Project No.<br />
Plant Name: POE<br />
(b)<br />
2107<br />
<strong>FERC</strong> Licensed Project No. 1962<br />
Plant Name: ROCK CREEK<br />
(c)<br />
1 Kind of Plant (Run-of-River or Storage)<br />
R of R/Storage R of R/Storage<br />
2 Plant Construction type (Conventional or Outdoor)<br />
Outdoor Conventional<br />
3 Year Originally Constructed<br />
1958 1950<br />
4 Year Last Unit was Installed<br />
1958 1950<br />
5 Total installed cap (Gen name plate Rating in MW)<br />
142.83 124.74<br />
6 Net Peak Dem<strong>and</strong> on Plant-Megawatts (60 minutes)<br />
120 112<br />
7 Plant Hours Connect to Load<br />
7,255 8,747<br />
8 Net Plant Capability (in megawatts)<br />
9 (a) Under Most Favorable Oper Conditions<br />
120 112<br />
10 (b) Under the Most Adverse Oper Conditions<br />
125 114<br />
11 Average Number of Employees<br />
0 6<br />
12 Net Generation, Exclusive of Plant Use - Kwh<br />
531,552,676 424,874,953<br />
13 Cost of Plant<br />
14 L<strong>and</strong> <strong>and</strong> L<strong>and</strong> Rights<br />
817,824 1,770,950<br />
15 Structures <strong>and</strong> Improvements<br />
2,138,275 3,668,080<br />
16 Reservoirs, Dams, <strong>and</strong> Waterways<br />
32,944,749 41,369,289<br />
17 Equipment Costs<br />
12,773,740 7,668,388<br />
18 Roads, Railroads, <strong>and</strong> Bridges<br />
1,146,684 353,339<br />
19 Asset Retirement Costs<br />
0 0<br />
20 TOTAL cost (Total of 14 thru 19)<br />
49,821,272 54,830,046<br />
21 Cost per KW of Installed Capacity (line 20 / 5)<br />
348.8152 439.5546<br />
22 Production Expenses<br />
23 Operation Supervision <strong>and</strong> Engineering<br />
0 0<br />
24 Water for Power<br />
106,290 99,212<br />
25 Hydraulic Expenses<br />
21,701 20,867<br />
26 <strong>Electric</strong> Expenses<br />
315,157 1,240,791<br />
27 Misc Hydraulic Power Generation Expenses<br />
665,528 1,314,824<br />
28 Rents<br />
45,364 31,520<br />
29 Maintenance Supervision <strong>and</strong> Engineering<br />
0 0<br />
30 Maintenance of Structures<br />
73,080 93,133<br />
31 Maintenance of Reservoirs, Dams, <strong>and</strong> Waterways<br />
832,048 382,779<br />
32 Maintenance of <strong>Electric</strong> Plant<br />
520,611 279,602<br />
33 Maintenance of Misc Hydraulic Plant<br />
115,918 67,819<br />
34 Total Production Expenses (total 23 thru 33)<br />
2,695,697 3,530,547<br />
35 Expenses per net KWh<br />
0.0051 0.0083
<strong>FERC</strong> FORM NO. 1 (REV. 12-03) Page 406.7<br />
Name of Respondent<br />
This Report Is:<br />
Date of Report<br />
(1) X An Original<br />
(Mo, Da, Yr)<br />
PACIFIC GAS AND ELECTRIC COMPANY<br />
(2) A Resubmission<br />
04/08/2011<br />
HYDROELECTRIC GENERATING PLANT STATISTICS (Large Plants)<br />
Year/Period of Report<br />
End of<br />
<strong>2010</strong>/Q4<br />
1. Large plants are hydro plants of 10,000 Kw or more of installed capacity (name plate ratings)<br />
2. If any plant is leased, operated under a license from the Federal Energy Regulatory Commission, or operated as a joint facility, indicate such facts in<br />
a footnote. If licensed project, give project number.<br />
3. If net peak dem<strong>and</strong> for 60 minutes is not available, give that which is available specifying period.<br />
4. If a group of employees attends more than one generating plant, report on line 11 the approximate average number of employees assignable to each<br />
plant.<br />
Line<br />
No.<br />
Item<br />
(a)<br />
<strong>FERC</strong> Licensed Project No.<br />
Plant Name: WEST POINT<br />
(b)<br />
137<br />
<strong>FERC</strong> Licensed Project No.<br />
Plant Name: WISE NO. 1<br />
(c)<br />
2310<br />
1 Kind of Plant (Run-of-River or Storage)<br />
R of R/Storage R of R/Storage<br />
2 Plant Construction type (Conventional or Outdoor)<br />
Conventional Conventional<br />
3 Year Originally Constructed<br />
1948 1917<br />
4 Year Last Unit was Installed<br />
1948 1917<br />
5 Total installed cap (Gen name plate Rating in MW)<br />
13.60 13.60<br />
6 Net Peak Dem<strong>and</strong> on Plant-Megawatts (60 minutes)<br />
15 14<br />
7 Plant Hours Connect to Load<br />
7,665 7,925<br />
8 Net Plant Capability (in megawatts)<br />
9 (a) Under Most Favorable Oper Conditions<br />
15 14<br />
10 (b) Under the Most Adverse Oper Conditions<br />
13 14<br />
11 Average Number of Employees<br />
0 6<br />
12 Net Generation, Exclusive of Plant Use - Kwh<br />
84,258,665 80,878,173<br />
13 Cost of Plant<br />
14 L<strong>and</strong> <strong>and</strong> L<strong>and</strong> Rights<br />
225,845 790,751<br />
15 Structures <strong>and</strong> Improvements<br />
644,927 560,125<br />
16 Reservoirs, Dams, <strong>and</strong> Waterways<br />
5,337,959 7,262,509<br />
17 Equipment Costs<br />
6,048,085 7,486,462<br />
18 Roads, Railroads, <strong>and</strong> Bridges<br />
142,056 32,563<br />
19 Asset Retirement Costs<br />
0 0<br />
20 TOTAL cost (Total of 14 thru 19)<br />
12,398,872 16,132,410<br />
21 Cost per KW of Installed Capacity (line 20 / 5)<br />
911.6818 1,186.2066<br />
22 Production Expenses<br />
23 Operation Supervision <strong>and</strong> Engineering<br />
0 0<br />
24 Water for Power<br />
10,206 21,107<br />
25 Hydraulic Expenses<br />
29,520 262,023<br />
26 <strong>Electric</strong> Expenses<br />
164,360 720,175<br />
27 Misc Hydraulic Power Generation Expenses<br />
169,111 157,999<br />
28 Rents<br />
25,902 18,199<br />
29 Maintenance Supervision <strong>and</strong> Engineering<br />
0 0<br />
30 Maintenance of Structures<br />
23,089 14,812<br />
31 Maintenance of Reservoirs, Dams, <strong>and</strong> Waterways<br />
116,006 682,971<br />
32 Maintenance of <strong>Electric</strong> Plant<br />
167,581 161,418<br />
33 Maintenance of Misc Hydraulic Plant<br />
36,334 49,929<br />
34 Total Production Expenses (total 23 thru 33)<br />
742,109 2,088,633<br />
35 Expenses per net KWh<br />
0.0088 0.0258
<strong>FERC</strong> FORM NO. 1 (REV. 12-03) Page 406.8<br />
Name of Respondent<br />
This Report Is:<br />
Date of Report<br />
(1) X An Original<br />
(Mo, Da, Yr)<br />
PACIFIC GAS AND ELECTRIC COMPANY<br />
(2) A Resubmission<br />
04/08/2011<br />
HYDROELECTRIC GENERATING PLANT STATISTICS (Large Plants)<br />
Year/Period of Report<br />
End of<br />
<strong>2010</strong>/Q4<br />
1. Large plants are hydro plants of 10,000 Kw or more of installed capacity (name plate ratings)<br />
2. If any plant is leased, operated under a license from the Federal Energy Regulatory Commission, or operated as a joint facility, indicate such facts in<br />
a footnote. If licensed project, give project number.<br />
3. If net peak dem<strong>and</strong> for 60 minutes is not available, give that which is available specifying period.<br />
4. If a group of employees attends more than one generating plant, report on line 11 the approximate average number of employees assignable to each<br />
plant.<br />
Line<br />
No.<br />
Item<br />
(a)<br />
<strong>FERC</strong> Licensed Project No.<br />
Plant Name:<br />
(b)<br />
0<br />
<strong>FERC</strong> Licensed Project No.<br />
Plant Name:<br />
(c)<br />
0<br />
1 Kind of Plant (Run-of-River or Storage)<br />
2 Plant Construction type (Conventional or Outdoor)<br />
3 Year Originally Constructed<br />
4 Year Last Unit was Installed<br />
5 Total installed cap (Gen name plate Rating in MW)<br />
0.00 0.00<br />
6 Net Peak Dem<strong>and</strong> on Plant-Megawatts (60 minutes)<br />
0 0<br />
7 Plant Hours Connect to Load<br />
0 0<br />
8 Net Plant Capability (in megawatts)<br />
9 (a) Under Most Favorable Oper Conditions<br />
0 0<br />
10 (b) Under the Most Adverse Oper Conditions<br />
0 0<br />
11 Average Number of Employees<br />
0 0<br />
12 Net Generation, Exclusive of Plant Use - Kwh<br />
0 0<br />
13 Cost of Plant<br />
14 L<strong>and</strong> <strong>and</strong> L<strong>and</strong> Rights<br />
0 0<br />
15 Structures <strong>and</strong> Improvements<br />
0 0<br />
16 Reservoirs, Dams, <strong>and</strong> Waterways<br />
0 0<br />
17 Equipment Costs<br />
0 0<br />
18 Roads, Railroads, <strong>and</strong> Bridges<br />
0 0<br />
19 Asset Retirement Costs<br />
0 0<br />
20 TOTAL cost (Total of 14 thru 19)<br />
0 0<br />
21 Cost per KW of Installed Capacity (line 20 / 5)<br />
0.0000 0.0000<br />
22 Production Expenses<br />
23 Operation Supervision <strong>and</strong> Engineering<br />
0 0<br />
24 Water for Power<br />
0 0<br />
25 Hydraulic Expenses<br />
0 0<br />
26 <strong>Electric</strong> Expenses<br />
0 0<br />
27 Misc Hydraulic Power Generation Expenses<br />
0 0<br />
28 Rents<br />
0 0<br />
29 Maintenance Supervision <strong>and</strong> Engineering<br />
0 0<br />
30 Maintenance of Structures<br />
0 0<br />
31 Maintenance of Reservoirs, Dams, <strong>and</strong> Waterways<br />
0 0<br />
32 Maintenance of <strong>Electric</strong> Plant<br />
0 0<br />
33 Maintenance of Misc Hydraulic Plant<br />
0 0<br />
34 Total Production Expenses (total 23 thru 33)<br />
0 0<br />
35 Expenses per net KWh<br />
0.0000 0.0000
Name of Respondent<br />
This Report Is:<br />
Date of Report<br />
(1) X An Original<br />
(Mo, Da, Yr)<br />
PACIFIC GAS AND ELECTRIC COMPANY<br />
(2) A Resubmission<br />
04/08/2011<br />
HYDROELECTRIC GENERATING PLANT STATISTICS (Large Plants) (Continued)<br />
Year/Period of Report<br />
End of<br />
<strong>2010</strong>/Q4<br />
5. The items under Cost of Plant represent accounts or combinations of accounts prescribed by the Uniform System of Accounts. Production Expenses<br />
do not include Purchased Power, System control <strong>and</strong> Load Dispatching, <strong>and</strong> Other Expenses classified as "Other Power Supply Expenses."<br />
6. Report as a separate plant any plant equipped with combinations of steam, hydro, internal combustion engine, or gas turbine equipment.<br />
<strong>FERC</strong> Licensed Project No.<br />
Plant Name: BELDEN<br />
(d)<br />
2105<br />
<strong>FERC</strong> Licensed Project No. 2106<br />
Plant Name: JAMES B. BLACK<br />
(e)<br />
<strong>FERC</strong> Licensed Project No.<br />
Plant Name: BUCKS CREEK<br />
(f)<br />
619<br />
Line<br />
No.<br />
R of R/Storage R of R/Storage<br />
R of R/Storage 1<br />
Outdoor Outdoor<br />
Conventional 2<br />
1969 1965 1928 3<br />
1969 1966 1928 4<br />
117.90 168.66 66.00 5<br />
125 172 65 6<br />
5,304 8,737 8,726 7<br />
125 172 65 9<br />
125 172 53 10<br />
0 0 0 11<br />
250,131,428 714,469,248 213,295,615 12<br />
505,304 696,134 808,723 14<br />
1,041,275 496,741 540,730 15<br />
56,463,742 59,799,986 12,688,450 16<br />
8,125,567 17,302,669 17,937,927 17<br />
293,264 1,202,704 3,085,588 18<br />
0 0 0 19<br />
66,429,152 79,498,234 35,061,418 20<br />
563.4364 471.3520 531.2336 21<br />
0 0 0 23<br />
110,727 99,060 58,871 24<br />
29,205 26,229 16,685 25<br />
187,579 280,093 190,170 26<br />
681,484 826,421 477,930 27<br />
25,512 64,345 89,721 28<br />
0 0 0 29<br />
69,987 87,510 77,161 30<br />
366,130 432,556 366,226 31<br />
378,284 418,193 198,337 32<br />
85,886 133,419 60,263 33<br />
1,934,794 2,367,826 1,535,364 34<br />
0.0077 0.0033 0.0072 35<br />
8<br />
13<br />
22<br />
<strong>FERC</strong> FORM NO. 1 (REV. 12-03) Page 407
Name of Respondent<br />
This Report Is:<br />
Date of Report<br />
(1) X An Original<br />
(Mo, Da, Yr)<br />
PACIFIC GAS AND ELECTRIC COMPANY<br />
(2) A Resubmission<br />
04/08/2011<br />
HYDROELECTRIC GENERATING PLANT STATISTICS (Large Plants) (Continued)<br />
Year/Period of Report<br />
End of<br />
<strong>2010</strong>/Q4<br />
5. The items under Cost of Plant represent accounts or combinations of accounts prescribed by the Uniform System of Accounts. Production Expenses<br />
do not include Purchased Power, System control <strong>and</strong> Load Dispatching, <strong>and</strong> Other Expenses classified as "Other Power Supply Expenses."<br />
6. Report as a separate plant any plant equipped with combinations of steam, hydro, internal combustion engine, or gas turbine equipment.<br />
<strong>FERC</strong> Licensed Project No. 2105<br />
Plant Name: CARIBOU NO. 2<br />
(d)<br />
<strong>FERC</strong> Licensed Project No.<br />
Plant Name: COLEMAN<br />
(e)<br />
1121<br />
<strong>FERC</strong> Licensed Project No.<br />
Plant Name: CRESTA<br />
(f)<br />
1962<br />
Line<br />
No.<br />
R of R/Storage R of R/Storage<br />
R of R/Storage 1<br />
Outdoor Conventional<br />
Conventional 2<br />
1958 1979 1949 3<br />
1958 1979 1950 4<br />
117.90 12.15 73.80 5<br />
120 13 70 6<br />
8,746 6,037 8,752 7<br />
120 13 70 9<br />
119 5 72 10<br />
0 0 0 11<br />
357,167,432 33,013,629 290,319,746 12<br />
361,471 95,300 1,363,491 14<br />
2,860,788 783,922 1,745,519 15<br />
30,516,398 20,617,259 20,977,121 16<br />
16,228,530 7,973,325 10,459,151 17<br />
859 39,392 135,058 18<br />
0 0 0 19<br />
49,968,046 29,509,198 34,680,340 20<br />
423.8172 2,428.7406 469.9233 21<br />
0 0 0 23<br />
106,296 5,091 62,005 24<br />
25,277 65,446 15,129 25<br />
68,579 231,486 218,984 26<br />
654,165 89,744 823,268 27<br />
24,487 2,944 19,698 28<br />
0 0 0 29<br />
88,923 26,571 39,034 30<br />
286,144 409,619 398,499 31<br />
336,761 145,073 153,606 32<br />
76,330 81,673 43,234 33<br />
1,666,962 1,057,647 1,773,457 34<br />
0.0047 0.0320 0.0061 35<br />
8<br />
13<br />
22<br />
<strong>FERC</strong> FORM NO. 1 (REV. 12-03) Page 407.1
Name of Respondent<br />
This Report Is:<br />
Date of Report<br />
(1) X An Original<br />
(Mo, Da, Yr)<br />
PACIFIC GAS AND ELECTRIC COMPANY<br />
(2) A Resubmission<br />
04/08/2011<br />
HYDROELECTRIC GENERATING PLANT STATISTICS (Large Plants) (Continued)<br />
Year/Period of Report<br />
End of<br />
<strong>2010</strong>/Q4<br />
5. The items under Cost of Plant represent accounts or combinations of accounts prescribed by the Uniform System of Accounts. Production Expenses<br />
do not include Purchased Power, System control <strong>and</strong> Load Dispatching, <strong>and</strong> Other Expenses classified as "Other Power Supply Expenses."<br />
6. Report as a separate plant any plant equipped with combinations of steam, hydro, internal combustion engine, or gas turbine equipment.<br />
<strong>FERC</strong> Licensed Project No.<br />
Plant Name: DRUM NO. 2<br />
(d)<br />
2310<br />
<strong>FERC</strong> Licensed Project No.<br />
Plant Name: DUTCH FLAT<br />
(e)<br />
2310<br />
<strong>FERC</strong> Licensed Project No.<br />
Plant Name: ELECTRA<br />
(f)<br />
137<br />
Line<br />
No.<br />
R of R/Storage R of R/Storage<br />
R of R/Storage 1<br />
Outdoor Conventional<br />
Conventional 2<br />
1965 1943 1948 3<br />
1965 1943 1948 4<br />
53.10 22.00 102.50 5<br />
50 22 98 6<br />
7,859 7,186 8,684 7<br />
50 22 98 9<br />
49 23 98 10<br />
0 0 2 11<br />
301,210,656 89,882,103 462,305,028 12<br />
211,194 646,357 1,087,570 14<br />
177,574 600,113 1,210,947 15<br />
2,371,783 8,420,278 23,758,342 16<br />
950,946 8,707,362 14,769,808 17<br />
356,754 184,068 955,709 18<br />
0 0 0 19<br />
4,068,251 18,558,178 41,782,376 20<br />
76.6149 843.5535 407.6329 21<br />
0 0 0 23<br />
74,600 33,170 59,317 24<br />
339,895 151,171 193,305 25<br />
600,995 137,106 647,280 26<br />
522,445 232,313 1,106,406 27<br />
64,327 28,596 164,483 28<br />
0 0 0 29<br />
40,105 17,836 148,998 30<br />
605,763 281,953 716,385 31<br />
223,302 225,362 473,652 32<br />
151,293 67,717 217,920 33<br />
2,622,725 1,175,224 3,727,746 34<br />
0.0087 0.0131 0.0081 35<br />
8<br />
13<br />
22<br />
<strong>FERC</strong> FORM NO. 1 (REV. 12-03) Page 407.2
Name of Respondent<br />
This Report Is:<br />
Date of Report<br />
(1) X An Original<br />
(Mo, Da, Yr)<br />
PACIFIC GAS AND ELECTRIC COMPANY<br />
(2) A Resubmission<br />
04/08/2011<br />
HYDROELECTRIC GENERATING PLANT STATISTICS (Large Plants) (Continued)<br />
Year/Period of Report<br />
End of<br />
<strong>2010</strong>/Q4<br />
5. The items under Cost of Plant represent accounts or combinations of accounts prescribed by the Uniform System of Accounts. Production Expenses<br />
do not include Purchased Power, System control <strong>and</strong> Load Dispatching, <strong>and</strong> Other Expenses classified as "Other Power Supply Expenses."<br />
6. Report as a separate plant any plant equipped with combinations of steam, hydro, internal combustion engine, or gas turbine equipment.<br />
<strong>FERC</strong> Licensed Project No. 2661<br />
<strong>FERC</strong> Licensed Project No. 2661 <strong>FERC</strong> Licensed Project No. 96<br />
Plant Name: HAT CREEK NO. 1 Plant Name: HAT CREEK NO. 2<br />
Plant Name: KERCKHOFF NO. 1<br />
(d)<br />
(e)<br />
(f)<br />
Line<br />
No.<br />
R of R/Storage R of R/Storage<br />
R of R/Storage 1<br />
Conventional Conventional<br />
Conventional 2<br />
1921 1921 1920 3<br />
1921 1921 1920 4<br />
10.00 10.00 34.08 5<br />
9 9 38 6<br />
8,663 8,059 2,742 7<br />
9 9 38 9<br />
4 9 0 10<br />
0 0 0 11<br />
29,339,370 37,604,662 39,111,072 12<br />
574,530 917,321 5,889 14<br />
230,364 294,998 563,583 15<br />
1,055,959 937,936 3,191,256 16<br />
1,610,621 2,707,706 4,720,970 17<br />
810,393 319,411 5,491 18<br />
0 0 0 19<br />
4,281,867 5,177,372 8,487,189 20<br />
428.1867 517.7372 249.0372 21<br />
0 0 0 23<br />
3,099 3,099 59,142 24<br />
19,088 2,135 22,770 25<br />
99,054 98,822 160,941 26<br />
181,541 181,541 184,696 27<br />
349 348 14,215 28<br />
0 0 0 29<br />
8,871 4,179 21,863 30<br />
30,930 45,690 124,553 31<br />
74,982 159,122 245,766 32<br />
24,696 27,302 73,279 33<br />
442,610 522,238 907,225 34<br />
0.0151 0.0139 0.0232 35<br />
8<br />
13<br />
22<br />
<strong>FERC</strong> FORM NO. 1 (REV. 12-03) Page 407.3
Name of Respondent<br />
This Report Is:<br />
Date of Report<br />
(1) X An Original<br />
(Mo, Da, Yr)<br />
PACIFIC GAS AND ELECTRIC COMPANY<br />
(2) A Resubmission<br />
04/08/2011<br />
HYDROELECTRIC GENERATING PLANT STATISTICS (Large Plants) (Continued)<br />
Year/Period of Report<br />
End of<br />
<strong>2010</strong>/Q4<br />
5. The items under Cost of Plant represent accounts or combinations of accounts prescribed by the Uniform System of Accounts. Production Expenses<br />
do not include Purchased Power, System control <strong>and</strong> Load Dispatching, <strong>and</strong> Other Expenses classified as "Other Power Supply Expenses."<br />
6. Report as a separate plant any plant equipped with combinations of steam, hydro, internal combustion engine, or gas turbine equipment.<br />
<strong>FERC</strong> Licensed Project No.<br />
Plant Name: NARROWS<br />
(d)<br />
1403<br />
<strong>FERC</strong> Licensed Project No.<br />
Plant Name: NEWCASTLE<br />
(e)<br />
2310<br />
<strong>FERC</strong> Licensed Project No.<br />
Plant Name: PIT NO.1<br />
(f)<br />
2687<br />
Line<br />
No.<br />
R of R/Storage R of R/Storage<br />
R of R/Storage 1<br />
Conventional Conventional<br />
Conventional 2<br />
1942 1986 1922 3<br />
1942 1986 1922 4<br />
10.20 12.70 69.30 5<br />
12 12 61 6<br />
5,803 5,885 8,632 7<br />
12 12 61 9<br />
12 0 61 10<br />
0 0 0 11<br />
55,947,199 32,339,948 218,921,215 12<br />
274,030 3,872,962 1,574,231 14<br />
517,867 4,035,049 2,237,360 15<br />
543,619 43,805,028 9,124,090 16<br />
3,783,915 6,743,087 19,599,250 17<br />
506,629 2,622,426 1,512,115 18<br />
0 0 0 19<br />
5,626,060 61,078,552 34,047,046 20<br />
551.5745 4,809.3348 491.2994 21<br />
0 0 0 23<br />
128,623 17,327 131,391 24<br />
16,515 215,750 8,009 25<br />
201,841 246,340 290,370 26<br />
282,985 129,721 982,331 27<br />
172 14,941 305 28<br />
0 0 0 29<br />
4,568 9,321 34,207 30<br />
275,815 598,116 726,069 31<br />
177,664 160,337 238,230 32<br />
26,361 53,316 87,812 33<br />
1,114,544 1,445,169 2,498,724 34<br />
0.0199 0.0447 0.0114 35<br />
8<br />
13<br />
22<br />
<strong>FERC</strong> FORM NO. 1 (REV. 12-03) Page 407.4
Name of Respondent<br />
This Report Is:<br />
Date of Report<br />
(1) X An Original<br />
(Mo, Da, Yr)<br />
PACIFIC GAS AND ELECTRIC COMPANY<br />
(2) A Resubmission<br />
04/08/2011<br />
HYDROELECTRIC GENERATING PLANT STATISTICS (Large Plants) (Continued)<br />
Year/Period of Report<br />
End of<br />
<strong>2010</strong>/Q4<br />
5. The items under Cost of Plant represent accounts or combinations of accounts prescribed by the Uniform System of Accounts. Production Expenses<br />
do not include Purchased Power, System control <strong>and</strong> Load Dispatching, <strong>and</strong> Other Expenses classified as "Other Power Supply Expenses."<br />
6. Report as a separate plant any plant equipped with combinations of steam, hydro, internal combustion engine, or gas turbine equipment.<br />
<strong>FERC</strong> Licensed Project No. 233<br />
<strong>FERC</strong> Licensed Project No. 2106 <strong>FERC</strong> Licensed Project No.<br />
Plant Name: PIT NO. 5 Plant Name: PIT NO. 6<br />
Plant Name: PIT NO. 7<br />
(d)<br />
(e)<br />
(f)<br />
2106<br />
Line<br />
No.<br />
R of R/Storage R of R/Storage<br />
R of R/Storage 1<br />
Conventional Outdoor<br />
Outdoor 2<br />
1944 1965 1965 3<br />
1944 1965 1965 4<br />
141.84 79.20 109.80 5<br />
160 80 112 6<br />
8,758 8,751 8,755 7<br />
160 80 112 9<br />
160 80 112 10<br />
6 0 0 11<br />
713,132,508 344,962,398 483,570,511 12<br />
484,269 274,798 315,356 14<br />
3,833,398 2,899,716 2,207,649 15<br />
43,641,746 17,313,851 22,334,105 16<br />
34,484,315 7,758,927 7,876,849 17<br />
1,382,508 690,250 409,930 18<br />
0 0 0 19<br />
83,826,236 28,937,542 33,143,889 20<br />
590.9915 365.3730 301.8569 21<br />
0 0 0 23<br />
58,316 46,080 64,503 24<br />
33,428 11,083 14,711 25<br />
1,215,476 239,339 211,065 26<br />
3,154,785 391,725 614,412 27<br />
35,808 29,932 41,903 28<br />
0 0 0 29<br />
85,315 40,692 61,254 30<br />
249,890 253,403 249,566 31<br />
516,010 359,065 420,531 32<br />
260,142 99,523 110,589 33<br />
5,609,170 1,470,842 1,788,534 34<br />
0.0079 0.0043 0.0037 35<br />
8<br />
13<br />
22<br />
<strong>FERC</strong> FORM NO. 1 (REV. 12-03) Page 407.5
Name of Respondent<br />
This Report Is:<br />
Date of Report<br />
(1) X An Original<br />
(Mo, Da, Yr)<br />
PACIFIC GAS AND ELECTRIC COMPANY<br />
(2) A Resubmission<br />
04/08/2011<br />
HYDROELECTRIC GENERATING PLANT STATISTICS (Large Plants) (Continued)<br />
Year/Period of Report<br />
End of<br />
<strong>2010</strong>/Q4<br />
5. The items under Cost of Plant represent accounts or combinations of accounts prescribed by the Uniform System of Accounts. Production Expenses<br />
do not include Purchased Power, System control <strong>and</strong> Load Dispatching, <strong>and</strong> Other Expenses classified as "Other Power Supply Expenses."<br />
6. Report as a separate plant any plant equipped with combinations of steam, hydro, internal combustion engine, or gas turbine equipment.<br />
<strong>FERC</strong> Licensed Project No. 137<br />
Plant Name: SALT SPRINGS<br />
(d)<br />
<strong>FERC</strong> Licensed Project No.<br />
Plant Name: STANISLAUS<br />
(e)<br />
2130<br />
<strong>FERC</strong> Licensed Project No.<br />
Plant Name: TIGER CREEK<br />
(f)<br />
137<br />
Line<br />
No.<br />
R of R/Storage R of R/Storage<br />
R of R/Storage 1<br />
Conventional Outdoor<br />
Conventional 2<br />
1931 1963 1931 3<br />
1953 1963 1931 4<br />
42.03 81.90 52.28 5<br />
44 91 58 6<br />
7,318 8,088 7,508 7<br />
44 91 58 9<br />
34 91 58 10<br />
2 0 6 11<br />
160,340,105 376,422,703 253,410,424 12<br />
380,765 324,009 3,995,759 14<br />
1,043,319 1,124,864 4,785,743 15<br />
29,507,616 16,552,984 39,485,461 16<br />
7,830,727 12,117,585 14,118,865 17<br />
1,033,091 916,372 2,730,509 18<br />
0 0 0 19<br />
39,795,518 31,035,814 65,116,337 20<br />
946.8360 378.9477 1,245.5305 21<br />
0 0 0 23<br />
30,973 391,165 40,826 24<br />
91,612 145,473 263,557 25<br />
405,333 588,346 575,787 26<br />
517,877 1,778,457 680,996 27<br />
78,676 94,862 103,684 28<br />
0 0 0 29<br />
41,052 98,689 154,282 30<br />
313,543 597,293 571,993 31<br />
489,413 652,569 312,428 32<br />
117,109 345,598 164,077 33<br />
2,085,588 4,692,452 2,867,630 34<br />
0.0130 0.0125 0.0113 35<br />
8<br />
13<br />
22<br />
<strong>FERC</strong> FORM NO. 1 (REV. 12-03) Page 407.6
Name of Respondent<br />
This Report Is:<br />
Date of Report<br />
(1) X An Original<br />
(Mo, Da, Yr)<br />
PACIFIC GAS AND ELECTRIC COMPANY<br />
(2) A Resubmission<br />
04/08/2011<br />
HYDROELECTRIC GENERATING PLANT STATISTICS (Large Plants) (Continued)<br />
Year/Period of Report<br />
End of<br />
<strong>2010</strong>/Q4<br />
5. The items under Cost of Plant represent accounts or combinations of accounts prescribed by the Uniform System of Accounts. Production Expenses<br />
do not include Purchased Power, System control <strong>and</strong> Load Dispatching, <strong>and</strong> Other Expenses classified as "Other Power Supply Expenses."<br />
6. Report as a separate plant any plant equipped with combinations of steam, hydro, internal combustion engine, or gas turbine equipment.<br />
<strong>FERC</strong> Licensed Project No.<br />
Plant Name: A.G. WISHON<br />
(d)<br />
1354<br />
<strong>FERC</strong> Licensed Project No.<br />
Plant Name:<br />
(e)<br />
0<br />
<strong>FERC</strong> Licensed Project No.<br />
Plant Name:<br />
(f)<br />
0<br />
Line<br />
No.<br />
R of R/Storage 1<br />
Conventional 2<br />
1910 3<br />
1910 4<br />
12.80 0.00 0.00 5<br />
20 0 0 6<br />
7,445 0 0 7<br />
20 0 0 9<br />
12 0 0 10<br />
0 0 0 11<br />
89,862,517 0 0 12<br />
938,599 0 0 14<br />
77,869 0 0 15<br />
6,488,242 0 0 16<br />
3,086,424 0 0 17<br />
29,364 0 0 18<br />
0 0 0 19<br />
10,620,498 0 0 20<br />
829.7264 0.0000 0.0000 21<br />
0 0 0 23<br />
30,538 0 0 24<br />
11,984 0 0 25<br />
146,353 0 0 26<br />
419,262 0 0 27<br />
97,260 0 0 28<br />
0 0 0 29<br />
14,053 0 0 30<br />
180,630 0 0 31<br />
363,865 0 0 32<br />
18,385 0 0 33<br />
1,282,330 0 0 34<br />
0.0143 0.0000 0.0000 35<br />
8<br />
13<br />
22<br />
<strong>FERC</strong> FORM NO. 1 (REV. 12-03) Page 407.7
Name of Respondent<br />
This Report Is:<br />
Date of Report<br />
(1) X An Original<br />
(Mo, Da, Yr)<br />
PACIFIC GAS AND ELECTRIC COMPANY<br />
(2) A Resubmission<br />
04/08/2011<br />
HYDROELECTRIC GENERATING PLANT STATISTICS (Large Plants) (Continued)<br />
Year/Period of Report<br />
End of<br />
<strong>2010</strong>/Q4<br />
5. The items under Cost of Plant represent accounts or combinations of accounts prescribed by the Uniform System of Accounts. Production Expenses<br />
do not include Purchased Power, System control <strong>and</strong> Load Dispatching, <strong>and</strong> Other Expenses classified as "Other Power Supply Expenses."<br />
6. Report as a separate plant any plant equipped with combinations of steam, hydro, internal combustion engine, or gas turbine equipment.<br />
<strong>FERC</strong> Licensed Project No.<br />
Plant Name:<br />
(d)<br />
0 <strong>FERC</strong> Licensed Project No. 0<br />
<strong>FERC</strong> Licensed Project No. 0<br />
Plant Name:<br />
Plant Name:<br />
(e)<br />
(f)<br />
Line<br />
No.<br />
1<br />
2<br />
3<br />
4<br />
0.00 0.00 0.00 5<br />
0 0 0 6<br />
0 0 0 7<br />
0 0 0 9<br />
0 0 0 10<br />
0 0 0 11<br />
0 0 0 12<br />
0 0 0 14<br />
0 0 0 15<br />
0 0 0 16<br />
0 0 0 17<br />
0 0 0 18<br />
0 0 0 19<br />
0 0 0 20<br />
0.0000 0.0000 0.0000 21<br />
0 0 0 23<br />
0 0 0 24<br />
0 0 0 25<br />
0 0 0 26<br />
0 0 0 27<br />
0 0 0 28<br />
0 0 0 29<br />
0 0 0 30<br />
0 0 0 31<br />
0 0 0 32<br />
0 0 0 33<br />
0 0 0 34<br />
0.0000 0.0000 0.0000 35<br />
8<br />
13<br />
22<br />
<strong>FERC</strong> FORM NO. 1 (REV. 12-03) Page 407.8
Name of Respondent<br />
PACIFIC GAS AND ELECTRIC COMPANY<br />
This Report is:<br />
(1) X An Original<br />
(2) A Resubmission<br />
Date of Report<br />
(Mo, Da, Yr)<br />
04/08/2011<br />
Year/Period of Report<br />
<strong>2010</strong>/Q4<br />
FOOTNOTE DATA<br />
Schedule Page: 406 Line No.: 11 Column: b<br />
Operated remotely from Fresno. Attended by 4 roving operators headquartered at Balch<br />
Camp.<br />
Schedule Page: 406 Line No.: 11 Column: c<br />
Operated remotely from Fresno. Attended by 4 roving operators headquartered at Balch<br />
Camp.<br />
Schedule Page: 406 Line No.: 11 Column: d<br />
Operated remotely from Caribou No. 1. Attended by 2 roving operators headquartered at<br />
Caribou No. 1.<br />
Schedule Page: 406 Line No.: 11 Column: e<br />
Operated remotely from Pit No. 5. Attended by 3 roving operators headquartered at Pit<br />
No. 5.<br />
Schedule Page: 406 Line No.: 11 Column: f<br />
Operated remotely from Rock Creek. Attended by 3 roving operators headquartered at Rock<br />
Creek.<br />
Schedule Page: 406.1 Line No.: 11 Column: b<br />
Operated remotely from Caribou No. 1. Attended by 2 roving operators headquartered at<br />
Caribou No. 1.<br />
Schedule Page: 406.1 Line No.: 11 Column: d<br />
Operated remotely from Caribou No. 1. Attended by 2 roving operators headquartered at<br />
Caribou No. 1.<br />
Schedule Page: 406.1 Line No.: 11 Column: e<br />
Attended by 4 roving operators headquartered at Manton.<br />
Schedule Page: 406.1 Line No.: 11 Column: f<br />
Operated remotely from Rock Creek. Attended by 3 roving operators headquartered at Rock<br />
Creek.<br />
Schedule Page: 406.2 Line No.: 3 Column: c<br />
Drum/Spalding Common includes the South Yuba Water System facilities which are common to<br />
Alta, Deer Creek, Drum No. 1, Drum No. 2, Dutch Flat, Halsey, Newcastle, Spaulding Nos. 1,<br />
2, <strong>and</strong> 3, <strong>and</strong> Wise plants <strong>and</strong> the Bear River Canal which is common to Halsey <strong>and</strong> Wise<br />
plants.<br />
Schedule Page: 406.2 Line No.: 3 Column: d<br />
Drum/Spalding Common includes the South Yuba Water System facilities which are common to<br />
Alta, Deer Creek, Drum No. 1, Drum No. 2, Dutch Flat, Halsey, Newcastle, Spaulding Nos. 1,<br />
2, <strong>and</strong> 3, <strong>and</strong> Wise plants <strong>and</strong> the Bear River Canal which is common to Halsey <strong>and</strong> Wise<br />
plants.<br />
Schedule Page: 406.2 Line No.: 3 Column: e<br />
Drum/Spalding Common includes the South Yuba Water System facilities which are common to<br />
Alta, Deer Creek, Drum No. 1, Drum No. 2, Dutch Flat, Halsey, Newcastle, Spaulding Nos. 1,<br />
2, <strong>and</strong> 3, <strong>and</strong> Wise plants <strong>and</strong> the Bear River Canal which is common to Halsey <strong>and</strong> Wise<br />
plants.<br />
Schedule Page: 406.2 Line No.: 3 Column: f<br />
Salt Springs includes large storage facilities used also for Tiger Creek, West Point, <strong>and</strong><br />
Electra plants.<br />
Schedule Page: 406.2 Line No.: 11 Column: b<br />
Attended by 2 roving operators headquartered at Camp 1.<br />
<strong>FERC</strong> FORM NO. 1 (ED. 12-87) Page 450.1
Name of Respondent<br />
PACIFIC GAS AND ELECTRIC COMPANY<br />
This Report is:<br />
(1) X An Original<br />
(2) A Resubmission<br />
Date of Report<br />
(Mo, Da, Yr)<br />
04/08/2011<br />
Year/Period of Report<br />
<strong>2010</strong>/Q4<br />
FOOTNOTE DATA<br />
Schedule Page: 406.2 Line No.: 11 Column: d<br />
Operated remotely from Drum No. 1. Attended by 3 relief operators headquartered at Drum<br />
No. 1.<br />
Schedule Page: 406.2 Line No.: 11 Column: e<br />
Operated remotely from Drum No. 1. Attended by 3 relief operators headquartered at Drum<br />
No. 1.<br />
Schedule Page: 406.3 Line No.: 3 Column: c<br />
Drum/Spalding Common includes the South Yuba Water System facilities which are common to<br />
Alta, Deer Creek, Drum No. 1, Drum No. 2, Dutch Flat, Halsey, Newcastle, Spaulding Nos. 1,<br />
2, <strong>and</strong> 3, <strong>and</strong> Wise plants <strong>and</strong> the Bear River Canal which is common to Halsey <strong>and</strong> Wise<br />
plants.<br />
Schedule Page: 406.3 Line No.: 3 Column: f<br />
Crane Valley includes storage facilities used also for Kerchoff No. 1 <strong>and</strong> No. 2, San<br />
Joaquin Nos. 1-A, 2, 3 <strong>and</strong> A.G. Wishon plants (Projects 1354 <strong>and</strong> 96).<br />
Schedule Page: 406.3 Line No.: 11 Column: b<br />
Operated remotely from Fresno. Attended by 4 roving operators headquartered at Balch<br />
Camp.<br />
Schedule Page: 406.3 Line No.: 11 Column: c<br />
Attended by 3 relief operators headquartered at Wise.<br />
Schedule Page: 406.3 Line No.: 11 Column: d<br />
Attended by 4 roving operators headquartered at Burney.<br />
Schedule Page: 406.3 Line No.: 11 Column: e<br />
Attended by 4 roving operators headquartered at Burney.<br />
Schedule Page: 406.3 Line No.: 11 Column: f<br />
Attended by 5 roving operators headquartered at A. G. Wishon.<br />
Schedule Page: 406.4 Line No.: 3 Column: b<br />
Crane Valley includes storage facilities used also for Kerchoff No. 1 <strong>and</strong> No. 2, San<br />
Joaquin Nos. 1-A, 2, 3, <strong>and</strong> A. G. Wishon plants (Projects 1354 <strong>and</strong> 96).<br />
Schedule Page: 406.4 Line No.: 3 Column: e<br />
Drum/Spalding Common includes the South Yuba Water System facilities which are common to<br />
Alta, Deer Creek, Drum No. 1, Drum No. 2, Dutch Flat, Halsey, Newcastle, Spaulding Nos. 1,<br />
2, <strong>and</strong> 3, <strong>and</strong> Wise plants <strong>and</strong> the Bear River Canal which is common to Halsey <strong>and</strong> Wise<br />
plants.<br />
Schedule Page: 406.4 Line No.: 11 Column: b<br />
Attended by 5 roving operators headquartered at A. G. Wishon.<br />
Schedule Page: 406.4 Line No.: 11 Column: c<br />
Operated remotely from Fresno. Attended by 4 roving operators headquartered at Balch Camp.<br />
Schedule Page: 406.4 Line No.: 11 Column: f<br />
Operated remotely from Pit No. 3. Attended by 4 roving operators headquartered at Burney.<br />
Schedule Page: 406.5 Line No.: 11 Column: c<br />
Operated remotely from Pit No. 3. Attended by 4 roving operators headquartered at Burney.<br />
Schedule Page: 406.5 Line No.: 11 Column: e<br />
Operated remotely from Pit No. 5. Attended by 3 roving operators headquartered at Pit No.<br />
5.<br />
Schedule Page: 406.5 Line No.: 11 Column: f<br />
Operated remotely from Pit No. 5. Attended by 3 roving operators headquartered at Pit No.<br />
5.<br />
Schedule Page: 406.6 Line No.: 3 Column: d<br />
Salt Springs includes large storage facilities used also for Tiger Creek, West Point, <strong>and</strong><br />
Electra plants.<br />
Schedule Page: 406.6 Line No.: 3 Column: e<br />
<strong>FERC</strong> FORM NO. 1 (ED. 12-87) Page 450.2
Name of Respondent<br />
PACIFIC GAS AND ELECTRIC COMPANY<br />
This Report is:<br />
(1) X An Original<br />
(2) A Resubmission<br />
Date of Report<br />
(Mo, Da, Yr)<br />
04/08/2011<br />
Year/Period of Report<br />
<strong>2010</strong>/Q4<br />
FOOTNOTE DATA<br />
Stanislaus Common includes hydraulic facilities common to Stanislaus <strong>and</strong> Spring Gap<br />
plants. Stanislaus-Spring Gap common is not a hydroelectric generating plant.<br />
Schedule Page: 406.6 Line No.: 3 Column: f<br />
Salt Springs includes large storage facilities used also for Tiger Creek, West Point, <strong>and</strong><br />
Electra plants.<br />
Schedule Page: 406.6 Line No.: 11 Column: b<br />
Operated remotely from Rock Creek. Attended by 3 roving operators headquartered at Rock<br />
Creek.<br />
Schedule Page: 406.6 Line No.: 11 Column: e<br />
Operated remotely from Tiger Creek Operating Center. Attended by 3 roving operators<br />
headquartered at Tiger Creek.<br />
Schedule Page: 406.7 Line No.: 3 Column: b<br />
Salt Springs includes large storage facilities used also for Tiger Creek, West Point, <strong>and</strong><br />
Electra plants.<br />
Schedule Page: 406.7 Line No.: 3 Column: c<br />
Drum/Spalding Common includes the South Yuba Water System facilities which are common to<br />
Alta, Deer Creek, Drum No. 1, Drum No. 2, Dutch Flat, Halsey, Newcastle, Spaulding Nos. 1,<br />
2, <strong>and</strong> 3, <strong>and</strong> Wise plants <strong>and</strong> the Bear River Canal which is common to Halsey <strong>and</strong> Wise<br />
plants.<br />
Schedule Page: 406.7 Line No.: 3 Column: d<br />
Crane Valley includes storage facilities used also for Kerchoff No. 1 <strong>and</strong> No. 2, San<br />
Joaquin Nos. 1-A, 2, 3, <strong>and</strong> A. G. Wishon plants (Projects 1354 <strong>and</strong> 96).<br />
Schedule Page: 406.7 Line No.: 11 Column: b<br />
Operated remotely from Tiger Creek Operating Center. Attended by 1 roving operator<br />
headquartered at Tiger Creek.<br />
Schedule Page: 406.7 Line No.: 11 Column: d<br />
Attended by 4 roving operators headquartered at Auberry.<br />
Schedule Page: 406.7 Line No.: 11 Column: e<br />
The average number of employees for each plant does not include headworks tenders,<br />
maintenance force, or headquarters support personnel.<br />
Schedule Page: 406.7 Line No.: 20 Column: e<br />
Investments in recreation <strong>and</strong> fish <strong>and</strong> wildlife facilities <strong>and</strong> FIN 47 were not included in<br />
the cost of plant reported in these pages.<br />
Schedule Page: 406.7 Line No.: 34 Column: e<br />
Total production expenses exclude those expenses for irrigation districts <strong>and</strong> other<br />
expenses that are not tied to any specific plants.<br />
<strong>FERC</strong> FORM NO. 1 (ED. 12-87) Page 450.3
Name of Respondent<br />
This Report Is:<br />
Date of Report<br />
Year/Period of Report<br />
(1) X An Original<br />
(Mo, Da, Yr)<br />
PACIFIC GAS AND ELECTRIC COMPANY<br />
(2) A Resubmission<br />
End of <strong>2010</strong>/Q4<br />
04/08/2011<br />
PUMPED STORAGE GENERATING PLANT STATISTICS (Large Plants)<br />
1. Large plants <strong>and</strong> pumped storage plants of 10,000 Kw or more of installed capacity (name plate ratings)<br />
2. If any plant is leased, operating under a license from the Federal Energy Regulatory Commission, or operated as a joint facility, indicate such facts in<br />
a footnote. Give project number.<br />
3. If net peak dem<strong>and</strong> for 60 minutes is not available, give the which is available, specifying period.<br />
4. If a group of employees attends more than one generating plant, report on line 8 the approximate average number of employees assignable to each<br />
plant.<br />
5. The items under Cost of Plant represent accounts or combinations of accounts prescribed by the Uniform System of Accounts. Production Expenses<br />
do not include Purchased Power System Control <strong>and</strong> Load Dispatching, <strong>and</strong> Other Expenses classified as "Other Power Supply Expenses."<br />
Line<br />
No.<br />
Item<br />
(a)<br />
<strong>FERC</strong> Licensed Project No.<br />
2735<br />
Plant Name: HELMS PUMPED STORAGE<br />
(b)<br />
1 Type of Plant Construction (Conventional or Outdoor) Underground<br />
2 Year Originally Constructed 1984<br />
3 Year Last Unit was Installed 1984<br />
4 Total installed cap (Gen name plate Rating in MW) 1,053<br />
5 Net Peak Demaind on Plant-Megawatts (60 minutes) 1,050<br />
6 Plant Hours Connect to Load While Generating 3,690<br />
7 Net Plant Capability (in megawatts) 1,212<br />
8 Average Number of Employees 8<br />
9 Generation, Exclusive of Plant Use - Kwh 583,877,767<br />
10 Energy Used for Pumping 899,141,292<br />
11 Net Output for Load (line 9 - line 10) - Kwh -315,263,525<br />
12 Cost of Plant<br />
13 L<strong>and</strong> <strong>and</strong> L<strong>and</strong> Rights 706,889<br />
14 Structures <strong>and</strong> Improvements 174,654,487<br />
15 Reservoirs, Dams, <strong>and</strong> Waterways 427,234,441<br />
16 Water Wheels, Turbines, <strong>and</strong> Generators 176,519,890<br />
17 Accessory <strong>Electric</strong> Equipment 49,541,385<br />
18 Miscellaneous Powerplant Equipment 16,374,377<br />
19 Roads, Railroads, <strong>and</strong> Bridges 8,792,089<br />
20 Asset Retirement Costs<br />
21 Total cost (total 13 thru 20) 853,823,558<br />
22 Cost per KW of installed cap (line 21 / 4) 810.8486<br />
23 Production Expenses<br />
24 Operation Supervision <strong>and</strong> Engineering<br />
25 Water for Power 416,016<br />
26 Pumped Storage Expenses 20,662<br />
27 <strong>Electric</strong> Expenses 1,823,023<br />
28 Misc Pumped Storage Power generation Expenses 2,613,210<br />
29 Rents 81,095<br />
30 Maintenance Supervision <strong>and</strong> Engineering<br />
31 Maintenance of Structures 746,070<br />
32 Maintenance of Reservoirs, Dams, <strong>and</strong> Waterways 594,026<br />
33 Maintenance of <strong>Electric</strong> Plant 3,399,456<br />
34 Maintenance of Misc Pumped Storage Plant 1,689,595<br />
35 Production Exp Before Pumping Exp (24 thru 34) 11,383,153<br />
36 Pumping Expenses<br />
37 Total Production Exp (total 35 <strong>and</strong> 36) 11,383,153<br />
38 Expenses per KWh (line 37 / 9) 0.0195<br />
<strong>FERC</strong> FORM NO. 1 (REV. 12-03) Page 408
Name of Respondent<br />
This Report Is:<br />
Date of Report<br />
(1) X An Original<br />
(Mo, Da, Yr)<br />
PACIFIC GAS AND ELECTRIC COMPANY<br />
(2) A Resubmission<br />
04/08/2011<br />
PUMPED STORAGE GENERATING PLANT STATISTICS (Large Plants) (Continued)<br />
Year/Period of Report<br />
End of<br />
<strong>2010</strong>/Q4<br />
6. Pumping energy (Line 10) is that energy measured as input to the plant for pumping purposes.<br />
7. Include on Line 36 the cost of energy used in pumping into the storage reservoir. When this item cannot be accurately computed leave Lines 36, 37<br />
<strong>and</strong> 38 blank <strong>and</strong> describe at the bottom of the schedule the company's principal sources of pumping power, the estimated amounts of energy from each<br />
station or other source that individually provides more than 10 percent of the total energy used for pumping, <strong>and</strong> production expenses per net MWH as<br />
reported herein for each source described. Group together stations <strong>and</strong> other resources which individually provide less than 10 percent of total pumping<br />
energy. If contracts are made with others to purchase power for pumping, give the supplier contract number, <strong>and</strong> date of contract.<br />
<strong>FERC</strong> Licensed Project No.<br />
Plant Name:<br />
(c)<br />
0 <strong>FERC</strong> Licensed Project No.<br />
0 <strong>FERC</strong> Licensed Project No.<br />
0<br />
Plant Name:<br />
Plant Name:<br />
(d)<br />
(e)<br />
Line<br />
No.<br />
1<br />
2<br />
3<br />
4<br />
5<br />
6<br />
7<br />
8<br />
9<br />
10<br />
11<br />
12<br />
13<br />
14<br />
15<br />
16<br />
17<br />
18<br />
19<br />
20<br />
21<br />
22<br />
23<br />
24<br />
25<br />
26<br />
27<br />
28<br />
29<br />
30<br />
31<br />
32<br />
33<br />
34<br />
35<br />
36<br />
37<br />
38<br />
<strong>FERC</strong> FORM NO. 1 (REV. 12-03) Page 409
Name of Respondent<br />
PACIFIC GAS AND ELECTRIC COMPANY<br />
This Report Is:<br />
Date of Report<br />
(1) X An Original<br />
(Mo, Da, Yr)<br />
(2) A Resubmission<br />
04/08/2011<br />
GENERATING PLANT STATISTICS (Small Plants)<br />
Year/Period of Report<br />
End of <strong>2010</strong>/Q4<br />
1. Small generating plants are steam plants of, less than 25,000 Kw; internal combustion <strong>and</strong> gas turbine-plants, conventional hydro plants <strong>and</strong> pumped<br />
storage plants of less than 10,000 Kw installed capacity (name plate rating). 2. Designate any plant leased from others, operated under a license from<br />
the Federal Energy Regulatory Commission, or operated as a joint facility, <strong>and</strong> give a concise statement of the facts in a footnote. If licensed project,<br />
give project number in footnote.<br />
Year Installed Capacity Net Peak<br />
Line<br />
Net Generation<br />
Name of Plant<br />
Orig. Name Plate Rating Dem<strong>and</strong><br />
Excluding Cost of Plant<br />
No.<br />
Const. (In MW)<br />
MW<br />
(60 min.)<br />
Plant Use<br />
(a)<br />
(b) (c)<br />
(d)<br />
(e)<br />
(f)<br />
1<br />
2<br />
3<br />
4<br />
5<br />
6<br />
7<br />
8<br />
9<br />
10<br />
11<br />
12<br />
13<br />
14<br />
15<br />
16<br />
17<br />
18<br />
19<br />
20<br />
21<br />
22<br />
23<br />
24<br />
25<br />
26<br />
27<br />
28<br />
29<br />
30<br />
31<br />
32<br />
33<br />
34<br />
35<br />
36<br />
37<br />
38<br />
39<br />
40<br />
41<br />
42<br />
43<br />
44<br />
45<br />
46<br />
SMALL HYDROELECTRIC PLANTS:<br />
Alta <strong>FERC</strong> No.2310<br />
Centerville <strong>FERC</strong> No.803<br />
Chili Bar <strong>FERC</strong> No.2155<br />
Coal Canyon<br />
Cow Creek <strong>FERC</strong> No.606<br />
Crane Valley <strong>FERC</strong> No.1354<br />
Deer Creek <strong>FERC</strong> No.2310<br />
Hamilton Branch<br />
Inskip <strong>FERC</strong> No.1121<br />
Kern Canyon <strong>FERC</strong> No. 178<br />
Kilarc <strong>FERC</strong> No.606<br />
Lime Saddle<br />
Merced Falls <strong>FERC</strong> No.2467<br />
Oak Flat <strong>FERC</strong> No.2105<br />
Phoenix <strong>FERC</strong> No.1061<br />
Potter Valley <strong>FERC</strong> No.77<br />
San Joaquin No. 1-A <strong>FERC</strong> No.1354<br />
San Joaquin No. 2 <strong>FERC</strong> No.1354<br />
San Joaquin No. 3 <strong>FERC</strong> No.1354<br />
South <strong>FERC</strong> No.1121<br />
Spaulding No. 1 <strong>FERC</strong> No.2310<br />
Spaulding No. 2 <strong>FERC</strong> No.2310<br />
Spaulding No. 3 <strong>FERC</strong> No.2310<br />
Spring Gap <strong>FERC</strong> No.2130<br />
Toadtown <strong>FERC</strong> No.803<br />
Tule <strong>FERC</strong> No.1333<br />
Volta No.1 <strong>FERC</strong> No.1121<br />
Volta No.2 <strong>FERC</strong> No.1121<br />
Wise II <strong>FERC</strong> No.2310<br />
Miscellaneous items<br />
PHOTO VOLTAIC GENERATING PLANTS:<br />
AT&T Park Solar Arrays<br />
SF Service Center Solar Arrays<br />
Vaca Dixon Solar Station<br />
INTERNAL COMBUSTION:<br />
(EMERGENCY STANDBY UNITS)<br />
Downieville Diesel Plant<br />
Grass Valley Mobile Diesel Generator<br />
Sierra City Mobile Diesel Generator<br />
TOTAL<br />
1902<br />
1904<br />
1965<br />
1907<br />
1907<br />
1919<br />
1908<br />
1921<br />
1979<br />
1921<br />
1904<br />
1906<br />
1930<br />
1985<br />
1940<br />
1910<br />
1919<br />
1917<br />
1923<br />
1979<br />
1928<br />
1928<br />
1929<br />
1921<br />
1986<br />
1914<br />
1980<br />
1981<br />
1986<br />
2007<br />
2007<br />
2009<br />
1966<br />
1971<br />
1972<br />
2.00 1.2 3,594 7,442,123<br />
6.40 6.4 8,809 13,999,804<br />
7.02 7.0 31,785 7,989,938<br />
1.00 0.9 -21 3,573,400<br />
1.44 1.8 1,232 2,988,764<br />
0.99 0.9 3,758 4,964,544<br />
5.50 5.7 16,966 45,430,442<br />
5.39 4.8 15,515 5,663,754<br />
7.65 8.0 44,608 13,883,922<br />
9.54 11.5 22,726 10,110,399<br />
3.00 2.0 16,819 4,083,357<br />
2.00 2.0 4,894 10,265,873<br />
3.44 3.5 12,483 4,082,870<br />
1.40 1.3 5,545 8,145,166<br />
1.60 2.0 10,078 10,555,385<br />
9.46 9.2 27,308 34,317,219<br />
0.42 0.4 1,886 3,436,241<br />
2.88 3.2 13,961 6,166,798<br />
4.00 4.2 18,652 6,847,104<br />
6.75 7.0 17,216 15,606,722<br />
7.04 7.0 35,122 7,926,022<br />
3.70 4.4 12,742 3,527,179<br />
6.61 5.8 32,375 7,217,734<br />
6.00 7.0 41,658 7,576,398<br />
1.80 1.5 5,328 6,057,416<br />
4.50 6.4 25,769 4,775,451<br />
8.55 9.0 41,742 14,074,292<br />
0.95 0.9 4,977 2,678,426<br />
2.87 3.1 6,663 12,154,452<br />
5,154,513<br />
0.11 0.1 146 1,990,928<br />
0.81 0.8 270 72,959<br />
2.00 2.0 4,189 10,569,186<br />
0.75 95,289<br />
0.25 38,497<br />
0.33 49,054<br />
128.15 131.0 488,795 303,511,618<br />
<strong>FERC</strong> FORM NO. 1 (REV. 12-03) Page 410
Name of Respondent<br />
This Report Is:<br />
Date of Report<br />
Year/Period of Report<br />
(1) X An Original<br />
(Mo, Da, Yr)<br />
PACIFIC GAS AND ELECTRIC COMPANY<br />
End of <strong>2010</strong>/Q4<br />
(2) A Resubmission<br />
04/08/2011<br />
GENERATING PLANT STATISTICS (Small Plants) (Continued)<br />
3. List plants appropriately under subheadings for steam, hydro, nuclear, internal combustion <strong>and</strong> gas turbine plants. For nuclear, see instruction 11,<br />
Page 403. 4. If net peak dem<strong>and</strong> for 60 minutes is not available, give the which is available, specifying period. 5. If any plant is equipped with<br />
combinations of steam, hydro internal combustion or gas turbine equipment, report each as a separate plant. However, if the exhaust heat from the gas<br />
turbine is utilized in a steam turbine regenerative feed water cycle, or for preheated combustion air in a boiler, report as one plant.<br />
Plant Cost (Incl Asset Operation<br />
Production Expenses<br />
Fuel Costs (in cents<br />
Line<br />
Retire. Costs) Per MW Exc'l. Fuel<br />
Fuel<br />
Maintenance<br />
Kind of Fuel (per Million Btu)<br />
No.<br />
(g) (h)<br />
(i)<br />
(j) (k) (l)<br />
1<br />
2,071 86,333<br />
69,819<br />
188,292 Water<br />
2<br />
1,589 367,331<br />
5,317<br />
452,466 Water<br />
3<br />
251 283,220<br />
7,326<br />
232,047 Water<br />
4<br />
-171,744 67,263<br />
731<br />
308,149 Water<br />
5<br />
2,426 128,993<br />
620<br />
254,708 Water<br />
6<br />
1,321 74,038<br />
1,375<br />
427,414 Water<br />
7<br />
2,678 110,858<br />
8,597<br />
752,064 Water<br />
8<br />
365 16,714<br />
3,900<br />
20,525 Water<br />
9<br />
311 260,105<br />
2,922<br />
151,385 Water<br />
10<br />
445 420,303<br />
15,758<br />
381,152 Water<br />
11<br />
243 128,734<br />
1,180<br />
215,988 Water<br />
12<br />
2,098 144,463<br />
1,625<br />
540,741 Water<br />
13<br />
327 116,215<br />
13,588<br />
198,858 Water<br />
14<br />
1,469 53,958<br />
1,153<br />
66,709 Water<br />
15<br />
1,047 263,639<br />
1,268<br />
488,933 Water<br />
16<br />
1,257 1,594,273<br />
9,008<br />
1,238,874 Water<br />
17<br />
1,822 85,553<br />
609<br />
160,421 Water<br />
18<br />
442 139,174<br />
4,886<br />
468,415 Water<br />
19<br />
367 171,752<br />
6,411<br />
271,975 Water<br />
20<br />
907 202,585<br />
22,538<br />
396,089 Water<br />
21<br />
226 207,688<br />
10,549<br />
336,995 Water<br />
22<br />
277 115,080<br />
6,646<br />
616,984 Water<br />
23<br />
223 138,824<br />
8,751<br />
374,548 Water<br />
24<br />
182 366,679<br />
6,540<br />
447,987 Water<br />
25<br />
1,137 150,698<br />
1,246<br />
164,397 Water<br />
26<br />
185 263,517<br />
2,377<br />
165,346 Water<br />
27<br />
337 281,720<br />
3,276<br />
387,093 Water<br />
28<br />
538 105,303<br />
325<br />
28,567 Water<br />
29<br />
1,824 108,104<br />
4,664<br />
213,714 Water<br />
30<br />
31<br />
32<br />
33<br />
13,606 Solar<br />
34<br />
270 Solar<br />
35<br />
2,523 Solar<br />
36<br />
37<br />
38<br />
39<br />
Diesel<br />
40<br />
Diesel<br />
41<br />
Diesel<br />
42<br />
43<br />
621 6,453,117<br />
223,005<br />
9,950,836<br />
44<br />
45<br />
46<br />
<strong>FERC</strong> FORM NO. 1 (REV. 12-03) Page 411
Name of Respondent<br />
PACIFIC GAS AND ELECTRIC COMPANY<br />
This Report is:<br />
(1) X An Original<br />
(2) A Resubmission<br />
Date of Report<br />
(Mo, Da, Yr)<br />
04/08/2011<br />
Year/Period of Report<br />
<strong>2010</strong>/Q4<br />
FOOTNOTE DATA<br />
Schedule Page: 410 Line No.: 2 Column: a<br />
Drum/Spalding Common includes the South Yuba Water System facilities which are common to<br />
Alta, Deer Creek, Drum No. 1, Drum No. 2, Dutch Flat, Halsey, Newcastle, Spaulding Nos. 1,<br />
2, <strong>and</strong> 3, <strong>and</strong> Wise plants <strong>and</strong> the Bear River Canal which is common to Halsey <strong>and</strong> Wise<br />
plants.<br />
Schedule Page: 410 Line No.: 5 Column: a<br />
Water expense included in Other Expenses for Coal Canyon is common to Coal Canyon <strong>and</strong><br />
Lime Saddle plants.<br />
No federal license required.<br />
Schedule Page: 410 Line No.: 7 Column: a<br />
Crane Valley includes storage facilities used also for Kerchoff No. 1 <strong>and</strong> No. 2, San<br />
Joaquin Nos. 1-A, 2, 3, <strong>and</strong> A. G. Wishon plants (Projects 1354 <strong>and</strong> 96).<br />
Schedule Page: 410 Line No.: 8 Column: a<br />
Drum/Spalding Common includes the South Yuba Water System facilities which are common to<br />
Alta, Deer Creek, Drum No. 1, Drum No. 2, Dutch Flat, Halsey, Newcastle, Spaulding Nos. 1,<br />
2, <strong>and</strong> 3, <strong>and</strong> Wise plants <strong>and</strong> the Bear River Canal which is common to Halsey <strong>and</strong> Wise<br />
plants.<br />
Schedule Page: 410 Line No.: 9 Column: a<br />
No federal license required.<br />
Schedule Page: 410 Line No.: 13 Column: a<br />
Water expense included in Other Expenses for Coal Canyon is common to Coal Canyon <strong>and</strong><br />
Lime Saddle plants.<br />
No federal license required.<br />
Schedule Page: 410 Line No.: 16 Column: a<br />
Lyons Reservoir services Phoenix plant.<br />
Schedule Page: 410 Line No.: 18 Column: a<br />
Crane Valley includes storage facilities used also for Kerchoff No. 1 <strong>and</strong> No. 2, San<br />
Joaquin Nos. 1-A, 2, 3, <strong>and</strong> A. G. Wishon plants (Projects 1354 <strong>and</strong> 96).<br />
Schedule Page: 410 Line No.: 19 Column: a<br />
Crane Valley includes storage facilities used also for Kerchoff No. 1 <strong>and</strong> No. 2, San<br />
Joaquin Nos. 1-A, 2, 3, <strong>and</strong> A. G. Wishon plants (Projects 1354 <strong>and</strong> 96).<br />
Schedule Page: 410 Line No.: 20 Column: a<br />
Crane Valley includes storage facilities used also for Kerchoff No. 1 <strong>and</strong> No. 2, San<br />
Joaquin Nos. 1-A, 2, 3, <strong>and</strong> A. G. Wishon plants (Projects 1354 <strong>and</strong> 96).<br />
Schedule Page: 410 Line No.: 22 Column: a<br />
Drum/Spalding Common includes the South Yuba Water System facilities which are common to<br />
Alta, Deer Creek, Drum No. 1, Drum No. 2, Dutch Flat, Halsey, Newcastle, Spaulding Nos. 1,<br />
2, <strong>and</strong> 3, <strong>and</strong> Wise plants <strong>and</strong> the Bear River Canal which is common to Halsey <strong>and</strong> Wise<br />
plants.<br />
Schedule Page: 410 Line No.: 23 Column: a<br />
Drum/Spalding Common includes the South Yuba Water System facilities which are common to<br />
Alta, Deer Creek, Drum No. 1, Drum No. 2, Dutch Flat, Halsey, Newcastle, Spaulding Nos. 1,<br />
2, <strong>and</strong> 3, <strong>and</strong> Wise plants <strong>and</strong> the Bear River Canal which is common to Halsey <strong>and</strong> Wise<br />
plants.<br />
Schedule Page: 410 Line No.: 24 Column: a<br />
Drum/Spalding Common includes the South Yuba Water System facilities which are common to<br />
Alta, Deer Creek, Drum No. 1, Drum No. 2, Dutch Flat, Halsey, Newcastle, Spaulding Nos. 1,<br />
2, <strong>and</strong> 3, <strong>and</strong> Wise plants <strong>and</strong> the Bear River Canal which is common to Halsey <strong>and</strong> Wise<br />
plants.<br />
Schedule Page: 410 Line No.: 25 Column: a<br />
Stanislaus Common includes hydraulic facilities common to Stanislaus <strong>and</strong> Spring Gap<br />
plants. Stanislaus-Spring Gap common is not a hydroelectric generating plant.<br />
<strong>FERC</strong> FORM NO. 1 (ED. 12-87) Page 450.1
Name of Respondent<br />
PACIFIC GAS AND ELECTRIC COMPANY<br />
This Report is:<br />
(1) X An Original<br />
(2) A Resubmission<br />
Date of Report<br />
(Mo, Da, Yr)<br />
04/08/2011<br />
Year/Period of Report<br />
<strong>2010</strong>/Q4<br />
FOOTNOTE DATA<br />
Schedule Page: 410 Line No.: 31 Column: a<br />
No federal license required.<br />
<strong>FERC</strong> FORM NO. 1 (ED. 12-87) Page 450.2
Name of Respondent<br />
PACIFIC GAS AND ELECTRIC COMPANY<br />
This Report Is:<br />
(1) X An Original<br />
Date of Report<br />
(Mo, Da, Yr)<br />
(2) A Resubmission<br />
04/08/2011<br />
TRANSMISSION LINE STATISTICS<br />
Year/Period of Report<br />
End of <strong>2010</strong>/Q4<br />
1. Report information concerning transmission lines, cost of lines, <strong>and</strong> expenses for year. List each transmission line having nominal voltage of 132<br />
kilovolts or greater. Report transmission lines below these voltages in group totals only for each voltage.<br />
2. Transmission lines include all lines covered by the definition of transmission system plant as given in the Uniform System of Accounts. Do not report<br />
substation costs <strong>and</strong> expenses on this page.<br />
3. Report data by individual lines for all voltages if so required by a State commission.<br />
4. Exclude from this page any transmission lines for which plant costs are included in Account 121, Nonutility Property.<br />
5. Indicate whether the type of supporting structure reported in column (e) is: (1) single pole wood or steel; (2) H-frame wood, or steel poles; (3) tower;<br />
or (4) underground construction If a transmission line has more than one type of supporting structure, indicate the mileage of each type of construction<br />
by the use of brackets <strong>and</strong> extra lines. Minor portions of a transmission line of a different type of construction need not be distinguished from the<br />
remainder of the line.<br />
6. Report in columns (f) <strong>and</strong> (g) the total pole miles of each transmission line. Show in column (f) the pole miles of line on structures the cost of which is<br />
reported for the line designated; conversely, show in column (g) the pole miles of line on structures the cost of which is reported for another line. Report<br />
pole miles of line on leased or partly owned structures in column (g). In a footnote, explain the basis of such occupancy <strong>and</strong> state whether expenses with<br />
respect to such structures are included in the expenses reported for the line designated.<br />
Line<br />
No.<br />
1<br />
DESIGNATION<br />
VOLTAGE (KV)<br />
(Indicate where<br />
Type of<br />
other than<br />
60 cycle, 3 phase)<br />
Supporting<br />
From<br />
To<br />
Operating Designed Structure<br />
(a) (b)<br />
(c)<br />
(d) (e)<br />
2 A.E.C. Windfarm Pittsburg-Tesla<br />
3 (Ralph Tap) #2<br />
4 American Canyon American Canyon-<br />
5 Sobrante<br />
6 American-Canyon American<br />
7 Sobrante Carquinez<br />
8 Straits<br />
9 American-Canyon Sobrante<br />
10 Sobrante Sub<br />
11 Arco Midway<br />
12 Balch PP McCall<br />
13 Haas PP McCall<br />
14<br />
15 Belden PP Rock Crk. Jct.<br />
16 #1<br />
17 Belden PP Butte County<br />
18 Table Mtn.<br />
19 Bellota Gregg #1<br />
20<br />
21<br />
22<br />
23 #2<br />
24<br />
25<br />
26 Bellota Tesla #1<br />
27 #2<br />
28<br />
29<br />
30 Black PP Pit #5 PP<br />
31 Bottle Rock PP<br />
32 Bucks Crk PP<br />
33 Caribou PH #2 Table Mtn.<br />
34<br />
35<br />
LENGTH (Pole miles)<br />
(In the case of<br />
underground lines<br />
report circuit miles)<br />
On Structure On Structures<br />
of Line of Another<br />
Designated Line<br />
(f)<br />
(g)<br />
Number<br />
Of<br />
Circuits<br />
230.00 T<br />
2<br />
230.00 T<br />
2<br />
230.00 T<br />
2<br />
230.00 T<br />
2<br />
230.00 T<br />
1<br />
230.00 T<br />
1<br />
230.00 T<br />
1<br />
230.00 T<br />
1<br />
230.00 T<br />
1<br />
230.00 T<br />
1<br />
230.00 T<br />
1<br />
230.00 T<br />
1<br />
230.00 T<br />
1<br />
230.00 T<br />
1<br />
230.00 T<br />
1<br />
230.00 T<br />
1<br />
230.00 T<br />
1<br />
230.00 T<br />
1<br />
230.00 T<br />
1<br />
230.00 SSP<br />
1<br />
230.00 T<br />
1<br />
230.00 T<br />
1<br />
230.00 T<br />
1<br />
230.00 T<br />
1<br />
230.00 T<br />
1<br />
230.00 T<br />
1<br />
230.00 T<br />
1<br />
(h)<br />
36 TOTAL 15,001.28 3,581.60 378<br />
<strong>FERC</strong> FORM NO. 1 (ED. 12-87) Page 422
Name of Respondent<br />
PACIFIC GAS AND ELECTRIC COMPANY<br />
This Report Is:<br />
(1) X An Original<br />
Date of Report<br />
(Mo, Da, Yr)<br />
(2) A Resubmission<br />
04/08/2011<br />
TRANSMISSION LINE STATISTICS<br />
Year/Period of Report<br />
End of <strong>2010</strong>/Q4<br />
1. Report information concerning transmission lines, cost of lines, <strong>and</strong> expenses for year. List each transmission line having nominal voltage of 132<br />
kilovolts or greater. Report transmission lines below these voltages in group totals only for each voltage.<br />
2. Transmission lines include all lines covered by the definition of transmission system plant as given in the Uniform System of Accounts. Do not report<br />
substation costs <strong>and</strong> expenses on this page.<br />
3. Report data by individual lines for all voltages if so required by a State commission.<br />
4. Exclude from this page any transmission lines for which plant costs are included in Account 121, Nonutility Property.<br />
5. Indicate whether the type of supporting structure reported in column (e) is: (1) single pole wood or steel; (2) H-frame wood, or steel poles; (3) tower;<br />
or (4) underground construction If a transmission line has more than one type of supporting structure, indicate the mileage of each type of construction<br />
by the use of brackets <strong>and</strong> extra lines. Minor portions of a transmission line of a different type of construction need not be distinguished from the<br />
remainder of the line.<br />
6. Report in columns (f) <strong>and</strong> (g) the total pole miles of each transmission line. Show in column (f) the pole miles of line on structures the cost of which is<br />
reported for the line designated; conversely, show in column (g) the pole miles of line on structures the cost of which is reported for another line. Report<br />
pole miles of line on leased or partly owned structures in column (g). In a footnote, explain the basis of such occupancy <strong>and</strong> state whether expenses with<br />
respect to such structures are included in the expenses reported for the line designated.<br />
Line<br />
No.<br />
DESIGNATION<br />
VOLTAGE (KV)<br />
(Indicate where<br />
Type of<br />
other than<br />
60 cycle, 3 phase)<br />
Supporting<br />
From<br />
To<br />
Operating Designed Structure<br />
(a) (b)<br />
(c)<br />
(d) (e)<br />
1 Castle Rock Jct. Fulton #1<br />
2 Castle Rock Fulton #2<br />
3 Junction<br />
4<br />
5 Castle Rock Lakeville Sub #1<br />
6<br />
7<br />
8 Castle Rock Lakeville Sub #2<br />
9<br />
10<br />
11 Center of American Canyon-<br />
12 Carquinez Straits Sobrante<br />
13<br />
14 Contra Costa Contra Costa<br />
15 PP Sub #1 & 2<br />
16 Contra Costa Newark #1<br />
17 PP <strong>and</strong> #2<br />
18<br />
19<br />
20 Contra Costa Newark #3<br />
21 PP Research Sub<br />
22 Contra Costa Tesla #1<br />
23 PP<br />
24 Contra Costa Tesla #2<br />
25 Contra Costa<br />
26 PP<br />
27 Contra Costa Tesla #2<br />
28 PP Windmaster<br />
29 Sub<br />
30 Contra Costa Brentwood Sub<br />
31 PP Tesla #1 & 2<br />
32 Contra Costa San Mateo<br />
33 PP #1 & #2<br />
34<br />
35<br />
LENGTH (Pole miles)<br />
(In the case of<br />
underground lines<br />
report circuit miles)<br />
On Structure On Structures<br />
of Line of Another<br />
Designated Line<br />
(f)<br />
(g)<br />
Number<br />
Of<br />
Circuits<br />
230.00 SSP<br />
1<br />
230.00<br />
T<br />
230.00 SSP<br />
1<br />
230.00 T<br />
2<br />
230.00 T<br />
1<br />
230.00 UG<br />
1<br />
230.00 T<br />
1<br />
230.00 T<br />
1<br />
230.00 T<br />
2<br />
230.00 T<br />
1<br />
230.00 T<br />
2<br />
230.00 T<br />
2<br />
230.00 T<br />
2<br />
230.00 SSP<br />
1<br />
230.00 T<br />
1<br />
230.00 T<br />
1<br />
230.00 T<br />
1<br />
230.00 1<br />
230.00 T<br />
1<br />
230.00 T<br />
1<br />
230.00 T<br />
1<br />
230.00 T<br />
2<br />
230.00 T<br />
2<br />
230.00 T<br />
2<br />
230.00 T<br />
2<br />
(h)<br />
36 TOTAL 15,001.28 3,581.60 378<br />
<strong>FERC</strong> FORM NO. 1 (ED. 12-87) Page 422.1
Name of Respondent<br />
PACIFIC GAS AND ELECTRIC COMPANY<br />
This Report Is:<br />
(1) X An Original<br />
Date of Report<br />
(Mo, Da, Yr)<br />
(2) A Resubmission<br />
04/08/2011<br />
TRANSMISSION LINE STATISTICS<br />
Year/Period of Report<br />
End of <strong>2010</strong>/Q4<br />
1. Report information concerning transmission lines, cost of lines, <strong>and</strong> expenses for year. List each transmission line having nominal voltage of 132<br />
kilovolts or greater. Report transmission lines below these voltages in group totals only for each voltage.<br />
2. Transmission lines include all lines covered by the definition of transmission system plant as given in the Uniform System of Accounts. Do not report<br />
substation costs <strong>and</strong> expenses on this page.<br />
3. Report data by individual lines for all voltages if so required by a State commission.<br />
4. Exclude from this page any transmission lines for which plant costs are included in Account 121, Nonutility Property.<br />
5. Indicate whether the type of supporting structure reported in column (e) is: (1) single pole wood or steel; (2) H-frame wood, or steel poles; (3) tower;<br />
or (4) underground construction If a transmission line has more than one type of supporting structure, indicate the mileage of each type of construction<br />
by the use of brackets <strong>and</strong> extra lines. Minor portions of a transmission line of a different type of construction need not be distinguished from the<br />
remainder of the line.<br />
6. Report in columns (f) <strong>and</strong> (g) the total pole miles of each transmission line. Show in column (f) the pole miles of line on structures the cost of which is<br />
reported for the line designated; conversely, show in column (g) the pole miles of line on structures the cost of which is reported for another line. Report<br />
pole miles of line on leased or partly owned structures in column (g). In a footnote, explain the basis of such occupancy <strong>and</strong> state whether expenses with<br />
respect to such structures are included in the expenses reported for the line designated.<br />
Line<br />
No.<br />
1<br />
DESIGNATION<br />
VOLTAGE (KV)<br />
(Indicate where<br />
Type of<br />
other than<br />
60 cycle, 3 phase)<br />
Supporting<br />
From<br />
To<br />
Operating Designed Structure<br />
(a) (b)<br />
(c)<br />
(d) (e)<br />
2 Contra Costa San Mateo<br />
3 PP #1 & #2<br />
4 Cottonwood Vaca-Dixon #1<br />
5 #2<br />
6 Cottonwood Vac-Dixon #2<br />
7 Diablo Cyn PP Gates<br />
8 Diablo Cyn PP Mesa<br />
9 Diablo Cyn PP Midway<br />
10 Diablo Cyn PP Midway #3<br />
11 Diablo Cyn PP #1 D.C. Smith Yard<br />
12 Diablo Cyn PP #2 D.C. Switch Yard<br />
13 Fulton Ignacio #1<br />
14<br />
15 Fulton Ignacio #2<br />
16<br />
17 Gates Gregg<br />
18 Gates Arco<br />
19 Gates McCall<br />
20 Gates Panoche #1<br />
21<br />
22 #2<br />
23 Geysers ll Castle Rock<br />
24 Castle Rock Jct.- Fulton<br />
25 Jct. Cir. Cir. #2<br />
26 Geysers 20 Geysers 13<br />
27 Tap<br />
28 Geysers 16 NCPA Tap<br />
29 Geysers 12 PP Geysers 14<br />
30 Castle Rock<br />
31 Geysers PP Castle Rock<br />
32 (Unit #14) Lakeville<br />
33 Geysers PP Castle Rock<br />
34 (Unit #5 & 6) Jct.<br />
35 Geysers PP Castle Rock<br />
LENGTH (Pole miles)<br />
(In the case of<br />
underground lines<br />
report circuit miles)<br />
On Structure On Structures<br />
of Line of Another<br />
Designated Line<br />
(f)<br />
(g)<br />
Number<br />
Of<br />
Circuits<br />
230.00 T<br />
2<br />
230.00 T<br />
2<br />
230.00 T<br />
2<br />
230.00 T<br />
1<br />
230.00 T<br />
1<br />
230.00 T<br />
1<br />
500.00 T<br />
1<br />
230.00 T<br />
1<br />
500.00 T<br />
1<br />
500.00 T<br />
1<br />
500.00 T<br />
1<br />
500.00 T<br />
1<br />
230.00 T<br />
1<br />
230.00 SSP<br />
1<br />
230.00 T<br />
1<br />
230.00 SSP<br />
1<br />
230.00 T<br />
1<br />
230.00 T<br />
1<br />
230.00 T<br />
1<br />
230.00 T<br />
1<br />
230.00 SWP<br />
1<br />
230.00 T<br />
1<br />
230.00 T<br />
2<br />
230.00 T<br />
1<br />
230.00 T<br />
1<br />
230.00 T<br />
1<br />
230.00 T<br />
2<br />
230.00 T<br />
1<br />
230.00 T<br />
1<br />
(h)<br />
36 TOTAL 15,001.28 3,581.60 378<br />
<strong>FERC</strong> FORM NO. 1 (ED. 12-87) Page 422.2
Name of Respondent<br />
PACIFIC GAS AND ELECTRIC COMPANY<br />
This Report Is:<br />
(1) X An Original<br />
Date of Report<br />
(Mo, Da, Yr)<br />
(2) A Resubmission<br />
04/08/2011<br />
TRANSMISSION LINE STATISTICS<br />
Year/Period of Report<br />
End of <strong>2010</strong>/Q4<br />
1. Report information concerning transmission lines, cost of lines, <strong>and</strong> expenses for year. List each transmission line having nominal voltage of 132<br />
kilovolts or greater. Report transmission lines below these voltages in group totals only for each voltage.<br />
2. Transmission lines include all lines covered by the definition of transmission system plant as given in the Uniform System of Accounts. Do not report<br />
substation costs <strong>and</strong> expenses on this page.<br />
3. Report data by individual lines for all voltages if so required by a State commission.<br />
4. Exclude from this page any transmission lines for which plant costs are included in Account 121, Nonutility Property.<br />
5. Indicate whether the type of supporting structure reported in column (e) is: (1) single pole wood or steel; (2) H-frame wood, or steel poles; (3) tower;<br />
or (4) underground construction If a transmission line has more than one type of supporting structure, indicate the mileage of each type of construction<br />
by the use of brackets <strong>and</strong> extra lines. Minor portions of a transmission line of a different type of construction need not be distinguished from the<br />
remainder of the line.<br />
6. Report in columns (f) <strong>and</strong> (g) the total pole miles of each transmission line. Show in column (f) the pole miles of line on structures the cost of which is<br />
reported for the line designated; conversely, show in column (g) the pole miles of line on structures the cost of which is reported for another line. Report<br />
pole miles of line on leased or partly owned structures in column (g). In a footnote, explain the basis of such occupancy <strong>and</strong> state whether expenses with<br />
respect to such structures are included in the expenses reported for the line designated.<br />
Line<br />
No.<br />
DESIGNATION<br />
VOLTAGE (KV)<br />
(Indicate where<br />
Type of<br />
other than<br />
60 cycle, 3 phase)<br />
Supporting<br />
From<br />
To<br />
Operating Designed Structure<br />
(a) (b)<br />
(c)<br />
(d) (e)<br />
1 (Unit ll) Jct.<br />
2 Geysers PP Castle Rock<br />
3 (Unit 9 & 10) Jct.<br />
4 Geysers PP Geysers PP<br />
5 (Unit 13) (Unit (9)<br />
6 Castle Rock<br />
7 Jct.<br />
8<br />
9 Geysers PP Occidental<br />
10 (Unit (9) Petroleum<br />
11 Geysers PP Geothermal<br />
12 (Unit 13) PP #1<br />
13 Geysers PP Castle Rock<br />
14 (Unit 14) Jct.<br />
15 Geysers PP Geysers PP<br />
16 (Unit 17) (Unit 11)<br />
17 Castle Rock<br />
18 Jct.<br />
19 Geysers PP Geysers PP<br />
20 (Unit 18) (Unit 14)<br />
21 Castle Rock<br />
22 Jct.<br />
23 Gregg Ashlan Av.<br />
24 Sub.<br />
25 Gregg-Ashlan Figarden Sub #1<br />
26 Av. Sub<br />
27 Gregg Herndon #1<br />
28 & #2<br />
29 Helms Gregg #1<br />
30<br />
31 #2<br />
32<br />
33 Herndon-Ashlan Figarden Sub #2<br />
34 Av.<br />
35 Herndon Ashl<strong>and</strong> Av.<br />
LENGTH (Pole miles)<br />
(In the case of<br />
underground lines<br />
report circuit miles)<br />
On Structure On Structures<br />
of Line of Another<br />
Designated Line<br />
(f)<br />
(g)<br />
Number<br />
Of<br />
Circuits<br />
230.00 T<br />
1<br />
230.00 T<br />
1<br />
230.00 UG<br />
1<br />
230.00 T<br />
1<br />
230.00 T<br />
1<br />
230.00 T<br />
1<br />
230.00 T<br />
1<br />
230.00 T<br />
1<br />
230.00 T<br />
1<br />
230.00 T<br />
1<br />
230.00 UG<br />
1<br />
230.00 T<br />
1<br />
230.00 1<br />
230.00 T<br />
1<br />
230.00 T<br />
1<br />
230.00 T<br />
1<br />
230.00 1<br />
230.00 UG<br />
1<br />
230.00 T<br />
1<br />
(h)<br />
36 TOTAL 15,001.28 3,581.60 378<br />
<strong>FERC</strong> FORM NO. 1 (ED. 12-87) Page 422.3
Name of Respondent<br />
PACIFIC GAS AND ELECTRIC COMPANY<br />
This Report Is:<br />
(1) X An Original<br />
Date of Report<br />
(Mo, Da, Yr)<br />
(2) A Resubmission<br />
04/08/2011<br />
TRANSMISSION LINE STATISTICS<br />
Year/Period of Report<br />
End of <strong>2010</strong>/Q4<br />
1. Report information concerning transmission lines, cost of lines, <strong>and</strong> expenses for year. List each transmission line having nominal voltage of 132<br />
kilovolts or greater. Report transmission lines below these voltages in group totals only for each voltage.<br />
2. Transmission lines include all lines covered by the definition of transmission system plant as given in the Uniform System of Accounts. Do not report<br />
substation costs <strong>and</strong> expenses on this page.<br />
3. Report data by individual lines for all voltages if so required by a State commission.<br />
4. Exclude from this page any transmission lines for which plant costs are included in Account 121, Nonutility Property.<br />
5. Indicate whether the type of supporting structure reported in column (e) is: (1) single pole wood or steel; (2) H-frame wood, or steel poles; (3) tower;<br />
or (4) underground construction If a transmission line has more than one type of supporting structure, indicate the mileage of each type of construction<br />
by the use of brackets <strong>and</strong> extra lines. Minor portions of a transmission line of a different type of construction need not be distinguished from the<br />
remainder of the line.<br />
6. Report in columns (f) <strong>and</strong> (g) the total pole miles of each transmission line. Show in column (f) the pole miles of line on structures the cost of which is<br />
reported for the line designated; conversely, show in column (g) the pole miles of line on structures the cost of which is reported for another line. Report<br />
pole miles of line on leased or partly owned structures in column (g). In a footnote, explain the basis of such occupancy <strong>and</strong> state whether expenses with<br />
respect to such structures are included in the expenses reported for the line designated.<br />
Line<br />
No.<br />
DESIGNATION<br />
VOLTAGE (KV)<br />
(Indicate where<br />
Type of<br />
other than<br />
60 cycle, 3 phase)<br />
Supporting<br />
From<br />
To<br />
Operating Designed Structure<br />
(a) (b)<br />
(c)<br />
(d) (e)<br />
1 Herndon Kearney<br />
2 Ignacio American<br />
3 Jct. Canyon Jct.<br />
4 Ignacio Ignacio<br />
5 Jct. Sub<br />
6 Ignacio Ignacio<br />
7 Loop Cir. Loop Cir.<br />
8 1 & 2 1 & 2<br />
9 Indian Springs Round Mt. Sub.<br />
10 Lakeville Sub Ignacio Jct.<br />
11 Lakeville Ignacio #2<br />
12 Los Banos Sub Midway Sub<br />
13 #1<br />
14 #2<br />
15 Los Banos Sub Panoche<br />
16 Los Banos Sub San Luis<br />
17 Pumps #1<br />
18 #2<br />
19 Martin Embarcadero<br />
20 #1 (HZ)<br />
21 Martin Embarcadero<br />
22 #2 (HZ)<br />
23 Melones Warnerville<br />
24 Jct. #1 & 2<br />
25 Metcalf Monta Vista<br />
26 Metcalf Monta Vista<br />
27 Metcalf Monta Vista<br />
28 Metcalf Moss L<strong>and</strong>g#1<br />
29 Metcalf Newark #1<br />
30<br />
31 Midddle Fork PP Gold Hill<br />
32<br />
33<br />
34 Middle Fork PP Gold Hill<br />
35<br />
LENGTH (Pole miles)<br />
(In the case of<br />
underground lines<br />
report circuit miles)<br />
On Structure On Structures<br />
of Line of Another<br />
Designated Line<br />
(f)<br />
(g)<br />
Number<br />
Of<br />
Circuits<br />
230.00 T<br />
1<br />
230.00 T<br />
1<br />
230.00 T<br />
2<br />
230.00 T<br />
2<br />
500.00 T<br />
1<br />
230.00 T<br />
2<br />
230.00 UG<br />
2<br />
500.00 T<br />
1<br />
500.00 T<br />
1<br />
230.00 T<br />
1<br />
230.00 T<br />
1<br />
230.00 T<br />
1<br />
230.00 UG<br />
1<br />
230.00 UG<br />
1<br />
230.00 T<br />
2<br />
230.00 T<br />
2<br />
230.00 SSP<br />
1<br />
230.00 T<br />
1<br />
230.00 T<br />
2<br />
230.00 T<br />
2<br />
230.00 T<br />
2<br />
230.00 T<br />
1<br />
230.00 H<br />
1<br />
230.00 T<br />
1<br />
230.00 WH<br />
1<br />
(h)<br />
36 TOTAL 15,001.28 3,581.60 378<br />
<strong>FERC</strong> FORM NO. 1 (ED. 12-87) Page 422.4
Name of Respondent<br />
PACIFIC GAS AND ELECTRIC COMPANY<br />
This Report Is:<br />
(1) X An Original<br />
Date of Report<br />
(Mo, Da, Yr)<br />
(2) A Resubmission<br />
04/08/2011<br />
TRANSMISSION LINE STATISTICS<br />
Year/Period of Report<br />
End of <strong>2010</strong>/Q4<br />
1. Report information concerning transmission lines, cost of lines, <strong>and</strong> expenses for year. List each transmission line having nominal voltage of 132<br />
kilovolts or greater. Report transmission lines below these voltages in group totals only for each voltage.<br />
2. Transmission lines include all lines covered by the definition of transmission system plant as given in the Uniform System of Accounts. Do not report<br />
substation costs <strong>and</strong> expenses on this page.<br />
3. Report data by individual lines for all voltages if so required by a State commission.<br />
4. Exclude from this page any transmission lines for which plant costs are included in Account 121, Nonutility Property.<br />
5. Indicate whether the type of supporting structure reported in column (e) is: (1) single pole wood or steel; (2) H-frame wood, or steel poles; (3) tower;<br />
or (4) underground construction If a transmission line has more than one type of supporting structure, indicate the mileage of each type of construction<br />
by the use of brackets <strong>and</strong> extra lines. Minor portions of a transmission line of a different type of construction need not be distinguished from the<br />
remainder of the line.<br />
6. Report in columns (f) <strong>and</strong> (g) the total pole miles of each transmission line. Show in column (f) the pole miles of line on structures the cost of which is<br />
reported for the line designated; conversely, show in column (g) the pole miles of line on structures the cost of which is reported for another line. Report<br />
pole miles of line on leased or partly owned structures in column (g). In a footnote, explain the basis of such occupancy <strong>and</strong> state whether expenses with<br />
respect to such structures are included in the expenses reported for the line designated.<br />
Line<br />
No.<br />
DESIGNATION<br />
VOLTAGE (KV)<br />
(Indicate where<br />
Type of<br />
other than<br />
60 cycle, 3 phase)<br />
Supporting<br />
From<br />
To<br />
Operating Designed Structure<br />
(a) (b)<br />
(c)<br />
(d) (e)<br />
1 Middle Fork- Orangevale<br />
2 Gold Hill Sub (SMUD)<br />
3 Middle Fork - Pocket Sub<br />
4 Gold Hill (SMUD)<br />
5<br />
6<br />
7 Midway Kern PP #1<br />
8 Midway Kern PP #2<br />
9 Midway Kern PP #3<br />
10 Midway Kern PP #4<br />
11 Midway Vincent #3<br />
12 Midway Wheeler Ridge<br />
13 #1<br />
14 #2<br />
15 Midway-Kern #1 Stockdale Sub<br />
16 #1<br />
17<br />
18<br />
19 Midway -Kern #3 Stockdale Sub<br />
20 #2<br />
21 Midway-Wheeler Buena Vista<br />
22 Ridge #1 & 2 Pump Plant<br />
23 (State DWR)<br />
24 Midway-Wheeler Wheeler Ridge<br />
25 Ridge #1 & 2 Pump Plant<br />
26 (State DWR)<br />
27 Midway-Wheeler Wind Gap Pump<br />
28 Ridge #1 & 2 (State DWR)<br />
29 Monta Vista Jefferson<br />
30 Moraga Newark<br />
31<br />
32<br />
33<br />
34<br />
35<br />
LENGTH (Pole miles)<br />
(In the case of<br />
underground lines<br />
report circuit miles)<br />
On Structure On Structures<br />
of Line of Another<br />
Designated Line<br />
(f)<br />
(g)<br />
Number<br />
Of<br />
Circuits<br />
230.00 T<br />
1<br />
230.00 T<br />
1<br />
230.00 1<br />
230.00 T<br />
1<br />
230.00 T<br />
1<br />
230.00 T<br />
1<br />
230.00 T<br />
1<br />
500.00 T<br />
1<br />
230.00 T<br />
1<br />
230.00 T<br />
1<br />
230.00 T<br />
1<br />
230.00 T<br />
1<br />
230.00 SSP<br />
1<br />
230.00 T<br />
1<br />
230.00 T<br />
2<br />
230.00 T<br />
2<br />
230.00 T<br />
2<br />
230.00 T<br />
2<br />
230.00<br />
T<br />
230.00<br />
T<br />
230.00<br />
230.00<br />
230.00<br />
230.00<br />
T<br />
T<br />
T<br />
T<br />
(h)<br />
36 TOTAL 15,001.28 3,581.60 378<br />
<strong>FERC</strong> FORM NO. 1 (ED. 12-87) Page 422.5
Name of Respondent<br />
PACIFIC GAS AND ELECTRIC COMPANY<br />
This Report Is:<br />
(1) X An Original<br />
Date of Report<br />
(Mo, Da, Yr)<br />
(2) A Resubmission<br />
04/08/2011<br />
TRANSMISSION LINE STATISTICS<br />
Year/Period of Report<br />
End of <strong>2010</strong>/Q4<br />
1. Report information concerning transmission lines, cost of lines, <strong>and</strong> expenses for year. List each transmission line having nominal voltage of 132<br />
kilovolts or greater. Report transmission lines below these voltages in group totals only for each voltage.<br />
2. Transmission lines include all lines covered by the definition of transmission system plant as given in the Uniform System of Accounts. Do not report<br />
substation costs <strong>and</strong> expenses on this page.<br />
3. Report data by individual lines for all voltages if so required by a State commission.<br />
4. Exclude from this page any transmission lines for which plant costs are included in Account 121, Nonutility Property.<br />
5. Indicate whether the type of supporting structure reported in column (e) is: (1) single pole wood or steel; (2) H-frame wood, or steel poles; (3) tower;<br />
or (4) underground construction If a transmission line has more than one type of supporting structure, indicate the mileage of each type of construction<br />
by the use of brackets <strong>and</strong> extra lines. Minor portions of a transmission line of a different type of construction need not be distinguished from the<br />
remainder of the line.<br />
6. Report in columns (f) <strong>and</strong> (g) the total pole miles of each transmission line. Show in column (f) the pole miles of line on structures the cost of which is<br />
reported for the line designated; conversely, show in column (g) the pole miles of line on structures the cost of which is reported for another line. Report<br />
pole miles of line on leased or partly owned structures in column (g). In a footnote, explain the basis of such occupancy <strong>and</strong> state whether expenses with<br />
respect to such structures are included in the expenses reported for the line designated.<br />
Line<br />
No.<br />
1<br />
DESIGNATION<br />
VOLTAGE (KV)<br />
(Indicate where<br />
Type of<br />
other than<br />
60 cycle, 3 phase)<br />
Supporting<br />
From<br />
To<br />
Operating Designed Structure<br />
(a) (b)<br />
(c)<br />
(d) (e)<br />
2 Morro Bay PP Gates<br />
3 Morro Bay PP Midway<br />
4 Morro Bay PP Mesa<br />
5 Morro Bay PP-MESA Diablo Cyn PP<br />
6 Moss L<strong>and</strong>ing PH Los Banos Sub<br />
7 Moss L<strong>and</strong>ing PH Panoche #1<br />
8<br />
9 Moss L<strong>and</strong>ing PH Panoche #2<br />
10 Moss L<strong>and</strong>ing Moss L<strong>and</strong>ing<br />
11 230KV SW. 115KV SW.<br />
12 Moss L<strong>and</strong>ing Los Banos<br />
13 Moss L<strong>and</strong>ing Metcalf<br />
14 Newark San Mateo<br />
15<br />
16 NCPA 1&2 Tap Line CR Collector Line<br />
17 Panoche Kearney<br />
18 Panoche-Kearney McMullin Sub<br />
19 Panoche McCall<br />
20 Panoche McCall<br />
21 Pittsburg PP Moraga #1 & 2<br />
22<br />
23 Pittsburg PP Moraga #3<br />
24<br />
25<br />
26 Pittsburg-Panoche Los Banos<br />
27 Pittsburg PP Sobrante Sub<br />
28 Pittsburg PP Tesla Sub<br />
29 Pittsburg PP Newark<br />
30<br />
31<br />
32<br />
33<br />
34<br />
35<br />
230.00<br />
T<br />
LENGTH (Pole miles)<br />
(In the case of<br />
underground lines<br />
report circuit miles)<br />
On Structure On Structures<br />
of Line of Another<br />
Designated Line<br />
(f)<br />
(g)<br />
Number<br />
Of<br />
Circuits<br />
230.00 T<br />
2<br />
230.00 T<br />
2<br />
230.00 T<br />
1<br />
230.00 T<br />
2<br />
230.00 T<br />
1<br />
230.00 T<br />
1<br />
230.00 T<br />
2<br />
230.00 T<br />
1<br />
230.00<br />
T<br />
500.00 T<br />
1<br />
500.00 T<br />
1<br />
230.00 T<br />
2<br />
230.00 1<br />
230.00 T<br />
2<br />
230.00 T<br />
1<br />
230.00 T<br />
1<br />
230.00 T<br />
1<br />
230.00 T<br />
1<br />
230.00 T<br />
2<br />
230.00 2<br />
230.00 T<br />
1<br />
230.00 T<br />
1<br />
230.00 T<br />
1<br />
230.00 T<br />
1<br />
230.00 T<br />
2<br />
230.00 T<br />
2<br />
230.00 T<br />
1<br />
230.00 T<br />
1<br />
230.00 T<br />
1<br />
230.00 T<br />
1<br />
230.00 T<br />
1<br />
230.00 T<br />
1<br />
(h)<br />
36 TOTAL 15,001.28 3,581.60 378<br />
<strong>FERC</strong> FORM NO. 1 (ED. 12-87) Page 422.6
Name of Respondent<br />
PACIFIC GAS AND ELECTRIC COMPANY<br />
This Report Is:<br />
(1) X An Original<br />
Date of Report<br />
(Mo, Da, Yr)<br />
(2) A Resubmission<br />
04/08/2011<br />
TRANSMISSION LINE STATISTICS<br />
Year/Period of Report<br />
End of <strong>2010</strong>/Q4<br />
1. Report information concerning transmission lines, cost of lines, <strong>and</strong> expenses for year. List each transmission line having nominal voltage of 132<br />
kilovolts or greater. Report transmission lines below these voltages in group totals only for each voltage.<br />
2. Transmission lines include all lines covered by the definition of transmission system plant as given in the Uniform System of Accounts. Do not report<br />
substation costs <strong>and</strong> expenses on this page.<br />
3. Report data by individual lines for all voltages if so required by a State commission.<br />
4. Exclude from this page any transmission lines for which plant costs are included in Account 121, Nonutility Property.<br />
5. Indicate whether the type of supporting structure reported in column (e) is: (1) single pole wood or steel; (2) H-frame wood, or steel poles; (3) tower;<br />
or (4) underground construction If a transmission line has more than one type of supporting structure, indicate the mileage of each type of construction<br />
by the use of brackets <strong>and</strong> extra lines. Minor portions of a transmission line of a different type of construction need not be distinguished from the<br />
remainder of the line.<br />
6. Report in columns (f) <strong>and</strong> (g) the total pole miles of each transmission line. Show in column (f) the pole miles of line on structures the cost of which is<br />
reported for the line designated; conversely, show in column (g) the pole miles of line on structures the cost of which is reported for another line. Report<br />
pole miles of line on leased or partly owned structures in column (g). In a footnote, explain the basis of such occupancy <strong>and</strong> state whether expenses with<br />
respect to such structures are included in the expenses reported for the line designated.<br />
Line<br />
No.<br />
DESIGNATION<br />
VOLTAGE (KV)<br />
(Indicate where<br />
Type of<br />
other than<br />
60 cycle, 3 phase)<br />
Supporting<br />
From<br />
To<br />
Operating Designed Structure<br />
(a) (b)<br />
(c)<br />
(d) (e)<br />
1 Pit # 1- Sierra <strong>Pacific</strong><br />
2 Cottonwood Industry<br />
3 Pit # 1 PP Vac-Dixon<br />
4<br />
5<br />
6 Pit # 1 PP Vac-Dixon<br />
7<br />
8 Pit # 1 PP Vac-Dixon<br />
9<br />
10<br />
11<br />
12<br />
13<br />
14<br />
15<br />
16<br />
17<br />
18<br />
19 Pit # 4 PP Round Mtn.<br />
20<br />
21<br />
22<br />
23<br />
24<br />
25 Pit # 5 PP Mega Renewable-<br />
26 able Sub<br />
27 Pit # 5 PP Round Mtn.<br />
28<br />
29<br />
30<br />
31<br />
32<br />
33<br />
34 Pit # 5 PP Round Mtn.<br />
35<br />
LENGTH (Pole miles)<br />
(In the case of<br />
underground lines<br />
report circuit miles)<br />
On Structure On Structures<br />
of Line of Another<br />
Designated Line<br />
(f)<br />
(g)<br />
Number<br />
Of<br />
Circuits<br />
230.00 T<br />
1<br />
230.00 T<br />
1<br />
230.00 T<br />
1<br />
230.00 T<br />
1<br />
230.00 WH<br />
1<br />
230.00 T<br />
1<br />
230.00 T<br />
1<br />
230.00 T<br />
1<br />
230.00 T<br />
1<br />
230.00 T<br />
1<br />
230.00 T<br />
1<br />
230.00 T<br />
1<br />
230.00 SH<br />
1<br />
230.00 T<br />
1<br />
230.00 T<br />
1<br />
230.00 T<br />
1<br />
230.00 WH<br />
1<br />
230.00 T<br />
1<br />
230.00 WH<br />
1<br />
230.00 T<br />
1<br />
230.00 WH<br />
1<br />
230.00 WH<br />
1<br />
230.00 T<br />
1<br />
230.00 T<br />
1<br />
230.00 WH<br />
1<br />
230.00 T<br />
1<br />
230.00 T<br />
1<br />
230.00 WH<br />
1<br />
230.00 WH<br />
1<br />
230.00 WH<br />
1<br />
230.00 T<br />
1<br />
(h)<br />
36 TOTAL 15,001.28 3,581.60 378<br />
<strong>FERC</strong> FORM NO. 1 (ED. 12-87) Page 422.7
Name of Respondent<br />
PACIFIC GAS AND ELECTRIC COMPANY<br />
This Report Is:<br />
(1) X An Original<br />
Date of Report<br />
(Mo, Da, Yr)<br />
(2) A Resubmission<br />
04/08/2011<br />
TRANSMISSION LINE STATISTICS<br />
Year/Period of Report<br />
End of <strong>2010</strong>/Q4<br />
1. Report information concerning transmission lines, cost of lines, <strong>and</strong> expenses for year. List each transmission line having nominal voltage of 132<br />
kilovolts or greater. Report transmission lines below these voltages in group totals only for each voltage.<br />
2. Transmission lines include all lines covered by the definition of transmission system plant as given in the Uniform System of Accounts. Do not report<br />
substation costs <strong>and</strong> expenses on this page.<br />
3. Report data by individual lines for all voltages if so required by a State commission.<br />
4. Exclude from this page any transmission lines for which plant costs are included in Account 121, Nonutility Property.<br />
5. Indicate whether the type of supporting structure reported in column (e) is: (1) single pole wood or steel; (2) H-frame wood, or steel poles; (3) tower;<br />
or (4) underground construction If a transmission line has more than one type of supporting structure, indicate the mileage of each type of construction<br />
by the use of brackets <strong>and</strong> extra lines. Minor portions of a transmission line of a different type of construction need not be distinguished from the<br />
remainder of the line.<br />
6. Report in columns (f) <strong>and</strong> (g) the total pole miles of each transmission line. Show in column (f) the pole miles of line on structures the cost of which is<br />
reported for the line designated; conversely, show in column (g) the pole miles of line on structures the cost of which is reported for another line. Report<br />
pole miles of line on leased or partly owned structures in column (g). In a footnote, explain the basis of such occupancy <strong>and</strong> state whether expenses with<br />
respect to such structures are included in the expenses reported for the line designated.<br />
Line<br />
No.<br />
DESIGNATION<br />
VOLTAGE (KV)<br />
(Indicate where<br />
Type of<br />
other than<br />
60 cycle, 3 phase)<br />
Supporting<br />
From<br />
To<br />
Operating Designed Structure<br />
(a) (b)<br />
(c)<br />
(d) (e)<br />
1 Pit # 5 PP Roaring Crk.<br />
2 Round Mtn. Sub<br />
3 Pit # 6 PP Pit # 6 Jct.<br />
4<br />
5 Pit # 7 PP Pit # 7 Jct.<br />
6 Pit # 7 PP Pit # 7 Jct.<br />
7 Pittsburg- Rossmoor Sub<br />
8 Moraga #1<br />
9 Pittsburg- Roosmoor Sub<br />
10 Moraga #2<br />
11 Pit-Vaca Dixon Sierra <strong>Pacific</strong><br />
12 Industry<br />
13<br />
14 Rancho Seco Bellota Sub<br />
15 PP (SMUD)<br />
16 Rancho Seco Stagg Sub<br />
17 PP (SMUD) <strong>and</strong><br />
18 Tesla Sub<br />
19 Rio Oso Bellota #1<br />
20 <strong>and</strong> #2<br />
21<br />
22<br />
23<br />
24 Rio Oso Sub T. 10/44<br />
25 (SMUD)<br />
26 Rio Oso Sub Tesla Sub<br />
27 Rio Oso-Tesla Eight Mile<br />
28 T.77/323A Substation<br />
29 Rock Creek PP Riso Oso #1<br />
30 Rock Creek PP Riso Oso #2<br />
31 Round Mountain Cottonwood<br />
32<br />
33 Round Mountain Table Mtn. #1<br />
34<br />
35 Round Mountain Table Mtn. #2<br />
LENGTH (Pole miles)<br />
(In the case of<br />
underground lines<br />
report circuit miles)<br />
On Structure On Structures<br />
of Line of Another<br />
Designated Line<br />
(f)<br />
(g)<br />
Number<br />
Of<br />
Circuits<br />
230.00 WH<br />
1<br />
230.00 T<br />
1<br />
230.00 WH<br />
1<br />
230.00 T<br />
1<br />
230.00 WH<br />
1<br />
230.00 T<br />
1<br />
230.00 T<br />
1<br />
230.00 T<br />
1<br />
230.00 T<br />
2<br />
230.00 T<br />
1<br />
230.00 T<br />
1<br />
230.00 T<br />
2<br />
230.00 T<br />
2<br />
230.00 T<br />
2<br />
230.00 T<br />
1<br />
230.00 T<br />
1<br />
230.00 T<br />
1<br />
230.00 T<br />
1<br />
230.00 T<br />
1<br />
230.00 T<br />
1<br />
230.00 LST<br />
1<br />
230.00 T<br />
1<br />
230.00 T<br />
1<br />
230.00 T<br />
1<br />
230.00 WH<br />
1<br />
500.00 T<br />
1<br />
500.00 T<br />
1<br />
500.00 T<br />
1<br />
(h)<br />
36 TOTAL 15,001.28 3,581.60 378<br />
<strong>FERC</strong> FORM NO. 1 (ED. 12-87) Page 422.8
Name of Respondent<br />
PACIFIC GAS AND ELECTRIC COMPANY<br />
This Report Is:<br />
(1) X An Original<br />
Date of Report<br />
(Mo, Da, Yr)<br />
(2) A Resubmission<br />
04/08/2011<br />
TRANSMISSION LINE STATISTICS<br />
Year/Period of Report<br />
End of <strong>2010</strong>/Q4<br />
1. Report information concerning transmission lines, cost of lines, <strong>and</strong> expenses for year. List each transmission line having nominal voltage of 132<br />
kilovolts or greater. Report transmission lines below these voltages in group totals only for each voltage.<br />
2. Transmission lines include all lines covered by the definition of transmission system plant as given in the Uniform System of Accounts. Do not report<br />
substation costs <strong>and</strong> expenses on this page.<br />
3. Report data by individual lines for all voltages if so required by a State commission.<br />
4. Exclude from this page any transmission lines for which plant costs are included in Account 121, Nonutility Property.<br />
5. Indicate whether the type of supporting structure reported in column (e) is: (1) single pole wood or steel; (2) H-frame wood, or steel poles; (3) tower;<br />
or (4) underground construction If a transmission line has more than one type of supporting structure, indicate the mileage of each type of construction<br />
by the use of brackets <strong>and</strong> extra lines. Minor portions of a transmission line of a different type of construction need not be distinguished from the<br />
remainder of the line.<br />
6. Report in columns (f) <strong>and</strong> (g) the total pole miles of each transmission line. Show in column (f) the pole miles of line on structures the cost of which is<br />
reported for the line designated; conversely, show in column (g) the pole miles of line on structures the cost of which is reported for another line. Report<br />
pole miles of line on leased or partly owned structures in column (g). In a footnote, explain the basis of such occupancy <strong>and</strong> state whether expenses with<br />
respect to such structures are included in the expenses reported for the line designated.<br />
Line<br />
No.<br />
1<br />
DESIGNATION<br />
VOLTAGE (KV)<br />
(Indicate where<br />
Type of<br />
other than<br />
60 cycle, 3 phase)<br />
Supporting<br />
From<br />
To<br />
Operating Designed Structure<br />
(a) (b)<br />
(c)<br />
(d) (e)<br />
2 San Mateo Sub Martin Sub<br />
3 Stockdale Bakersfield<br />
4 #1<br />
5 Stockdale Bakersfield<br />
6 #1<br />
7 #2<br />
8<br />
9 Table Mtn. Rio Oso #1<br />
10 Table Mtn. Rio Oso #2<br />
11 Table Mtn. Tesla Sub<br />
12 Tesla Sub<br />
13 Table Mtn. Vaca-Dixon<br />
14 Tesla Sub Lawrence Lab<br />
15<br />
16 Tesla Sub Los Banos Sub<br />
17 #1<br />
18 Los Banos Sub<br />
19 #2<br />
20 Tesla Sub Metcalf Sub<br />
21 Tesla Midway #1<br />
22<br />
23 Tesla Midway #2<br />
24<br />
25<br />
26 Tesla Parker (MID)<br />
27<br />
28<br />
29<br />
30 Tesla USBR Tracy<br />
31 #1 & 2<br />
32 Tesla Newark #1<br />
33 Tesla Newark #2<br />
34 Tiger Creek Bellota #1<br />
35<br />
LENGTH (Pole miles)<br />
(In the case of<br />
underground lines<br />
report circuit miles)<br />
On Structure On Structures<br />
of Line of Another<br />
Designated Line<br />
(f)<br />
(g)<br />
Number<br />
Of<br />
Circuits<br />
500.00 T<br />
1<br />
230.00 UG<br />
1<br />
230.00 T<br />
1<br />
230.00 SSP<br />
1<br />
230.00 T<br />
1<br />
230.00 SSP<br />
1<br />
230.00 T<br />
1<br />
230.00 T<br />
1<br />
500.00 T<br />
1<br />
500.00 T<br />
1<br />
500.00 T<br />
1<br />
230.00 T<br />
1<br />
230.00 SSP<br />
1<br />
500.00 T<br />
1<br />
500.00 T<br />
1<br />
500.00 T<br />
1<br />
230.00 T<br />
1<br />
230.00 T<br />
1<br />
230.00 T<br />
1<br />
230.00 T<br />
1<br />
230.00 T<br />
2<br />
230.00 T<br />
1<br />
230.00 T<br />
2<br />
230.00 T<br />
1<br />
230.00 T<br />
1<br />
230.00 T<br />
2<br />
230.00 T<br />
1<br />
230.00 T<br />
1<br />
230.00 T<br />
1<br />
230.00 T<br />
1<br />
(h)<br />
36 TOTAL 15,001.28 3,581.60 378<br />
<strong>FERC</strong> FORM NO. 1 (ED. 12-87) Page 422.9
Name of Respondent<br />
PACIFIC GAS AND ELECTRIC COMPANY<br />
This Report Is:<br />
(1) X An Original<br />
Date of Report<br />
(Mo, Da, Yr)<br />
(2) A Resubmission<br />
04/08/2011<br />
TRANSMISSION LINE STATISTICS<br />
Year/Period of Report<br />
End of <strong>2010</strong>/Q4<br />
1. Report information concerning transmission lines, cost of lines, <strong>and</strong> expenses for year. List each transmission line having nominal voltage of 132<br />
kilovolts or greater. Report transmission lines below these voltages in group totals only for each voltage.<br />
2. Transmission lines include all lines covered by the definition of transmission system plant as given in the Uniform System of Accounts. Do not report<br />
substation costs <strong>and</strong> expenses on this page.<br />
3. Report data by individual lines for all voltages if so required by a State commission.<br />
4. Exclude from this page any transmission lines for which plant costs are included in Account 121, Nonutility Property.<br />
5. Indicate whether the type of supporting structure reported in column (e) is: (1) single pole wood or steel; (2) H-frame wood, or steel poles; (3) tower;<br />
or (4) underground construction If a transmission line has more than one type of supporting structure, indicate the mileage of each type of construction<br />
by the use of brackets <strong>and</strong> extra lines. Minor portions of a transmission line of a different type of construction need not be distinguished from the<br />
remainder of the line.<br />
6. Report in columns (f) <strong>and</strong> (g) the total pole miles of each transmission line. Show in column (f) the pole miles of line on structures the cost of which is<br />
reported for the line designated; conversely, show in column (g) the pole miles of line on structures the cost of which is reported for another line. Report<br />
pole miles of line on leased or partly owned structures in column (g). In a footnote, explain the basis of such occupancy <strong>and</strong> state whether expenses with<br />
respect to such structures are included in the expenses reported for the line designated.<br />
Line<br />
No.<br />
1<br />
2<br />
DESIGNATION<br />
VOLTAGE (KV)<br />
(Indicate where<br />
Type of<br />
other than<br />
60 cycle, 3 phase)<br />
Supporting<br />
From<br />
To<br />
Operating Designed Structure<br />
(a) (b)<br />
(c)<br />
(d) (e)<br />
3 Tiger Creek Bellota #2<br />
4<br />
5 Tiger Creek Bellota #2<br />
6<br />
7 Tiger Creek Bellota #2<br />
8 U.S. Windpower Contra Costa-<br />
9 Sub Tesla #1<br />
10 Vac Dixon Vac Dixon<br />
11 Moraga Cir.#1 Moraga Cir. #1<br />
12 Vac Dixon Moraga Sub<br />
13 Moraga Cir.#2 Bus Structure<br />
14 Vac Dixon Contra Costa<br />
15 Sub #1<br />
16<br />
17<br />
18<br />
19<br />
20 Vac Dixon Contra Costa<br />
21 Power #2<br />
22<br />
23<br />
24<br />
25<br />
26 Vac Dixon- Peabody Sub<br />
27 Contra Costa<br />
28 #1 <strong>and</strong> 2<br />
29 Vac Dixon Lakeville<br />
30<br />
31 Vac Dixon Moraga #1<br />
32<br />
33<br />
34<br />
35 Vac Dixon Moraga #1<br />
LENGTH (Pole miles)<br />
(In the case of<br />
underground lines<br />
report circuit miles)<br />
On Structure On Structures<br />
of Line of Another<br />
Designated Line<br />
(f)<br />
(g)<br />
Number<br />
Of<br />
Circuits<br />
230.00 T<br />
1<br />
230.00 T<br />
1<br />
230.00 T<br />
1<br />
230.00 T<br />
1<br />
230.00 T<br />
2<br />
230.00 T<br />
1<br />
230.00 T<br />
1<br />
230.00 T<br />
1<br />
230.00 T<br />
2<br />
230.00 T<br />
2<br />
230.00 T<br />
1<br />
230.00 T<br />
1<br />
230.00 T<br />
1<br />
230.00 T<br />
1<br />
230.00 T<br />
1<br />
230.00 T<br />
1<br />
230.00 T<br />
1<br />
230.00 T<br />
1<br />
230.00 T<br />
1<br />
230.00 T<br />
2<br />
230.00 T<br />
2<br />
230.00 T<br />
2<br />
230.00 T<br />
2<br />
230.00 T<br />
1<br />
230.00 T<br />
1<br />
230.00 T<br />
1<br />
230.00 T<br />
1<br />
(h)<br />
36 TOTAL 15,001.28 3,581.60 378<br />
<strong>FERC</strong> FORM NO. 1 (ED. 12-87) Page 422.10
Name of Respondent<br />
PACIFIC GAS AND ELECTRIC COMPANY<br />
This Report Is:<br />
(1) X An Original<br />
Date of Report<br />
(Mo, Da, Yr)<br />
(2) A Resubmission<br />
04/08/2011<br />
TRANSMISSION LINE STATISTICS<br />
Year/Period of Report<br />
End of <strong>2010</strong>/Q4<br />
1. Report information concerning transmission lines, cost of lines, <strong>and</strong> expenses for year. List each transmission line having nominal voltage of 132<br />
kilovolts or greater. Report transmission lines below these voltages in group totals only for each voltage.<br />
2. Transmission lines include all lines covered by the definition of transmission system plant as given in the Uniform System of Accounts. Do not report<br />
substation costs <strong>and</strong> expenses on this page.<br />
3. Report data by individual lines for all voltages if so required by a State commission.<br />
4. Exclude from this page any transmission lines for which plant costs are included in Account 121, Nonutility Property.<br />
5. Indicate whether the type of supporting structure reported in column (e) is: (1) single pole wood or steel; (2) H-frame wood, or steel poles; (3) tower;<br />
or (4) underground construction If a transmission line has more than one type of supporting structure, indicate the mileage of each type of construction<br />
by the use of brackets <strong>and</strong> extra lines. Minor portions of a transmission line of a different type of construction need not be distinguished from the<br />
remainder of the line.<br />
6. Report in columns (f) <strong>and</strong> (g) the total pole miles of each transmission line. Show in column (f) the pole miles of line on structures the cost of which is<br />
reported for the line designated; conversely, show in column (g) the pole miles of line on structures the cost of which is reported for another line. Report<br />
pole miles of line on leased or partly owned structures in column (g). In a footnote, explain the basis of such occupancy <strong>and</strong> state whether expenses with<br />
respect to such structures are included in the expenses reported for the line designated.<br />
Line<br />
No.<br />
1<br />
2<br />
DESIGNATION<br />
VOLTAGE (KV)<br />
(Indicate where<br />
Type of<br />
other than<br />
60 cycle, 3 phase)<br />
Supporting<br />
From<br />
To<br />
Operating Designed Structure<br />
(a) (b)<br />
(c)<br />
(d) (e)<br />
3 Vac Dixon Moraga #2<br />
4<br />
5<br />
6<br />
7 Vac Dixon Telsa<br />
8<br />
9 Walnut (TID) Los Banos<br />
10<br />
11<br />
12<br />
13 Newark Los Esteros<br />
14 Los Esteros Metcalf<br />
15 Newark Los Esteros<br />
16 Los Esteros Metcalf<br />
17 Cayetano Vineyard<br />
18 Vineyard Newark<br />
19 Contra Costa Cayetano<br />
20 Cayetano Vineyard<br />
21 North Dublin Substat North Dublin Trans<br />
22 Jefferson Martin<br />
23 Birds L<strong>and</strong>ing Switch High Winds Sub<br />
24 North Dublin Substation Cayetano<br />
25 North Dublin Substation Vineyard<br />
26 Shiloh II Birds L<strong>and</strong>ing Sw Sta<br />
27 Panoche Energy Center Panoche Sub<br />
28<br />
29<br />
30<br />
31<br />
32<br />
33<br />
34<br />
35<br />
LENGTH (Pole miles)<br />
(In the case of<br />
underground lines<br />
report circuit miles)<br />
On Structure On Structures<br />
of Line of Another<br />
Designated Line<br />
(f)<br />
(g)<br />
Number<br />
Of<br />
Circuits<br />
230.00 T<br />
2<br />
230.00 T<br />
1<br />
230.00 T<br />
1<br />
230.00 T<br />
1<br />
500.00 T<br />
1<br />
500.00 T<br />
1<br />
230.00 T<br />
2<br />
230.00 T<br />
2<br />
230.00 T<br />
1<br />
230.00 T<br />
1<br />
230.00 P<br />
2<br />
230.00<br />
P<br />
230.00 UG Duct Bank<br />
1<br />
230.00 UG Duct Bank<br />
1<br />
230.00 UG Duct Bank<br />
2<br />
230.00 UG Duct Bank<br />
2<br />
230.00 UG Duct Bank<br />
2<br />
230.00 UG Duct Bank<br />
2<br />
230.00 T<br />
2<br />
230.00 P<br />
2<br />
230.00 P<br />
1<br />
230.00 UG Duct Bank<br />
1<br />
230.00 UG Duct Bank<br />
1<br />
230.00 P<br />
1<br />
230.00 P<br />
1<br />
(h)<br />
36 TOTAL 15,001.28 3,581.60 378<br />
<strong>FERC</strong> FORM NO. 1 (ED. 12-87) Page 422.11
Name of Respondent<br />
PACIFIC GAS AND ELECTRIC COMPANY<br />
This Report Is:<br />
(1) X An Original<br />
Date of Report<br />
(Mo, Da, Yr)<br />
(2) A Resubmission<br />
04/08/2011<br />
TRANSMISSION LINE STATISTICS<br />
Year/Period of Report<br />
End of <strong>2010</strong>/Q4<br />
1. Report information concerning transmission lines, cost of lines, <strong>and</strong> expenses for year. List each transmission line having nominal voltage of 132<br />
kilovolts or greater. Report transmission lines below these voltages in group totals only for each voltage.<br />
2. Transmission lines include all lines covered by the definition of transmission system plant as given in the Uniform System of Accounts. Do not report<br />
substation costs <strong>and</strong> expenses on this page.<br />
3. Report data by individual lines for all voltages if so required by a State commission.<br />
4. Exclude from this page any transmission lines for which plant costs are included in Account 121, Nonutility Property.<br />
5. Indicate whether the type of supporting structure reported in column (e) is: (1) single pole wood or steel; (2) H-frame wood, or steel poles; (3) tower;<br />
or (4) underground construction If a transmission line has more than one type of supporting structure, indicate the mileage of each type of construction<br />
by the use of brackets <strong>and</strong> extra lines. Minor portions of a transmission line of a different type of construction need not be distinguished from the<br />
remainder of the line.<br />
6. Report in columns (f) <strong>and</strong> (g) the total pole miles of each transmission line. Show in column (f) the pole miles of line on structures the cost of which is<br />
reported for the line designated; conversely, show in column (g) the pole miles of line on structures the cost of which is reported for another line. Report<br />
pole miles of line on leased or partly owned structures in column (g). In a footnote, explain the basis of such occupancy <strong>and</strong> state whether expenses with<br />
respect to such structures are included in the expenses reported for the line designated.<br />
Line<br />
No.<br />
1<br />
2<br />
3<br />
4 Summary of Lines<br />
5 listed individually<br />
6<br />
7 Other lines on tower<br />
8<br />
9<br />
10<br />
11 Other lines on poles<br />
12<br />
13<br />
14<br />
15<br />
16 Other Underground<br />
17 Transmission Lines<br />
18<br />
19<br />
20<br />
21 Transmission Roads<br />
22 <strong>and</strong> Trails<br />
23<br />
24<br />
25<br />
26<br />
27<br />
28<br />
29<br />
30<br />
31<br />
32<br />
33<br />
34<br />
35<br />
DESIGNATION<br />
VOLTAGE (KV)<br />
(Indicate where<br />
Type of<br />
other than<br />
60 cycle, 3 phase)<br />
Supporting<br />
From<br />
To<br />
Operating Designed Structure<br />
(a) (b)<br />
(c)<br />
(d) (e)<br />
LENGTH (Pole miles)<br />
(In the case of<br />
underground lines<br />
report circuit miles)<br />
On Structure On Structures<br />
of Line of Another<br />
Designated Line<br />
(f)<br />
(g)<br />
500.00 1,327.63<br />
230.00 3,187.80 2,226.68<br />
115.00 1,956.13 1,162.58<br />
70.00 37.88<br />
20.81<br />
60.00 162.29<br />
72.91<br />
230.00<br />
115.00 2,982.30<br />
28.62<br />
70.00 1,534.79<br />
15.04<br />
60.00 3,723.93<br />
54.96<br />
230.00<br />
115.00 83.69<br />
60.00 4.40<br />
70.00 0.44<br />
Number<br />
Of<br />
Circuits<br />
(h)<br />
36 TOTAL 15,001.28 3,581.60 378<br />
<strong>FERC</strong> FORM NO. 1 (ED. 12-87) Page 422.12
Name of Respondent<br />
PACIFIC GAS AND ELECTRIC COMPANY<br />
This Report Is:<br />
Date of Report<br />
(1) X An Original<br />
(Mo, Da, Yr)<br />
(2) A Resubmission<br />
04/08/2011<br />
TRANSMISSION LINE STATISTICS (Continued)<br />
Year/Period of Report<br />
End of <strong>2010</strong>/Q4<br />
7. Do not report the same transmission line structure twice. Report Lower voltage Lines <strong>and</strong> higher voltage lines as one line. Designate in a footnote if<br />
you do not include Lower voltage lines with higher voltage lines. If two or more transmission line structures support lines of the same voltage, report the<br />
pole miles of the primary structure in column (f) <strong>and</strong> the pole miles of the other line(s) in column (g)<br />
8. Designate any transmission line or portion thereof for which the respondent is not the sole owner. If such property is leased from another company,<br />
give name of lessor, date <strong>and</strong> terms of Lease, <strong>and</strong> amount of rent for year. For any transmission line other than a leased line, or portion thereof, for<br />
which the respondent is not the sole owner but which the respondent operates or shares in the operation of, furnish a succinct statement explaining the<br />
arrangement <strong>and</strong> giving particulars (details) of such matters as percent ownership by respondent in the line, name of co-owner, basis of sharing<br />
expenses of the Line, <strong>and</strong> how the expenses borne by the respondent are accounted for, <strong>and</strong> accounts affected. Specify whether lessor, co-owner, or<br />
other party is an associated company.<br />
9. Designate any transmission line leased to another company <strong>and</strong> give name of Lessee, date <strong>and</strong> terms of lease, annual rent for year, <strong>and</strong> how<br />
determined. Specify whether lessee is an associated company.<br />
10. Base the plant cost figures called for in columns (j) to (l) on the book cost at end of year.<br />
COST OF LINE (Include in Column (j) L<strong>and</strong>,<br />
EXPENSES, EXCEPT DEPRECIATION AND TAXES<br />
Size of L<strong>and</strong> rights, <strong>and</strong> clearing right-of-way)<br />
Conductor<br />
<strong>and</strong> Material<br />
L<strong>and</strong> Construction <strong>and</strong> Total Cost Operation Maintenance Rents Total<br />
Other Costs<br />
Expenses Expenses<br />
Expenses<br />
(i) (j) (k) (l) (m) (n) (o) (p)<br />
1<br />
1113AAC 2<br />
3<br />
4<br />
2300AL 5<br />
2156SSAC 6<br />
7<br />
8<br />
AL2300 9<br />
10<br />
795ACSR 11<br />
954AL 12<br />
795ACSR 13<br />
954AL 14<br />
795ACSR 15<br />
16<br />
17<br />
795ACSR 18<br />
500CU 19<br />
650CU 20<br />
795ACSR 21<br />
1113AL 22<br />
500CU 23<br />
795ACSR 24<br />
1113AL 25<br />
954SSAC 26<br />
954SSAC 27<br />
954SSAC 28<br />
954SSAC 29<br />
795ACSR 30<br />
1113AL 31<br />
795ACSR 32<br />
795ACSR 33<br />
1113AL 34<br />
954AL 35<br />
Line<br />
No.<br />
176,807,153 2,554,358,239 2,731,165,392 42,783,516 36,213,061 78,996,577 36<br />
<strong>FERC</strong> FORM NO. 1 (ED. 12-87) Page 423
Name of Respondent<br />
PACIFIC GAS AND ELECTRIC COMPANY<br />
This Report Is:<br />
Date of Report<br />
(1) X An Original<br />
(Mo, Da, Yr)<br />
(2) A Resubmission<br />
04/08/2011<br />
TRANSMISSION LINE STATISTICS (Continued)<br />
Year/Period of Report<br />
End of <strong>2010</strong>/Q4<br />
7. Do not report the same transmission line structure twice. Report Lower voltage Lines <strong>and</strong> higher voltage lines as one line. Designate in a footnote if<br />
you do not include Lower voltage lines with higher voltage lines. If two or more transmission line structures support lines of the same voltage, report the<br />
pole miles of the primary structure in column (f) <strong>and</strong> the pole miles of the other line(s) in column (g)<br />
8. Designate any transmission line or portion thereof for which the respondent is not the sole owner. If such property is leased from another company,<br />
give name of lessor, date <strong>and</strong> terms of Lease, <strong>and</strong> amount of rent for year. For any transmission line other than a leased line, or portion thereof, for<br />
which the respondent is not the sole owner but which the respondent operates or shares in the operation of, furnish a succinct statement explaining the<br />
arrangement <strong>and</strong> giving particulars (details) of such matters as percent ownership by respondent in the line, name of co-owner, basis of sharing<br />
expenses of the Line, <strong>and</strong> how the expenses borne by the respondent are accounted for, <strong>and</strong> accounts affected. Specify whether lessor, co-owner, or<br />
other party is an associated company.<br />
9. Designate any transmission line leased to another company <strong>and</strong> give name of Lessee, date <strong>and</strong> terms of lease, annual rent for year, <strong>and</strong> how<br />
determined. Specify whether lessee is an associated company.<br />
10. Base the plant cost figures called for in columns (j) to (l) on the book cost at end of year.<br />
COST OF LINE (Include in Column (j) L<strong>and</strong>,<br />
EXPENSES, EXCEPT DEPRECIATION AND TAXES<br />
Size of L<strong>and</strong> rights, <strong>and</strong> clearing right-of-way)<br />
Conductor<br />
<strong>and</strong> Material<br />
L<strong>and</strong> Construction <strong>and</strong> Total Cost Operation Maintenance Rents Total<br />
Other Costs<br />
Expenses Expenses<br />
Expenses<br />
(i) (j) (k) (l) (m) (n) (o) (p)<br />
1113AL 1<br />
1113AL 2<br />
3<br />
4<br />
2300AL 5<br />
1113AL 6<br />
3500AL 7<br />
2300AL 8<br />
1113AL 9<br />
10<br />
2156SSAC 11<br />
12<br />
13<br />
14<br />
795ACSR 15<br />
16<br />
954ACSR 17<br />
795ACSR 18<br />
1113AL 19<br />
20<br />
1113AL 21<br />
954ACSR 22<br />
1113AL 23<br />
1113AL 24<br />
25<br />
954ACSR 26<br />
27<br />
28<br />
1113AL 29<br />
1113AL 30<br />
1113AL 31<br />
954ACSR 32<br />
2300AL 33<br />
954ACSR 34<br />
1113AL 35<br />
Line<br />
No.<br />
176,807,153 2,554,358,239 2,731,165,392 42,783,516 36,213,061 78,996,577 36<br />
<strong>FERC</strong> FORM NO. 1 (ED. 12-87) Page 423.1
Name of Respondent<br />
PACIFIC GAS AND ELECTRIC COMPANY<br />
This Report Is:<br />
Date of Report<br />
(1) X An Original<br />
(Mo, Da, Yr)<br />
(2) A Resubmission<br />
04/08/2011<br />
TRANSMISSION LINE STATISTICS (Continued)<br />
Year/Period of Report<br />
End of <strong>2010</strong>/Q4<br />
7. Do not report the same transmission line structure twice. Report Lower voltage Lines <strong>and</strong> higher voltage lines as one line. Designate in a footnote if<br />
you do not include Lower voltage lines with higher voltage lines. If two or more transmission line structures support lines of the same voltage, report the<br />
pole miles of the primary structure in column (f) <strong>and</strong> the pole miles of the other line(s) in column (g)<br />
8. Designate any transmission line or portion thereof for which the respondent is not the sole owner. If such property is leased from another company,<br />
give name of lessor, date <strong>and</strong> terms of Lease, <strong>and</strong> amount of rent for year. For any transmission line other than a leased line, or portion thereof, for<br />
which the respondent is not the sole owner but which the respondent operates or shares in the operation of, furnish a succinct statement explaining the<br />
arrangement <strong>and</strong> giving particulars (details) of such matters as percent ownership by respondent in the line, name of co-owner, basis of sharing<br />
expenses of the Line, <strong>and</strong> how the expenses borne by the respondent are accounted for, <strong>and</strong> accounts affected. Specify whether lessor, co-owner, or<br />
other party is an associated company.<br />
9. Designate any transmission line leased to another company <strong>and</strong> give name of Lessee, date <strong>and</strong> terms of lease, annual rent for year, <strong>and</strong> how<br />
determined. Specify whether lessee is an associated company.<br />
10. Base the plant cost figures called for in columns (j) to (l) on the book cost at end of year.<br />
COST OF LINE (Include in Column (j) L<strong>and</strong>,<br />
EXPENSES, EXCEPT DEPRECIATION AND TAXES<br />
Size of L<strong>and</strong> rights, <strong>and</strong> clearing right-of-way)<br />
Conductor<br />
<strong>and</strong> Material<br />
L<strong>and</strong> Construction <strong>and</strong> Total Cost Operation Maintenance Rents Total<br />
Other Costs<br />
Expenses Expenses<br />
Expenses<br />
(i) (j) (k) (l) (m) (n) (o) (p)<br />
954ACSR 1<br />
954ACSR 2<br />
954ACSR 3<br />
954ACSR 4<br />
954ACSR 5<br />
1113AL 6<br />
2300AL 7<br />
1113AL 8<br />
2300AL 9<br />
2300AL 10<br />
2300AL 11<br />
2300AL 12<br />
1113AL 13<br />
1113AL 14<br />
1113AL 15<br />
1113AL 16<br />
1113AL 17<br />
795ACSR 18<br />
1113AL 19<br />
795ACSR 20<br />
795ACSR 21<br />
795ACSR 22<br />
1113AL 23<br />
24<br />
25<br />
1431AL 26<br />
27<br />
1113AL 28<br />
1113AL 29<br />
30<br />
1113AL 31<br />
32<br />
1113AL 33<br />
34<br />
1113AL 35<br />
Line<br />
No.<br />
176,807,153 2,554,358,239 2,731,165,392 42,783,516 36,213,061 78,996,577 36<br />
<strong>FERC</strong> FORM NO. 1 (ED. 12-87) Page 423.2
Name of Respondent<br />
PACIFIC GAS AND ELECTRIC COMPANY<br />
This Report Is:<br />
Date of Report<br />
(1) X An Original<br />
(Mo, Da, Yr)<br />
(2) A Resubmission<br />
04/08/2011<br />
TRANSMISSION LINE STATISTICS (Continued)<br />
Year/Period of Report<br />
End of <strong>2010</strong>/Q4<br />
7. Do not report the same transmission line structure twice. Report Lower voltage Lines <strong>and</strong> higher voltage lines as one line. Designate in a footnote if<br />
you do not include Lower voltage lines with higher voltage lines. If two or more transmission line structures support lines of the same voltage, report the<br />
pole miles of the primary structure in column (f) <strong>and</strong> the pole miles of the other line(s) in column (g)<br />
8. Designate any transmission line or portion thereof for which the respondent is not the sole owner. If such property is leased from another company,<br />
give name of lessor, date <strong>and</strong> terms of Lease, <strong>and</strong> amount of rent for year. For any transmission line other than a leased line, or portion thereof, for<br />
which the respondent is not the sole owner but which the respondent operates or shares in the operation of, furnish a succinct statement explaining the<br />
arrangement <strong>and</strong> giving particulars (details) of such matters as percent ownership by respondent in the line, name of co-owner, basis of sharing<br />
expenses of the Line, <strong>and</strong> how the expenses borne by the respondent are accounted for, <strong>and</strong> accounts affected. Specify whether lessor, co-owner, or<br />
other party is an associated company.<br />
9. Designate any transmission line leased to another company <strong>and</strong> give name of Lessee, date <strong>and</strong> terms of lease, annual rent for year, <strong>and</strong> how<br />
determined. Specify whether lessee is an associated company.<br />
10. Base the plant cost figures called for in columns (j) to (l) on the book cost at end of year.<br />
COST OF LINE (Include in Column (j) L<strong>and</strong>,<br />
EXPENSES, EXCEPT DEPRECIATION AND TAXES<br />
Size of L<strong>and</strong> rights, <strong>and</strong> clearing right-of-way)<br />
Conductor<br />
<strong>and</strong> Material<br />
L<strong>and</strong> Construction <strong>and</strong> Total Cost Operation Maintenance Rents Total<br />
Other Costs<br />
Expenses Expenses<br />
Expenses<br />
(i) (j) (k) (l) (m) (n) (o) (p)<br />
1<br />
1113AL 2<br />
3<br />
4<br />
5<br />
6<br />
1431AL 7<br />
3500AL 8<br />
9<br />
10<br />
11<br />
1113AL 12<br />
1113AL 13<br />
1113AL 14<br />
15<br />
16<br />
17<br />
1113AL 18<br />
19<br />
20<br />
21<br />
1113AL 22<br />
794ACSR 23<br />
1113AL 24<br />
25<br />
1250 OFPA 26<br />
Pipe type 27<br />
28<br />
1113AL 29<br />
1113AL 30<br />
1271ACSR 31<br />
32<br />
33<br />
1250 OFP 34<br />
Pipe type 35<br />
Line<br />
No.<br />
176,807,153 2,554,358,239 2,731,165,392 42,783,516 36,213,061 78,996,577 36<br />
<strong>FERC</strong> FORM NO. 1 (ED. 12-87) Page 423.3
Name of Respondent<br />
PACIFIC GAS AND ELECTRIC COMPANY<br />
This Report Is:<br />
Date of Report<br />
(1) X An Original<br />
(Mo, Da, Yr)<br />
(2) A Resubmission<br />
04/08/2011<br />
TRANSMISSION LINE STATISTICS (Continued)<br />
Year/Period of Report<br />
End of <strong>2010</strong>/Q4<br />
7. Do not report the same transmission line structure twice. Report Lower voltage Lines <strong>and</strong> higher voltage lines as one line. Designate in a footnote if<br />
you do not include Lower voltage lines with higher voltage lines. If two or more transmission line structures support lines of the same voltage, report the<br />
pole miles of the primary structure in column (f) <strong>and</strong> the pole miles of the other line(s) in column (g)<br />
8. Designate any transmission line or portion thereof for which the respondent is not the sole owner. If such property is leased from another company,<br />
give name of lessor, date <strong>and</strong> terms of Lease, <strong>and</strong> amount of rent for year. For any transmission line other than a leased line, or portion thereof, for<br />
which the respondent is not the sole owner but which the respondent operates or shares in the operation of, furnish a succinct statement explaining the<br />
arrangement <strong>and</strong> giving particulars (details) of such matters as percent ownership by respondent in the line, name of co-owner, basis of sharing<br />
expenses of the Line, <strong>and</strong> how the expenses borne by the respondent are accounted for, <strong>and</strong> accounts affected. Specify whether lessor, co-owner, or<br />
other party is an associated company.<br />
9. Designate any transmission line leased to another company <strong>and</strong> give name of Lessee, date <strong>and</strong> terms of lease, annual rent for year, <strong>and</strong> how<br />
determined. Specify whether lessee is an associated company.<br />
10. Base the plant cost figures called for in columns (j) to (l) on the book cost at end of year.<br />
COST OF LINE (Include in Column (j) L<strong>and</strong>,<br />
EXPENSES, EXCEPT DEPRECIATION AND TAXES<br />
Size of L<strong>and</strong> rights, <strong>and</strong> clearing right-of-way)<br />
Conductor<br />
<strong>and</strong> Material<br />
L<strong>and</strong> Construction <strong>and</strong> Total Cost Operation Maintenance Rents Total<br />
Other Costs<br />
Expenses Expenses<br />
Expenses<br />
(i) (j) (k) (l) (m) (n) (o) (p)<br />
795ACSR 1<br />
1113AL 2<br />
3<br />
1113AL 4<br />
5<br />
1113AL 6<br />
7<br />
8<br />
1113AL 9<br />
1852ACSR 10<br />
3500AL 11<br />
2300AL 12<br />
1113AL 13<br />
1113AL 14<br />
1113AL 15<br />
16<br />
2500HPCU 17<br />
18<br />
19<br />
2500CU 20<br />
21<br />
2500CU 22<br />
23<br />
1113AL 24<br />
1113AL 25<br />
1113AL 26<br />
2300AL 27<br />
795ACSR 28<br />
795ACSR 29<br />
1113AL 30<br />
795ACSR 31<br />
795ACSR 32<br />
1113AL 33<br />
1113AL 34<br />
35<br />
Line<br />
No.<br />
176,807,153 2,554,358,239 2,731,165,392 42,783,516 36,213,061 78,996,577 36<br />
<strong>FERC</strong> FORM NO. 1 (ED. 12-87) Page 423.4
Name of Respondent<br />
PACIFIC GAS AND ELECTRIC COMPANY<br />
This Report Is:<br />
Date of Report<br />
(1) X An Original<br />
(Mo, Da, Yr)<br />
(2) A Resubmission<br />
04/08/2011<br />
TRANSMISSION LINE STATISTICS (Continued)<br />
Year/Period of Report<br />
End of <strong>2010</strong>/Q4<br />
7. Do not report the same transmission line structure twice. Report Lower voltage Lines <strong>and</strong> higher voltage lines as one line. Designate in a footnote if<br />
you do not include Lower voltage lines with higher voltage lines. If two or more transmission line structures support lines of the same voltage, report the<br />
pole miles of the primary structure in column (f) <strong>and</strong> the pole miles of the other line(s) in column (g)<br />
8. Designate any transmission line or portion thereof for which the respondent is not the sole owner. If such property is leased from another company,<br />
give name of lessor, date <strong>and</strong> terms of Lease, <strong>and</strong> amount of rent for year. For any transmission line other than a leased line, or portion thereof, for<br />
which the respondent is not the sole owner but which the respondent operates or shares in the operation of, furnish a succinct statement explaining the<br />
arrangement <strong>and</strong> giving particulars (details) of such matters as percent ownership by respondent in the line, name of co-owner, basis of sharing<br />
expenses of the Line, <strong>and</strong> how the expenses borne by the respondent are accounted for, <strong>and</strong> accounts affected. Specify whether lessor, co-owner, or<br />
other party is an associated company.<br />
9. Designate any transmission line leased to another company <strong>and</strong> give name of Lessee, date <strong>and</strong> terms of lease, annual rent for year, <strong>and</strong> how<br />
determined. Specify whether lessee is an associated company.<br />
10. Base the plant cost figures called for in columns (j) to (l) on the book cost at end of year.<br />
COST OF LINE (Include in Column (j) L<strong>and</strong>,<br />
EXPENSES, EXCEPT DEPRECIATION AND TAXES<br />
Size of L<strong>and</strong> rights, <strong>and</strong> clearing right-of-way)<br />
Conductor<br />
<strong>and</strong> Material<br />
L<strong>and</strong> Construction <strong>and</strong> Total Cost Operation Maintenance Rents Total<br />
Other Costs<br />
Expenses Expenses<br />
Expenses<br />
(i) (j) (k) (l) (m) (n) (o) (p)<br />
1<br />
1113AL 2<br />
3<br />
1113AL 4<br />
1113AL 5<br />
6<br />
795ACSR 7<br />
795ACSR 8<br />
1113AL 9<br />
1113AL 10<br />
2300AL 11<br />
12<br />
1113AL 13<br />
1113AL 14<br />
15<br />
795ACSR 16<br />
1113AL 17<br />
1113AL 18<br />
19<br />
1113AL 20<br />
21<br />
22<br />
1113AL 23<br />
24<br />
25<br />
1113AL 26<br />
27<br />
1113AL 28<br />
1113AL 29<br />
954ACSR 30<br />
954ACSR 31<br />
1113AL 32<br />
954ACSR 33<br />
795ACSR 34<br />
1113AL 35<br />
Line<br />
No.<br />
176,807,153 2,554,358,239 2,731,165,392 42,783,516 36,213,061 78,996,577 36<br />
<strong>FERC</strong> FORM NO. 1 (ED. 12-87) Page 423.5
Name of Respondent<br />
PACIFIC GAS AND ELECTRIC COMPANY<br />
This Report Is:<br />
Date of Report<br />
(1) X An Original<br />
(Mo, Da, Yr)<br />
(2) A Resubmission<br />
04/08/2011<br />
TRANSMISSION LINE STATISTICS (Continued)<br />
Year/Period of Report<br />
End of <strong>2010</strong>/Q4<br />
7. Do not report the same transmission line structure twice. Report Lower voltage Lines <strong>and</strong> higher voltage lines as one line. Designate in a footnote if<br />
you do not include Lower voltage lines with higher voltage lines. If two or more transmission line structures support lines of the same voltage, report the<br />
pole miles of the primary structure in column (f) <strong>and</strong> the pole miles of the other line(s) in column (g)<br />
8. Designate any transmission line or portion thereof for which the respondent is not the sole owner. If such property is leased from another company,<br />
give name of lessor, date <strong>and</strong> terms of Lease, <strong>and</strong> amount of rent for year. For any transmission line other than a leased line, or portion thereof, for<br />
which the respondent is not the sole owner but which the respondent operates or shares in the operation of, furnish a succinct statement explaining the<br />
arrangement <strong>and</strong> giving particulars (details) of such matters as percent ownership by respondent in the line, name of co-owner, basis of sharing<br />
expenses of the Line, <strong>and</strong> how the expenses borne by the respondent are accounted for, <strong>and</strong> accounts affected. Specify whether lessor, co-owner, or<br />
other party is an associated company.<br />
9. Designate any transmission line leased to another company <strong>and</strong> give name of Lessee, date <strong>and</strong> terms of lease, annual rent for year, <strong>and</strong> how<br />
determined. Specify whether lessee is an associated company.<br />
10. Base the plant cost figures called for in columns (j) to (l) on the book cost at end of year.<br />
COST OF LINE (Include in Column (j) L<strong>and</strong>,<br />
EXPENSES, EXCEPT DEPRECIATION AND TAXES<br />
Size of L<strong>and</strong> rights, <strong>and</strong> clearing right-of-way)<br />
Conductor<br />
<strong>and</strong> Material<br />
L<strong>and</strong> Construction <strong>and</strong> Total Cost Operation Maintenance Rents Total<br />
Other Costs<br />
Expenses Expenses<br />
Expenses<br />
(i) (j) (k) (l) (m) (n) (o) (p)<br />
1113AL 1<br />
1113AL 2<br />
1113AL 3<br />
1113AL 4<br />
1113AL 5<br />
2300AL 6<br />
795ACSR 7<br />
2300AL 8<br />
795ACSR 9<br />
10<br />
2300AL 11<br />
2300AL 12<br />
2300AL 13<br />
1113AL 14<br />
1113AL 15<br />
1113AL 16<br />
1113AL 17<br />
1113AL 18<br />
795ACSR 19<br />
1113AL 20<br />
954ACSR 21<br />
954AL 22<br />
954AL 23<br />
954ACSR 24<br />
1113AL 25<br />
1113AL 26<br />
954AL 27<br />
2300AL 28<br />
954AL 29<br />
1113AL 30<br />
1113AL 31<br />
954AL 32<br />
795ACSR 33<br />
1113AL 34<br />
35<br />
Line<br />
No.<br />
176,807,153 2,554,358,239 2,731,165,392 42,783,516 36,213,061 78,996,577 36<br />
<strong>FERC</strong> FORM NO. 1 (ED. 12-87) Page 423.6
Name of Respondent<br />
PACIFIC GAS AND ELECTRIC COMPANY<br />
This Report Is:<br />
Date of Report<br />
(1) X An Original<br />
(Mo, Da, Yr)<br />
(2) A Resubmission<br />
04/08/2011<br />
TRANSMISSION LINE STATISTICS (Continued)<br />
Year/Period of Report<br />
End of <strong>2010</strong>/Q4<br />
7. Do not report the same transmission line structure twice. Report Lower voltage Lines <strong>and</strong> higher voltage lines as one line. Designate in a footnote if<br />
you do not include Lower voltage lines with higher voltage lines. If two or more transmission line structures support lines of the same voltage, report the<br />
pole miles of the primary structure in column (f) <strong>and</strong> the pole miles of the other line(s) in column (g)<br />
8. Designate any transmission line or portion thereof for which the respondent is not the sole owner. If such property is leased from another company,<br />
give name of lessor, date <strong>and</strong> terms of Lease, <strong>and</strong> amount of rent for year. For any transmission line other than a leased line, or portion thereof, for<br />
which the respondent is not the sole owner but which the respondent operates or shares in the operation of, furnish a succinct statement explaining the<br />
arrangement <strong>and</strong> giving particulars (details) of such matters as percent ownership by respondent in the line, name of co-owner, basis of sharing<br />
expenses of the Line, <strong>and</strong> how the expenses borne by the respondent are accounted for, <strong>and</strong> accounts affected. Specify whether lessor, co-owner, or<br />
other party is an associated company.<br />
9. Designate any transmission line leased to another company <strong>and</strong> give name of Lessee, date <strong>and</strong> terms of lease, annual rent for year, <strong>and</strong> how<br />
determined. Specify whether lessee is an associated company.<br />
10. Base the plant cost figures called for in columns (j) to (l) on the book cost at end of year.<br />
COST OF LINE (Include in Column (j) L<strong>and</strong>,<br />
EXPENSES, EXCEPT DEPRECIATION AND TAXES<br />
Size of L<strong>and</strong> rights, <strong>and</strong> clearing right-of-way)<br />
Conductor<br />
<strong>and</strong> Material<br />
L<strong>and</strong> Construction <strong>and</strong> Total Cost Operation Maintenance Rents Total<br />
Other Costs<br />
Expenses Expenses<br />
Expenses<br />
(i) (j) (k) (l) (m) (n) (o) (p)<br />
1<br />
795ACSR 2<br />
1113AL 3<br />
954ACSR 4<br />
5<br />
954AL 6<br />
795ACSR 7<br />
795ACSR 8<br />
643.7CU 9<br />
518ACSR 10<br />
11<br />
954ACSR 12<br />
954AL 13<br />
795ACSR 14<br />
643.7CU 15<br />
518ACSR 16<br />
518ACSR 17<br />
500CU 18<br />
795ACSR 19<br />
795ACSR 20<br />
380.5CU 21<br />
380.5CU 22<br />
518ACSR 23<br />
1113AL 24<br />
25<br />
518ACSR 26<br />
795ACSR 27<br />
795ACSR 28<br />
380.5CU 29<br />
380.5CU 30<br />
380.5CU 31<br />
380.5CU 32<br />
1113AL 33<br />
1113AL 34<br />
1113AL 35<br />
Line<br />
No.<br />
176,807,153 2,554,358,239 2,731,165,392 42,783,516 36,213,061 78,996,577 36<br />
<strong>FERC</strong> FORM NO. 1 (ED. 12-87) Page 423.7
Name of Respondent<br />
PACIFIC GAS AND ELECTRIC COMPANY<br />
This Report Is:<br />
Date of Report<br />
(1) X An Original<br />
(Mo, Da, Yr)<br />
(2) A Resubmission<br />
04/08/2011<br />
TRANSMISSION LINE STATISTICS (Continued)<br />
Year/Period of Report<br />
End of <strong>2010</strong>/Q4<br />
7. Do not report the same transmission line structure twice. Report Lower voltage Lines <strong>and</strong> higher voltage lines as one line. Designate in a footnote if<br />
you do not include Lower voltage lines with higher voltage lines. If two or more transmission line structures support lines of the same voltage, report the<br />
pole miles of the primary structure in column (f) <strong>and</strong> the pole miles of the other line(s) in column (g)<br />
8. Designate any transmission line or portion thereof for which the respondent is not the sole owner. If such property is leased from another company,<br />
give name of lessor, date <strong>and</strong> terms of Lease, <strong>and</strong> amount of rent for year. For any transmission line other than a leased line, or portion thereof, for<br />
which the respondent is not the sole owner but which the respondent operates or shares in the operation of, furnish a succinct statement explaining the<br />
arrangement <strong>and</strong> giving particulars (details) of such matters as percent ownership by respondent in the line, name of co-owner, basis of sharing<br />
expenses of the Line, <strong>and</strong> how the expenses borne by the respondent are accounted for, <strong>and</strong> accounts affected. Specify whether lessor, co-owner, or<br />
other party is an associated company.<br />
9. Designate any transmission line leased to another company <strong>and</strong> give name of Lessee, date <strong>and</strong> terms of lease, annual rent for year, <strong>and</strong> how<br />
determined. Specify whether lessee is an associated company.<br />
10. Base the plant cost figures called for in columns (j) to (l) on the book cost at end of year.<br />
COST OF LINE (Include in Column (j) L<strong>and</strong>,<br />
EXPENSES, EXCEPT DEPRECIATION AND TAXES<br />
Size of L<strong>and</strong> rights, <strong>and</strong> clearing right-of-way)<br />
Conductor<br />
<strong>and</strong> Material<br />
L<strong>and</strong> Construction <strong>and</strong> Total Cost Operation Maintenance Rents Total<br />
Other Costs<br />
Expenses Expenses<br />
Expenses<br />
(i) (j) (k) (l) (m) (n) (o) (p)<br />
1<br />
1113AL 2<br />
1113AL 3<br />
1113AL 4<br />
795ACSR 5<br />
795ACSR 6<br />
7<br />
795ACSR 8<br />
9<br />
1113AL 10<br />
11<br />
715.5ACS 12<br />
13<br />
14<br />
2300AL 15<br />
954AL 16<br />
1113AL 17<br />
1113AL 18<br />
795ACSR 19<br />
1113AL 20<br />
1113AL 21<br />
1113AL 22<br />
795ACSR 23<br />
1113AL 24<br />
1113AL 25<br />
1113AL 26<br />
1113 27<br />
28<br />
795ACSR 29<br />
795ACSR 30<br />
795ACSR 31<br />
795ACSR 32<br />
1825ACSR 33<br />
2300AL 34<br />
1825ACSR 35<br />
Line<br />
No.<br />
176,807,153 2,554,358,239 2,731,165,392 42,783,516 36,213,061 78,996,577 36<br />
<strong>FERC</strong> FORM NO. 1 (ED. 12-87) Page 423.8
Name of Respondent<br />
PACIFIC GAS AND ELECTRIC COMPANY<br />
This Report Is:<br />
Date of Report<br />
(1) X An Original<br />
(Mo, Da, Yr)<br />
(2) A Resubmission<br />
04/08/2011<br />
TRANSMISSION LINE STATISTICS (Continued)<br />
Year/Period of Report<br />
End of <strong>2010</strong>/Q4<br />
7. Do not report the same transmission line structure twice. Report Lower voltage Lines <strong>and</strong> higher voltage lines as one line. Designate in a footnote if<br />
you do not include Lower voltage lines with higher voltage lines. If two or more transmission line structures support lines of the same voltage, report the<br />
pole miles of the primary structure in column (f) <strong>and</strong> the pole miles of the other line(s) in column (g)<br />
8. Designate any transmission line or portion thereof for which the respondent is not the sole owner. If such property is leased from another company,<br />
give name of lessor, date <strong>and</strong> terms of Lease, <strong>and</strong> amount of rent for year. For any transmission line other than a leased line, or portion thereof, for<br />
which the respondent is not the sole owner but which the respondent operates or shares in the operation of, furnish a succinct statement explaining the<br />
arrangement <strong>and</strong> giving particulars (details) of such matters as percent ownership by respondent in the line, name of co-owner, basis of sharing<br />
expenses of the Line, <strong>and</strong> how the expenses borne by the respondent are accounted for, <strong>and</strong> accounts affected. Specify whether lessor, co-owner, or<br />
other party is an associated company.<br />
9. Designate any transmission line leased to another company <strong>and</strong> give name of Lessee, date <strong>and</strong> terms of lease, annual rent for year, <strong>and</strong> how<br />
determined. Specify whether lessee is an associated company.<br />
10. Base the plant cost figures called for in columns (j) to (l) on the book cost at end of year.<br />
COST OF LINE (Include in Column (j) L<strong>and</strong>,<br />
EXPENSES, EXCEPT DEPRECIATION AND TAXES<br />
Size of L<strong>and</strong> rights, <strong>and</strong> clearing right-of-way)<br />
Conductor<br />
<strong>and</strong> Material<br />
L<strong>and</strong> Construction <strong>and</strong> Total Cost Operation Maintenance Rents Total<br />
Other Costs<br />
Expenses Expenses<br />
Expenses<br />
(i) (j) (k) (l) (m) (n) (o) (p)<br />
2300AL 1<br />
2500HPCU 2<br />
1113AL 4<br />
5<br />
1113AL 6<br />
1113AL 7<br />
1113AL 8<br />
1113AL 9<br />
1113AL 10<br />
2300AL 11<br />
1852ACSR 12<br />
13<br />
2300AL 14<br />
1113AL 15<br />
16<br />
2300AL 17<br />
18<br />
2300AL 19<br />
2300AL 20<br />
1113AL 21<br />
795ACSR 22<br />
1113AL 23<br />
795ACSR 24<br />
795ACSR 25<br />
795ACSR 26<br />
795ACSR 27<br />
954AL 28<br />
954AL 29<br />
30<br />
954ACSR 31<br />
2300AL 32<br />
2300AL 33<br />
518ACSR 34<br />
795ACSR 35<br />
Line<br />
No.<br />
3<br />
176,807,153 2,554,358,239 2,731,165,392 42,783,516 36,213,061 78,996,577 36<br />
<strong>FERC</strong> FORM NO. 1 (ED. 12-87) Page 423.9
Name of Respondent<br />
PACIFIC GAS AND ELECTRIC COMPANY<br />
This Report Is:<br />
Date of Report<br />
(1) X An Original<br />
(Mo, Da, Yr)<br />
(2) A Resubmission<br />
04/08/2011<br />
TRANSMISSION LINE STATISTICS (Continued)<br />
Year/Period of Report<br />
End of <strong>2010</strong>/Q4<br />
7. Do not report the same transmission line structure twice. Report Lower voltage Lines <strong>and</strong> higher voltage lines as one line. Designate in a footnote if<br />
you do not include Lower voltage lines with higher voltage lines. If two or more transmission line structures support lines of the same voltage, report the<br />
pole miles of the primary structure in column (f) <strong>and</strong> the pole miles of the other line(s) in column (g)<br />
8. Designate any transmission line or portion thereof for which the respondent is not the sole owner. If such property is leased from another company,<br />
give name of lessor, date <strong>and</strong> terms of Lease, <strong>and</strong> amount of rent for year. For any transmission line other than a leased line, or portion thereof, for<br />
which the respondent is not the sole owner but which the respondent operates or shares in the operation of, furnish a succinct statement explaining the<br />
arrangement <strong>and</strong> giving particulars (details) of such matters as percent ownership by respondent in the line, name of co-owner, basis of sharing<br />
expenses of the Line, <strong>and</strong> how the expenses borne by the respondent are accounted for, <strong>and</strong> accounts affected. Specify whether lessor, co-owner, or<br />
other party is an associated company.<br />
9. Designate any transmission line leased to another company <strong>and</strong> give name of Lessee, date <strong>and</strong> terms of lease, annual rent for year, <strong>and</strong> how<br />
determined. Specify whether lessee is an associated company.<br />
10. Base the plant cost figures called for in columns (j) to (l) on the book cost at end of year.<br />
COST OF LINE (Include in Column (j) L<strong>and</strong>,<br />
EXPENSES, EXCEPT DEPRECIATION AND TAXES<br />
Size of L<strong>and</strong> rights, <strong>and</strong> clearing right-of-way)<br />
Conductor<br />
<strong>and</strong> Material<br />
L<strong>and</strong> Construction <strong>and</strong> Total Cost Operation Maintenance Rents Total<br />
Other Costs<br />
Expenses Expenses<br />
Expenses<br />
(i) (j) (k) (l) (m) (n) (o) (p)<br />
500CU 1<br />
643.7CU 2<br />
518ACSR 3<br />
518ACSR 4<br />
1113AL 5<br />
500CU 6<br />
643.7CU 7<br />
8<br />
1113AC 9<br />
10<br />
1113AL 11<br />
12<br />
1113AL 13<br />
14<br />
500CU 15<br />
643.7CU 16<br />
795ACSR 17<br />
954ACSR 18<br />
1113SSAC 19<br />
20<br />
643.7CU 21<br />
795ACSR 22<br />
954ACSR 23<br />
1113SSAC 24<br />
25<br />
26<br />
27<br />
1113AL 28<br />
1113AL 29<br />
954ACSR 30<br />
1113AL 31<br />
1113AL 32<br />
954ACSR 33<br />
954AL 34<br />
Other 35<br />
Line<br />
No.<br />
176,807,153 2,554,358,239 2,731,165,392 42,783,516 36,213,061 78,996,577 36<br />
<strong>FERC</strong> FORM NO. 1 (ED. 12-87) Page 423.10
Name of Respondent<br />
PACIFIC GAS AND ELECTRIC COMPANY<br />
This Report Is:<br />
Date of Report<br />
(1) X An Original<br />
(Mo, Da, Yr)<br />
(2) A Resubmission<br />
04/08/2011<br />
TRANSMISSION LINE STATISTICS (Continued)<br />
Year/Period of Report<br />
End of <strong>2010</strong>/Q4<br />
7. Do not report the same transmission line structure twice. Report Lower voltage Lines <strong>and</strong> higher voltage lines as one line. Designate in a footnote if<br />
you do not include Lower voltage lines with higher voltage lines. If two or more transmission line structures support lines of the same voltage, report the<br />
pole miles of the primary structure in column (f) <strong>and</strong> the pole miles of the other line(s) in column (g)<br />
8. Designate any transmission line or portion thereof for which the respondent is not the sole owner. If such property is leased from another company,<br />
give name of lessor, date <strong>and</strong> terms of Lease, <strong>and</strong> amount of rent for year. For any transmission line other than a leased line, or portion thereof, for<br />
which the respondent is not the sole owner but which the respondent operates or shares in the operation of, furnish a succinct statement explaining the<br />
arrangement <strong>and</strong> giving particulars (details) of such matters as percent ownership by respondent in the line, name of co-owner, basis of sharing<br />
expenses of the Line, <strong>and</strong> how the expenses borne by the respondent are accounted for, <strong>and</strong> accounts affected. Specify whether lessor, co-owner, or<br />
other party is an associated company.<br />
9. Designate any transmission line leased to another company <strong>and</strong> give name of Lessee, date <strong>and</strong> terms of lease, annual rent for year, <strong>and</strong> how<br />
determined. Specify whether lessee is an associated company.<br />
10. Base the plant cost figures called for in columns (j) to (l) on the book cost at end of year.<br />
COST OF LINE (Include in Column (j) L<strong>and</strong>,<br />
EXPENSES, EXCEPT DEPRECIATION AND TAXES<br />
Size of L<strong>and</strong> rights, <strong>and</strong> clearing right-of-way)<br />
Conductor<br />
<strong>and</strong> Material<br />
L<strong>and</strong> Construction <strong>and</strong> Total Cost Operation Maintenance Rents Total<br />
Other Costs<br />
Expenses Expenses<br />
Expenses<br />
(i) (j) (k) (l) (m) (n) (o) (p)<br />
1<br />
2<br />
1113AL 3<br />
954ACSR 4<br />
954AL 5<br />
Other 6<br />
1855ACSR 7<br />
2300AL 8<br />
795ACSR 9<br />
1113AL 10<br />
954AL 11<br />
954AL 12<br />
2-2300 A 13<br />
2-2300 A 14<br />
2-2500 k 15<br />
2-2500 k 16<br />
2000 kcm 17<br />
2000 kcm 18<br />
1000 sq. 19<br />
1000 sq. 20<br />
954ACSR 21<br />
954ACSR 22<br />
1113AL 23<br />
2000 kcm 24<br />
2000 kcm 25<br />
1431 AAC 26<br />
2-1113 AAC 27<br />
28<br />
29<br />
30<br />
31<br />
32<br />
33<br />
34<br />
35<br />
Line<br />
No.<br />
176,807,153 2,554,358,239 2,731,165,392 42,783,516 36,213,061 78,996,577 36<br />
<strong>FERC</strong> FORM NO. 1 (ED. 12-87) Page 423.11
Name of Respondent<br />
PACIFIC GAS AND ELECTRIC COMPANY<br />
This Report Is:<br />
Date of Report<br />
(1) X An Original<br />
(Mo, Da, Yr)<br />
(2) A Resubmission<br />
04/08/2011<br />
TRANSMISSION LINE STATISTICS (Continued)<br />
Year/Period of Report<br />
End of <strong>2010</strong>/Q4<br />
7. Do not report the same transmission line structure twice. Report Lower voltage Lines <strong>and</strong> higher voltage lines as one line. Designate in a footnote if<br />
you do not include Lower voltage lines with higher voltage lines. If two or more transmission line structures support lines of the same voltage, report the<br />
pole miles of the primary structure in column (f) <strong>and</strong> the pole miles of the other line(s) in column (g)<br />
8. Designate any transmission line or portion thereof for which the respondent is not the sole owner. If such property is leased from another company,<br />
give name of lessor, date <strong>and</strong> terms of Lease, <strong>and</strong> amount of rent for year. For any transmission line other than a leased line, or portion thereof, for<br />
which the respondent is not the sole owner but which the respondent operates or shares in the operation of, furnish a succinct statement explaining the<br />
arrangement <strong>and</strong> giving particulars (details) of such matters as percent ownership by respondent in the line, name of co-owner, basis of sharing<br />
expenses of the Line, <strong>and</strong> how the expenses borne by the respondent are accounted for, <strong>and</strong> accounts affected. Specify whether lessor, co-owner, or<br />
other party is an associated company.<br />
9. Designate any transmission line leased to another company <strong>and</strong> give name of Lessee, date <strong>and</strong> terms of lease, annual rent for year, <strong>and</strong> how<br />
determined. Specify whether lessee is an associated company.<br />
10. Base the plant cost figures called for in columns (j) to (l) on the book cost at end of year.<br />
COST OF LINE (Include in Column (j) L<strong>and</strong>,<br />
EXPENSES, EXCEPT DEPRECIATION AND TAXES<br />
Size of L<strong>and</strong> rights, <strong>and</strong> clearing right-of-way)<br />
Conductor<br />
<strong>and</strong> Material<br />
L<strong>and</strong> Construction <strong>and</strong> Total Cost Operation Maintenance Rents Total<br />
Other Costs<br />
Expenses Expenses<br />
Expenses<br />
(i) (j) (k) (l) (m) (n) (o) (p)<br />
1<br />
2<br />
3<br />
22,102,656 298,423,003 320,525,659 3,310,995 2,994,074<br />
6,305,069 4<br />
58,008,773 973,768,102 1,031,776,875 8,812,300 7,968,808<br />
16,781,108 5<br />
6<br />
28,522,335 262,987,182 291,509,517 7,629,295 6,899,037<br />
14,528,332 7<br />
1,279,591 7,346,180 8,625,771<br />
343,034 310,200<br />
653,234 8<br />
4,177,337 28,233,702 32,411,039<br />
467,025 422,322<br />
889,347 9<br />
10<br />
11<br />
32,722,892 219,989,473 252,712,365 5,804,915 5,249,282<br />
11,054,197 12<br />
7,891,105 81,074,861 88,965,966 3,554,507 3,214,278<br />
6,768,785 13<br />
22,009,259 293,431,748 315,441,007 9,401,992 8,502,056<br />
17,904,048 14<br />
15<br />
16<br />
93,205 332,455,810 332,549,015 3,291,607 621,322<br />
3,912,929 17<br />
13,689,518 13,689,518<br />
167,846 31,682<br />
199,528 18<br />
19<br />
20<br />
42,958,660 42,958,660<br />
21<br />
22<br />
23<br />
24<br />
25<br />
26<br />
27<br />
28<br />
29<br />
30<br />
31<br />
32<br />
33<br />
34<br />
35<br />
Line<br />
No.<br />
176,807,153 2,554,358,239 2,731,165,392 42,783,516 36,213,061 78,996,577 36<br />
<strong>FERC</strong> FORM NO. 1 (ED. 12-87) Page 423.12
Name of Respondent<br />
PACIFIC GAS AND ELECTRIC COMPANY<br />
This Report is:<br />
(1) X An Original<br />
(2) A Resubmission<br />
Date of Report<br />
(Mo, Da, Yr)<br />
04/08/2011<br />
Year/Period of Report<br />
<strong>2010</strong>/Q4<br />
FOOTNOTE DATA<br />
Schedule Page: 422 Line No.: 1 Column: e<br />
The designations for the type of supporting structure in this column are defined as<br />
follows:<br />
SSP - Single Steel Poles<br />
SWP - Single Wood Poles<br />
WH - Wood "H" Structures<br />
T - Steel Towers<br />
UG - Underground<br />
Schedule Page: 422 Line No.: 1 Column: f<br />
The data for this column is not available on a circuit-by-circuit basis as the Utility's<br />
Geographic Information System is in the process of compiling the necessary data at this<br />
time.<br />
Schedule Page: 422 Line No.: 1 Column: g<br />
The data for this column is not available on a circuit-by-circuit basis as the Utility's<br />
Geographic Information System is in the process of compiling the necessary data at this<br />
time.<br />
Schedule Page: 422 Line No.: 5 Column: i<br />
Bundled.<br />
Schedule Page: 422 Line No.: 9 Column: i<br />
Bundled.<br />
Schedule Page: 422 Line No.: 22 Column: i<br />
Bundled.<br />
Schedule Page: 422.1 Line No.: 5 Column: i<br />
Bundled.<br />
Schedule Page: 422.1 Line No.: 6 Column: i<br />
Bundled.<br />
Schedule Page: 422.1 Line No.: 7 Column: i<br />
Bundled.<br />
Schedule Page: 422.1 Line No.: 8 Column: i<br />
Bundled.<br />
Schedule Page: 422.1 Line No.: 9 Column: i<br />
Bundled.<br />
Schedule Page: 422.3 Line No.: 29 Column: i<br />
Bundled.<br />
Schedule Page: 422.3 Line No.: 30 Column: i<br />
Bundled.<br />
Schedule Page: 422.3 Line No.: 31 Column: i<br />
Bundled.<br />
Schedule Page: 422.3 Line No.: 34 Column: i<br />
Oil Filled.<br />
Schedule Page: 422.3 Line No.: 35 Column: i<br />
AL cable.<br />
Schedule Page: 422.4 Line No.: 6 Column: f<br />
Idle.<br />
Schedule Page: 422.4 Line No.: 20 Column: i<br />
Bundled.<br />
Schedule Page: 422.5 Line No.: 2 Column: f<br />
For 6.53 miles, the #2 position on these towers is occupied by the Sacramento Municipal<br />
Utilities District's ("SMUD") White Rock-Elverta 230 kV line. SMUD purchased a half<br />
interest in these towers.<br />
Schedule Page: 422.5 Line No.: 4 Column: g<br />
Property of SMUD (excluded from total length on last page of 422).<br />
Schedule Page: 422.6 Line No.: 1 Column: i<br />
<strong>FERC</strong> FORM NO. 1 (ED. 12-87) Page 450.1
Name of Respondent<br />
PACIFIC GAS AND ELECTRIC COMPANY<br />
This Report is:<br />
(1) X An Original<br />
(2) A Resubmission<br />
Date of Report<br />
(Mo, Da, Yr)<br />
04/08/2011<br />
Year/Period of Report<br />
<strong>2010</strong>/Q4<br />
FOOTNOTE DATA<br />
Bundled.<br />
Schedule Page: 422.6 Line No.: 34 Column: i<br />
Bundled.<br />
Schedule Page: 422.8 Line No.: 16 Column: g<br />
Poles are jointly owned by Modesto Irrigation District ("MID") <strong>and</strong> Turlock Irrigation<br />
District ("TID"), while the conductor is property of TID (excluded from total length on<br />
last page of 422).<br />
Schedule Page: 422.8 Line No.: 26 Column: g<br />
For 15.84 miles, the #2 position of these towers is occupied by SMUD's White Rock-Pocket<br />
230kV line. SMUD purchased a half interest in these towers.<br />
Schedule Page: 422.9 Line No.: 2 Column: i<br />
<strong>Gas</strong> filled.<br />
Schedule Page: 422.9 Line No.: 4 Column: i<br />
Pipe type cable.<br />
Schedule Page: 422.9 Line No.: 28 Column: g<br />
Poles are jointly owned by MID <strong>and</strong> TID, while the conductor is property of MID (excluded<br />
from total length on last page of 422).<br />
Schedule Page: 422.9 Line No.: 29 Column: g<br />
Property of MID (excluded from total length on last page of 422).<br />
Schedule Page: 422.9 Line No.: 32 Column: i<br />
Bundled.<br />
Schedule Page: 422.9 Line No.: 33 Column: i<br />
Bundled.<br />
Schedule Page: 422.11 Line No.: 12 Column: g<br />
Poles are jointly owned by MID <strong>and</strong> TID while the conductor is property of TID (excluded<br />
from total length on last page of 422).<br />
Schedule Page: 422.12 Line No.: 11 Column: a<br />
Mileage, plant cost, <strong>and</strong> expenses for these lines are included in Line 4 above.<br />
Schedule Page: 422.12 Line No.: 16 Column: a<br />
Mileage, plant cost, <strong>and</strong> expenses for these lines are included in Line 4 above.<br />
Schedule Page: 422.12 Line No.: 19 Column: k<br />
Cost <strong>and</strong> expenses are already included in above lines.<br />
Schedule Page: 422.12 Line No.: 21 Column: a<br />
Includes roads <strong>and</strong> trails for all poles <strong>and</strong> tower lines.<br />
<strong>FERC</strong> FORM NO. 1 (ED. 12-87) Page 450.2
Name of Respondent<br />
This Report Is:<br />
Date of Report<br />
Year/Period of Report<br />
(1) X An Original<br />
(Mo, Da, Yr)<br />
PACIFIC GAS AND ELECTRIC COMPANY<br />
End of <strong>2010</strong>/Q4<br />
(2) A Resubmission<br />
04/08/2011<br />
TRANSMISSION LINES ADDED DURING YEAR<br />
1. Report below the information called for concerning Transmission lines added or altered during the year. It is not necessary to report<br />
minor revisions of lines.<br />
2. Provide separate subheadings for overhead <strong>and</strong> under- ground construction <strong>and</strong> show each transmission line separately. If actual<br />
costs of competed construction are not readily available for reporting columns (l) to (o), it is permissible to report in these columns the<br />
Line<br />
LINE DESIGNATION<br />
Line SUPPORTING STRUCTURE CIRCUITS PER STRUCTURE<br />
Length<br />
Average<br />
No.<br />
From<br />
To<br />
in<br />
Type<br />
Number per Present Ultimate<br />
Miles<br />
Miles<br />
(a) (b)<br />
(c)<br />
(d) (e)<br />
(f)<br />
(g)<br />
1 UNDERGROUND<br />
2 "(CX-3)" Order No. 30604166<br />
3 Oakl<strong>and</strong> C" Oakl<strong>and</strong> "X" 3.70 PVC Duct 1 1<br />
4<br />
5 OVERHEAD<br />
6 Pit#3-Carberry (TWR Carberry Switching yard 0.04 H-FrameTSP 1.00<br />
1 1<br />
7 Job No. 30642981<br />
8<br />
9 Carberry Switching yard Pit#3-Carberry (TWR 16/128) 0.04 H-FrameTSP 1.00<br />
1 1<br />
10 Job No. 30642981<br />
11<br />
12 Lerdo-Kern Oil-7th St<strong>and</strong>ard 7th St<strong>and</strong>ard Substation 2.29 Hybrid Concre/ 9.60<br />
2 2<br />
13 pole 21/4<br />
14<br />
15 Cottonwood-Delevan #1 Cottonwood-Delevan #1<br />
Steel Poles<br />
0.60 Steel Tower 10.05<br />
1 1<br />
16 Tower 70/478A Delevan Sub<br />
17 Job No. 30580298<br />
18<br />
19 Logan Creek-Delevan Logan Creek-Delevan 0.60 Steel Tower 11.17<br />
1 1<br />
20 Tower 70/478A Delevan Sub<br />
21 Job No. 30580298<br />
22<br />
23 Cottonwood-Delevan #2 Cottonwood-Delevan #2 0.54 Steel Tower 11.17<br />
1 1<br />
24 Tower 130/1022A Delevan Sub<br />
25 Job No. 30580298<br />
26<br />
27 Glenn-Delevan Glenn-Delevan 0.54 Steel Tower 11.17<br />
1 1<br />
28 Tower 130/1022A Delevan Sub<br />
29 Job No. 30580298<br />
30<br />
31 Delevan-Cortina Delevan-Cortina 0.34 Steel Tower 11.90<br />
1 1<br />
32 Delevan Sub Tower 71/479<br />
33 Job No. 30580298<br />
34<br />
35 Delevan-Vaca #1 Delevan-Vaca #1 0.34 Steel Tower 11.90<br />
1 1<br />
36 Delevan Sub Tower 71/479<br />
37 Job No. 30580298<br />
38<br />
39 Delevan-Vaca #2 Delevan-Vaca #2 0.35 Steel Tower 11.32<br />
1 1<br />
40 Delevan Sub Tower 130/1023<br />
41 Job No. 30580298<br />
42<br />
43<br />
44 TOTAL<br />
157.97 328.51 48 48<br />
<strong>FERC</strong> FORM NO. 1 (REV. 12-03) Page 424
Name of Respondent<br />
PACIFIC GAS AND ELECTRIC COMPANY<br />
Line<br />
No.<br />
This Report Is:<br />
Date of Report<br />
(1) X An Original<br />
(Mo, Da, Yr)<br />
(2) A Resubmission<br />
04/08/2011<br />
TRANSMISSION LINES ADDED DURING YEAR<br />
LINE DESIGNATION<br />
Line SUPPORTING STRUCTURE<br />
Length<br />
Average<br />
From<br />
To<br />
in<br />
Type<br />
Number per<br />
Miles<br />
Miles<br />
(a) (b)<br />
(c)<br />
(d) (e)<br />
Year/Period of Report<br />
End of <strong>2010</strong>/Q4<br />
1. Report below the information called for concerning Transmission lines added or altered during the year. It is not necessary to report<br />
minor revisions of lines.<br />
2. Provide separate subheadings for overhead <strong>and</strong> under- ground construction <strong>and</strong> show each transmission line separately. If actual<br />
costs of competed construction are not readily available for reporting columns (l) to (o), it is permissible to report in these columns the<br />
CIRCUITS PER STRUCTURE<br />
Present Ultimate<br />
1 Delevan-Vaca #3 Delevan-Vaca #3 0.35 Steel Tower 11.32<br />
1 1<br />
2 Delevan Sub Tower 130/1023<br />
3 Job No. 30580298<br />
4<br />
5 Gill Ranch Tap 9.30 Wood 16.00<br />
1 1<br />
6 Job Number 30694383<br />
7<br />
8 Henrietta Tulare Lake 6.00 LDS 16.00<br />
1 1<br />
9 Job Number 30764872 Phase 1<br />
10<br />
11 Sanger California #2 9.30 LDS 17.00<br />
1 1<br />
12 Job Number 30731005 &<br />
13<br />
14 Border - Glass Biola 5.00 Wood 17.00<br />
1 1<br />
15 Job Number 30545566<br />
16<br />
17 Rio Bravo Kern Oil 0.50 Wood 16.00<br />
1 1<br />
18 Job Number 30578966<br />
19<br />
20 Plainfield Jct. Pole 26/362 Plainfield Substation 2.80 Wood poles/TSP 13.00<br />
2 2<br />
21 Job No. 30587270<br />
22<br />
23 RECONDUCTOR:<br />
24 UNDERGROUND<br />
25 AWH-1 Order No. 30604453<br />
26 Potrero Substation Bayshore Substation 1.60 Pipe 1 1<br />
27 Martin Substation Bayshore Substation<br />
28<br />
29 AWH-2 Order No. 30604454<br />
30 Potrero Substation Bayshore Substation 1.59 Pipe 1 1<br />
31 Martin Substation Bayshore Substation 3.46 Pipe 1 1<br />
32<br />
33 OVERHEAD<br />
34 Horseshoe Substation Gold Hill Substation 8.50 Steel Towers 6.00<br />
2 2<br />
35 Job No. 30633190<br />
36<br />
37 Fairway Taps Fairway Substation 1.57 TSPs 10.00<br />
2 2<br />
38<br />
39 Schulte Substation Lammers Substation 0.69 TSPs 7.27<br />
1 1<br />
40<br />
41 Carbona #1 Tap Carbona #1 Tap 4.53 Steel Towers, 7.94<br />
1 1<br />
42 WP 0/1 Kasson Sub<br />
Wood Poles,<br />
43 Job No. 30755609<br />
&TSP<br />
(f)<br />
(g)<br />
44 TOTAL<br />
157.97 328.51 48 48<br />
<strong>FERC</strong> FORM NO. 1 (REV. 12-03) Page 424.1
Name of Respondent<br />
PACIFIC GAS AND ELECTRIC COMPANY<br />
Line<br />
No.<br />
This Report Is:<br />
Date of Report<br />
(1) X An Original<br />
(Mo, Da, Yr)<br />
(2) A Resubmission<br />
04/08/2011<br />
TRANSMISSION LINES ADDED DURING YEAR<br />
LINE DESIGNATION<br />
Line SUPPORTING STRUCTURE<br />
Length<br />
Average<br />
From<br />
To<br />
in<br />
Type<br />
Number per<br />
Miles<br />
Miles<br />
(a) (b)<br />
(c)<br />
(d) (e)<br />
Year/Period of Report<br />
End of <strong>2010</strong>/Q4<br />
1. Report below the information called for concerning Transmission lines added or altered during the year. It is not necessary to report<br />
minor revisions of lines.<br />
2. Provide separate subheadings for overhead <strong>and</strong> under- ground construction <strong>and</strong> show each transmission line separately. If actual<br />
costs of competed construction are not readily available for reporting columns (l) to (o), it is permissible to report in these columns the<br />
CIRCUITS PER STRUCTURE<br />
Present Ultimate<br />
1 Moss Moss L<strong>and</strong>ing-Salinas-Soledd 2.40 Steel Towers 4.60<br />
2 2<br />
2 Tower 7/40 Tower 10/51<br />
3 Job No. 30603838<br />
4<br />
5 Vaca Dixon Substation Peabody Substation 9.90 Steel Towers 6.00<br />
2 2<br />
6 Job No. 30603884<br />
7<br />
8 Peabody Substation Birds L<strong>and</strong>ing Switching Stn 19.80 Steel Towers 6.00<br />
2 2<br />
9 Job No. 30603884<br />
10<br />
11 Vaca Dixon Substation Lambie Switching Station 14.00 Steel Towers 6.10<br />
2 2<br />
12 Job No. 30603884<br />
13<br />
14 Lambie Switching Station Birds L<strong>and</strong>ing Switching Stn 7.00 Steel Towers 6.60<br />
2 2<br />
15 Job No. 30603884<br />
16<br />
17 Gold Hill Substation Clarksville Substation 6.00 Towers / TSP / 8.20<br />
2 2<br />
18 Job No. 30604172<br />
19<br />
Light Duty St<br />
20 West Sacramento Substation Brighton Substation 14.00 Towers / TSP / 7.20<br />
2 2<br />
21 Job No. 30604290<br />
22<br />
Lattice Steele<br />
23 Burney Substation Bus Str Hat Creek #2 PH pole 0/0 9.00 Wood Pole 21.00<br />
1 1<br />
24 Job No. 30614499<br />
25<br />
26 Paradise-Butt pole 13/0 paradise Butt pole 15/0 2.00 LDS poles 12.00<br />
1 1<br />
27 Job No. 30704135<br />
28<br />
29 REMOVALS<br />
30 Allison-Davis (Start at 50/44A End at Tower 63/111 6.50 Steel Towers 10.00<br />
2 2<br />
31 Job No. 30737897 (from tower<br />
32 63/111 to tower 63/106)<br />
33 Job No. 30761064 (from 63/106 to 62/97, tower 63/<br />
34 105 <strong>and</strong> 62/100 to remain)<br />
35 Job No. 30761065 (from tower 62/96 to 50/40B, tower<br />
36 59/57, 60/71 <strong>and</strong> 61/89 to remain)<br />
37<br />
38 Plainfield Jct. Pole 26/362 Plainfield Substation 2.80 Wood poles 13.00<br />
1 1<br />
39 Job No. 30587270<br />
40<br />
41<br />
42<br />
43<br />
(f)<br />
(g)<br />
44 TOTAL<br />
157.97 328.51 48 48<br />
<strong>FERC</strong> FORM NO. 1 (REV. 12-03) Page 424.2
Name of Respondent<br />
This Report Is:<br />
Date of Report<br />
Year/Period of Report<br />
(1) X An Original<br />
(Mo, Da, Yr)<br />
PACIFIC GAS AND ELECTRIC COMPANY<br />
End of <strong>2010</strong>/Q4<br />
(2) A Resubmission<br />
04/08/2011<br />
TRANSMISSION LINES ADDED DURING YEAR (Continued)<br />
costs. Designate, however, if estimated amounts are reported. Include costs of Clearing L<strong>and</strong> <strong>and</strong> Rights-of-Way, <strong>and</strong> Roads <strong>and</strong><br />
Trails, in column (l) with appropriate footnote, <strong>and</strong> costs of Underground Conduit in column (m).<br />
3. If design voltage differs from operating voltage, indicate such fact by footnote; also where line is other than 60 cycle, 3 phase,<br />
indicate such other characteristic.<br />
CONDUCTORS<br />
Voltage<br />
LINE COST<br />
Line<br />
Size Specification Configuration KV L<strong>and</strong> <strong>and</strong> Poles, Towers Conductors Asset<br />
Total No.<br />
<strong>and</strong> Spacing (Operating) L<strong>and</strong> Rights <strong>and</strong> Fixtures <strong>and</strong> Devices Retire. Costs<br />
(h) (i)<br />
(j)<br />
(k)<br />
(l) (m)<br />
(n)<br />
(o)<br />
(p)<br />
1<br />
2<br />
2500 Cu XLPE<br />
115 41,011,417 21,601,433 62,612,850 3<br />
795 ACSR<br />
230 578,680<br />
578,680 6<br />
795 ACSR<br />
230 578,680<br />
578,680 9<br />
1113 AA<br />
V-10<br />
115 1,765,816 842,842 2,608,658 12<br />
954 ACSR<br />
V-15'<br />
230 1,470,253 1,470,253 15<br />
954 ACSR<br />
V-15'<br />
230 1,470,253 1,470,253 19<br />
954 ACSR<br />
V-15'<br />
230 1,323,228 1,323,228 23<br />
954 ACSR<br />
V-15'<br />
230 1,323,228 1,323,228 27<br />
954 ACSR<br />
V-15'<br />
230 833,144 833,144 31<br />
954 ACSR<br />
V-15'<br />
230 833,144 833,144 35<br />
954 ACSR<br />
V-15'<br />
230 857,648 857,648 39<br />
4<br />
5<br />
7<br />
8<br />
10<br />
11<br />
13<br />
14<br />
16<br />
17<br />
18<br />
20<br />
21<br />
22<br />
24<br />
25<br />
26<br />
28<br />
29<br />
30<br />
32<br />
33<br />
34<br />
36<br />
37<br />
38<br />
40<br />
41<br />
42<br />
43<br />
992,416 65,700,725 136,532,731 -2,335,586 200,890,286<br />
44<br />
<strong>FERC</strong> FORM NO. 1 (REV. 12-03) Page 425
Name of Respondent<br />
PACIFIC GAS AND ELECTRIC COMPANY<br />
This Report Is:<br />
Date of Report<br />
(1) X An Original<br />
(Mo, Da, Yr)<br />
(2) A Resubmission<br />
04/08/2011<br />
TRANSMISSION LINES ADDED DURING YEAR (Continued)<br />
Year/Period of Report<br />
End of <strong>2010</strong>/Q4<br />
costs. Designate, however, if estimated amounts are reported. Include costs of Clearing L<strong>and</strong> <strong>and</strong> Rights-of-Way, <strong>and</strong> Roads <strong>and</strong><br />
Trails, in column (l) with appropriate footnote, <strong>and</strong> costs of Underground Conduit in column (m).<br />
3. If design voltage differs from operating voltage, indicate such fact by footnote; also where line is other than 60 cycle, 3 phase,<br />
indicate such other characteristic.<br />
CONDUCTORS<br />
Voltage<br />
LINE COST<br />
Line<br />
Size Specification Configuration KV L<strong>and</strong> <strong>and</strong> Poles, Towers Conductors Asset<br />
Total No.<br />
<strong>and</strong> Spacing (Operating) L<strong>and</strong> Rights <strong>and</strong> Fixtures <strong>and</strong> Devices Retire. Costs<br />
(h) (i)<br />
(j)<br />
(k)<br />
(l) (m)<br />
(n)<br />
(o)<br />
(p)<br />
954 ACSR<br />
V-15'<br />
230 857,648 857,648 1<br />
715 AAC<br />
T-1<br />
115 5<br />
1113 AAC<br />
T-1<br />
70 765,675 1,673,434 2,439,109 8<br />
11113 AAC<br />
T-1<br />
115 2,441,433 2,783,363 5,224,796 11<br />
715 AAC<br />
TH<br />
70 1,791,694 1,536,580 3,328,274 14<br />
397A AAC<br />
T-1<br />
115 132,681 241,797 374,478 17<br />
715 Aluminm<br />
DC Post<br />
60 1,826,224 1,180,751 3,006,975 20<br />
2000 kcmil HPGF LP<br />
115 10,845,284 10,845,284 26<br />
2000 kcmil HPGF LP<br />
115 22,571,746 22,571,746 27<br />
2000 kcmil HPGF LP<br />
115 11,467,373 11,467,373 30<br />
2000 kcmil HPGF LP<br />
115 24,954,157 24,954,157 31<br />
477 ACSS<br />
V-10<br />
115 5,233,069 5,233,069 34<br />
715.5 AA<br />
V-10<br />
115 726,520 2,366,850 446,614 3,539,984 37<br />
954 ACSS<br />
Delta-12<br />
115 119,769<br />
359,306 598,843 1,077,918 39<br />
715 AAC<br />
V-9<br />
60 1,420,257<br />
1,420,257 41<br />
2<br />
3<br />
4<br />
6<br />
7<br />
9<br />
10<br />
12<br />
13<br />
15<br />
16<br />
18<br />
19<br />
21<br />
22<br />
23<br />
24<br />
25<br />
28<br />
29<br />
32<br />
33<br />
35<br />
36<br />
38<br />
40<br />
42<br />
43<br />
992,416 65,700,725 136,532,731 -2,335,586 200,890,286<br />
44<br />
<strong>FERC</strong> FORM NO. 1 (REV. 12-03) Page 425.1
Name of Respondent<br />
PACIFIC GAS AND ELECTRIC COMPANY<br />
This Report Is:<br />
Date of Report<br />
(1) X An Original<br />
(Mo, Da, Yr)<br />
(2) A Resubmission<br />
04/08/2011<br />
TRANSMISSION LINES ADDED DURING YEAR (Continued)<br />
Year/Period of Report<br />
End of <strong>2010</strong>/Q4<br />
costs. Designate, however, if estimated amounts are reported. Include costs of Clearing L<strong>and</strong> <strong>and</strong> Rights-of-Way, <strong>and</strong> Roads <strong>and</strong><br />
Trails, in column (l) with appropriate footnote, <strong>and</strong> costs of Underground Conduit in column (m).<br />
3. If design voltage differs from operating voltage, indicate such fact by footnote; also where line is other than 60 cycle, 3 phase,<br />
indicate such other characteristic.<br />
CONDUCTORS<br />
Voltage<br />
LINE COST<br />
Line<br />
Size Specification Configuration KV L<strong>and</strong> <strong>and</strong> Poles, Towers Conductors Asset<br />
Total No.<br />
<strong>and</strong> Spacing (Operating) L<strong>and</strong> Rights <strong>and</strong> Fixtures <strong>and</strong> Devices Retire. Costs<br />
(h) (i)<br />
(j)<br />
(k)<br />
(l) (m)<br />
(n)<br />
(o)<br />
(p)<br />
477 ACSS<br />
V-10'<br />
115 146,127<br />
699,634 1,054,283 1,900,044 1<br />
1113 ACSS<br />
V-15<br />
230 1,284,012 2,996,027 4,280,039 5<br />
1113 ACSS<br />
V-15<br />
230 2,568,023 5,992,054 8,560,077 8<br />
1113 ACSS<br />
V-15<br />
230 1,815,774 4,236,806 6,052,580 11<br />
1113 ACSS<br />
V-15<br />
230 907,887 2,118,403 3,026,290 14<br />
477 ACSS<br />
V-10<br />
115 1,350,760 4,073,564 5,424,324 17<br />
477 ACSS<br />
V-10<br />
115 1,158,389 149,909 1,308,298 20<br />
397 Aluminm<br />
T1<br />
60 347,174 417,956 765,130 23<br />
715 Aluminm<br />
T1, 3PS<br />
115 530,359 547,897 1,078,256 26<br />
2/0 Copper<br />
115 -2,250,469 -2,250,469 30<br />
4/0 Aluminm<br />
T1<br />
60 -85,117<br />
-85,117 38<br />
2<br />
3<br />
4<br />
6<br />
7<br />
9<br />
10<br />
12<br />
13<br />
15<br />
16<br />
18<br />
19<br />
21<br />
22<br />
24<br />
25<br />
27<br />
28<br />
29<br />
31<br />
32<br />
33<br />
34<br />
35<br />
36<br />
37<br />
39<br />
40<br />
41<br />
42<br />
43<br />
992,416 65,700,725 136,532,731 -2,335,586 200,890,286<br />
44<br />
<strong>FERC</strong> FORM NO. 1 (REV. 12-03) Page 425.2
Name of Respondent<br />
PACIFIC GAS AND ELECTRIC COMPANY<br />
This<br />
(1)<br />
Report<br />
X<br />
Is:<br />
An Original<br />
(2) A Resubmission<br />
SUBSTATIONS<br />
Date of Report<br />
(Mo, Da, Yr)<br />
04/08/2011<br />
Year/Period of Report<br />
End of <strong>2010</strong>/Q4<br />
1. Report below the information called for concerning substations of the respondent as of the end of the year.<br />
2. Substations which serve only one industrial or street railway customer should not be listed below.<br />
3. Substations with capacities of Less than 10 MVa except those serving customers with energy for resale, may be grouped according<br />
to functional character, but the number of such substations must be shown.<br />
4. Indicate in column (b) the functional character of each substation, designating whether transmission or distribution <strong>and</strong> whether<br />
attended or unattended. At the end of the page, summarize according to function the capacities reported for the individual stations in<br />
column (f).<br />
Line<br />
No.<br />
1<br />
2<br />
3<br />
4<br />
5<br />
6<br />
7<br />
8<br />
9<br />
10<br />
11<br />
12<br />
13<br />
14<br />
15<br />
16<br />
17<br />
18<br />
19<br />
20<br />
21<br />
22<br />
23<br />
24<br />
25<br />
26<br />
27<br />
28<br />
29<br />
30<br />
31<br />
32<br />
33<br />
34<br />
35<br />
36<br />
37<br />
38<br />
39<br />
40<br />
VOLTAGE (In MVa)<br />
Name <strong>and</strong> Location of Substation<br />
Character of Substation<br />
Primary Secondary Tertiary<br />
(a)<br />
(b)<br />
(c)<br />
(d)<br />
(e)<br />
AIRWAYS SUB, Fresno, Ca. Distribution<br />
115.00 12.00 7.20<br />
ALHAMBRA SUB, Martinez Distribution<br />
115.00 12.00 7.20<br />
ALMADEN SUB, San Jose Distribution<br />
60.00 12.00 7.20<br />
ALPAUGH SUB, Tulare Distribution<br />
115.00 12.00<br />
ALTO SUB, Mill Valley Distribution<br />
60.00 12.00 2.40<br />
AMES DISTRIBUTION SUB, Mountain View Distribution<br />
115.00 12.00 7.20<br />
ANDERSON SUB, Anderson Distribution<br />
60.00 12.00 2.40<br />
ANGIOLA SUB, Kings Distribution<br />
70.00 12.00 7.20<br />
ANTELOPE SUB, Blackwell Corner Distribution<br />
70.00 12.00 2.40<br />
ANTLER SUB, Lakehead Distribution<br />
60.00 12.00 2.40<br />
APPLE HILL SUB, Camino Distribution<br />
115.00 12.00 7.20<br />
APPLE HILL SUB, Camino Distribution<br />
115.00 21.00 7.20<br />
ARBUCKLE SUB, ARBUCKLE Distribution<br />
60.00 12.00 7.20<br />
ARCATA SUB, Arcata Distribution<br />
60.00 12.00 7.20<br />
ARVIN SUB, Arvin Distribution<br />
70.00 12.00 2.40<br />
ASHLAN AVENUE SUB, Fresno Distribution<br />
230.00 12.00 7.20<br />
ATASCADERO SUB, Atascadero Distribution<br />
115.00 12.00 7.20<br />
ATWATER SUB, Atwater Distribution<br />
115.00 12.00 7.20<br />
AUBERRY SUB, Auberry Distribution<br />
70.00 12.00 7.20<br />
AVENA SUB, Escalon Distribution<br />
115.00 12.00<br />
AVENAL SUB, Avenal Distribution<br />
70.00 12.00<br />
BAHIA SUB, Benicia Distribution<br />
230.00 12.00 7.20<br />
BAIR SUB, Redwood City Transmission<br />
115.00 12.00 7.20<br />
BAKERSFIELD SUB, Bakersfield Distribution<br />
230.00 21.00 7.20<br />
BANGOR SUB, Bangor Distribution<br />
60.00 12.00 7.20<br />
BARTON SUB, Fresno Distribution<br />
115.00 12.00 7.20<br />
BASALT SUB, Napa Distribution<br />
60.00 12.00<br />
BAY MEADOWS SUB, San Mateo Distribution<br />
115.00 21.00 7.20<br />
BAY MEADOWS SUB, San Mateo Distribution<br />
115.00 12.00 7.20<br />
BEAR VALLEY SUB, Bear Valley Distribution<br />
70.00 21.00 7.20<br />
BELL SUB, Auburn Distribution<br />
115.00 12.00 7.20<br />
BELLE HAVEN SUB, Menlo Park Distribution<br />
60.00 12.00<br />
BELLE HAVEN SUB, Menlo Park Distribution<br />
60.00 4.00 2.40<br />
BELLEVUE SUB, Santa Rosa Distribution<br />
115.00 12.00 7.20<br />
BELMONT SUB, Belmont Distribution<br />
115.00 12.00 7.20<br />
BERESFORD SUB, San Mateo Distribution<br />
60.00 4.00<br />
BERRENDA A SUB, Distribution<br />
70.00 12.00 2.40<br />
BIG BASIN SUB, Santa Cruz Distribution<br />
60.00 12.00<br />
BIG MEADOWS SUB, Greenville Distribution<br />
60.00 44.00 2.40<br />
BIOLA SUB, Biola Distribution<br />
70.00 12.00 2.40<br />
<strong>FERC</strong> FORM NO. 1 (ED. 12-96) Page 426
Name of Respondent<br />
PACIFIC GAS AND ELECTRIC COMPANY<br />
This<br />
(1)<br />
Report<br />
X<br />
Is:<br />
An Original<br />
(2) A Resubmission<br />
SUBSTATIONS<br />
Date of Report<br />
(Mo, Da, Yr)<br />
04/08/2011<br />
Year/Period of Report<br />
End of <strong>2010</strong>/Q4<br />
1. Report below the information called for concerning substations of the respondent as of the end of the year.<br />
2. Substations which serve only one industrial or street railway customer should not be listed below.<br />
3. Substations with capacities of Less than 10 MVa except those serving customers with energy for resale, may be grouped according<br />
to functional character, but the number of such substations must be shown.<br />
4. Indicate in column (b) the functional character of each substation, designating whether transmission or distribution <strong>and</strong> whether<br />
attended or unattended. At the end of the page, summarize according to function the capacities reported for the individual stations in<br />
column (f).<br />
Line<br />
No.<br />
1<br />
2<br />
3<br />
4<br />
5<br />
6<br />
7<br />
8<br />
9<br />
10<br />
11<br />
12<br />
13<br />
14<br />
15<br />
16<br />
17<br />
18<br />
19<br />
20<br />
21<br />
22<br />
23<br />
24<br />
25<br />
26<br />
27<br />
28<br />
29<br />
30<br />
31<br />
32<br />
33<br />
34<br />
35<br />
36<br />
37<br />
38<br />
39<br />
40<br />
VOLTAGE (In MVa)<br />
Name <strong>and</strong> Location of Substation<br />
Character of Substation<br />
Primary Secondary Tertiary<br />
(a)<br />
(b)<br />
(c)<br />
(d)<br />
(e)<br />
BLACKWELL SUB, Blackwell Corner Distribution<br />
70.00 12.00 2.40<br />
BLUE LAKE SUB, Blue Lake Distribution<br />
60.00 12.00 2.40<br />
BOGUE SUB, Yuba City Distribution<br />
115.00 12.00 7.20<br />
BOLINAS SUB, Boninas Distribution<br />
60.00 12.00 7.20<br />
BONITA SUB, Madera Distribution<br />
70.00 12.00 7.20<br />
BORDEN SUB, Madera Transmission<br />
230.00 12.00 7.20<br />
BOWLES SUB, Bowles Distribution<br />
70.00 12.00 2.40<br />
BRENTWOOD SUB, Brentwood Distribution<br />
230.00 21.00 7.20<br />
BRITTON SUB, Sunnyvale Distribution<br />
115.00 12.00 7.20<br />
BRUNSWICK SUB, Grass Valley Distribution<br />
115.00 12.00 7.20<br />
BUELLTON SUB, Buellton /93427 Distribution<br />
115.00 12.00 7.20<br />
BUENA VISTA SUB, Salinas Distribution<br />
60.00 12.00 7.20<br />
BULLARD SUB, Fresno Distribution<br />
115.00 12.00 7.20<br />
BULLARD SUB, Fresno Distribution<br />
115.00 21.00 7.20<br />
BURLINGAME SUB, Burlingame Distribution<br />
115.00 21.00 7.20<br />
BUTTE SUB, Chico Transmission<br />
115.00 12.00 7.20<br />
CABRILLO SUB, LOMPOC Distribution<br />
115.00 12.00 7.20<br />
CADET SUB, Maricopa Distribution<br />
70.00 12.00<br />
CAL WATER SUB, Distribution<br />
115.00 12.00 7.20<br />
CALAVERAS CEMENT SUB, San Andreas Distribution<br />
60.00 12.00 7.20<br />
CALFLAX SUB, Huron Distribution<br />
70.00 12.00 2.40<br />
CALIFORNIA AVE SUB, Fresno Distribution<br />
115.00 12.00 7.20<br />
CALISTOGA SUB, Calistoga Distribution<br />
60.00 12.00 7.20<br />
CALPELLA SUB, Calpella Distribution<br />
115.00 12.00 7.20<br />
CAMDEN SUB, Riverdale Distribution<br />
70.00 12.00<br />
CAMP EVERS SUB, Santa Cruz Distribution<br />
115.00 21.00 7.20<br />
CAMPHORA SUB, Monterey Distribution<br />
60.00 12.00 7.20<br />
CAMPHORA SUB, Monterey Distribution<br />
60.00 4.00<br />
CANAL SUB, Los Banos Distribution<br />
70.00 12.00 7.20<br />
CANTUA SUB, Cantua Creek Distribution<br />
115.00 12.00<br />
CAPAY SUB, Orl<strong>and</strong> Distribution<br />
60.00 12.00 2.40<br />
CARBONA SUB, Tracy Distribution<br />
60.00 12.00 7.20<br />
CARNATION SUB, Bakersfield Distribution<br />
70.00 21.00 7.20<br />
CARNERAS SUB, Blackwells Corner Distribution<br />
70.00 12.00 7.20<br />
CAROLANDS SUB, Hillsborough Distribution<br />
60.00 4.00<br />
CARQUINEZ SUB, Vallejo Distribution<br />
115.00 12.00 2.40<br />
CARUTHERS SUB, Fresno Distribution<br />
70.00 12.00 2.40<br />
CASSIDY SUB, Madera Distribution<br />
70.00 12.00 2.40<br />
CASTRO VALLEY SUB, Castro Valley Distribution<br />
230.00 12.00<br />
CASTROVILLE SUB, Castroville Distribution<br />
115.00 21.00 7.20<br />
<strong>FERC</strong> FORM NO. 1 (ED. 12-96) Page 426.1
Name of Respondent<br />
PACIFIC GAS AND ELECTRIC COMPANY<br />
This<br />
(1)<br />
Report<br />
X<br />
Is:<br />
An Original<br />
(2) A Resubmission<br />
SUBSTATIONS<br />
Date of Report<br />
(Mo, Da, Yr)<br />
04/08/2011<br />
Year/Period of Report<br />
End of <strong>2010</strong>/Q4<br />
1. Report below the information called for concerning substations of the respondent as of the end of the year.<br />
2. Substations which serve only one industrial or street railway customer should not be listed below.<br />
3. Substations with capacities of Less than 10 MVa except those serving customers with energy for resale, may be grouped according<br />
to functional character, but the number of such substations must be shown.<br />
4. Indicate in column (b) the functional character of each substation, designating whether transmission or distribution <strong>and</strong> whether<br />
attended or unattended. At the end of the page, summarize according to function the capacities reported for the individual stations in<br />
column (f).<br />
Line<br />
No.<br />
1<br />
2<br />
3<br />
4<br />
5<br />
6<br />
7<br />
8<br />
9<br />
10<br />
11<br />
12<br />
13<br />
14<br />
15<br />
16<br />
17<br />
18<br />
19<br />
20<br />
21<br />
22<br />
23<br />
24<br />
25<br />
26<br />
27<br />
28<br />
29<br />
30<br />
31<br />
32<br />
33<br />
34<br />
35<br />
36<br />
37<br />
38<br />
39<br />
40<br />
VOLTAGE (In MVa)<br />
Name <strong>and</strong> Location of Substation<br />
Character of Substation<br />
Primary Secondary Tertiary<br />
(a)<br />
(b)<br />
(c)<br />
(d)<br />
(e)<br />
CAWELO B SUB, Famosa Distribution<br />
70.00 4.00<br />
CAYETANO SUB, Danville Distribution<br />
230.00 21.00 7.20<br />
CAYUCOS SUB, Cayucos Distribution<br />
70.00 12.00 7.20<br />
CHANNEL SUB, Stockton Distribution<br />
60.00 12.00<br />
CHARCA SUB, Wasco Distribution<br />
115.00 12.00 7.20<br />
CHENEY SUB, Mendota Distribution<br />
115.00 12.00 7.20<br />
CHEROKEE SUB, Stockton Distribution<br />
60.00 12.00 7.20<br />
CHICO A SUB, Chico Distribution<br />
60.00 12.00 7.20<br />
CHICO B SUB, Chico Distribution<br />
115.00 12.00 7.20<br />
CHOLAME SUB, Cholame/93431 Distribution<br />
70.00 12.00 2.40<br />
CHOLAME SUB, Cholame/93431 Distribution<br />
70.00 21.00 2.40<br />
CHOWCHILLA SUB, Chowchilla Distribution<br />
115.00 12.00 7.20<br />
CLARK ROAD SUB, Paradise Distribution<br />
60.00 12.00 2.40<br />
CLARKSVILLE SUB, Clarksville Distribution<br />
115.00 21.00 7.20<br />
CLAY SUB, Ione Distribution<br />
60.00 12.00<br />
CLAYTON SUB, Concord Distribution<br />
115.00 21.00 7.20<br />
CLAYTON SUB, Concord Distribution<br />
115.00 12.00 7.20<br />
CLEAR LAKE SUB, Finley Distribution<br />
60.00 12.00 2.40<br />
CLOVERDALE SUB, Cloverdale Distribution<br />
115.00 12.00 7.20<br />
CLOVIS SUB, Clovis Distribution<br />
115.00 12.00 7.20<br />
CLOVIS SUB, Clovis Distribution<br />
115.00 21.00 7.20<br />
COALINGA #1 SUB, Coalinga Distribution<br />
70.00 12.00 7.20<br />
COALINGA #2 SUB, Coalinga Distribution<br />
70.00 12.00 2.40<br />
COARSEGOLD SUB, Coursegold Distribution<br />
115.00 21.00 7.20<br />
COLUMBUS SUB, Bakersfield Distribution<br />
115.00 12.00 7.20<br />
COLUSA JUNCT SUB, Colusa Distribution<br />
60.00 12.00 7.20<br />
COLUSA SUB, Colusa Distribution<br />
60.00 12.00<br />
CONTRA COSTA SUBSTATION, Antioch Transmission<br />
230.00 21.00 7.20<br />
CONTRA COSTA SUBSTATION, Antioch Transmission<br />
115.00 21.00 6.60<br />
COPPERMINE SUB, Clovis Distribution<br />
70.00 12.00 2.40<br />
COPUS SUB, Bakersfield Distribution<br />
70.00 12.00<br />
CORCORAN SUB, Corcoran Transmission<br />
115.00 12.00 7.20<br />
CORDELIA SUB, Cordelia Distribution<br />
115.00 12.00 7.20<br />
CORDELIA SUB, Cordelia Distribution<br />
60.00 12.00 2.40<br />
CORNING SUB, Corning Distribution<br />
60.00 12.00 2.40<br />
CORONA SUB, Distribution<br />
115.00 12.00 7.20<br />
CORRAL SUB, Bellota Distribution<br />
60.00 12.00 7.20<br />
CORTINA SUB, Williams Transmission<br />
115.00 12.00 7.20<br />
COTATI SUB, Cotati Distribution<br />
60.00 12.00<br />
COTTLE SUB, Oakdale Distribution<br />
230.00 17.00<br />
<strong>FERC</strong> FORM NO. 1 (ED. 12-96) Page 426.2
Name of Respondent<br />
PACIFIC GAS AND ELECTRIC COMPANY<br />
This<br />
(1)<br />
Report<br />
X<br />
Is:<br />
An Original<br />
(2) A Resubmission<br />
SUBSTATIONS<br />
Date of Report<br />
(Mo, Da, Yr)<br />
04/08/2011<br />
Year/Period of Report<br />
End of <strong>2010</strong>/Q4<br />
1. Report below the information called for concerning substations of the respondent as of the end of the year.<br />
2. Substations which serve only one industrial or street railway customer should not be listed below.<br />
3. Substations with capacities of Less than 10 MVa except those serving customers with energy for resale, may be grouped according<br />
to functional character, but the number of such substations must be shown.<br />
4. Indicate in column (b) the functional character of each substation, designating whether transmission or distribution <strong>and</strong> whether<br />
attended or unattended. At the end of the page, summarize according to function the capacities reported for the individual stations in<br />
column (f).<br />
Line<br />
No.<br />
1<br />
2<br />
3<br />
4<br />
5<br />
6<br />
7<br />
8<br />
9<br />
10<br />
11<br />
12<br />
13<br />
14<br />
15<br />
16<br />
17<br />
18<br />
19<br />
20<br />
21<br />
22<br />
23<br />
24<br />
25<br />
26<br />
27<br />
28<br />
29<br />
30<br />
31<br />
32<br />
33<br />
34<br />
35<br />
36<br />
37<br />
38<br />
39<br />
40<br />
VOLTAGE (In MVa)<br />
Name <strong>and</strong> Location of Substation<br />
Character of Substation<br />
Primary Secondary Tertiary<br />
(a)<br />
(b)<br />
(c)<br />
(d)<br />
(e)<br />
COTTONWOOD SUB, Cottonwood Transmission<br />
115.00 12.00 7.20<br />
COUNTRY CLUB SUB, Stockton Distribution<br />
60.00 12.00<br />
COUNTRY CLUB SUB, Stockton Distribution<br />
60.00 4.00<br />
CRESSEY SUB, Merced Distribution<br />
115.00 21.00<br />
CURTIS SUB, Sonora Distribution<br />
115.00 18.00<br />
CUYAMA SUB, Cuyama Distribution<br />
70.00 12.00<br />
CUYAMA SUB, Cuyama Distribution<br />
70.00 21.00 7.20<br />
CYMRIC SUB, McKitrick Distribution<br />
115.00 12.00 7.20<br />
DAIRYLAND SUB, Chowchilla Distribution<br />
115.00 12.00 7.20<br />
DALY CITY SUB, Daly City Distribution<br />
115.00 12.00<br />
DAVIS SUB, Davis Distribution<br />
115.00 12.00 7.20<br />
DEEPWATER SUB, W. Sactramento Distribution<br />
115.00 12.00 7.20<br />
DEL MAR SUB, Rocklin Distribution<br />
60.00 21.00 7.20<br />
DEL MAR SUB, Rocklin Distribution<br />
60.00 12.00 7.20<br />
DEL MONTE SUB, Monterey Transmission<br />
115.00 21.00 7.20<br />
DERRICK SUB, Kettleman Distribution<br />
70.00 12.00 2.40<br />
DESCHUTES SUB, Palo Cedro Distribution<br />
60.00 12.00 7.20<br />
DIAMOND SPRINGS SUB, Placerville Distribution<br />
115.00 12.00 7.20<br />
DINUBA SUB, Dinuba Distribution<br />
70.00 12.00<br />
DIVIDE SUB, Orcutt Transmission<br />
70.00 12.00 2.40<br />
DIXON LANDING SUB, Distribution<br />
115.00 21.00 7.20<br />
DIXON SUB, Dixon Distribution<br />
60.00 12.00<br />
DOLAN ROAD SUB, Moss L<strong>and</strong>ing Distribution<br />
115.00 12.00<br />
DOS PALOS SUB, Dos Palos Distribution<br />
70.00 12.00 7.20<br />
DUMBARTON SUB, Fremont Distribution<br />
115.00 12.00<br />
DUNBAR SUB, Glen Ellen Distribution<br />
60.00 12.00<br />
EAST GRAND SUB, So San Fran. Distribution<br />
115.00 12.00 7.20<br />
EAST MARYSVILLE SUB, Marysville, Distribution<br />
115.00 12.00 7.20<br />
EAST NICOLAUS SUB, E. Nicolaus Transmission<br />
60.00 12.00<br />
EAST STOCKTON SUB, Stockton Distribution<br />
60.00 12.00 7.20<br />
EAST STOCKTON SUB, Stockton Distribution<br />
60.00 4.00<br />
EDENVALE SUB, San Jose Distribution<br />
115.00 21.00 7.20<br />
EDENVALE SUB, San Jose Distribution<br />
115.00 12.00 7.20<br />
EDES SUB, Oakl<strong>and</strong> Distribution<br />
115.00 12.00 7.20<br />
EIGHT MILE SUB, Stockton Distribution<br />
230.00 21.00 7.20<br />
EL CAPITAN SUB, Snelling Distribution<br />
115.00 12.00<br />
EL CAPITAN SUB, Snelling Distribution<br />
115.00 21.00<br />
EL CERRITO G SUB, El Cerrito Distribution<br />
115.00 12.00 2.40<br />
EL NIDO SUB, Merced Distribution<br />
115.00 12.00 7.20<br />
EL PATIO SUB, Campbell Distribution<br />
115.00 12.00 7.20<br />
<strong>FERC</strong> FORM NO. 1 (ED. 12-96) Page 426.3
Name of Respondent<br />
PACIFIC GAS AND ELECTRIC COMPANY<br />
This<br />
(1)<br />
Report<br />
X<br />
Is:<br />
An Original<br />
(2) A Resubmission<br />
SUBSTATIONS<br />
Date of Report<br />
(Mo, Da, Yr)<br />
04/08/2011<br />
Year/Period of Report<br />
End of <strong>2010</strong>/Q4<br />
1. Report below the information called for concerning substations of the respondent as of the end of the year.<br />
2. Substations which serve only one industrial or street railway customer should not be listed below.<br />
3. Substations with capacities of Less than 10 MVa except those serving customers with energy for resale, may be grouped according<br />
to functional character, but the number of such substations must be shown.<br />
4. Indicate in column (b) the functional character of each substation, designating whether transmission or distribution <strong>and</strong> whether<br />
attended or unattended. At the end of the page, summarize according to function the capacities reported for the individual stations in<br />
column (f).<br />
Line<br />
No.<br />
1<br />
2<br />
3<br />
4<br />
5<br />
6<br />
7<br />
8<br />
9<br />
10<br />
11<br />
12<br />
13<br />
14<br />
15<br />
16<br />
17<br />
18<br />
19<br />
20<br />
21<br />
22<br />
23<br />
24<br />
25<br />
26<br />
27<br />
28<br />
29<br />
30<br />
31<br />
32<br />
33<br />
34<br />
35<br />
36<br />
37<br />
38<br />
39<br />
40<br />
VOLTAGE (In MVa)<br />
Name <strong>and</strong> Location of Substation<br />
Character of Substation<br />
Primary Secondary Tertiary<br />
(a)<br />
(b)<br />
(c)<br />
(d)<br />
(e)<br />
EL PECO SUB, Madera Distribution<br />
70.00 12.00<br />
ELECTRA SUB, Distribution<br />
60.00 12.00<br />
ELK HILLS SUB, Valley Acres Distribution<br />
70.00 12.00<br />
ELK SUB, Elk Distribution<br />
60.00 12.00 2.40<br />
EUREKA A SUB, Eureka Distribution<br />
60.00 12.00 7.20<br />
EUREKA E SUB, Eureka Distribution<br />
60.00 12.00 2.40<br />
EVERGREEN SUB, San Jose Transmission<br />
115.00 21.00 7.20<br />
FAIRHAVEN SUB, Fairhaven Distribution<br />
60.00 12.00 7.20<br />
FAIRVIEW SUB, Martinez Distribution<br />
115.00 21.00 12.00<br />
FAIRWAY SUB, Santa Maria Distribution<br />
115.00 12.00 7.20<br />
FAMOSO SUB, Famosa Distribution<br />
115.00 12.00<br />
FELLOWS SUB, Fellows Distribution<br />
115.00 21.00<br />
FIGARDEN SUB, Fresno Distribution<br />
230.00 21.00 7.20<br />
FIREBAUGH SUB, Firebaugh Distribution<br />
70.00 12.00 7.20<br />
FITCH MOUNTAIN SUB, Healdsburg Distribution<br />
60.00 12.00 7.20<br />
FLINT SUB, Auburn Distribution<br />
115.00 12.00 7.20<br />
FMC SUB, San Jose Distribution<br />
115.00 12.00 7.20<br />
FOOTHILL SUB, SLO Distribution<br />
115.00 12.00 2.40<br />
FORESTHILL SUB, Foresthill, Distribution<br />
60.00 12.00 7.20<br />
FORT BRAGG A SUB, Fort Bragg Distribution<br />
60.00 12.00 13.80<br />
FORT ORD SUB, Fort Ord Distribution<br />
60.00 12.00 2.40<br />
FRANKLIN SUB, Hercules Distribution<br />
60.00 12.00 7.20<br />
FREMONT SUB, Fremont Distribution<br />
115.00 12.00 7.20<br />
FRENCH CAMP SUB, Stockton Distribution<br />
60.00 12.00<br />
FROGTOWN SUB, Angels Camp Distribution<br />
115.00 17.00<br />
FRUITVALE SUB, Bakersfield Distribution<br />
70.00 12.00 2.40<br />
FULTON SUB, Fulton Transmission<br />
230.00 12.00 7.20<br />
GABILAN SUB, Salinas Distribution<br />
115.00 12.00 7.20<br />
GALLO SUB, Livingston Distribution<br />
115.00 12.00<br />
GANSNER SUB, Quincy Distribution<br />
60.00 12.00 7.20<br />
GANSO SUB, Buttonwillow Distribution<br />
115.00 12.00 7.20<br />
GARBERVILLE SUB, Garberville Distribution<br />
60.00 12.00 7.20<br />
GATES SUB, Huron Transmission<br />
230.00 12.00 7.20<br />
GATES SUB, Huron Transmission<br />
115.00 12.00<br />
GEYSERVILLE SUB, Geyserville Distribution<br />
60.00 12.00 2.40<br />
GIFFEN SUB, San Joaquin Distribution<br />
70.00 12.00 2.40<br />
GIRVAN SUB, Redding Distribution<br />
60.00 12.00 7.20<br />
GLENWOOD SUB, Menlo Park Distribution<br />
60.00 12.00 7.20<br />
GLENWOOD SUB, Menlo Park Distribution<br />
60.00 4.00<br />
GOLDTREE SUB, SLO Distribution<br />
115.00 12.00 7.20<br />
<strong>FERC</strong> FORM NO. 1 (ED. 12-96) Page 426.4
Name of Respondent<br />
PACIFIC GAS AND ELECTRIC COMPANY<br />
This<br />
(1)<br />
Report<br />
X<br />
Is:<br />
An Original<br />
(2) A Resubmission<br />
SUBSTATIONS<br />
Date of Report<br />
(Mo, Da, Yr)<br />
04/08/2011<br />
Year/Period of Report<br />
End of <strong>2010</strong>/Q4<br />
1. Report below the information called for concerning substations of the respondent as of the end of the year.<br />
2. Substations which serve only one industrial or street railway customer should not be listed below.<br />
3. Substations with capacities of Less than 10 MVa except those serving customers with energy for resale, may be grouped according<br />
to functional character, but the number of such substations must be shown.<br />
4. Indicate in column (b) the functional character of each substation, designating whether transmission or distribution <strong>and</strong> whether<br />
attended or unattended. At the end of the page, summarize according to function the capacities reported for the individual stations in<br />
column (f).<br />
Line<br />
No.<br />
1<br />
2<br />
3<br />
4<br />
5<br />
6<br />
7<br />
8<br />
9<br />
10<br />
11<br />
12<br />
13<br />
14<br />
15<br />
16<br />
17<br />
18<br />
19<br />
20<br />
21<br />
22<br />
23<br />
24<br />
25<br />
26<br />
27<br />
28<br />
29<br />
30<br />
31<br />
32<br />
33<br />
34<br />
35<br />
36<br />
37<br />
38<br />
39<br />
40<br />
VOLTAGE (In MVa)<br />
Name <strong>and</strong> Location of Substation<br />
Character of Substation<br />
Primary Secondary Tertiary<br />
(a)<br />
(b)<br />
(c)<br />
(d)<br />
(e)<br />
GONZALES SUB, Gonzales Distribution<br />
60.00 12.00<br />
GOOSE LAKE SUB, Wasco Distribution<br />
115.00 12.00 7.20<br />
GRAND ISLAND SUB, Ryde Distribution<br />
115.00 21.00 7.20<br />
GRANT SUB, San Lorenzo Distribution<br />
115.00 12.00 7.20<br />
GRASS VALLEY SUB, Grass Valley Distribution<br />
60.00 12.00<br />
GREEN VALLEY SUB, Watsonville Transmission<br />
115.00 21.00 7.20<br />
GREENBRAE SUB, Larkspur Distribution<br />
60.00 12.00 7.20<br />
GUALALA SUB, Gualala Distribution<br />
60.00 12.00 2.40<br />
GUERNSEY SUB, Hanford Distribution<br />
70.00 12.00 2.40<br />
GUSTINE SUB, Gustine Distribution<br />
60.00 12.00 7.20<br />
HALF MOON BAY SUB, Half Moon Bay Distribution<br />
60.00 12.00<br />
HAMMER SUB, Stockton Distribution<br />
60.00 12.00 7.20<br />
HAMMONDS SUB, Fresno Distribution<br />
115.00 12.00<br />
HARDING SUB, Stockton Distribution<br />
60.00 4.00<br />
HARDWICK SUB, Layton Distribution<br />
70.00 12.00 7.20<br />
HARRIS SUB, Eureka Distribution<br />
60.00 12.00 7.20<br />
HARTER SUB, Yuba City Distribution<br />
60.00 12.00 7.20<br />
HARTLEY SUB, Lakeport Distribution<br />
60.00 12.00 7.20<br />
HATTON SUB, Carmel Valley Distribution<br />
60.00 12.00 2.40<br />
HENRIETTA SUB, Lamoore Transmission<br />
70.00 12.00 2.40<br />
HERDLYN SUB, Tracy Transmission<br />
60.00 12.00 2.40<br />
HICKS SUB, San Jose Distribution<br />
230.00 21.00 7.20<br />
HICKS SUB, San Jose Distribution<br />
230.00 12.00 7.20<br />
HIGGINS SUB, Higgins Corner Distribution<br />
115.00 12.00 7.20<br />
HIGHLANDS SUB, Clear Lake Distribution<br />
115.00 12.00<br />
HIGHWAY SUB, Petaluma Distribution<br />
115.00 12.00 7.20<br />
HOLLISTER SUB, Hollister Distribution<br />
115.00 21.00 7.20<br />
HOLLISTER SUB, Hollister Distribution<br />
60.00 21.00<br />
HONCUT SUB, Honcut Distribution<br />
115.00 12.00 7.20<br />
HOPLAND SUB, Hopl<strong>and</strong> Transmission<br />
60.00 12.00 2.40<br />
HORSESHOE SUB, Granite Bay Distribution<br />
115.00 12.00 7.20<br />
HOWLAND ROAD SUB, Manteca Distribution<br />
115.00 12.00 7.20<br />
HUMBOLDT BAY PP SUB, Eureka Distribution<br />
60.00 13.80<br />
HUMBOLDT BAY PP SUB, Eureka Distribution<br />
115.00 13.80<br />
HUMBOLDT BAY PP SUB, Eureka Distribution<br />
60.00 12.00 7.20<br />
HUMBOLDT BAY PP SUB, Eureka Distribution<br />
60.00 2.00<br />
HUMBOLDT BAY PP SUB, Eureka Distribution<br />
115.00 2.00<br />
HURON SUB, Huron Distribution<br />
70.00 12.00 2.40<br />
IGNACIO SUB, Ignacio Transmission<br />
115.00 12.00<br />
IMHOFF SUB, Martinez Distribution<br />
115.00 12.00 7.20<br />
<strong>FERC</strong> FORM NO. 1 (ED. 12-96) Page 426.5
Name of Respondent<br />
PACIFIC GAS AND ELECTRIC COMPANY<br />
This<br />
(1)<br />
Report<br />
X<br />
Is:<br />
An Original<br />
(2) A Resubmission<br />
SUBSTATIONS<br />
Date of Report<br />
(Mo, Da, Yr)<br />
04/08/2011<br />
Year/Period of Report<br />
End of <strong>2010</strong>/Q4<br />
1. Report below the information called for concerning substations of the respondent as of the end of the year.<br />
2. Substations which serve only one industrial or street railway customer should not be listed below.<br />
3. Substations with capacities of Less than 10 MVa except those serving customers with energy for resale, may be grouped according<br />
to functional character, but the number of such substations must be shown.<br />
4. Indicate in column (b) the functional character of each substation, designating whether transmission or distribution <strong>and</strong> whether<br />
attended or unattended. At the end of the page, summarize according to function the capacities reported for the individual stations in<br />
column (f).<br />
Line<br />
No.<br />
1<br />
2<br />
3<br />
4<br />
5<br />
6<br />
7<br />
8<br />
9<br />
10<br />
11<br />
12<br />
13<br />
14<br />
15<br />
16<br />
17<br />
18<br />
19<br />
20<br />
21<br />
22<br />
23<br />
24<br />
25<br />
26<br />
27<br />
28<br />
29<br />
30<br />
31<br />
32<br />
33<br />
34<br />
35<br />
36<br />
37<br />
38<br />
39<br />
40<br />
VOLTAGE (In MVa)<br />
Name <strong>and</strong> Location of Substation<br />
Character of Substation<br />
Primary Secondary Tertiary<br />
(a)<br />
(b)<br />
(c)<br />
(d)<br />
(e)<br />
IONE SUB, Ione Distribution<br />
60.00 12.00 7.20<br />
JACINTO SUB, Willows Distribution<br />
60.00 12.00 7.20<br />
JACOBS CORNER SUB, Lemoore Distribution<br />
70.00 12.00<br />
JAMESON SUB, CORDELIA Distribution<br />
115.00 12.00 7.20<br />
JANES CREEK SUB, Arcata Distribution<br />
60.00 12.00<br />
JARVIS SUB, Union City Distribution<br />
115.00 12.00 7.20<br />
JESSUP SUB, Anderson Distribution<br />
115.00 12.00<br />
JOLON SUB, King City Distribution<br />
60.00 12.00<br />
KELSO SUB, Tracy Distribution<br />
230.00 12.00<br />
KERMAN SUB, Kerman Distribution<br />
70.00 12.00 7.20<br />
KERN OIL SUB, Bakersfield Distribution<br />
115.00 12.00 7.20<br />
KERN PP DIST SUB, Bakersfield Distribution<br />
115.00 21.00 7.20<br />
KESWICK SUB, Keswick Distribution<br />
60.00 12.00 2.40<br />
KETTLEMAN HILLS SUB, Kettleman Distribution<br />
70.00 12.00 2.40<br />
KING CITY SUB, King City Distribution<br />
60.00 12.00<br />
KINGSBURG SUB, Kingsburg Transmission<br />
115.00 12.00 7.20<br />
KIRKER SUB, Pittsburg Distribution<br />
115.00 21.00 7.20<br />
KONOCTI SUB, Clear Lake Distribution<br />
60.00 12.00 2.40<br />
LAKEVIEW SUB, Bakersfield Distribution<br />
70.00 12.00 2.40<br />
LAKEVILLE SUB, Petaluma Transmission<br />
115.00 12.00<br />
LAKEWOOD SUB, Walnut Creek Distribution<br />
115.00 21.00 7.20<br />
LAKEWOOD SUB, Walnut Creek Distribution<br />
115.00 12.00 7.20<br />
LAMMERS SUB, TRACY Distribution<br />
115.00 12.00 7.20<br />
LAMONT SUB, Bakersfield Distribution<br />
115.00 12.00<br />
LAS GALLINAS A SUB, Las Gallinas Distribution<br />
115.00 12.00 2.40<br />
LAS PALMAS SUB, Fresno Distribution<br />
115.00 12.00 7.20<br />
LAS POSITAS SUB, Livermore Transmission<br />
230.00 21.00 7.20<br />
LAS PULGAS SUB, Redwood City Distribution<br />
60.00 4.00 2.40<br />
LAWRENCE SUB, Sunnyvale Distribution<br />
115.00 12.00<br />
LE GRAND SUB, Le Gr<strong>and</strong> Distribution<br />
115.00 12.00 7.20<br />
LEMOORE SUB, Armonia Distribution<br />
70.00 12.00 2.40<br />
LERDO SUB, Bakersfield Distribution<br />
115.00 12.00 7.20<br />
LINCOLN SUB, Lincoln Distribution<br />
60.00 12.00 7.20<br />
LINDEN SUB, Linden Distribution<br />
60.00 12.00 2.40<br />
LIVE OAK SUB, Live Oak Distribution<br />
60.00 12.00<br />
LIVERMORE SUB, Livermore Distribution<br />
60.00 12.00 2.40<br />
LIVINGSTON SUB, Livingston Distribution<br />
115.00 12.00 7.20<br />
LIVINGSTON SUB, Livingston Distribution<br />
70.00 12.00<br />
LLAGAS SUB, Gilroy Distribution<br />
115.00 21.00 12.00<br />
LOCKEFORD SUB, Lockeford Transmission<br />
115.00 21.00<br />
<strong>FERC</strong> FORM NO. 1 (ED. 12-96) Page 426.6
Name of Respondent<br />
PACIFIC GAS AND ELECTRIC COMPANY<br />
This<br />
(1)<br />
Report<br />
X<br />
Is:<br />
An Original<br />
(2) A Resubmission<br />
SUBSTATIONS<br />
Date of Report<br />
(Mo, Da, Yr)<br />
04/08/2011<br />
Year/Period of Report<br />
End of <strong>2010</strong>/Q4<br />
1. Report below the information called for concerning substations of the respondent as of the end of the year.<br />
2. Substations which serve only one industrial or street railway customer should not be listed below.<br />
3. Substations with capacities of Less than 10 MVa except those serving customers with energy for resale, may be grouped according<br />
to functional character, but the number of such substations must be shown.<br />
4. Indicate in column (b) the functional character of each substation, designating whether transmission or distribution <strong>and</strong> whether<br />
attended or unattended. At the end of the page, summarize according to function the capacities reported for the individual stations in<br />
column (f).<br />
Line<br />
No.<br />
1<br />
2<br />
3<br />
4<br />
5<br />
6<br />
7<br />
8<br />
9<br />
10<br />
11<br />
12<br />
13<br />
14<br />
15<br />
16<br />
17<br />
18<br />
19<br />
20<br />
21<br />
22<br />
23<br />
24<br />
25<br />
26<br />
27<br />
28<br />
29<br />
30<br />
31<br />
32<br />
33<br />
34<br />
35<br />
36<br />
37<br />
38<br />
39<br />
40<br />
VOLTAGE (In MVa)<br />
Name <strong>and</strong> Location of Substation<br />
Character of Substation<br />
Primary Secondary Tertiary<br />
(a)<br />
(b)<br />
(c)<br />
(d)<br />
(e)<br />
LOCKHEED #2 SUB, Sunnyvale Distribution<br />
115.00 12.00<br />
LODI SUB, Lodi Distribution<br />
60.00 12.00 2.40<br />
LODI SUB, Lodi Distribution<br />
60.00 4.00<br />
LOGAN CREEK SUB, Willows Distribution<br />
230.00 21.00<br />
LONETREE SUB, Antioch Distribution<br />
230.00 21.00 7.20<br />
LOS ALTOS SUB, Los Altos Distribution<br />
60.00 12.00<br />
LOS COCHES SUB, Greenfield Distribution<br />
60.00 12.00<br />
LOS GATOS SUB, Los Gatos Distribution<br />
60.00 12.00 7.20<br />
LOS MOLINOS SUB, Los Molinos Distribution<br />
60.00 12.00 7.20<br />
LOS OSITOS SUB, Monterey Distribution<br />
60.00 21.00 7.20<br />
LOYOLA SUB, Loyola Distribution<br />
60.00 12.00 7.20<br />
LOYOLA SUB, Loyola Distribution<br />
60.00 4.00 2.40<br />
LUCERNE SUB, Lucerne Distribution<br />
115.00 12.00 7.20<br />
MABURY SUB, San Jose Distribution<br />
60.00 12.00 2.40<br />
MABURY SUB, San Jose Distribution<br />
115.00 12.00 7.20<br />
MADERA SUB, Madera Distribution<br />
70.00 12.00<br />
MADISON SUB, Madison Distribution<br />
60.00 12.00 7.20<br />
MADISON SUB, Madison Distribution<br />
115.00 12.00<br />
MAGUNDEN SUB, Bakersfield Distribution<br />
115.00 12.00 7.20<br />
MAGUNDEN SUB, Bakersfield Distribution<br />
115.00 21.00 7.20<br />
MALAGA SUB, Fresno Distribution<br />
115.00 12.00 7.20<br />
MANCHESTER SUB, Fresno Distribution<br />
115.00 12.00 7.20<br />
MANTECA SUB, Manteca Transmission<br />
115.00 17.00<br />
MARICOPA SUB, Maricopa Distribution<br />
70.00 12.00 2.40<br />
MARIPOSA SUB, Mariposa Distribution<br />
70.00 21.00<br />
MARTELL SUB, Martell Distribution<br />
60.00 12.00 2.40<br />
MARYSVILLE SUB, Marysville Distribution<br />
60.00 12.00<br />
MAXWELL SUB, Maxwell Distribution<br />
60.00 12.00<br />
MCCALL SUB, Selma Transmission<br />
115.00 12.00 7.20<br />
MCDONALD-MCDONALDISLAND SUB, Stockton Distribution<br />
60.00 4.00 2.40<br />
MCFARLAND SUB, McFarl<strong>and</strong> Distribution<br />
70.00 12.00 2.40<br />
MCKEE SUB, San Jose Distribution<br />
115.00 12.00 7.20<br />
MCMULLIN SUB, Fresno Distribution<br />
230.00 12.00 7.20<br />
MEADOW LANE SUB, Concord Distribution<br />
115.00 21.00 7.20<br />
MENDOCINO SUB, Redwood Valley Transmission<br />
60.00 12.00 2.40<br />
MENDOTA SUB, Mendota Transmission<br />
115.00 12.00 7.20<br />
MENLO SUB, Menlo Park Distribution<br />
60.00 12.00 7.20<br />
MENLO SUB, Menlo Park Distribution<br />
60.00 4.00<br />
MERCED SUB, Merced Transmission<br />
115.00 12.00 7.20<br />
MERCED SUB, Merced Transmission<br />
115.00 21.00 7.20<br />
<strong>FERC</strong> FORM NO. 1 (ED. 12-96) Page 426.7
Name of Respondent<br />
PACIFIC GAS AND ELECTRIC COMPANY<br />
This<br />
(1)<br />
Report<br />
X<br />
Is:<br />
An Original<br />
(2) A Resubmission<br />
SUBSTATIONS<br />
Date of Report<br />
(Mo, Da, Yr)<br />
04/08/2011<br />
Year/Period of Report<br />
End of <strong>2010</strong>/Q4<br />
1. Report below the information called for concerning substations of the respondent as of the end of the year.<br />
2. Substations which serve only one industrial or street railway customer should not be listed below.<br />
3. Substations with capacities of Less than 10 MVa except those serving customers with energy for resale, may be grouped according<br />
to functional character, but the number of such substations must be shown.<br />
4. Indicate in column (b) the functional character of each substation, designating whether transmission or distribution <strong>and</strong> whether<br />
attended or unattended. At the end of the page, summarize according to function the capacities reported for the individual stations in<br />
column (f).<br />
Line<br />
No.<br />
1<br />
2<br />
3<br />
4<br />
5<br />
6<br />
7<br />
8<br />
9<br />
10<br />
11<br />
12<br />
13<br />
14<br />
15<br />
16<br />
17<br />
18<br />
19<br />
20<br />
21<br />
22<br />
23<br />
24<br />
25<br />
26<br />
27<br />
28<br />
29<br />
30<br />
31<br />
32<br />
33<br />
34<br />
35<br />
36<br />
37<br />
38<br />
39<br />
40<br />
VOLTAGE (In MVa)<br />
Name <strong>and</strong> Location of Substation<br />
Character of Substation<br />
Primary Secondary Tertiary<br />
(a)<br />
(b)<br />
(c)<br />
(d)<br />
(e)<br />
METTLER SUB, Stockton Distribution<br />
60.00 12.00<br />
MIDDLETOWN SUB, Middletown Distribution<br />
60.00 12.00 7.20<br />
MIDWAY SUB, Buttonwillow Transmission<br />
115.00 12.00 7.20<br />
MILLBRAE SUB, Millbrae Transmission<br />
115.00 12.00<br />
MILLBRAE SUB, Millbrae Transmission<br />
60.00 4.00<br />
MILPITAS SUB, Milpitas Distribution<br />
115.00 21.00 7.20<br />
MILPITAS SUB, Milpitas Distribution<br />
115.00 12.00 7.20<br />
MIRABEL SUB, Forestville Distribution<br />
60.00 12.00<br />
MI-WUK SUB, Sugarpine Distribution<br />
115.00 17.00<br />
MOLINO SUB, Sebastopol Distribution<br />
60.00 12.00 7.20<br />
MONROE SUB, Santa Rosa Distribution<br />
115.00 21.00 7.20<br />
MONROE SUB, Santa Rosa Distribution<br />
115.00 12.00 7.20<br />
MONTAGUE SUB, San Jose Distribution<br />
115.00 21.00 7.20<br />
MONTE RIO SUB, Monte Rio Distribution<br />
60.00 12.00 7.20<br />
MONTEREY SUB, Monterey Distribution<br />
60.00 4.00<br />
MORAGA SUB, Orinda Transmission<br />
115.00 12.00<br />
MORGAN HILL SUB, Morgan Hill Distribution<br />
115.00 21.00 7.20<br />
MORMON SUB, Stockton Distribution<br />
60.00 12.00 7.20<br />
MORRO BAY SUB, Morro Bay Distribution<br />
115.00 12.00 7.20<br />
MOSHER SUB, Stockton Distribution<br />
60.00 21.00 7.20<br />
MOSHER SUB, Stockton Distribution<br />
115.00 21.00 7.20<br />
MOUNTAIN VIEW SUB, Mt. View Distribution<br />
115.00 12.00 7.20<br />
MT. EDEN SUB, Hayward Distribution<br />
115.00 12.00 7.20<br />
MT. QUARRIES SUB, Cool Distribution<br />
60.00 12.00 7.20<br />
NAPA SUB, Napa Distribution<br />
60.00 12.00<br />
NEWARK DIST SUB, Fremont Distribution<br />
230.00 21.00 7.20<br />
NEWARK SUB, Fremont Transmission<br />
115.00 12.00 7.20<br />
NEWBURG SUB, Fortuna Distribution<br />
60.00 12.00 2.40<br />
NEWHALL SUB, Firebaugh Distribution<br />
115.00 12.00 7.20<br />
NEWMAN SUB, Newman Distribution<br />
60.00 12.00 7.20<br />
NORCO SUB, Bakersfield Distribution<br />
115.00 12.00 7.20<br />
NORD SUB, Chico Distribution<br />
115.00 12.00 7.20<br />
NORTECH SUB, San Jose Distribution<br />
115.00 21.00 7.20<br />
NORTH DUBLIN SUB, Pleasanton Distribution<br />
230.00 21.00 12.00<br />
NORTH TOWER SUB, Vallejo Distribution<br />
115.00 12.00 7.20<br />
NORTH TOWER SUB, Vallejo Distribution<br />
115.00 25.00 7.20<br />
NOTRE DAME SUB, Chico Distribution<br />
115.00 12.00 7.20<br />
NOVATO SUB, Novato Distribution<br />
60.00 12.00 7.20<br />
OAKHURST SUB, Oakhurst Distribution<br />
115.00 12.00 2.40<br />
OAKLAND C (OAKLAND PP) SUB, Oakl<strong>and</strong> Distribution<br />
115.00 12.00 7.20<br />
<strong>FERC</strong> FORM NO. 1 (ED. 12-96) Page 426.8
Name of Respondent<br />
PACIFIC GAS AND ELECTRIC COMPANY<br />
This<br />
(1)<br />
Report<br />
X<br />
Is:<br />
An Original<br />
(2) A Resubmission<br />
SUBSTATIONS<br />
Date of Report<br />
(Mo, Da, Yr)<br />
04/08/2011<br />
Year/Period of Report<br />
End of <strong>2010</strong>/Q4<br />
1. Report below the information called for concerning substations of the respondent as of the end of the year.<br />
2. Substations which serve only one industrial or street railway customer should not be listed below.<br />
3. Substations with capacities of Less than 10 MVa except those serving customers with energy for resale, may be grouped according<br />
to functional character, but the number of such substations must be shown.<br />
4. Indicate in column (b) the functional character of each substation, designating whether transmission or distribution <strong>and</strong> whether<br />
attended or unattended. At the end of the page, summarize according to function the capacities reported for the individual stations in<br />
column (f).<br />
Line<br />
No.<br />
1<br />
2<br />
3<br />
4<br />
5<br />
6<br />
7<br />
8<br />
9<br />
10<br />
11<br />
12<br />
13<br />
14<br />
15<br />
16<br />
17<br />
18<br />
19<br />
20<br />
21<br />
22<br />
23<br />
24<br />
25<br />
26<br />
27<br />
28<br />
29<br />
30<br />
31<br />
32<br />
33<br />
34<br />
35<br />
36<br />
37<br />
38<br />
39<br />
40<br />
VOLTAGE (In MVa)<br />
Name <strong>and</strong> Location of Substation<br />
Character of Substation<br />
Primary Secondary Tertiary<br />
(a)<br />
(b)<br />
(c)<br />
(d)<br />
(e)<br />
OAKLAND D SUB, Oakl<strong>and</strong> Distribution<br />
115.00 12.00 7.20<br />
OAKLAND J SUB, Oakl<strong>and</strong> Distribution<br />
115.00 12.00 7.20<br />
OAKLAND K (CLAREMONT) SUB, Oakl<strong>and</strong> Distribution<br />
115.00 12.00 6.60<br />
OAKLAND L SUB, Oakl<strong>and</strong> Distribution<br />
115.00 12.00 7.20<br />
OAKLAND X SUB, Oakl<strong>and</strong> Distribution<br />
115.00 12.00<br />
OCEANO SUB, Oceano Distribution<br />
115.00 12.00 7.20<br />
OILFIELDS SUB, San Ardo Distribution<br />
60.00 12.00<br />
OLD KEARNEY SUB, Fresno Distribution<br />
70.00 12.00 13.20<br />
OLD RIVER SUB, Knob Hill Distribution<br />
70.00 12.00 2.40<br />
OLETA SUB, Plymouth Distribution<br />
60.00 12.00 2.40<br />
OLIVEHURST SUB, Olivehurst Distribution<br />
115.00 12.00 7.20<br />
OREGON TRAIL SUB, Redding Distribution<br />
115.00 12.00 7.20<br />
OREGON TRAIL SUB, Redding Distribution<br />
60.00 12.00 2.40<br />
ORLAND B SUB, Orl<strong>and</strong> Distribution<br />
60.00 12.00 2.40<br />
ORO FINO SUB, Magalia Distribution<br />
60.00 12.00 2.40<br />
ORO LOMA SUB, Dos Palos Transmission<br />
70.00 12.00 2.40<br />
OROSI SUB, Orosi Distribution<br />
70.00 12.00 7.20<br />
OROVILLE SUB, Oroville Distribution<br />
60.00 12.00 7.20<br />
OROVILLE SUB, Oroville Distribution<br />
60.00 4.00 2.40<br />
ORTIGA SUB, Los Banos Distribution<br />
70.00 12.00 2.40<br />
PACIFICA SUB, <strong>Pacific</strong>a Distribution<br />
60.00 12.00<br />
PALMER SUB, Sisquat Distribution<br />
115.00 12.00 7.20<br />
PANAMA SUB, Bakersfield Distribution<br />
70.00 21.00 7.20<br />
PANORAMA SUB, Anderson Distribution<br />
115.00 12.00<br />
PARADISE SUB, Paradise Distribution<br />
60.00 12.00 7.20<br />
PARADISE SUB, Paradise Distribution<br />
115.00 12.00<br />
PARKWAY SUB, Vallejo Distribution<br />
230.00 12.00 7.20<br />
PARLIER SUB, Parlier Distribution<br />
70.00 12.00 7.20<br />
PASO ROBLES SUB, Paso Robles Distribution<br />
70.00 12.00<br />
PAUL SWEET SUB, Santa Cruz Distribution<br />
115.00 21.00 7.20<br />
PEABODY SUB, Fairfield Distribution<br />
230.00 21.00 7.20<br />
PEACHTON SUB, Gridley Distribution<br />
60.00 12.00 2.40<br />
PEASE SUB, Tierra Buena Transmission<br />
115.00 12.00<br />
PENNGROVE SUB, Penngrove Distribution<br />
115.00 12.00<br />
PENRYN SUB, Penryn Distribution<br />
60.00 12.00 7.20<br />
PEORIA SUB, Jamestown Distribution<br />
115.00 18.00<br />
PETALUMA C SUB, Petaluma Distribution<br />
60.00 12.00<br />
PIERCY SUB, San Jose Distribution<br />
115.00 21.00 7.20<br />
PINE GROVE SUB, Pine Grove Distribution<br />
60.00 12.00 2.40<br />
PINEDALE SUB, FRESNO Distribution<br />
115.00 21.00 7.20<br />
<strong>FERC</strong> FORM NO. 1 (ED. 12-96) Page 426.9
Name of Respondent<br />
PACIFIC GAS AND ELECTRIC COMPANY<br />
This<br />
(1)<br />
Report<br />
X<br />
Is:<br />
An Original<br />
(2) A Resubmission<br />
SUBSTATIONS<br />
Date of Report<br />
(Mo, Da, Yr)<br />
04/08/2011<br />
Year/Period of Report<br />
End of <strong>2010</strong>/Q4<br />
1. Report below the information called for concerning substations of the respondent as of the end of the year.<br />
2. Substations which serve only one industrial or street railway customer should not be listed below.<br />
3. Substations with capacities of Less than 10 MVa except those serving customers with energy for resale, may be grouped according<br />
to functional character, but the number of such substations must be shown.<br />
4. Indicate in column (b) the functional character of each substation, designating whether transmission or distribution <strong>and</strong> whether<br />
attended or unattended. At the end of the page, summarize according to function the capacities reported for the individual stations in<br />
column (f).<br />
Line<br />
No.<br />
1<br />
2<br />
3<br />
4<br />
5<br />
6<br />
7<br />
8<br />
9<br />
10<br />
11<br />
12<br />
13<br />
14<br />
15<br />
16<br />
17<br />
18<br />
19<br />
20<br />
21<br />
22<br />
23<br />
24<br />
25<br />
26<br />
27<br />
28<br />
29<br />
30<br />
31<br />
32<br />
33<br />
34<br />
35<br />
36<br />
37<br />
38<br />
39<br />
40<br />
VOLTAGE (In MVa)<br />
Name <strong>and</strong> Location of Substation<br />
Character of Substation<br />
Primary Secondary Tertiary<br />
(a)<br />
(b)<br />
(c)<br />
(d)<br />
(e)<br />
PLACER SUB, Auburn Transmission<br />
115.00 12.00<br />
PLACERVILLE SUB, Placerville Distribution<br />
115.00 12.00 7.20<br />
PLACERVILLE SUB, Placerville Distribution<br />
115.00 21.00<br />
PLAINFIELD SUB, Davis Distribution<br />
60.00 12.00<br />
PLEASANT GROVE SUB, Pleasant Grove Distribution<br />
60.00 21.00 7.20<br />
PLUMAS SUB, Wheatl<strong>and</strong> Distribution<br />
60.00 21.00 7.20<br />
PLUMAS SUB, Wheatl<strong>and</strong> Distribution<br />
60.00 12.00 7.20<br />
POINT MORETTI SUB, Davenport Distribution<br />
60.00 12.00 2.40<br />
POINT PINOLE SUB, Richmond Distribution<br />
115.00 12.00 6.60<br />
POSO MOUNTAIN SUB, Kern Distribution<br />
115.00 21.00<br />
PRUNEDALE SUB, Prunedale Distribution<br />
115.00 12.00 7.20<br />
PUEBLO SUB, Napa Distribution<br />
115.00 12.00<br />
PUEBLO SUB, Napa Distribution<br />
115.00 21.00<br />
PURISIMA SUB, Lompoc Distribution<br />
115.00 12.00 7.20<br />
PUTAH CREEK SUB, Winters Distribution<br />
115.00 12.00<br />
RACE TRACK SUB, Jamestown Distribution<br />
115.00 17.00<br />
RADUM SUB, Pleasanton Distribution<br />
60.00 12.00<br />
RAINBOW SUB, Sanger Distribution<br />
115.00 12.00 7.20<br />
RALSTON SUB, Belmont Distribution<br />
60.00 12.00<br />
RANCHERS COTTON SUB, Fresno Distribution<br />
115.00 12.00 7.20<br />
RAWSON SUB, Red Bluff Distribution<br />
60.00 12.00 2.40<br />
RED BLUFF SUB, Red Bluff Distribution<br />
60.00 12.00 2.40<br />
REDBUD SUB, Clearlake Oaks Distribution<br />
115.00 12.00 7.20<br />
REDWOOD CITY SUB, Redwood City Distribution<br />
60.00 12.00 7.20<br />
REDWOOD CITY SUB, Redwood City Distribution<br />
60.00 4.00<br />
REEDLEY SUB, Reedley Transmission<br />
115.00 12.00 7.20<br />
REEDLEY SUB, Reedley Transmission<br />
70.00 12.00 2.40<br />
RENFRO SUB, BAKERSFIELD Distribution<br />
115.00 12.00 7.20<br />
RESEARCH SUB, San Ramon Distribution<br />
230.00 21.00 7.20<br />
RESERVATION ROAD SUB, Salinas Distribution<br />
60.00 12.00 2.40<br />
RESERVE OIL SUB, Hanford Distribution<br />
70.00 12.00 2.40<br />
RESERVE OIL SUB, Hanford Distribution<br />
70.00 4.00<br />
RICE SUB, Princeton Distribution<br />
60.00 12.00 4.16<br />
RICHMOND R SUB, Richmond Distribution<br />
115.00 12.00 6.60<br />
RINCON SUB, Santa Rosa Distribution<br />
115.00 12.00<br />
RIO BRAVO SUB, Shafter Distribution<br />
115.00 12.00 7.20<br />
RIO DELL SUB, Rio Dell Distribution<br />
60.00 12.00<br />
RIPON SUB, Ripon Distribution<br />
115.00 17.00<br />
RISING RIVER SUB, Cassell, Distribution<br />
60.00 12.00 2.40<br />
RIVER OAKS SUB, San Jose Distribution<br />
115.00 21.00 7.20<br />
<strong>FERC</strong> FORM NO. 1 (ED. 12-96) Page 426.10
Name of Respondent<br />
PACIFIC GAS AND ELECTRIC COMPANY<br />
This<br />
(1)<br />
Report<br />
X<br />
Is:<br />
An Original<br />
(2) A Resubmission<br />
SUBSTATIONS<br />
Date of Report<br />
(Mo, Da, Yr)<br />
04/08/2011<br />
Year/Period of Report<br />
End of <strong>2010</strong>/Q4<br />
1. Report below the information called for concerning substations of the respondent as of the end of the year.<br />
2. Substations which serve only one industrial or street railway customer should not be listed below.<br />
3. Substations with capacities of Less than 10 MVa except those serving customers with energy for resale, may be grouped according<br />
to functional character, but the number of such substations must be shown.<br />
4. Indicate in column (b) the functional character of each substation, designating whether transmission or distribution <strong>and</strong> whether<br />
attended or unattended. At the end of the page, summarize according to function the capacities reported for the individual stations in<br />
column (f).<br />
Line<br />
No.<br />
1<br />
2<br />
3<br />
4<br />
5<br />
6<br />
7<br />
8<br />
9<br />
10<br />
11<br />
12<br />
13<br />
14<br />
15<br />
16<br />
17<br />
18<br />
19<br />
20<br />
21<br />
22<br />
23<br />
24<br />
25<br />
26<br />
27<br />
28<br />
29<br />
30<br />
31<br />
32<br />
33<br />
34<br />
35<br />
36<br />
37<br />
38<br />
39<br />
40<br />
VOLTAGE (In MVa)<br />
Name <strong>and</strong> Location of Substation<br />
Character of Substation<br />
Primary Secondary Tertiary<br />
(a)<br />
(b)<br />
(c)<br />
(d)<br />
(e)<br />
RIVERBANK SUB, Escalon Distribution<br />
115.00 12.00<br />
ROB ROY SUB, Watsonville Distribution<br />
115.00 21.00 7.20<br />
ROCKLIN SUB, Rocklin Distribution<br />
60.00 12.00 7.20<br />
ROSEDALE SUB, Bakersfield Distribution<br />
115.00 12.00 7.20<br />
ROSSMOOR SUB, Walnut Creek Distribution<br />
230.00 12.00<br />
ROUGH & READY ISLAND SUB, Stockton Distribution<br />
60.00 12.00 7.20<br />
SALINAS SUB, Salinas Transmission<br />
115.00 12.00 7.20<br />
SALMON CREEK SUB, Bodega Bay Distribution<br />
60.00 12.00 2.40<br />
SAN ARDO SUB, San Ardo Distribution<br />
60.00 12.00<br />
SAN BERNARD SUB, Lamont Distribution<br />
70.00 12.00 2.40<br />
SAN CARLOS SUB, San Carlos Distribution<br />
60.00 12.00 7.20<br />
SAN CARLOS SUB, San Carlos Distribution<br />
60.00 4.00 2.40<br />
SAN FRAN A (POTRERO PP) SUB, San Franc Distribution<br />
115.00 12.00 7.20<br />
SAN FRAN H (MARTIN) SUB, Daly City Transmission<br />
115.00 12.00<br />
SAN FRAN P-HUNTERS POINT SUB, San Fran Distribution<br />
115.00 12.00<br />
SAN FRAN X (MISSION) SUB, San Francisc Distribution<br />
115.00 12.00<br />
SAN FRAN Y (LARKIN) SUB, San Francisco Distribution<br />
115.00 12.00<br />
SAN JOAQUIN SUB, San Joaquin Distribution<br />
70.00 12.00 7.20<br />
SAN JOSE A SUB, San Jose Distribution<br />
115.00 4.00 7.20<br />
SAN JOSE A SUB, San Jose Distribution<br />
115.00 12.00<br />
SAN JOSE B SUB, San Jose Distribution<br />
115.00 12.00 7.20<br />
SAN LEANDRO U SUB, San Le<strong>and</strong>ro Distribution<br />
115.00 12.00<br />
SAN LUIS OBISPO SUB, SLO Transmission<br />
115.00 12.00 7.20<br />
SAN MATEO SUB, San Mateo Transmission<br />
115.00 21.00<br />
SAN MATEO SUB, San Mateo Transmission<br />
60.00 4.00<br />
SAN MIGUEL SUB, San Miguel Distribution<br />
70.00 12.00 7.20<br />
SAN PABLO SUB, Richmond Distribution<br />
115.00 12.00 7.20<br />
SAN RAFAEL SUB, San Rafael Distribution<br />
115.00 12.00 4.16<br />
SAN RAMON SUB, San Ramon Transmission<br />
230.00 21.00 12.00<br />
SANGER SUB, Fresno Transmission<br />
115.00 12.00 7.20<br />
SANTA MARIA SUB, Santa Maria Distribution<br />
115.00 12.00 7.20<br />
SANTA NELLA SUB, Santa Nella Distribution<br />
70.00 12.00 2.40<br />
SANTA RITA SUB, Dos Palos Distribution<br />
70.00 12.00 2.40<br />
SANTA ROSA A SUB, Santa Rosa Distribution<br />
115.00 12.00 7.20<br />
SANTA YNEZ SUB, Santa Maria Distribution<br />
115.00 12.00 7.20<br />
SARATOGA SUB, Saratoga Distribution<br />
230.00 12.00 7.20<br />
SAUSALITO SUB, Sausalito Distribution<br />
60.00 12.00 2.40<br />
SAUSALITO SUB, Sausalito Distribution<br />
60.00 4.00<br />
SCHINDLER SUB, Five Points Transmission<br />
115.00 12.00 7.20<br />
SEMITROPIC SUB, Wasco Transmission<br />
115.00 12.00 7.20<br />
<strong>FERC</strong> FORM NO. 1 (ED. 12-96) Page 426.11
Name of Respondent<br />
PACIFIC GAS AND ELECTRIC COMPANY<br />
This<br />
(1)<br />
Report<br />
X<br />
Is:<br />
An Original<br />
(2) A Resubmission<br />
SUBSTATIONS<br />
Date of Report<br />
(Mo, Da, Yr)<br />
04/08/2011<br />
Year/Period of Report<br />
End of <strong>2010</strong>/Q4<br />
1. Report below the information called for concerning substations of the respondent as of the end of the year.<br />
2. Substations which serve only one industrial or street railway customer should not be listed below.<br />
3. Substations with capacities of Less than 10 MVa except those serving customers with energy for resale, may be grouped according<br />
to functional character, but the number of such substations must be shown.<br />
4. Indicate in column (b) the functional character of each substation, designating whether transmission or distribution <strong>and</strong> whether<br />
attended or unattended. At the end of the page, summarize according to function the capacities reported for the individual stations in<br />
column (f).<br />
Line<br />
No.<br />
1<br />
2<br />
3<br />
4<br />
5<br />
6<br />
7<br />
8<br />
9<br />
10<br />
11<br />
12<br />
13<br />
14<br />
15<br />
16<br />
17<br />
18<br />
19<br />
20<br />
21<br />
22<br />
23<br />
24<br />
25<br />
26<br />
27<br />
28<br />
29<br />
30<br />
31<br />
32<br />
33<br />
34<br />
35<br />
36<br />
37<br />
38<br />
39<br />
40<br />
VOLTAGE (In MVa)<br />
Name <strong>and</strong> Location of Substation<br />
Character of Substation<br />
Primary Secondary Tertiary<br />
(a)<br />
(b)<br />
(c)<br />
(d)<br />
(e)<br />
SERRAMONTE SUB, Daly City Distribution<br />
115.00 12.00<br />
SHAFTER SUB, Shafter Distribution<br />
115.00 12.00 7.20<br />
SHARON SUB, Chowchilla Distribution<br />
115.00 12.00<br />
SHINGLE SPRINGS SUB, Shingle Springs Distribution<br />
115.00 21.00 7.20<br />
SHINGLE SPRINGS SUB, Shingle Springs Distribution<br />
115.00 12.00 7.20<br />
SHREDDER SUB, Redwood City Distribution<br />
115.00 4.00 6.60<br />
SILVERADO SUB, St. Helena Distribution<br />
115.00 21.00<br />
SISQUOC SUB, Orcutt Distribution<br />
115.00 12.00 7.20<br />
SMYRNA SUB, Wasco Distribution<br />
115.00 12.00 7.20<br />
SNEATH LANE SUB, San Bruno Distribution<br />
60.00 12.00 2.40<br />
SOBRANTE SUB, Orinda Transmission<br />
115.00 12.00 7.20<br />
SOLEDAD SUB, Soledad Transmission<br />
60.00 12.00<br />
SONOMA A SUB, Sonoma Distribution<br />
115.00 12.00<br />
SOUTH BAY #1 & #2 SUB, Tracy Distribution<br />
60.00 4.00<br />
SPANISH CREEK SUB, Distribution<br />
60.00 44.00<br />
SPENCE SUB, Salinas Distribution<br />
60.00 12.00<br />
SRI SUB, Menlo Park Distribution<br />
60.00 12.00<br />
STAFFORD SUB, Novato Distribution<br />
60.00 12.00<br />
STAGG SUB, Stockton Transmission<br />
230.00 21.00 7.20<br />
STAGG SUB, Stockton Transmission<br />
60.00 12.00 2.40<br />
STALLION SUB, Bakersfield Distribution<br />
70.00 4.00 7.20<br />
STELLING SUB, Cupertino Distribution<br />
115.00 12.00 7.20<br />
STILLWATER STA SUB, Project City Distribution<br />
60.00 12.00 2.40<br />
STOCKDALE SUB, Bakersfield Distribution<br />
230.00 21.00 7.20<br />
STOCKDALE SUB, Bakersfield Distribution<br />
115.00 12.00 7.20<br />
STOCKTON A SUB, Stockton Transmission<br />
115.00 12.00<br />
STOCKTON A SUB, Stockton Transmission<br />
60.00 4.00<br />
STONE CORRAL SUB, Woodlake Distribution<br />
70.00 12.00 7.20<br />
STONE SUB, San Jose Distribution<br />
115.00 12.00 7.20<br />
STOREY SUB, Madera Distribution<br />
230.00 12.00 7.20<br />
STROUD SUB, Helm Distribution<br />
70.00 12.00 2.40<br />
SUISUN SUB, Fairfield Distribution<br />
115.00 12.00 7.20<br />
SUNOL SUB, Sunol Distribution<br />
60.00 12.00 7.20<br />
SWIFT SUB, San Jose Distribution<br />
115.00 21.00 7.20<br />
SYCAMORE CREEK SUB, Chico Distribution<br />
115.00 12.00<br />
TAFT SUB, Taft Transmission<br />
115.00 12.00 7.20<br />
TASSAJARA SUB, Danville Distribution<br />
230.00 21.00 7.20<br />
TEJON SUB, Leboc Distribution<br />
70.00 12.00 2.40<br />
TEMBLOR SUB, McKittrick Distribution<br />
115.00 12.00 2.40<br />
TEMPLETON SUB, TEMPLETON Transmission<br />
230.00 21.00 7.20<br />
<strong>FERC</strong> FORM NO. 1 (ED. 12-96) Page 426.12
Name of Respondent<br />
PACIFIC GAS AND ELECTRIC COMPANY<br />
This<br />
(1)<br />
Report<br />
X<br />
Is:<br />
An Original<br />
(2) A Resubmission<br />
SUBSTATIONS<br />
Date of Report<br />
(Mo, Da, Yr)<br />
04/08/2011<br />
Year/Period of Report<br />
End of <strong>2010</strong>/Q4<br />
1. Report below the information called for concerning substations of the respondent as of the end of the year.<br />
2. Substations which serve only one industrial or street railway customer should not be listed below.<br />
3. Substations with capacities of Less than 10 MVa except those serving customers with energy for resale, may be grouped according<br />
to functional character, but the number of such substations must be shown.<br />
4. Indicate in column (b) the functional character of each substation, designating whether transmission or distribution <strong>and</strong> whether<br />
attended or unattended. At the end of the page, summarize according to function the capacities reported for the individual stations in<br />
column (f).<br />
Line<br />
No.<br />
1<br />
2<br />
3<br />
4<br />
5<br />
6<br />
7<br />
8<br />
9<br />
10<br />
11<br />
12<br />
13<br />
14<br />
15<br />
16<br />
17<br />
18<br />
19<br />
20<br />
21<br />
22<br />
23<br />
24<br />
25<br />
26<br />
27<br />
28<br />
29<br />
30<br />
31<br />
32<br />
33<br />
34<br />
35<br />
36<br />
37<br />
38<br />
39<br />
40<br />
VOLTAGE (In MVa)<br />
Name <strong>and</strong> Location of Substation<br />
Character of Substation<br />
Primary Secondary Tertiary<br />
(a)<br />
(b)<br />
(c)<br />
(d)<br />
(e)<br />
TEVIS SUB, Oildale Distribution<br />
115.00 21.00 7.20<br />
TIDEWATER SUB, Martinez Distribution<br />
230.00 21.00<br />
TIVY VALLEY SUB, Fresno Distribution<br />
70.00 12.00 7.20<br />
TRACY SUB, Tracy Distribution<br />
115.00 12.00 4.16<br />
TRES VIAS SUB, Oroville Distribution<br />
60.00 12.00 7.20<br />
TRIMBLE SUB, San Jose Distribution<br />
115.00 12.00 7.20<br />
TRIMBLE SUB, San Jose Distribution<br />
115.00 21.00 7.20<br />
TULARE LAKE SUB, Kettleman Distribution<br />
70.00 12.00 2.40<br />
TULUCAY SUB, Napa Transmission<br />
60.00 12.00<br />
TUPMAN SUB, Tupman Distribution<br />
115.00 12.00 7.20<br />
TWISSELMAN SUB, Blackwell Corners Distribution<br />
70.00 12.00 7.20<br />
TYLER SUB, Red Bluff Distribution<br />
60.00 12.00 2.40<br />
UKIAH SUB, Ukiah Distribution<br />
115.00 12.00 7.20<br />
URICH SUB, Martinez Distribution<br />
60.00 4.00<br />
VACA DIXON SUB, Vacaville Transmission<br />
115.00 12.00 7.20<br />
VACAVILLE SUB, Vacaville Distribution<br />
115.00 12.00 7.20<br />
VALLEY VIEW SUB, El Sobrante Distribution<br />
115.00 12.00<br />
VASCO SUB, Livermore Distribution<br />
60.00 12.00<br />
VASONA SUB, Los Gatos Distribution<br />
230.00 12.00 7.20<br />
VICTOR SUB, Lodi Distribution<br />
60.00 12.00 2.40<br />
VICTOR SUB, Lodi Distribution<br />
60.00 4.00<br />
VIEJO SUB, Monterey Distribution<br />
60.00 21.00 7.20<br />
VIERRA SUB, Lathrop Distribution<br />
115.00 17.00 7.20<br />
VINEYARD SUB, Pleasanton Distribution<br />
230.00 21.00 7.20<br />
VOLTA #1PH SUB, Shingletown Distribution<br />
60.00 12.00 2.40<br />
WAHTOKE SUB, Reedley Distribution<br />
115.00 12.00 7.20<br />
WASCO SUB, Wasco Distribution<br />
70.00 12.00 2.40<br />
WATERLOO SUB, Stockton Distribution<br />
60.00 12.00 2.40<br />
WATSONVILLE SUB, Watsonville Distribution<br />
60.00 12.00 7.20<br />
WATSONVILLE SUB, Watsonville Distribution<br />
60.00 4.00<br />
WEBER SUB, Stockton Transmission<br />
60.00 12.00 7.20<br />
WEBER SUB, Stockton Transmission<br />
230.00 12.00 7.20<br />
WEEDPATCH SUB, Weedpatch Distribution<br />
70.00 12.00 7.20<br />
WELLFIELD SUB, Lamont Distribution<br />
70.00 12.00 2.40<br />
WEST FRESNO SUB, Fresno Distribution<br />
115.00 12.00 7.20<br />
WEST LANE SUB, Stockton Distribution<br />
60.00 12.00 7.20<br />
WEST SACRAMENTO SUB, WEST SACRAMENTO Distribution<br />
115.00 12.00 7.20<br />
WESTLEY SUB, Westley Distribution<br />
60.00 12.00 2.40<br />
WESTPARK SUB, Bakersfield Distribution<br />
115.00 12.00 7.20<br />
WHEATLAND SUB, Wheatl<strong>and</strong> Distribution<br />
60.00 12.00 7.20<br />
<strong>FERC</strong> FORM NO. 1 (ED. 12-96) Page 426.13
Name of Respondent<br />
PACIFIC GAS AND ELECTRIC COMPANY<br />
This<br />
(1)<br />
Report<br />
X<br />
Is:<br />
An Original<br />
(2) A Resubmission<br />
SUBSTATIONS<br />
Date of Report<br />
(Mo, Da, Yr)<br />
04/08/2011<br />
Year/Period of Report<br />
End of <strong>2010</strong>/Q4<br />
1. Report below the information called for concerning substations of the respondent as of the end of the year.<br />
2. Substations which serve only one industrial or street railway customer should not be listed below.<br />
3. Substations with capacities of Less than 10 MVa except those serving customers with energy for resale, may be grouped according<br />
to functional character, but the number of such substations must be shown.<br />
4. Indicate in column (b) the functional character of each substation, designating whether transmission or distribution <strong>and</strong> whether<br />
attended or unattended. At the end of the page, summarize according to function the capacities reported for the individual stations in<br />
column (f).<br />
Line<br />
No.<br />
1<br />
2<br />
3<br />
4<br />
5<br />
6<br />
7<br />
8<br />
9<br />
10<br />
11<br />
12<br />
13<br />
14<br />
15<br />
16<br />
17<br />
18<br />
19<br />
20<br />
21<br />
22<br />
23<br />
24<br />
25<br />
26<br />
27<br />
28<br />
29<br />
30<br />
31<br />
32<br />
33<br />
34<br />
35<br />
36<br />
37<br />
38<br />
39<br />
40<br />
VOLTAGE (In MVa)<br />
Name <strong>and</strong> Location of Substation<br />
Character of Substation<br />
Primary Secondary Tertiary<br />
(a)<br />
(b)<br />
(c)<br />
(d)<br />
(e)<br />
WHEELER RIDGE SUB, Bakersfield Transmission<br />
70.00 12.00 2.40<br />
WHISMAN SUB, Mt. View Distribution<br />
115.00 12.00 7.20<br />
WILLIAMS SUB, Williams Distribution<br />
60.00 12.00 7.20<br />
WILLITS A SUB, Willits Distribution<br />
60.00 12.00 2.40<br />
WILLOW PASS SUB, Pittsburg Distribution<br />
115.00 21.00 7.20<br />
WILLOW PASS SUB, Pittsburg Distribution<br />
60.00 12.00 2.40<br />
WILLOWS A SUB, Willows Distribution<br />
60.00 12.00<br />
WILSON SUB, Merced Transmission<br />
115.00 12.00<br />
WOLFE SUB, Cupertino Distribution<br />
115.00 12.00<br />
WOODCHUCK SUB, Wilson Village Distribution<br />
70.00 21.00<br />
WOODLAND SUB, Woodl<strong>and</strong> Distribution<br />
115.00 12.00 7.20<br />
WOODSIDE SUB, Woodside Distribution<br />
60.00 12.00<br />
WOODWARD SUB, Fresno Distribution<br />
115.00 21.00 7.20<br />
WRIGHT SUB, Los Banos Distribution<br />
70.00 12.00 2.40<br />
WYANDOTTE SUB, Oroville Distribution<br />
115.00 12.00 7.20<br />
ZACA SUB, Santa Maria Distribution<br />
115.00 12.00 7.20<br />
ZAMORA SUB, Zamora Distribution<br />
115.00 12.00<br />
Substations of < 10 MVA<br />
Distribution<br />
Rounding issues in column f<br />
SUBTOTAL DISTRIBUTION SUBSTATIONS 56350.00 7574.60 2590.08<br />
ARCO SUB, Lost Hills Transmission<br />
230.00 70.00 13.20<br />
ATLANTIC SUB, Roseville Transmission<br />
230.00 60.00 13.20<br />
BAIR SUB, Redwood City Transmission<br />
115.00 60.00 13.20<br />
BELLOTA SUB, Bellota Transmission<br />
230.00 115.00 13.20<br />
BORDEN SUB, Madera Transmission<br />
230.00 70.00 13.20<br />
BRIDGEVILLE SUB, Bridgeville Transmission<br />
115.00 60.00 12.00<br />
BRIGHTON SUB, Sacramento Transmission<br />
230.00 115.00 13.20<br />
BUTTE SUB, Chico Transmission<br />
115.00 60.00 12.00<br />
CASCADE SUB, Pine Grove Transmission<br />
115.00 60.00 13.20<br />
CHRISTIE SUB, Hercules Transmission<br />
115.00 60.00 13.20<br />
COBURN SUB, King City Transmission<br />
230.00 60.00 13.20<br />
CONTRA COSTA SUBSTATION, Antioch Transmission<br />
115.00 60.00 6.60<br />
CONTRA COSTA SUBSTATION, Antioch Transmission<br />
230.00 115.00 13.20<br />
COOLEY LANDING SUB, Palo Alto Transmission<br />
115.00 60.00 13.80<br />
CORCORAN SUB, Corcoran Transmission<br />
115.00 70.00 6.60<br />
CORTINA SUB, Williams Transmission<br />
230.00 115.00 13.20<br />
COTTONWOOD SUB, Cottonwood Transmission<br />
230.00 60.00 13.20<br />
COTTONWOOD SUB, Cottonwood Transmission<br />
230.00 115.00 13.20<br />
<strong>FERC</strong> FORM NO. 1 (ED. 12-96) Page 426.14
Name of Respondent<br />
PACIFIC GAS AND ELECTRIC COMPANY<br />
This<br />
(1)<br />
Report<br />
X<br />
Is:<br />
An Original<br />
(2) A Resubmission<br />
SUBSTATIONS<br />
Date of Report<br />
(Mo, Da, Yr)<br />
04/08/2011<br />
Year/Period of Report<br />
End of <strong>2010</strong>/Q4<br />
1. Report below the information called for concerning substations of the respondent as of the end of the year.<br />
2. Substations which serve only one industrial or street railway customer should not be listed below.<br />
3. Substations with capacities of Less than 10 MVa except those serving customers with energy for resale, may be grouped according<br />
to functional character, but the number of such substations must be shown.<br />
4. Indicate in column (b) the functional character of each substation, designating whether transmission or distribution <strong>and</strong> whether<br />
attended or unattended. At the end of the page, summarize according to function the capacities reported for the individual stations in<br />
column (f).<br />
Line<br />
No.<br />
1<br />
2<br />
3<br />
4<br />
5<br />
6<br />
7<br />
8<br />
9<br />
10<br />
11<br />
12<br />
13<br />
14<br />
15<br />
16<br />
17<br />
18<br />
19<br />
20<br />
21<br />
22<br />
23<br />
24<br />
25<br />
26<br />
27<br />
28<br />
29<br />
30<br />
31<br />
32<br />
33<br />
34<br />
35<br />
36<br />
37<br />
38<br />
39<br />
40<br />
VOLTAGE (In MVa)<br />
Name <strong>and</strong> Location of Substation<br />
Character of Substation<br />
Primary Secondary Tertiary<br />
(a)<br />
(b)<br />
(c)<br />
(d)<br />
(e)<br />
DEL MONTE SUB, Monterey Transmission<br />
115.00 60.00 13.20<br />
DIVIDE SUB, Orcutt Transmission<br />
115.00 70.00 13.20<br />
EAGLE ROCK SUB, Geysers Transmission<br />
115.00 60.00<br />
EAST NICOLAUS SUB, E. Nicolaus Transmission<br />
115.00 60.00<br />
EASTSHORE SUB, Hayward Transmission<br />
230.00 115.00<br />
EVERGREEN SUB, San Jose Transmission<br />
115.00 60.00 13.20<br />
FULTON SUB, Fulton Transmission<br />
115.00 60.00 13.20<br />
FULTON SUB, Fulton Transmission<br />
230.00 115.00 13.20<br />
GATES SUB, Huron Transmission<br />
115.00 70.00 13.20<br />
GATES SUB, Huron Transmission<br />
230.00 115.00 13.20<br />
GATES SUB, Huron Transmission<br />
500.00 230.00 13.20<br />
GLENN SUB, Orl<strong>and</strong> Transmission<br />
230.00 60.00 13.20<br />
GOLD HILL SUB, Folsom Transmission<br />
115.00 60.00 13.20<br />
GOLD HILL SUB, Folsom Transmission<br />
230.00 115.00 13.20<br />
GREEN VALLEY SUB, Watsonville Transmission<br />
115.00 60.00<br />
HELM SUB, San Joaquin Transmission<br />
230.00 70.00 13.20<br />
HENRIETTA SUB, Lamoore Transmission<br />
230.00 70.00 13.20<br />
HENRIETTA SUB, Lamoore Transmission<br />
230.00 115.00 2.40<br />
HERDLYN SUB, Tracy Transmission<br />
70.00 60.00 2.40<br />
HERNDON SUB, Herndon Transmission<br />
230.00 115.00 13.20<br />
HOPLAND SUB, Hopl<strong>and</strong> Transmission<br />
115.00 60.00 13.20<br />
HUMBOLDT SUB SUB, Eureka Transmission<br />
115.00 60.00 12.00<br />
IGNACIO SUB, Ignacio Transmission<br />
115.00 60.00 13.20<br />
IGNACIO SUB, Ignacio Transmission<br />
230.00 115.00 13.20<br />
JEFFERSON SUB, Redwood City Transmission<br />
230.00 60.00 13.20<br />
KASSON SUB, Tracy Transmission<br />
115.00 60.00 13.20<br />
KERN PP SUB, Bakersfield Transmission<br />
115.00 70.00 13.20<br />
KERN PP SUB, Bakersfield Transmission<br />
230.00 115.00 13.20<br />
KINGSBURG SUB, Kingsburg Transmission<br />
115.00 70.00 13.80<br />
LAKEVILLE SUB, Petaluma Transmission<br />
230.00 60.00 13.20<br />
LAKEVILLE SUB, Petaluma Transmission<br />
230.00 115.00 13.20<br />
LAS POSITAS SUB, Livermore Transmission<br />
230.00 60.00 13.20<br />
LOCKEFORD SUB, Lockeford Transmission<br />
230.00 60.00 13.20<br />
LOS BANOS SUB, Los Banos Transmission<br />
230.00 70.00 13.20<br />
LOS BANOS SUB, Los Banos Transmission<br />
500.00 230.00 13.80<br />
LOS ESTEROS SUB, Transmission<br />
230.00 115.00 12.00<br />
MANTECA SUB, Manteca Transmission<br />
115.00 60.00 12.80<br />
MCCALL SUB, Selma Transmission<br />
230.00 115.00 13.20<br />
MENDOCINO SUB, Redwood Valley Transmission<br />
115.00 60.00 13.20<br />
MENDOTA SUB, Mendota Transmission<br />
115.00 70.00 13.80<br />
<strong>FERC</strong> FORM NO. 1 (ED. 12-96) Page 426.15
Name of Respondent<br />
PACIFIC GAS AND ELECTRIC COMPANY<br />
This<br />
(1)<br />
Report<br />
X<br />
Is:<br />
An Original<br />
(2) A Resubmission<br />
SUBSTATIONS<br />
Date of Report<br />
(Mo, Da, Yr)<br />
04/08/2011<br />
Year/Period of Report<br />
End of <strong>2010</strong>/Q4<br />
1. Report below the information called for concerning substations of the respondent as of the end of the year.<br />
2. Substations which serve only one industrial or street railway customer should not be listed below.<br />
3. Substations with capacities of Less than 10 MVa except those serving customers with energy for resale, may be grouped according<br />
to functional character, but the number of such substations must be shown.<br />
4. Indicate in column (b) the functional character of each substation, designating whether transmission or distribution <strong>and</strong> whether<br />
attended or unattended. At the end of the page, summarize according to function the capacities reported for the individual stations in<br />
column (f).<br />
Line<br />
No.<br />
1<br />
2<br />
3<br />
4<br />
5<br />
6<br />
7<br />
8<br />
9<br />
10<br />
11<br />
12<br />
13<br />
14<br />
15<br />
16<br />
17<br />
18<br />
19<br />
20<br />
21<br />
22<br />
23<br />
24<br />
25<br />
26<br />
27<br />
28<br />
29<br />
30<br />
31<br />
32<br />
33<br />
34<br />
35<br />
36<br />
37<br />
38<br />
39<br />
40<br />
VOLTAGE (In MVa)<br />
Name <strong>and</strong> Location of Substation<br />
Character of Substation<br />
Primary Secondary Tertiary<br />
(a)<br />
(b)<br />
(c)<br />
(d)<br />
(e)<br />
MERCED SUB, Merced Transmission<br />
115.00 70.00 6.60<br />
MESA SUB, Nipomo Transmission<br />
230.00 115.00 13.20<br />
METCALF SUB, San Jose Transmission<br />
230.00 115.00 13.20<br />
METCALF SUB, San Jose Transmission<br />
500.00 230.00 13.80<br />
MIDWAY SUB, Buttonwillow Transmission<br />
230.00 115.00 12.80<br />
MIDWAY SUB, Buttonwillow Transmission<br />
500.00 230.00 13.80<br />
MILLBRAE SUB, Millbrae Transmission<br />
115.00 60.00 13.80<br />
MONTA VISTA SUB, Cupertino Transmission<br />
115.00 60.00 13.20<br />
MONTA VISTA SUB, Cupertino Transmission<br />
230.00 60.00<br />
MONTA VISTA SUB, Cupertino Transmission<br />
230.00 115.00 13.20<br />
MORAGA SUB, Orinda Transmission<br />
230.00 115.00 13.20<br />
MORRO BAY SW STA SUB, Morro Bay Transmission<br />
230.00 115.00 13.20<br />
MOSS LANDING PP SUB, Moss L<strong>and</strong>ing Transmission<br />
230.00 115.00 13.20<br />
MOSS LANDING PP SUB, Moss L<strong>and</strong>ing Transmission<br />
500.00 230.00 13.80<br />
NEW KEARNEY SUB, FRESNO Transmission<br />
230.00 70.00 13.20<br />
NEWARK SUB, Fremont Transmission<br />
115.00 60.00 13.20<br />
NEWARK SUB, Fremont Transmission<br />
230.00 115.00 13.20<br />
ORO LOMA SUB, Dos Palos Transmission<br />
115.00 70.00 13.20<br />
PALERMO SUB, Palermo Transmission<br />
230.00 60.00<br />
PALERMO SUB, Palermo Transmission<br />
230.00 115.00 13.20<br />
PANOCHE SUB, Mendota Transmission<br />
230.00 115.00 13.20<br />
PEASE SUB, Tierra Buena Transmission<br />
115.00 60.00 13.20<br />
PITTSBURG PP SUB, Transmission<br />
230.00 115.00 13.20<br />
PLACER SUB, Auburn Transmission<br />
115.00 60.00<br />
RAVENSWOOD SUB, Menlo Park Transmission<br />
230.00 115.00 13.20<br />
REEDLEY SUB, Reedley Transmission<br />
115.00 70.00 13.20<br />
RIO OSO SUB, Rio Oso Transmission<br />
230.00 115.00 13.20<br />
ROUND MOUNTAIN SUB, Rd Mtn Transmission<br />
500.00 230.00 13.80<br />
SALADO SUB, Patterson Transmission<br />
115.00 70.00 12.00<br />
SALINAS SUB, Salinas Transmission<br />
115.00 60.00 13.20<br />
SAN FRAN H (MARTIN) SUB, Daly City Transmission<br />
115.00 60.00<br />
SAN FRAN H (MARTIN) SUB, Daly City Transmission<br />
230.00 115.00<br />
SAN LUIS OBISPO SUB, SLO Transmission<br />
115.00 70.00<br />
SAN MATEO SUB, San Mateo Transmission<br />
115.00 60.00<br />
SAN MATEO SUB, San Mateo Transmission<br />
230.00 115.00<br />
SAN RAMON SUB, San Ramon Transmission<br />
230.00 60.00 13.20<br />
SANGER SUB, Fresno Transmission<br />
115.00 70.00 6.60<br />
SCHINDLER SUB, Five Points Transmission<br />
115.00 70.00 13.20<br />
SEMITROPIC SUB, Wasco Transmission<br />
115.00 70.00 13.80<br />
SOBRANTE SUB, Orinda Transmission<br />
230.00 115.00<br />
<strong>FERC</strong> FORM NO. 1 (ED. 12-96) Page 426.16
Name of Respondent<br />
PACIFIC GAS AND ELECTRIC COMPANY<br />
This<br />
(1)<br />
Report<br />
X<br />
Is:<br />
An Original<br />
(2) A Resubmission<br />
SUBSTATIONS<br />
Date of Report<br />
(Mo, Da, Yr)<br />
04/08/2011<br />
Year/Period of Report<br />
End of <strong>2010</strong>/Q4<br />
1. Report below the information called for concerning substations of the respondent as of the end of the year.<br />
2. Substations which serve only one industrial or street railway customer should not be listed below.<br />
3. Substations with capacities of Less than 10 MVa except those serving customers with energy for resale, may be grouped according<br />
to functional character, but the number of such substations must be shown.<br />
4. Indicate in column (b) the functional character of each substation, designating whether transmission or distribution <strong>and</strong> whether<br />
attended or unattended. At the end of the page, summarize according to function the capacities reported for the individual stations in<br />
column (f).<br />
Line<br />
No.<br />
1<br />
2<br />
3<br />
4<br />
5<br />
6<br />
7<br />
8<br />
9<br />
10<br />
11<br />
12<br />
13<br />
14<br />
15<br />
16<br />
17<br />
18<br />
19<br />
20<br />
21<br />
22<br />
23<br />
24<br />
25<br />
26<br />
27<br />
28<br />
29<br />
30<br />
31<br />
32<br />
33<br />
34<br />
35<br />
36<br />
37<br />
38<br />
39<br />
40<br />
VOLTAGE (In MVa)<br />
Name <strong>and</strong> Location of Substation<br />
Character of Substation<br />
Primary Secondary Tertiary<br />
(a)<br />
(b)<br />
(c)<br />
(d)<br />
(e)<br />
SOLEDAD SUB, Soledad Transmission<br />
115.00 60.00<br />
STAGG SUB, Stockton Transmission<br />
230.00 60.00 13.20<br />
TABLE MOUNTAIN SUB, Oroville Transmission<br />
230.00 115.00<br />
TABLE MOUNTAIN SUB, Oroville Transmission<br />
500.00 230.00 13.80<br />
TAFT SUB, Taft Transmission<br />
115.00 70.00 13.20<br />
TEMPLETON SUB, TEMPLETON Transmission<br />
230.00 70.00 13.20<br />
TESLA SUB, Tracy Transmission<br />
230.00 115.00 13.20<br />
TESLA SUB, Tracy Transmission<br />
500.00 230.00 13.20<br />
TRINITY SUB, Weaverville Transmission<br />
115.00 60.00 13.20<br />
TULUCAY SUB, Napa Transmission<br />
230.00 60.00 13.20<br />
VACA DIXON SUB, Vacaville Transmission<br />
115.00 60.00 13.20<br />
VACA DIXON SUB, Vacaville Transmission<br />
230.00 115.00 13.20<br />
VACA DIXON SUB, Vacaville Transmission<br />
500.00 230.00 13.80<br />
VALLEY SPRINGS SUB, Valley Springs Transmission<br />
230.00 60.00<br />
WEBER SUB, Stockton Transmission<br />
230.00 60.00 13.20<br />
WHEELER RIDGE SUB, Bakersfield Transmission<br />
115.00 70.00 13.20<br />
WHEELER RIDGE SUB, Bakersfield Transmission<br />
230.00 70.00 13.20<br />
WILSON SUB, Merced Transmission<br />
230.00 115.00 13.20<br />
Rounding issues in column f<br />
SUBTOTAL TRANSMISSION SUBSTATIONS 23545.00 10710.00 1272.40<br />
TOTAL DISTRIBUTION & TRANSMISSION SUBSTATIONS 79895.00 18284.60 3862.48<br />
<strong>FERC</strong> FORM NO. 1 (ED. 12-96) Page 426.17
Name of Respondent<br />
PACIFIC GAS AND ELECTRIC COMPANY<br />
This<br />
(1)<br />
Report<br />
X<br />
Is:<br />
An Original<br />
(2) A Resubmission<br />
SUBSTATIONS (Continued)<br />
Date of Report<br />
(Mo, Da, Yr)<br />
04/08/2011<br />
Year/Period of Report<br />
End of <strong>2010</strong>/Q4<br />
5. Show in columns (I), (j), <strong>and</strong> (k) special equipment such as rotary converters, rectifiers, condensers, etc. <strong>and</strong> auxiliary equipment for<br />
increasing capacity.<br />
6. Designate substations or major items of equipment leased from others, jointly owned with others, or operated otherwise than by<br />
reason of sole ownership by the respondent. For any substation or equipment operated under lease, give name of lessor, date <strong>and</strong><br />
period of lease, <strong>and</strong> annual rent. For any substation or equipment operated other than by reason of sole ownership or lease, give name<br />
of co-owner or other party, explain basis of sharing expenses or other accounting between the parties, <strong>and</strong> state amounts <strong>and</strong> accounts<br />
affected in respondent's books of account. Specify in each case whether lessor, co-owner, or other party is an associated company.<br />
Capacity of Substation<br />
Number of Number of<br />
CONVERSION APPARATUS AND SPECIAL EQUIPMENT Line<br />
Transformers<br />
Spare<br />
(In Service) (In MVa) In Service Transformers<br />
Type of Equipment<br />
Number of Units Total Capacity No.<br />
(In MVa)<br />
(f)<br />
(g)<br />
(h)<br />
(i)<br />
(j)<br />
(k)<br />
90 2 1<br />
27 2 2<br />
60 2 3<br />
11 1 4<br />
38 6 1 5<br />
30 1 6<br />
19 3 1 7<br />
16 1 8<br />
11 1 9<br />
11 3 1 10<br />
16 1 11<br />
16 1 12<br />
27 4 1 13<br />
54 2 14<br />
11 3 15<br />
210 3 16<br />
30 1 17<br />
90 2 18<br />
25 2 19<br />
16 3 1 20<br />
16 1 21<br />
112 2 22<br />
45 2 23<br />
150 2 24<br />
13 1 25<br />
120 3 26<br />
39 4 27<br />
90 2 28<br />
75 2 29<br />
13 1 30<br />
57 2 31<br />
57 3 32<br />
16 6 1 33<br />
70 3 34<br />
125 3 35<br />
10 2 36<br />
11 2 37<br />
11 3 1 38<br />
15 3 39<br />
20 3 40<br />
<strong>FERC</strong> FORM NO. 1 (ED. 12-96) Page 427
Name of Respondent<br />
PACIFIC GAS AND ELECTRIC COMPANY<br />
This<br />
(1)<br />
Report<br />
X<br />
Is:<br />
An Original<br />
(2) A Resubmission<br />
SUBSTATIONS (Continued)<br />
Date of Report<br />
(Mo, Da, Yr)<br />
04/08/2011<br />
Year/Period of Report<br />
End of <strong>2010</strong>/Q4<br />
5. Show in columns (I), (j), <strong>and</strong> (k) special equipment such as rotary converters, rectifiers, condensers, etc. <strong>and</strong> auxiliary equipment for<br />
increasing capacity.<br />
6. Designate substations or major items of equipment leased from others, jointly owned with others, or operated otherwise than by<br />
reason of sole ownership by the respondent. For any substation or equipment operated under lease, give name of lessor, date <strong>and</strong><br />
period of lease, <strong>and</strong> annual rent. For any substation or equipment operated other than by reason of sole ownership or lease, give name<br />
of co-owner or other party, explain basis of sharing expenses or other accounting between the parties, <strong>and</strong> state amounts <strong>and</strong> accounts<br />
affected in respondent's books of account. Specify in each case whether lessor, co-owner, or other party is an associated company.<br />
Capacity of Substation<br />
Number of Number of<br />
CONVERSION APPARATUS AND SPECIAL EQUIPMENT Line<br />
Transformers<br />
Spare<br />
(In Service) (In MVa) In Service Transformers<br />
Type of Equipment<br />
Number of Units Total Capacity No.<br />
(In MVa)<br />
(f)<br />
(g)<br />
(h)<br />
(i)<br />
(j)<br />
(k)<br />
13 1 1<br />
13 3 1 2<br />
75 2 3<br />
12 1 4<br />
16 1 5<br />
30 1 6<br />
20 3 7<br />
195 3 8<br />
120 3 9<br />
90 3 10<br />
21 2 11<br />
76 3 12<br />
90 2 13<br />
45 1 14<br />
30 1 15<br />
46 2 16<br />
11 1 17<br />
20 3 18<br />
30 1 19<br />
15 3 20<br />
19 3 21<br />
135 3 22<br />
21 3 1 23<br />
16 1 24<br />
41 2 25<br />
90 2 26<br />
11 1 27<br />
6 3 1 28<br />
60 2 29<br />
24 1 30<br />
11 6 31<br />
37 3 32<br />
16 1 33<br />
16 1 34<br />
11 2 35<br />
25 2 36<br />
30 1 37<br />
13 1 38<br />
85 2 39<br />
30 3 1 40<br />
<strong>FERC</strong> FORM NO. 1 (ED. 12-96) Page 427.1
Name of Respondent<br />
PACIFIC GAS AND ELECTRIC COMPANY<br />
This<br />
(1)<br />
Report<br />
X<br />
Is:<br />
An Original<br />
(2) A Resubmission<br />
SUBSTATIONS (Continued)<br />
Date of Report<br />
(Mo, Da, Yr)<br />
04/08/2011<br />
Year/Period of Report<br />
End of <strong>2010</strong>/Q4<br />
5. Show in columns (I), (j), <strong>and</strong> (k) special equipment such as rotary converters, rectifiers, condensers, etc. <strong>and</strong> auxiliary equipment for<br />
increasing capacity.<br />
6. Designate substations or major items of equipment leased from others, jointly owned with others, or operated otherwise than by<br />
reason of sole ownership by the respondent. For any substation or equipment operated under lease, give name of lessor, date <strong>and</strong><br />
period of lease, <strong>and</strong> annual rent. For any substation or equipment operated other than by reason of sole ownership or lease, give name<br />
of co-owner or other party, explain basis of sharing expenses or other accounting between the parties, <strong>and</strong> state amounts <strong>and</strong> accounts<br />
affected in respondent's books of account. Specify in each case whether lessor, co-owner, or other party is an associated company.<br />
Capacity of Substation<br />
Number of Number of<br />
CONVERSION APPARATUS AND SPECIAL EQUIPMENT Line<br />
Transformers<br />
Spare<br />
(In Service) (In MVa) In Service Transformers<br />
Type of Equipment<br />
Number of Units Total Capacity No.<br />
(In MVa)<br />
(f)<br />
(g)<br />
(h)<br />
(i)<br />
(j)<br />
(k)<br />
11 1 1<br />
45 1 2<br />
25 2 3<br />
13 1 4<br />
41 2 5<br />
19 3 1 6<br />
16 1 7<br />
21 3 1 8<br />
32 2 9<br />
13 1 10<br />
13 1 11<br />
61 2 12<br />
11 3 1 13<br />
135 3 14<br />
29 2 15<br />
120 3 16<br />
16 1 17<br />
20 6 1 18<br />
19 3 1 19<br />
90 2 20<br />
45 1 21<br />
27 2 22<br />
19 3 23<br />
61 2 24<br />
59 3 25<br />
12 1 26<br />
21 6 1 27<br />
150 2 28<br />
42 3 1 29<br />
20 3 1 30<br />
28 4 31<br />
46 2 32<br />
16 1 33<br />
13 3 2 34<br />
58 10 3 35<br />
30 1 36<br />
43 2 37<br />
7 1 38<br />
29 6 1 39<br />
80 2 40<br />
<strong>FERC</strong> FORM NO. 1 (ED. 12-96) Page 427.2
Name of Respondent<br />
PACIFIC GAS AND ELECTRIC COMPANY<br />
This<br />
(1)<br />
Report<br />
X<br />
Is:<br />
An Original<br />
(2) A Resubmission<br />
SUBSTATIONS (Continued)<br />
Date of Report<br />
(Mo, Da, Yr)<br />
04/08/2011<br />
Year/Period of Report<br />
End of <strong>2010</strong>/Q4<br />
5. Show in columns (I), (j), <strong>and</strong> (k) special equipment such as rotary converters, rectifiers, condensers, etc. <strong>and</strong> auxiliary equipment for<br />
increasing capacity.<br />
6. Designate substations or major items of equipment leased from others, jointly owned with others, or operated otherwise than by<br />
reason of sole ownership by the respondent. For any substation or equipment operated under lease, give name of lessor, date <strong>and</strong><br />
period of lease, <strong>and</strong> annual rent. For any substation or equipment operated other than by reason of sole ownership or lease, give name<br />
of co-owner or other party, explain basis of sharing expenses or other accounting between the parties, <strong>and</strong> state amounts <strong>and</strong> accounts<br />
affected in respondent's books of account. Specify in each case whether lessor, co-owner, or other party is an associated company.<br />
Capacity of Substation<br />
Number of Number of<br />
CONVERSION APPARATUS AND SPECIAL EQUIPMENT Line<br />
Transformers<br />
Spare<br />
(In Service) (In MVa) In Service Transformers<br />
Type of Equipment<br />
Number of Units Total Capacity No.<br />
(In MVa)<br />
(f)<br />
(g)<br />
(h)<br />
(i)<br />
(j)<br />
(k)<br />
30 1 1<br />
35 3 2<br />
7 1 3<br />
25 3 1 4<br />
90 2 1 5<br />
19 3 1 6<br />
16 3 7<br />
16 1 8<br />
30 1 9<br />
95 4 1 10<br />
135 3 11<br />
61 2 12<br />
75 2 13<br />
16 1 14<br />
75 2 15<br />
14 1 16<br />
43 2 17<br />
61 2 18<br />
49 5 19<br />
11 3 1 20<br />
135 3 1 21<br />
49 4 1 22<br />
11 1 23<br />
13 1 24<br />
105 3 25<br />
32 6 1 26<br />
150 5 1 27<br />
25 2 1 28<br />
9 3 29<br />
16 1 30<br />
8 1 31<br />
140 3 32<br />
30 1 33<br />
90 2 34<br />
90 2 35<br />
63 2 36<br />
45 1 37<br />
127 5 1 38<br />
32 2 1 39<br />
135 3 40<br />
<strong>FERC</strong> FORM NO. 1 (ED. 12-96) Page 427.3
Name of Respondent<br />
PACIFIC GAS AND ELECTRIC COMPANY<br />
This<br />
(1)<br />
Report<br />
X<br />
Is:<br />
An Original<br />
(2) A Resubmission<br />
SUBSTATIONS (Continued)<br />
Date of Report<br />
(Mo, Da, Yr)<br />
04/08/2011<br />
Year/Period of Report<br />
End of <strong>2010</strong>/Q4<br />
5. Show in columns (I), (j), <strong>and</strong> (k) special equipment such as rotary converters, rectifiers, condensers, etc. <strong>and</strong> auxiliary equipment for<br />
increasing capacity.<br />
6. Designate substations or major items of equipment leased from others, jointly owned with others, or operated otherwise than by<br />
reason of sole ownership by the respondent. For any substation or equipment operated under lease, give name of lessor, date <strong>and</strong><br />
period of lease, <strong>and</strong> annual rent. For any substation or equipment operated other than by reason of sole ownership or lease, give name<br />
of co-owner or other party, explain basis of sharing expenses or other accounting between the parties, <strong>and</strong> state amounts <strong>and</strong> accounts<br />
affected in respondent's books of account. Specify in each case whether lessor, co-owner, or other party is an associated company.<br />
Capacity of Substation<br />
Number of Number of<br />
CONVERSION APPARATUS AND SPECIAL EQUIPMENT Line<br />
Transformers<br />
Spare<br />
(In Service) (In MVa) In Service Transformers<br />
Type of Equipment<br />
Number of Units Total Capacity No.<br />
(In MVa)<br />
(f)<br />
(g)<br />
(h)<br />
(i)<br />
(j)<br />
(k)<br />
23 2 1<br />
11 1 2<br />
13 1 3<br />
11 3 1 4<br />
13 1 5<br />
13 3 1 6<br />
90 2 1 7<br />
13 1 8<br />
50 3 9<br />
60 2 10<br />
30 1 11<br />
60 2 12<br />
225 3 13<br />
30 1 14<br />
22 2 15<br />
25 3 16<br />
50 2 17<br />
11 1 18<br />
21 3 1 19<br />
19 6 20<br />
19 3 1 21<br />
60 2 22<br />
90 3 23<br />
32 2 24<br />
25 4 25<br />
49 4 1 26<br />
60 2 27<br />
16 1 28<br />
25 1 29<br />
13 1 30<br />
16 1 31<br />
21 3 1 32<br />
45 1 33<br />
19 3 34<br />
22 4 35<br />
19 3 36<br />
16 1 37<br />
32 2 38<br />
7 1 39<br />
16 1 40<br />
<strong>FERC</strong> FORM NO. 1 (ED. 12-96) Page 427.4
Name of Respondent<br />
PACIFIC GAS AND ELECTRIC COMPANY<br />
This<br />
(1)<br />
Report<br />
X<br />
Is:<br />
An Original<br />
(2) A Resubmission<br />
SUBSTATIONS (Continued)<br />
Date of Report<br />
(Mo, Da, Yr)<br />
04/08/2011<br />
Year/Period of Report<br />
End of <strong>2010</strong>/Q4<br />
5. Show in columns (I), (j), <strong>and</strong> (k) special equipment such as rotary converters, rectifiers, condensers, etc. <strong>and</strong> auxiliary equipment for<br />
increasing capacity.<br />
6. Designate substations or major items of equipment leased from others, jointly owned with others, or operated otherwise than by<br />
reason of sole ownership by the respondent. For any substation or equipment operated under lease, give name of lessor, date <strong>and</strong><br />
period of lease, <strong>and</strong> annual rent. For any substation or equipment operated other than by reason of sole ownership or lease, give name<br />
of co-owner or other party, explain basis of sharing expenses or other accounting between the parties, <strong>and</strong> state amounts <strong>and</strong> accounts<br />
affected in respondent's books of account. Specify in each case whether lessor, co-owner, or other party is an associated company.<br />
Capacity of Substation<br />
Number of Number of<br />
CONVERSION APPARATUS AND SPECIAL EQUIPMENT Line<br />
Transformers<br />
Spare<br />
(In Service) (In MVa) In Service Transformers<br />
Type of Equipment<br />
Number of Units Total Capacity No.<br />
(In MVa)<br />
(f)<br />
(g)<br />
(h)<br />
(i)<br />
(j)<br />
(k)<br />
22 2 1<br />
27 2 2<br />
81 3 3<br />
90 2 4<br />
19 3 1 5<br />
60 2 6<br />
32 2 7<br />
12 7 1 8<br />
31 4 9<br />
21 3 10<br />
32 5 11<br />
70 7 12<br />
16 1 13<br />
13 2 14<br />
12 1 15<br />
29 2 16<br />
60 2 17<br />
19 2 18<br />
16 3 19<br />
12 3 20<br />
13 1 21<br />
150 2 22<br />
90 2 23<br />
77 3 24<br />
60 2 25<br />
64 4 1 26<br />
70 2 27<br />
25 1 28<br />
16 1 29<br />
13 3 1 30<br />
72 2 31<br />
16 1 32<br />
133 6 SVC 4<br />
50 33<br />
77 3 34<br />
11 1 35<br />
4 1 36<br />
4 1 37<br />
20 3 38<br />
46 2 39<br />
16 1 40<br />
<strong>FERC</strong> FORM NO. 1 (ED. 12-96) Page 427.5
Name of Respondent<br />
PACIFIC GAS AND ELECTRIC COMPANY<br />
This<br />
(1)<br />
Report<br />
X<br />
Is:<br />
An Original<br />
(2) A Resubmission<br />
SUBSTATIONS (Continued)<br />
Date of Report<br />
(Mo, Da, Yr)<br />
04/08/2011<br />
Year/Period of Report<br />
End of <strong>2010</strong>/Q4<br />
5. Show in columns (I), (j), <strong>and</strong> (k) special equipment such as rotary converters, rectifiers, condensers, etc. <strong>and</strong> auxiliary equipment for<br />
increasing capacity.<br />
6. Designate substations or major items of equipment leased from others, jointly owned with others, or operated otherwise than by<br />
reason of sole ownership by the respondent. For any substation or equipment operated under lease, give name of lessor, date <strong>and</strong><br />
period of lease, <strong>and</strong> annual rent. For any substation or equipment operated other than by reason of sole ownership or lease, give name<br />
of co-owner or other party, explain basis of sharing expenses or other accounting between the parties, <strong>and</strong> state amounts <strong>and</strong> accounts<br />
affected in respondent's books of account. Specify in each case whether lessor, co-owner, or other party is an associated company.<br />
Capacity of Substation<br />
Number of Number of<br />
CONVERSION APPARATUS AND SPECIAL EQUIPMENT Line<br />
Transformers<br />
Spare<br />
(In Service) (In MVa) In Service Transformers<br />
Type of Equipment<br />
Number of Units Total Capacity No.<br />
(In MVa)<br />
(f)<br />
(g)<br />
(h)<br />
(i)<br />
(j)<br />
(k)<br />
13 1 1<br />
16 1 2<br />
29 2 3<br />
45 1 4<br />
20 2 5<br />
105 3 6<br />
22 1 7<br />
11 1 8<br />
30 1 9<br />
41 2 10<br />
90 2 11<br />
90 2 12<br />
11 3 1 13<br />
11 3 14<br />
23 3 15<br />
90 2 16<br />
135 3 17<br />
16 4 18<br />
19 3 19<br />
30 1 20<br />
180 6 1 21<br />
25 3 1 22<br />
90 2 23<br />
52 2 24<br />
39 3 25<br />
16 1 26<br />
165 3 27<br />
14 2 28<br />
145 5 1 29<br />
19 3 30<br />
56 4 1 31<br />
60 2 32<br />
55 3 33<br />
19 3 34<br />
27 2 35<br />
25 6 36<br />
30 1 37<br />
11 3 38<br />
100 3 39<br />
98 4 1 40<br />
<strong>FERC</strong> FORM NO. 1 (ED. 12-96) Page 427.6
Name of Respondent<br />
PACIFIC GAS AND ELECTRIC COMPANY<br />
This<br />
(1)<br />
Report<br />
X<br />
Is:<br />
An Original<br />
(2) A Resubmission<br />
SUBSTATIONS (Continued)<br />
Date of Report<br />
(Mo, Da, Yr)<br />
04/08/2011<br />
Year/Period of Report<br />
End of <strong>2010</strong>/Q4<br />
5. Show in columns (I), (j), <strong>and</strong> (k) special equipment such as rotary converters, rectifiers, condensers, etc. <strong>and</strong> auxiliary equipment for<br />
increasing capacity.<br />
6. Designate substations or major items of equipment leased from others, jointly owned with others, or operated otherwise than by<br />
reason of sole ownership by the respondent. For any substation or equipment operated under lease, give name of lessor, date <strong>and</strong><br />
period of lease, <strong>and</strong> annual rent. For any substation or equipment operated other than by reason of sole ownership or lease, give name<br />
of co-owner or other party, explain basis of sharing expenses or other accounting between the parties, <strong>and</strong> state amounts <strong>and</strong> accounts<br />
affected in respondent's books of account. Specify in each case whether lessor, co-owner, or other party is an associated company.<br />
Capacity of Substation<br />
Number of Number of<br />
CONVERSION APPARATUS AND SPECIAL EQUIPMENT Line<br />
Transformers<br />
Spare<br />
(In Service) (In MVa) In Service Transformers<br />
Type of Equipment<br />
Number of Units Total Capacity No.<br />
(In MVa)<br />
(f)<br />
(g)<br />
(h)<br />
(i)<br />
(j)<br />
(k)<br />
46 2 1<br />
21 3 1 2<br />
5 3 1 3<br />
45 1 4<br />
45 1 5<br />
51 3 6<br />
13 3 1 7<br />
32 2 8<br />
13 3 1 9<br />
43 2 10<br />
21 3 1 11<br />
5 3 1 12<br />
29 2 13<br />
19 3 14<br />
16 1 15<br />
41 6 16<br />
30 1 17<br />
21 2 18<br />
45 1 19<br />
45 1 20<br />
105 3 21<br />
135 3 22<br />
135 8 1 23<br />
11 3 24<br />
32 2 25<br />
13 3 1 26<br />
49 4 1 27<br />
17 3 1 28<br />
90 2 29<br />
21 2 30<br />
19 3 31<br />
105 3 32<br />
45 1 33<br />
145 3 34<br />
5 3 1 35<br />
30 1 36<br />
32 2 37<br />
13 2 38<br />
45 1 39<br />
45 1 40<br />
<strong>FERC</strong> FORM NO. 1 (ED. 12-96) Page 427.7
Name of Respondent<br />
PACIFIC GAS AND ELECTRIC COMPANY<br />
This<br />
(1)<br />
Report<br />
X<br />
Is:<br />
An Original<br />
(2) A Resubmission<br />
SUBSTATIONS (Continued)<br />
Date of Report<br />
(Mo, Da, Yr)<br />
04/08/2011<br />
Year/Period of Report<br />
End of <strong>2010</strong>/Q4<br />
5. Show in columns (I), (j), <strong>and</strong> (k) special equipment such as rotary converters, rectifiers, condensers, etc. <strong>and</strong> auxiliary equipment for<br />
increasing capacity.<br />
6. Designate substations or major items of equipment leased from others, jointly owned with others, or operated otherwise than by<br />
reason of sole ownership by the respondent. For any substation or equipment operated under lease, give name of lessor, date <strong>and</strong><br />
period of lease, <strong>and</strong> annual rent. For any substation or equipment operated other than by reason of sole ownership or lease, give name<br />
of co-owner or other party, explain basis of sharing expenses or other accounting between the parties, <strong>and</strong> state amounts <strong>and</strong> accounts<br />
affected in respondent's books of account. Specify in each case whether lessor, co-owner, or other party is an associated company.<br />
Capacity of Substation<br />
Number of Number of<br />
CONVERSION APPARATUS AND SPECIAL EQUIPMENT Line<br />
Transformers<br />
Spare<br />
(In Service) (In MVa) In Service Transformers<br />
Type of Equipment<br />
Number of Units Total Capacity No.<br />
(In MVa)<br />
(f)<br />
(g)<br />
(h)<br />
(i)<br />
(j)<br />
(k)<br />
11 1 1<br />
34 4 1 2<br />
23 2 3<br />
60 2 4<br />
6 3 1 5<br />
90 2 6<br />
75 2 7<br />
11 1 8<br />
14 3 1 9<br />
43 2 10<br />
90 2 11<br />
45 1 12<br />
135 3 13<br />
29 2 14<br />
11 3 1 15<br />
45 1 16<br />
120 3 17<br />
30 1 18<br />
16 1 19<br />
30 1 20<br />
30 1 21<br />
115 3 22<br />
135 3 23<br />
16 1 24<br />
68 7 1 25<br />
150 2 26<br />
57 6 1 27<br />
20 4 1 28<br />
29 2 29<br />
41 4 30<br />
16 1 31<br />
32 2 32<br />
45 1 33<br />
45 1 34<br />
45 1 35<br />
30 6 36<br />
45 1 37<br />
23 2 38<br />
43 3 39<br />
180 5 40<br />
<strong>FERC</strong> FORM NO. 1 (ED. 12-96) Page 427.8
Name of Respondent<br />
PACIFIC GAS AND ELECTRIC COMPANY<br />
This<br />
(1)<br />
Report<br />
X<br />
Is:<br />
An Original<br />
(2) A Resubmission<br />
SUBSTATIONS (Continued)<br />
Date of Report<br />
(Mo, Da, Yr)<br />
04/08/2011<br />
Year/Period of Report<br />
End of <strong>2010</strong>/Q4<br />
5. Show in columns (I), (j), <strong>and</strong> (k) special equipment such as rotary converters, rectifiers, condensers, etc. <strong>and</strong> auxiliary equipment for<br />
increasing capacity.<br />
6. Designate substations or major items of equipment leased from others, jointly owned with others, or operated otherwise than by<br />
reason of sole ownership by the respondent. For any substation or equipment operated under lease, give name of lessor, date <strong>and</strong><br />
period of lease, <strong>and</strong> annual rent. For any substation or equipment operated other than by reason of sole ownership or lease, give name<br />
of co-owner or other party, explain basis of sharing expenses or other accounting between the parties, <strong>and</strong> state amounts <strong>and</strong> accounts<br />
affected in respondent's books of account. Specify in each case whether lessor, co-owner, or other party is an associated company.<br />
Capacity of Substation<br />
Number of Number of<br />
CONVERSION APPARATUS AND SPECIAL EQUIPMENT Line<br />
Transformers<br />
Spare<br />
(In Service) (In MVa) In Service Transformers<br />
Type of Equipment<br />
Number of Units Total Capacity No.<br />
(In MVa)<br />
(f)<br />
(g)<br />
(h)<br />
(i)<br />
(j)<br />
(k)<br />
130 3 1<br />
146 6 1 2<br />
38 3 1 3<br />
135 3 4<br />
140 3 5<br />
60 2 6<br />
42 6 1 7<br />
31 4 8<br />
40 7 9<br />
18 4 10<br />
41 2 11<br />
16 1 12<br />
6 3 13<br />
25 7 14<br />
11 1 15<br />
22 3 16<br />
17 2 17<br />
25 2 18<br />
5 3 1 19<br />
11 1 20<br />
23 2 21<br />
11 1 22<br />
45 1 23<br />
30 1 24<br />
45 1 25<br />
45 1 26<br />
30 1 27<br />
30 1 28<br />
90 3 1 29<br />
140 3 30<br />
135 3 31<br />
14 6 1 32<br />
34 3 33<br />
13 1 34<br />
61 2 35<br />
58 4 36<br />
57 5 1 37<br />
45 1 38<br />
22 4 39<br />
135 3 40<br />
<strong>FERC</strong> FORM NO. 1 (ED. 12-96) Page 427.9
Name of Respondent<br />
PACIFIC GAS AND ELECTRIC COMPANY<br />
This<br />
(1)<br />
Report<br />
X<br />
Is:<br />
An Original<br />
(2) A Resubmission<br />
SUBSTATIONS (Continued)<br />
Date of Report<br />
(Mo, Da, Yr)<br />
04/08/2011<br />
Year/Period of Report<br />
End of <strong>2010</strong>/Q4<br />
5. Show in columns (I), (j), <strong>and</strong> (k) special equipment such as rotary converters, rectifiers, condensers, etc. <strong>and</strong> auxiliary equipment for<br />
increasing capacity.<br />
6. Designate substations or major items of equipment leased from others, jointly owned with others, or operated otherwise than by<br />
reason of sole ownership by the respondent. For any substation or equipment operated under lease, give name of lessor, date <strong>and</strong><br />
period of lease, <strong>and</strong> annual rent. For any substation or equipment operated other than by reason of sole ownership or lease, give name<br />
of co-owner or other party, explain basis of sharing expenses or other accounting between the parties, <strong>and</strong> state amounts <strong>and</strong> accounts<br />
affected in respondent's books of account. Specify in each case whether lessor, co-owner, or other party is an associated company.<br />
Capacity of Substation<br />
Number of Number of<br />
CONVERSION APPARATUS AND SPECIAL EQUIPMENT Line<br />
Transformers<br />
Spare<br />
(In Service) (In MVa) In Service Transformers<br />
Type of Equipment<br />
Number of Units Total Capacity No.<br />
(In MVa)<br />
(f)<br />
(g)<br />
(h)<br />
(i)<br />
(j)<br />
(k)<br />
41 4 1 1<br />
30 1 2<br />
30 1 3<br />
39 2 4<br />
135 3 5<br />
45 1 6<br />
13 1 7<br />
11 1 8<br />
16 1 9<br />
20 1 10<br />
32 2 11<br />
45 1 StatCom 2<br />
8 12<br />
45 1 13<br />
11 1 14<br />
16 1 15<br />
16 1 16<br />
25 6 17<br />
30 1 18<br />
16 4 19<br />
16 1 20<br />
19 3 21<br />
50 5 22<br />
23 3 23<br />
70 5 24<br />
21 6 1 25<br />
30 1 26<br />
19 3 27<br />
90 2 28<br />
45 1 29<br />
11 1 30<br />
4 1 31<br />
3 1 32<br />
14 2 33<br />
90 4 1 34<br />
32 2 35<br />
35 4 36<br />
11 3 37<br />
28 1 38<br />
11 3 1 39<br />
90 2 40<br />
<strong>FERC</strong> FORM NO. 1 (ED. 12-96) Page 427.10
Name of Respondent<br />
PACIFIC GAS AND ELECTRIC COMPANY<br />
This<br />
(1)<br />
Report<br />
X<br />
Is:<br />
An Original<br />
(2) A Resubmission<br />
SUBSTATIONS (Continued)<br />
Date of Report<br />
(Mo, Da, Yr)<br />
04/08/2011<br />
Year/Period of Report<br />
End of <strong>2010</strong>/Q4<br />
5. Show in columns (I), (j), <strong>and</strong> (k) special equipment such as rotary converters, rectifiers, condensers, etc. <strong>and</strong> auxiliary equipment for<br />
increasing capacity.<br />
6. Designate substations or major items of equipment leased from others, jointly owned with others, or operated otherwise than by<br />
reason of sole ownership by the respondent. For any substation or equipment operated under lease, give name of lessor, date <strong>and</strong><br />
period of lease, <strong>and</strong> annual rent. For any substation or equipment operated other than by reason of sole ownership or lease, give name<br />
of co-owner or other party, explain basis of sharing expenses or other accounting between the parties, <strong>and</strong> state amounts <strong>and</strong> accounts<br />
affected in respondent's books of account. Specify in each case whether lessor, co-owner, or other party is an associated company.<br />
Capacity of Substation<br />
Number of Number of<br />
CONVERSION APPARATUS AND SPECIAL EQUIPMENT Line<br />
Transformers<br />
Spare<br />
(In Service) (In MVa) In Service Transformers<br />
Type of Equipment<br />
Number of Units Total Capacity No.<br />
(In MVa)<br />
(f)<br />
(g)<br />
(h)<br />
(i)<br />
(j)<br />
(k)<br />
73 4 1 1<br />
23 1 2<br />
27 4 1 3<br />
30 1 4<br />
90 2 5<br />
16 1 6<br />
75 2 7<br />
11 3 1 8<br />
11 3 1 9<br />
19 3 10<br />
29 2 11<br />
13 3 1 12<br />
181 3 SVC 4<br />
80 13<br />
135 3 14<br />
98 2 15<br />
300 5 1 16<br />
390 6 17<br />
18 2 18<br />
40 2 19<br />
30 1 20<br />
180 4 21<br />
110 7 1 22<br />
135 3 23<br />
45 1 24<br />
9 3 1 25<br />
16 1 26<br />
30 1 27<br />
106 3 28<br />
300 4 29<br />
60 2 30<br />
75 2 31<br />
27 2 32<br />
12 3 33<br />
135 3 34<br />
21 2 35<br />
157 3 36<br />
21 3 1 37<br />
5 3 1 38<br />
30 1 39<br />
30 1 40<br />
<strong>FERC</strong> FORM NO. 1 (ED. 12-96) Page 427.11
Name of Respondent<br />
PACIFIC GAS AND ELECTRIC COMPANY<br />
This<br />
(1)<br />
Report<br />
X<br />
Is:<br />
An Original<br />
(2) A Resubmission<br />
SUBSTATIONS (Continued)<br />
Date of Report<br />
(Mo, Da, Yr)<br />
04/08/2011<br />
Year/Period of Report<br />
End of <strong>2010</strong>/Q4<br />
5. Show in columns (I), (j), <strong>and</strong> (k) special equipment such as rotary converters, rectifiers, condensers, etc. <strong>and</strong> auxiliary equipment for<br />
increasing capacity.<br />
6. Designate substations or major items of equipment leased from others, jointly owned with others, or operated otherwise than by<br />
reason of sole ownership by the respondent. For any substation or equipment operated under lease, give name of lessor, date <strong>and</strong><br />
period of lease, <strong>and</strong> annual rent. For any substation or equipment operated other than by reason of sole ownership or lease, give name<br />
of co-owner or other party, explain basis of sharing expenses or other accounting between the parties, <strong>and</strong> state amounts <strong>and</strong> accounts<br />
affected in respondent's books of account. Specify in each case whether lessor, co-owner, or other party is an associated company.<br />
Capacity of Substation<br />
Number of Number of<br />
CONVERSION APPARATUS AND SPECIAL EQUIPMENT Line<br />
Transformers<br />
Spare<br />
(In Service) (In MVa) In Service Transformers<br />
Type of Equipment<br />
Number of Units Total Capacity No.<br />
(In MVa)<br />
(f)<br />
(g)<br />
(h)<br />
(i)<br />
(j)<br />
(k)<br />
13 1 1<br />
27 3 1 2<br />
11 1 3<br />
61 2 4<br />
16 1 5<br />
15 3 1 6<br />
60 2 7<br />
32 2 8<br />
19 3 9<br />
19 6 10<br />
30 1 11<br />
11 1 12<br />
60 2 13<br />
25 3 14<br />
19 1 15<br />
13 3 1 16<br />
11 1 17<br />
25 2 18<br />
150 2 19<br />
51 4 1 20<br />
11 1 21<br />
105 3 22<br />
11 3 1 23<br />
225 3 24<br />
30 1 25<br />
105 3 26<br />
22 6 27<br />
21 2 28<br />
45 1 29<br />
90 2 30<br />
19 3 31<br />
120 3 32<br />
13 1 33<br />
145 3 34<br />
90 3 35<br />
27 2 36<br />
150 2 37<br />
19 3 38<br />
21 3 1 39<br />
90 2 40<br />
<strong>FERC</strong> FORM NO. 1 (ED. 12-96) Page 427.12
Name of Respondent<br />
PACIFIC GAS AND ELECTRIC COMPANY<br />
This<br />
(1)<br />
Report<br />
X<br />
Is:<br />
An Original<br />
(2) A Resubmission<br />
SUBSTATIONS (Continued)<br />
Date of Report<br />
(Mo, Da, Yr)<br />
04/08/2011<br />
Year/Period of Report<br />
End of <strong>2010</strong>/Q4<br />
5. Show in columns (I), (j), <strong>and</strong> (k) special equipment such as rotary converters, rectifiers, condensers, etc. <strong>and</strong> auxiliary equipment for<br />
increasing capacity.<br />
6. Designate substations or major items of equipment leased from others, jointly owned with others, or operated otherwise than by<br />
reason of sole ownership by the respondent. For any substation or equipment operated under lease, give name of lessor, date <strong>and</strong><br />
period of lease, <strong>and</strong> annual rent. For any substation or equipment operated other than by reason of sole ownership or lease, give name<br />
of co-owner or other party, explain basis of sharing expenses or other accounting between the parties, <strong>and</strong> state amounts <strong>and</strong> accounts<br />
affected in respondent's books of account. Specify in each case whether lessor, co-owner, or other party is an associated company.<br />
Capacity of Substation<br />
Number of Number of<br />
CONVERSION APPARATUS AND SPECIAL EQUIPMENT Line<br />
Transformers<br />
Spare<br />
(In Service) (In MVa) In Service Transformers<br />
Type of Equipment<br />
Number of Units Total Capacity No.<br />
(In MVa)<br />
(f)<br />
(g)<br />
(h)<br />
(i)<br />
(j)<br />
(k)<br />
90 2 1<br />
150 2 2<br />
13 1 3<br />
106 4 4<br />
16 1 5<br />
90 2 6<br />
90 2 7<br />
11 3 2 8<br />
14 1 9<br />
61 2 10<br />
32 2 11<br />
19 6 12<br />
29 2 13<br />
10 3 1 14<br />
76 3 15<br />
120 3 16<br />
29 2 17<br />
17 6 18<br />
90 2 19<br />
32 4 20<br />
3 3 1 21<br />
60 2 22<br />
90 2 23<br />
150 2 1 24<br />
21 3 1 25<br />
60 2 26<br />
20 3 27<br />
11 1 28<br />
16 1 29<br />
8 1 30<br />
50 2 31<br />
45 1 32<br />
30 1 33<br />
24 4 34<br />
135 3 35<br />
30 1 36<br />
105 3 37<br />
29 2 38<br />
105 3 39<br />
44 4 1 40<br />
<strong>FERC</strong> FORM NO. 1 (ED. 12-96) Page 427.13
Name of Respondent<br />
PACIFIC GAS AND ELECTRIC COMPANY<br />
This<br />
(1)<br />
Report<br />
X<br />
Is:<br />
An Original<br />
(2) A Resubmission<br />
SUBSTATIONS (Continued)<br />
Date of Report<br />
(Mo, Da, Yr)<br />
04/08/2011<br />
Year/Period of Report<br />
End of <strong>2010</strong>/Q4<br />
5. Show in columns (I), (j), <strong>and</strong> (k) special equipment such as rotary converters, rectifiers, condensers, etc. <strong>and</strong> auxiliary equipment for<br />
increasing capacity.<br />
6. Designate substations or major items of equipment leased from others, jointly owned with others, or operated otherwise than by<br />
reason of sole ownership by the respondent. For any substation or equipment operated under lease, give name of lessor, date <strong>and</strong><br />
period of lease, <strong>and</strong> annual rent. For any substation or equipment operated other than by reason of sole ownership or lease, give name<br />
of co-owner or other party, explain basis of sharing expenses or other accounting between the parties, <strong>and</strong> state amounts <strong>and</strong> accounts<br />
affected in respondent's books of account. Specify in each case whether lessor, co-owner, or other party is an associated company.<br />
Capacity of Substation<br />
Number of Number of<br />
CONVERSION APPARATUS AND SPECIAL EQUIPMENT Line<br />
Transformers<br />
Spare<br />
(In Service) (In MVa) In Service Transformers<br />
Type of Equipment<br />
Number of Units Total Capacity No.<br />
(In MVa)<br />
(f)<br />
(g)<br />
(h)<br />
(i)<br />
(j)<br />
(k)<br />
19 3 1<br />
90 3 2<br />
27 2 3<br />
19 3 1 4<br />
30 1 5<br />
11 3 1 6<br />
14 3 1 7<br />
14 1 8<br />
120 3 9<br />
23 3 10<br />
135 3 11<br />
36 3 12<br />
135 3 13<br />
13 1 14<br />
87 3 15<br />
11 1 16<br />
16 1 17<br />
703 357 58 18<br />
-59 19<br />
28244 1751 167 10 138 21<br />
134 3 23<br />
334 4 1 24<br />
80 3 25<br />
400 2 Sync Cond 1<br />
40 26<br />
400 2 27<br />
30 3 28<br />
840 2 29<br />
60 3 1 30<br />
76 3 31<br />
90 3 1 32<br />
214 6 1 33<br />
110 6 34<br />
180 3 1 35<br />
174 6 1 36<br />
28 3 37<br />
588 4 2 38<br />
414 2 1 39<br />
240 6 1 40<br />
20<br />
22<br />
<strong>FERC</strong> FORM NO. 1 (ED. 12-96) Page 427.14
Name of Respondent<br />
PACIFIC GAS AND ELECTRIC COMPANY<br />
This<br />
(1)<br />
Report<br />
X<br />
Is:<br />
An Original<br />
(2) A Resubmission<br />
SUBSTATIONS (Continued)<br />
Date of Report<br />
(Mo, Da, Yr)<br />
04/08/2011<br />
Year/Period of Report<br />
End of <strong>2010</strong>/Q4<br />
5. Show in columns (I), (j), <strong>and</strong> (k) special equipment such as rotary converters, rectifiers, condensers, etc. <strong>and</strong> auxiliary equipment for<br />
increasing capacity.<br />
6. Designate substations or major items of equipment leased from others, jointly owned with others, or operated otherwise than by<br />
reason of sole ownership by the respondent. For any substation or equipment operated under lease, give name of lessor, date <strong>and</strong><br />
period of lease, <strong>and</strong> annual rent. For any substation or equipment operated other than by reason of sole ownership or lease, give name<br />
of co-owner or other party, explain basis of sharing expenses or other accounting between the parties, <strong>and</strong> state amounts <strong>and</strong> accounts<br />
affected in respondent's books of account. Specify in each case whether lessor, co-owner, or other party is an associated company.<br />
Capacity of Substation<br />
Number of Number of<br />
CONVERSION APPARATUS AND SPECIAL EQUIPMENT Line<br />
Transformers<br />
Spare<br />
(In Service) (In MVa) In Service Transformers<br />
Type of Equipment<br />
Number of Units Total Capacity No.<br />
(In MVa)<br />
(f)<br />
(g)<br />
(h)<br />
(i)<br />
(j)<br />
(k)<br />
400 2 1<br />
170 6 1 2<br />
68 3 1 3<br />
59 3 1 4<br />
540 4 1 5<br />
80 3 1 6<br />
600 2 7<br />
823 4 1 8<br />
117 3 1 9<br />
120 3 10<br />
1122 3 1 11<br />
255 4 1 12<br />
80 3 13<br />
840 2 14<br />
38 3 15<br />
134 3 16<br />
308 4 17<br />
180 3 1 18<br />
50 3 1 19<br />
840 2 Sync Cond 2<br />
80 20<br />
40 1 21<br />
75 6 1 Sync Cond 1<br />
20 22<br />
400 2 23<br />
823 4 1 24<br />
400 2 25<br />
76 3 26<br />
400 2 27<br />
1075 8 1 28<br />
90 3 1 29<br />
280 4 30<br />
840 2 31<br />
90 3 32<br />
400 2 33<br />
334 4 34<br />
840 3 1 35<br />
840 2 36<br />
31 3 1 37<br />
1243 5 1 Sync Cond 2<br />
80 38<br />
280 4 1 39<br />
90 3 1 40<br />
<strong>FERC</strong> FORM NO. 1 (ED. 12-96) Page 427.15
Name of Respondent<br />
PACIFIC GAS AND ELECTRIC COMPANY<br />
This<br />
(1)<br />
Report<br />
X<br />
Is:<br />
An Original<br />
(2) A Resubmission<br />
SUBSTATIONS (Continued)<br />
Date of Report<br />
(Mo, Da, Yr)<br />
04/08/2011<br />
Year/Period of Report<br />
End of <strong>2010</strong>/Q4<br />
5. Show in columns (I), (j), <strong>and</strong> (k) special equipment such as rotary converters, rectifiers, condensers, etc. <strong>and</strong> auxiliary equipment for<br />
increasing capacity.<br />
6. Designate substations or major items of equipment leased from others, jointly owned with others, or operated otherwise than by<br />
reason of sole ownership by the respondent. For any substation or equipment operated under lease, give name of lessor, date <strong>and</strong><br />
period of lease, <strong>and</strong> annual rent. For any substation or equipment operated other than by reason of sole ownership or lease, give name<br />
of co-owner or other party, explain basis of sharing expenses or other accounting between the parties, <strong>and</strong> state amounts <strong>and</strong> accounts<br />
affected in respondent's books of account. Specify in each case whether lessor, co-owner, or other party is an associated company.<br />
Capacity of Substation<br />
Number of Number of<br />
CONVERSION APPARATUS AND SPECIAL EQUIPMENT Line<br />
Transformers<br />
Spare<br />
(In Service) (In MVa) In Service Transformers<br />
Type of Equipment<br />
Number of Units Total Capacity No.<br />
(In MVa)<br />
(f)<br />
(g)<br />
(h)<br />
(i)<br />
(j)<br />
(k)<br />
50 3 1<br />
840 2 2<br />
1630 10 1 3<br />
3366 9 2 4<br />
760 10 5<br />
3364 9 2 6<br />
90 3 7<br />
200 1 8<br />
134 3 1 9<br />
1260 3 10<br />
672 9 1 Sync Cond 3<br />
144 11<br />
269 3 1 12<br />
1086 10 2 13<br />
1122 3 1 14<br />
108 3 1 15<br />
80 3 16<br />
1646 8 1 SVC 4<br />
200 17<br />
60 3 18<br />
168 3 1 19<br />
420 1 20<br />
540 4 21<br />
80 3 1 22<br />
840 2 23<br />
95 3 24<br />
823 4 1 25<br />
190 4 1 26<br />
254 6 27<br />
1122 3 1 28<br />
48 3 29<br />
400 2 30<br />
40 1 31<br />
823 4 1 32<br />
90 3 1 33<br />
156 4 34<br />
1243 5 1 Sync Cond 3<br />
123 35<br />
90 3 1 36<br />
30 3 1 37<br />
90 3 1 38<br />
90 3 1 39<br />
806 6 1 40<br />
<strong>FERC</strong> FORM NO. 1 (ED. 12-96) Page 427.16
Name of Respondent<br />
PACIFIC GAS AND ELECTRIC COMPANY<br />
This<br />
(1)<br />
Report<br />
X<br />
Is:<br />
An Original<br />
(2) A Resubmission<br />
SUBSTATIONS (Continued)<br />
Date of Report<br />
(Mo, Da, Yr)<br />
04/08/2011<br />
Year/Period of Report<br />
End of <strong>2010</strong>/Q4<br />
5. Show in columns (I), (j), <strong>and</strong> (k) special equipment such as rotary converters, rectifiers, condensers, etc. <strong>and</strong> auxiliary equipment for<br />
increasing capacity.<br />
6. Designate substations or major items of equipment leased from others, jointly owned with others, or operated otherwise than by<br />
reason of sole ownership by the respondent. For any substation or equipment operated under lease, give name of lessor, date <strong>and</strong><br />
period of lease, <strong>and</strong> annual rent. For any substation or equipment operated other than by reason of sole ownership or lease, give name<br />
of co-owner or other party, explain basis of sharing expenses or other accounting between the parties, <strong>and</strong> state amounts <strong>and</strong> accounts<br />
affected in respondent's books of account. Specify in each case whether lessor, co-owner, or other party is an associated company.<br />
Capacity of Substation<br />
Number of Number of<br />
CONVERSION APPARATUS AND SPECIAL EQUIPMENT Line<br />
Transformers<br />
Spare<br />
(In Service) (In MVa) In Service Transformers<br />
Type of Equipment<br />
Number of Units Total Capacity No.<br />
(In MVa)<br />
(f)<br />
(g)<br />
(h)<br />
(i)<br />
(j)<br />
(k)<br />
75 6 1<br />
600 2 2<br />
1008 5 1 3<br />
1122 3 1 4<br />
162 4 5<br />
175 1 6<br />
806 6 1 7<br />
3366 9 2 8<br />
90 3 1 9<br />
400 2 10<br />
290 4 1 11<br />
1094 8 12<br />
2244 6 1 13<br />
134 3 1 14<br />
476 7 15<br />
60 3 1 16<br />
134 3 1 17<br />
689 4 1 18<br />
-10 19<br />
57953 440 68 16 687 21<br />
86197 2191 235 26 825 23<br />
20<br />
22<br />
24<br />
25<br />
26<br />
27<br />
28<br />
29<br />
30<br />
31<br />
32<br />
33<br />
34<br />
35<br />
36<br />
37<br />
38<br />
39<br />
40<br />
<strong>FERC</strong> FORM NO. 1 (ED. 12-96) Page 427.17
Name of Respondent<br />
PACIFIC GAS AND ELECTRIC COMPANY<br />
This Report is:<br />
(1) X An Original<br />
(2) A Resubmission<br />
Date of Report<br />
(Mo, Da, Yr)<br />
04/08/2011<br />
Year/Period of Report<br />
<strong>2010</strong>/Q4<br />
FOOTNOTE DATA<br />
Schedule Page: 426.14 Line No.: 19 Column: a<br />
The original entries in column f were in two decimal places, which the <strong>FERC</strong> software<br />
rounds automatically to whole numbers. The entry here is an adjustment to present the<br />
correct total.<br />
Schedule Page: 426.14 Line No.: 21 Column: a<br />
The Distribution Substation section includes substations that are characterized as<br />
Transmission based on the methodology where any substation that has a<br />
transmission-to-transmission transformation (Primary voltage >=60kV <strong>and</strong> secondary voltage<br />
>= 60kV), is defined as a transmission station, regardless of the number of distribution<br />
assets in the station. There are 600 Distribution Substations <strong>and</strong> 53 Transmission<br />
Substations with distribution transformer banks. Of the Distribution Substations, there<br />
are 462 substations with => 10 MVa capacity <strong>and</strong> 138 with < 10 MVa capacity.<br />
Schedule Page: 426.17 Line No.: 19 Column: a<br />
The original entries in column f were in two decimal places, which the <strong>FERC</strong> software<br />
rounds automatically to whole numbers. The entry here is an adjustment to present the<br />
correct total.<br />
Schedule Page: 426.17 Line No.: 21 Column: a<br />
Substation voltage classes are listed separately for each substation. Substations having<br />
combined total capacity of =>10 MVa are listed individually above. All transmission<br />
substations are =>10MVA. A number of substations contain several voltage classes on<br />
multiple lines. All transmission <strong>and</strong> distribution substations are unattended.<br />
There are 93 Transmission Substations <strong>and</strong> 600 Distribution Substations, representing a<br />
total of 693 physical transmission <strong>and</strong> distribution substations. There are 53 Transmission<br />
Substations with both transmission <strong>and</strong> distribution transformers.<br />
<strong>FERC</strong> FORM NO. 1 (ED. 12-87) Page 450.1
Name of Respondent<br />
This Report Is:<br />
Date of Report<br />
Year/Period of Report<br />
(1) X An Original<br />
(Mo, Da, Yr)<br />
PACIFIC GAS AND ELECTRIC COMPANY<br />
End of <strong>2010</strong>/Q4<br />
(2) A Resubmission<br />
04/08/2011<br />
TRANSACTIONS WITH ASSOCIATED (AFFILIATED) COMPANIES<br />
1. Report below the information called for concerning all non-power goods or services received from or provided to associated (affiliated) companies.<br />
2. The reporting threshold for reporting purposes is $250,000. The threshold applies to the annual amount billed to the respondent or billed to<br />
an associated/affiliated company for non-power goods <strong>and</strong> services. The good or service must be specific in nature. Respondents should not<br />
attempt to include or aggregate amounts in a nonspecific category such as "general".<br />
3. Where amounts billed to or received from the associated (affiliated) company are based on an allocation process, explain in a footnote.<br />
Line<br />
No. Description of the Non-Power Good or Service<br />
(a)<br />
1 Non-power Goods or Services Provided by Affiliated<br />
Name of<br />
Assiciated/Affiliated<br />
<strong>Company</strong><br />
(b)<br />
Account<br />
Charged or<br />
Credited<br />
(c)<br />
Amount<br />
Charged or Credited<br />
(d)<br />
2 Admin & General Expenses PG&E Corporation 401<br />
55,468,994<br />
3 A&G Direct Chars 2,351,331<br />
4 A&G Allocation 53,117,663<br />
5 Overcollateralization Fee <strong>Pacific</strong> Energy Recovery 421<br />
1,830,546<br />
6 Interest Expense <strong>Pacific</strong> Energy Recovery 430<br />
44,727,002<br />
7 Other Expense St<strong>and</strong>ard <strong>Pacific</strong> <strong>Gas</strong> 401<br />
861,848<br />
8 Rent Expense Eureka Energy <strong>Company</strong> 401<br />
265,846<br />
9<br />
10 TOTAL 103,154,236<br />
11<br />
12<br />
13<br />
14<br />
15<br />
16<br />
17<br />
18<br />
19<br />
20 Non-power Goods or Services Provided for Affiliate<br />
21 A&G Direct Charges PG&E Corporation 401<br />
6,108,307<br />
22 A&G Direct Charges FUELCO LLC 401<br />
276,161<br />
23 Admin & Service Fees PG&E Energy Recovery 417<br />
2,559,093<br />
24 Admin & General Charges <strong>Pacific</strong> Energy Fuels 401<br />
518,768<br />
25 A&G Direct Charges PCG Capital Inc 401<br />
647,879<br />
26<br />
27 TOTAL 10,110,207<br />
28<br />
29<br />
30<br />
31<br />
32<br />
33<br />
34<br />
35<br />
36<br />
37<br />
38<br />
39<br />
40<br />
41<br />
42<br />
<strong>FERC</strong> FORM NO. 1 (New) Page 429<br />
<strong>FERC</strong> FORM NO. 1-F (New)
Name of Respondent<br />
PACIFIC GAS AND ELECTRIC COMPANY<br />
This Report is:<br />
(1) X An Original<br />
(2) A Resubmission<br />
Date of Report<br />
(Mo, Da, Yr)<br />
04/08/2011<br />
Year/Period of Report<br />
<strong>2010</strong>/Q4<br />
FOOTNOTE DATA<br />
Schedule Page: 429 Line No.: 4 Column:<br />
The 3-Factor Allocation Method used here is an apportionment factor based on each<br />
subsidiary's relative weighted average of assets, operating expenses excluding fuel, <strong>and</strong><br />
headcount.<br />
<strong>FERC</strong> FORM NO. 1 (ED. 12-87) Page 450.1
SELECTED FINANCIAL DATA - CLASS A, B, C, AND D ELECTRIC UTILITIES<br />
PACIFIC GAS AND ELECTRIC COMPANY<br />
PERSON RESPONSIBLE FOR THIS REPORT: Dinyar Mistry, Vice President <strong>and</strong> Controller<br />
(PREPARED FROM INFORMATION IN THE <strong>2010</strong> <strong>FERC</strong> ANNUAL REPORTS)<br />
NET ELECTRIC PLANT INVESTMENT (a)<br />
December 31<br />
2009 <strong>2010</strong> Annual Average<br />
<strong>Electric</strong> Utility Plant (California Only)<br />
1. Intangible Plant $ 653,039,599 $ 721,028,719 $ 687,034,159<br />
2. L<strong>and</strong> <strong>and</strong> L<strong>and</strong> Rights 497,822,413 527,291,709 512,557,061<br />
3. Depreciable Plant 35,727,479,364 38,594,149,912 37,160,814,638<br />
4. Nuclear Fuel 1,995,799,030 2,153,305,377 2,074,552,204<br />
5. Gross <strong>Electric</strong> Utility Plant 38,874,140,406 41,995,775,717 40,434,958,062<br />
6. <strong>Electric</strong> Plant Held for Future Use - Net 0 0 0<br />
7. Construction Work in Progress - <strong>Electric</strong> 1,647,820,850 1,202,202,048 1,425,011,449<br />
8. Accumulated Deferred Income Taxes 464,662,038 628,483,184 546,572,611<br />
9. Less: Reserves for Depreciation - <strong>Electric</strong><br />
Utility Plant 18,350,492,520 18,894,048,491 18,622,270,506<br />
10. Less: Amortization <strong>and</strong> Depletion Reserves 1,852,590,968 1,998,657,166 1,925,624,067<br />
11. Less: Customer Advances <strong>and</strong> Contribution<br />
in Aid of Construction 118,256,777 110,480,707 114,368,742<br />
12. Less: Accumulated Deferred Income <strong>and</strong> Investment<br />
Tax Credits 5,150,157,362 5,988,944,882 5,569,551,122<br />
13. Material <strong>and</strong> Supplies - <strong>Electric</strong> Only 126,256,678 130,995,767 128,626,223<br />
14. Net <strong>Electric</strong> Plant Investment $ 15,641,382,345 $ 16,965,325,470 $ 16,303,353,908<br />
CAPITALIZATION (Total <strong>Company</strong>)<br />
15. Common Stock $ 1,321,874,045 $ 1,321,874,045 $ 1,321,874,045<br />
16. Capital Stock (Premium, Discount <strong>and</strong> Expense)-Net 1,769,325,445 1,769,325,445 1,769,325,445<br />
17. Other Paid in Capital 1,285,216,984 1,471,315,126 1,378,266,055<br />
18. Retained Earnings 6,551,008,147 6,900,585,718 6,725,796,933<br />
19. Other Miscellaneous Capital Accounts 0 0 0<br />
20. Common Stock <strong>and</strong> Equity (Lines 15 through 19) 10,927,424,621 11,463,100,334 11,195,262,478<br />
21. Preferred Stock 257,994,575 257,994,575 257,994,575<br />
22. Long-Term Debt 11,356,922,217 12,201,402,470 11,779,162,344<br />
23. Notes Payable <strong>and</strong> Current Portion of Long-Term Debt 833,000,000 853,033,000 843,016,500<br />
24. Total Capitalization (Lines 20 through 23) $ 23,375,341,413 $ 24,775,530,379 $ 24,075,435,897<br />
(a) Includes Common Plant Allocations.<br />
-<br />
Page 600
PACIFIC GAS AND ELECTRIC COMPANY<br />
INCOME STATEMENT DATA<br />
FOR CALIFORNIA INTRASTATE ELECTRIC OPERATIONS ONLY (b)<br />
Annual Amount<br />
25. Operating Revenues 10,631,037,641<br />
26. Operating <strong>and</strong> Maintenance Expense 6,735,737,302<br />
27. Depreciation 996,093,798<br />
28. Depreciation for Asset Retirement Costs -<br />
29. Amortization <strong>and</strong> Depletion Expenses <strong>and</strong> Property Losses 138,803,626<br />
30. Regulatory Debits 387,947,799<br />
31. Regulatory Credits 63<br />
32. Property Taxes (Ad Valorem) 194,310,400<br />
33. Taxes Other than Income <strong>and</strong> Property Taxes 89,937,265<br />
34. Operating Revenue Deductions (Before Federal <strong>and</strong><br />
California Income Taxes) 8,542,830,253<br />
35. Federal <strong>and</strong> California Income Taxes - Net 531,105,074<br />
36. Gains <strong>and</strong> Losses from Disposition of <strong>Electric</strong> Plant - Net (1,199,581)<br />
37. Accretion Expense -<br />
38. Total Utility Operating Expenses 9,072,735,746<br />
39. Net Operating Income (California Intrastate <strong>Electric</strong> Operations Only) 1,558,301,895<br />
OTHER INCOME AND EXPENSE (Total <strong>Company</strong>)<br />
40. Net Operating Income from Other Utility Operations (Total) 276,009,068<br />
41. Net Other Income <strong>and</strong> Deductions (91,592,428)<br />
42. Income Before Interest Charges 1,742,718,535<br />
43. Interest Charges 621,744,831<br />
44. Income Before Extraordinary Items 1,120,973,704<br />
45. Extraordinary Items - Net of Income Tax -<br />
46. Net Income 1,120,973,704<br />
47. Preferred Stock Dividends <strong>and</strong> Redemption Premium 13,916,365<br />
48. Income Available for Common Stock $ 1,107,057,339<br />
49. Common Stock Dividends 716,000,000<br />
OTHER DATA (CALIFORNIA INTRASTATE ELECTRIC OPERATIONS ONLY) (b) Items (48-50)<br />
50. Payroll Charged to Operating <strong>and</strong> Maintenance Expense $ 994,575,373<br />
51. Payroll Capitalized to Utility Plant - <strong>Electric</strong> 400,607,268<br />
52.Total Payroll $ 1,395,182,641<br />
53. Purchased Power $ 3,633,537,677<br />
54. Allowance for Funds Used During Construction $ 139,777,700<br />
55. Interdepartmental Revenues $ 22,540,420<br />
56. Interdepartmental Expenses $ 123,351,684<br />
57. Revenue from Sales to Residential Customers $ 4,795,501,768<br />
58. Residential Sales in Kwhs 30,744,336,000<br />
59. Total Revenue Sales to Ultimate Customers $ 11,879,407,723<br />
60. Kwhs Sold to Ultimate Customers 84,064,481,000<br />
61. Average Number of Residential Customers 4,565,637<br />
62. Average Number of Ultimate Customers 5,212,596<br />
(b) Assumes CPUC Jurisdictional Portion of <strong>Electric</strong> Operations.<br />
Page 601