Measurement of cortisol in human hair as a biomarker of ... - UFPR
Measurement of cortisol in human hair as a biomarker of ... - UFPR
Measurement of cortisol in human hair as a biomarker of ... - UFPR

Create successful ePaper yourself
Turn your PDF publications into a flip-book with our unique Google optimized e-Paper software.
Sauvé et al. <strong>Me<strong>as</strong>urement</strong> <strong>of</strong> <strong>cortisol</strong> <strong>in</strong> <strong>hair</strong><br />
Logit (% bound)<br />
3<br />
2<br />
1<br />
0<br />
-1<br />
-2<br />
-3<br />
-4<br />
0 0.5 1 1.5 2<br />
Log <strong>cortisol</strong> concentration<br />
Mean blond (n=4)<br />
Mean brown (n=4)<br />
Mean black (n=4)<br />
formance. Ur<strong>in</strong>e <strong>cortisol</strong> w<strong>as</strong> first extracted with<br />
methylene chloride, then constituted and tested us<strong>in</strong>g<br />
the same method <strong>as</strong> for serum <strong>cortisol</strong>. The creat<strong>in</strong><strong>in</strong>e<br />
level <strong>in</strong> the ur<strong>in</strong>e w<strong>as</strong> used to ensure there w<strong>as</strong> a complete<br />
24-hr ur<strong>in</strong>e collection. For <strong>cortisol</strong> me<strong>as</strong>urements<br />
<strong>in</strong> saliva, the sensitivity is 1 ng/mL; the coefficient<br />
<strong>of</strong> variation (CV) is 10.3 % at 6.6 ng/mL, and<br />
6.5% at 52.4 ng/mL (manufacturer <strong>in</strong>formation). For<br />
mean serum <strong>cortisol</strong> concentrations <strong>of</strong> 753, 549 and<br />
59 nmol/L, the CV w<strong>as</strong> 6.34, 7.08, and 11.52%, respectively.<br />
For a mean ur<strong>in</strong>e <strong>cortisol</strong> <strong>of</strong> 39 nmol/L, the<br />
CV w<strong>as</strong> 12%. The LOD for ur<strong>in</strong>e and serum <strong>cortisol</strong><br />
w<strong>as</strong> 5 nmol/L and 5 nmol/day, respectively.<br />
Data Analysis<br />
All data are presented <strong>as</strong> median (range) unless <strong>in</strong>dicated<br />
otherwise. All statistics were run us<strong>in</strong>g the<br />
Sigma Stat program (Version 3.1). Comparison between<br />
groups w<strong>as</strong> done us<strong>in</strong>g unpaired Student t-test<br />
or the Mann-Whitney U test <strong>as</strong> appropriate b<strong>as</strong>ed on<br />
data-distribution. Correlation coefficients between different<br />
parameters were calculated with the Spearman’s<br />
PBS<br />
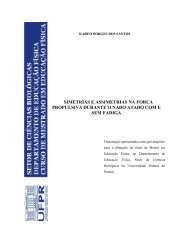
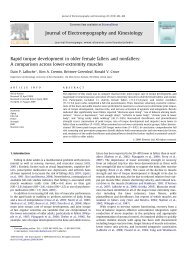
FIGURE 1. Effect <strong>of</strong> natural <strong>hair</strong> colour on the detection <strong>of</strong><br />
<strong>cortisol</strong> <strong>in</strong> <strong>hair</strong> samples. Cortisol standards were created <strong>in</strong><br />
b<strong>as</strong>ic PBS and <strong>in</strong> <strong>hair</strong> solutions generated from blond, brown<br />
and black <strong>hair</strong> samples dur<strong>in</strong>g overnight <strong>hair</strong> <strong>in</strong>cubation. The<br />
Y-axis represents exogenous <strong>cortisol</strong>-conjugate bound <strong>as</strong> a<br />
percent <strong>of</strong> the amount <strong>of</strong> <strong>cortisol</strong>-conjugate me<strong>as</strong>ured <strong>in</strong> the<br />
zero standard. Therefore, <strong>as</strong> a result <strong>of</strong> ELISA’s competitive<br />
b<strong>in</strong>d<strong>in</strong>g process, the amount <strong>of</strong> <strong>cortisol</strong> <strong>in</strong> a sample is <strong>in</strong>versely<br />
proportional to the amount <strong>of</strong> exogenous <strong>cortisol</strong>conjugate<br />
me<strong>as</strong>ured.<br />
2.5<br />
rank correlation. Differences <strong>in</strong> <strong>hair</strong> <strong>cortisol</strong> levels<br />
from various parts <strong>of</strong> the head <strong>as</strong> well <strong>as</strong> changes <strong>in</strong><br />
<strong>hair</strong> <strong>cortisol</strong> levels with sequential dye treatment were<br />
evaluated us<strong>in</strong>g Kruskal-Wallis One Way Analysis <strong>of</strong><br />
Variance on Ranks.<br />
Results<br />
A) Evaluation <strong>of</strong> ELISA Assay for Hair Cortisol<br />
Extraction recovery and precision<br />
The mean extraction recovery <strong>of</strong> 80 ng/ml and 2 ng/<br />
ml <strong>cortisol</strong> standards (n=5) from PBS w<strong>as</strong> 87.4% and<br />
83.6% respectively. When <strong>hair</strong> samples were spiked<br />
with 100 ng/ml, 50 ng/ml and 2 ng/ml (n=6) <strong>cortisol</strong><br />
standards, <strong>in</strong>cubated and extracted, the mean extraction<br />
recoveries were 87.9%, 88.9% and 87.4%, respectively.<br />
Accord<strong>in</strong>g to the manufacturer, the lowest level <strong>of</strong><br />
detection for <strong>cortisol</strong> 1.14 ng/ml. The precision <strong>of</strong> the<br />
ELISA <strong>as</strong>say w<strong>as</strong> determ<strong>in</strong>ed us<strong>in</strong>g two <strong>hair</strong> samples<br />
with an average (about 60 pg/mg) and a high <strong>cortisol</strong><br />
level (about 600 pg/mg). The <strong>in</strong>tra-<strong>as</strong>say CVs for<br />
these samples were 7.2% and 6.0%, respectively.<br />
Inter-day precision w<strong>as</strong> slightly more variable, with a<br />
CV <strong>of</strong> 10.6% for the sample <strong>of</strong> average concentration<br />
and 7.6% for the sample <strong>of</strong> high <strong>cortisol</strong> content.<br />
Effect natural <strong>hair</strong> color on <strong>hair</strong> <strong>cortisol</strong> levels<br />
Cortisol levels <strong>in</strong> the standards created from different<br />
<strong>hair</strong> color matrices did not differ significantly from the<br />
levels <strong>in</strong> PBS standards (Figure 1), <strong>in</strong>dicat<strong>in</strong>g that<br />
me<strong>as</strong>urement <strong>of</strong> <strong>hair</strong> <strong>cortisol</strong> levels is not affected by<br />
variation <strong>in</strong> natural <strong>hair</strong> color.<br />
Hair <strong>cortisol</strong> levels <strong>in</strong> <strong>hair</strong> collected from different<br />
sections <strong>of</strong> the head, and <strong>in</strong>tra-<strong>in</strong>dividual variation <strong>in</strong><br />
two samples from the vertex posterior<br />
Hair <strong>cortisol</strong> levels <strong>in</strong> samples obta<strong>in</strong>ed from posterior<br />
vertex, nape, temporal, anterior vertex, and frontal<br />
sections <strong>of</strong> the head <strong>in</strong> 14 <strong>in</strong>dividuals were 72.9<br />
(32.4-120), 63.4 (31.2-1010.4), 61.6 (30.0-257.3),<br />
50.3 (34.0-133.0) and 86.5 (14.6-183.3) pg/mg, respectively.<br />
One-way ANOVA analysis did not reveal<br />
© 2007 CIM Cl<strong>in</strong> Invest Med • Vol 30, no 5, August 2007 E186