Lactate threshold concepts - UFPR
Lactate threshold concepts - UFPR
Lactate threshold concepts - UFPR

Create successful ePaper yourself
Turn your PDF publications into a flip-book with our unique Google optimized e-Paper software.
REVIEW ARTICLE<br />
Sports Med 2009; 39 (6): 469-490<br />
0112-1642/09/0006-0469/$49.95/0<br />
ª 2009 Adis Data Information BV. All rights reserved.<br />
<strong>Lactate</strong> Threshold Concepts<br />
How Valid are They?<br />
Oliver Faude, 1,2 Wilfried Kindermann 2 and Tim Meyer 1,2<br />
1 Institute of Sports Medicine, University Paderborn, Paderborn, Germany<br />
2 Institute of Sports and Preventive Medicine, University of Saarland, Saarbrücken, Germany<br />
Contents<br />
Abstract. . . . . . . . . . . . . . . . . . . . . . . . . . . . . . . . . . . . . . . . . . . . . . . . . . . . . . . . . . . . . . . . . . . . . . . . . . . . . . . . . 469<br />
1. Historical Remarks on Endurance Performance Diagnosis . . . . . . . . . . . . . . . . . . . . . . . . . . . . . . . . . . . . 470<br />
2. Incremental Exercise Testing and the Interpretation of Blood <strong>Lactate</strong> Curves . . . . . . . . . . . . . . . . . . . 471<br />
2.1 The Entire Blood <strong>Lactate</strong> Curve . . . . . . . . . . . . . . . . . . . . . . . . . . . . . . . . . . . . . . . . . . . . . . . . . . . . . . 471<br />
2.1.1 Test Design and Data Treatment . . . . . . . . . . . . . . . . . . . . . . . . . . . . . . . . . . . . . . . . . . . . . . . . 472<br />
2.1.2 Methodology of Blood <strong>Lactate</strong> Determination . . . . . . . . . . . . . . . . . . . . . . . . . . . . . . . . . . . . 472<br />
2.2 A Framework for Endurance Diagnosis and Training Prescriptions. . . . . . . . . . . . . . . . . . . . . . . . . . 473<br />
3. Validation of <strong>Lactate</strong> Thresholds . . . . . . . . . . . . . . . . . . . . . . . . . . . . . . . . . . . . . . . . . . . . . . . . . . . . . . . . . 474<br />
3.1 Competition Performance . . . . . . . . . . . . . . . . . . . . . . . . . . . . . . . . . . . . . . . . . . . . . . . . . . . . . . . . . . 474<br />
3.2 The Maximal <strong>Lactate</strong> Steady State . . . . . . . . . . . . . . . . . . . . . . . . . . . . . . . . . . . . . . . . . . . . . . . . . . . 474<br />
4. <strong>Lactate</strong> Threshold Concepts . . . . . . . . . . . . . . . . . . . . . . . . . . . . . . . . . . . . . . . . . . . . . . . . . . . . . . . . . . . . 475<br />
4.1 Located <strong>Lactate</strong> Threshold Concepts. . . . . . . . . . . . . . . . . . . . . . . . . . . . . . . . . . . . . . . . . . . . . . . . . 475<br />
4.1.1 Aerobic <strong>Lactate</strong> Thresholds . . . . . . . . . . . . . . . . . . . . . . . . . . . . . . . . . . . . . . . . . . . . . . . . . . . . 475<br />
4.1.2 Anaerobic <strong>Lactate</strong> Thresholds . . . . . . . . . . . . . . . . . . . . . . . . . . . . . . . . . . . . . . . . . . . . . . . . . . 476<br />
4.2 <strong>Lactate</strong> Thresholds and (Simulated) Competition Results. . . . . . . . . . . . . . . . . . . . . . . . . . . . . . . . . 477<br />
4.3 <strong>Lactate</strong> Thresholds and Maximal <strong>Lactate</strong> Steady State . . . . . . . . . . . . . . . . . . . . . . . . . . . . . . . . . . 480<br />
5. Conclusions and Perspectives . . . . . . . . . . . . . . . . . . . . . . . . . . . . . . . . . . . . . . . . . . . . . . . . . . . . . . . . . . . 484<br />
Abstract<br />
During the last nearly 50 years, the blood lactate curve and lactate<br />
<strong>threshold</strong>s (LTs) have become important in the diagnosis of endurance performance.<br />
An intense and ongoing debate emerged, which was mainly based<br />
on terminology and/or the physiological background of LT <strong>concepts</strong>. The<br />
present review aims at evaluating LTs with regard to their validity in assessing<br />
endurance capacity. Additionally, LT <strong>concepts</strong> shall be integrated within the<br />
‘aerobic-anaerobic transition’ – a framework which has often been used for<br />
performance diagnosis and intensity prescriptions in endurance sports.<br />
Usually, graded incremental exercise tests, eliciting an exponential rise in<br />
blood lactate concentrations (bLa), are used to arrive at lactate curves. A shift<br />
of such lactate curves indicates changes in endurance capacity. This very<br />
global approach, however, is hindered by several factors that may influence<br />
overall lactate levels. In addition, the exclusive use of the entire curve leads to<br />
some uncertainty as to the magnitude of endurance gains, which cannot be<br />
precisely estimated. This deficiency might be eliminated by the use of LTs.<br />
The aerobic-anaerobic transition may serve as a basis for individually<br />
assessing endurance performance as well as for prescribing intensities in
470 Faude et al.<br />
endurance training. Additionally, several LT approaches may be integrated<br />
in this framework. This model consists of two typical breakpoints that are<br />
passed during incremental exercise: the intensity at which bLa begin to rise<br />
above baseline levels and the highest intensity at which lactate production<br />
and elimination are in equilibrium (maximal lactate steady state [MLSS]).<br />
Within this review, LTs are considered valid performance indicators when<br />
there are strong linear correlations with (simulated) endurance performance.<br />
In addition, a close relationship between LT and MLSS indicates validity<br />
regarding the prescription of training intensities.<br />
A total of 25 different LT <strong>concepts</strong> were located. All <strong>concepts</strong> were divided<br />
into three categories. Several authors use fixed bLa during incremental<br />
exercise to assess endurance performance (category 1). Other LT <strong>concepts</strong><br />
aim at detecting the first rise in bLa above baseline levels (category 2). The<br />
third category consists of <strong>threshold</strong> <strong>concepts</strong> that aim at detecting either the<br />
MLSS or a rapid/distinct change in the inclination of the blood lactate curve<br />
(category 3).<br />
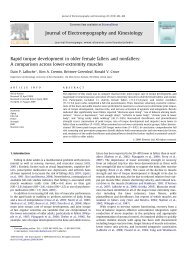
Thirty-two studies evaluated the relationship of LTs with performance in<br />
(partly simulated) endurance events. The overwhelming majority of those<br />
studies reported strong linear correlations, particularly for running events,<br />
suggesting a high percentage of common variance between LT and endurance<br />
performance. In addition, there is evidence that some LTs can estimate the<br />
MLSS. However, from a practical and statistical point of view it would be of<br />
interest to know the variability of individual differences between the<br />
respective <strong>threshold</strong> and the MLSS, which is rarely reported.<br />
Although there has been frequent and controversial debate on the LT<br />
phenomenon during the last three decades, many scientific studies have dealt<br />
with LT <strong>concepts</strong>, their value in assessing endurance performance or in prescribing<br />
exercise intensities in endurance training. The presented framework<br />
may help to clarify some aspects of the controversy and may give a rationale<br />
for performance diagnosis and training prescription in future research as well<br />
as in sports practice.<br />
1. Historical Remarks on Endurance<br />
Performance Diagnosis<br />
As early as 1808, Berzelius observed that lactic<br />
acid was produced in the muscles of hunted<br />
stags. [1] About a century later, several scientists<br />
studied the biochemistry of energy metabolism<br />
and muscle contraction in more detail. This led to<br />
a much deeper understanding of the formation of<br />
lactic acid (lactate and hydrogen ions) during intense<br />
exercise. [2-5] At that time, it was common<br />
belief that lactic acid is a waste product of glycolysis<br />
and will be formed when oxygen delivery to<br />
exercising muscles is not sufficient and muscle<br />
anaerobiosis occurs. [2,6,7] This view has been<br />
challenged considerably during the last two decades.<br />
Anaerobic glycolysis and, thus, lactate<br />
kinetics rather seem to be an ongoing process –<br />
even in the resting individual – which is highly<br />
related to the metabolic rate but not necessarily<br />
to oxygen availability (for detailed review see<br />
Gladden, [1,8] Brooks, [9] Robergs et al. [10] ).<br />
In the first half of the 20th century the concept<br />
of maximum oxygen consumption as the first and<br />
probably most common means of evaluating<br />
aerobic endurance capacity was developed by the<br />
working group of Nobel Laureate AV Hill. [6]<br />
maximal oxygen uptake (V O 2max ) has been established<br />
as a valuable tool to distinguish<br />
between fit and unfit subjects. However, several<br />
concerns were raised regarding the sensitivity of<br />
V O 2max . For instance, it is difficult to discriminate<br />
ª 2009 Adis Data Information BV. All rights reserved. Sports Med 2009; 39 (6)
Validity of <strong>Lactate</strong> Thresholds 471<br />
between subjects of homogenous performance<br />
levels by means of V O 2max . [11-18] In addition,<br />
sufficient effort during whole-body work and,<br />
therefore, adequate motivation of the investigated<br />
subject is necessary to appropriately determine<br />
V O 2max . Particularly in clinical settings<br />
with diseased patients, whole-body exhaustion is<br />
difficult to attain or is even avoided because of<br />
the risk of adverse events. [19,20]<br />
Therefore, attempts have been made to establish<br />
sub-maximal parameters to assess cardiorespiratory<br />
fitness in patients and athletes. Early<br />
research by the working group of Hollmann<br />
established the so-called ‘point of optimum ventilatory<br />
efficiency’ corresponding to the first increase<br />
in the ventilatory equivalent of oxygen<br />
and of arterial lactate concentrations during<br />
incremental exercise. [19,21] A few years later,<br />
Wasserman and McIllroy [22] determined this intensity<br />
by plotting ventilation versus oxygen<br />
uptake in cardiac patients and named it the<br />
‘anaerobic <strong>threshold</strong>’ (LT An ). At that time,<br />
routine determination of blood lactate concentrations<br />
(bLa) was associated with several<br />
difficulties and gas exchange measurements were<br />
more common – especially in clinical settings.<br />
Therefore, it became popular to detect the LT An<br />
by means of gas exchange analysis.<br />
In the 1960s, the enzymatic method for measuring<br />
lactate concentrations from capillary<br />
blood samples was developed. This led to the increasing<br />
popularity of using bLa as a parameter<br />
to assess endurance capacity as well as for classifying<br />
work rate during exercise. [19,23,24] In the<br />
following years, numerous lactate <strong>threshold</strong> (LT)<br />
<strong>concepts</strong> were developed. The number of scientific<br />
studies on LTs has increased enormously up<br />
to now and the sub-maximal course of bLa during<br />
incremental exercise has probably become<br />
one of the most important means in the diagnosis<br />
of endurance performance in sports practice.<br />
[15,16,25,26] However, the variety of different<br />
<strong>threshold</strong> <strong>concepts</strong> has led to considerable confusion<br />
and misinterpretation.<br />
An intense and ongoing debate emerged,<br />
which was mainly based upon terminology<br />
and/or the physiological background of LT <strong>concepts</strong>.<br />
[27] Early assumptions on lactate production<br />
and distribution in the organism have been<br />
challenged. [1,8-10,28] It has been argued that bLa<br />
increase continuously rather than show a clear<br />
<strong>threshold</strong> during incremental exercise. Furthermore,<br />
the contribution of aerobic and anaerobic<br />
pathways to energy production does not change<br />
suddenly but shows a continuous transition<br />
and, therefore, the term ‘<strong>threshold</strong>’ might be<br />
misleading. [29]<br />
Against this background and to unravel the<br />
confusion, it seems valuable to give a summary<br />
on published LT <strong>concepts</strong>. The present review is<br />
mainly aimed at evaluating the located LT <strong>concepts</strong><br />
with regard to their validity in assessing<br />
aerobic endurance capacity and prescribing<br />
training intensity. A further aim was to try<br />
to integrate those <strong>concepts</strong> into a framework<br />
that was originally called the aerobic-anaerobic<br />
transition. [30-32]<br />
It has to be emphasized that this text focuses<br />
on LTs only. Although a close link between lactate<br />
and gas exchange markers has often been<br />
proposed, [21,31,33-36] there is still controversial<br />
debate with regard to the underlying physiological<br />
mechanisms. [37] A comprehensive review on<br />
gas exchange <strong>threshold</strong>s has recently been published.<br />
[31] Additionally, it is not within the scope<br />
of this article to exhaustively review the biochemistry<br />
of glycolysis and lactate metabolism.<br />
2. Incremental Exercise Testing and the<br />
Interpretation of Blood <strong>Lactate</strong> Curves<br />
2.1 The Entire Blood <strong>Lactate</strong> Curve<br />
Usually, graded incremental exercise tests<br />
(GXTs) are used to evaluate aerobic endurance<br />
performance capacity. Typically, an exponential<br />
rise in bLa during incremental exercise testing<br />
can be observed (figure 1). The issue of interest is<br />
to interpret the resulting lactate curve with regard<br />
to endurance capacity. It is generally accepted<br />
that a rightward shift of the lactate curve (lower<br />
bLa at given workload) can be interpreted in<br />
terms of an improved endurance capacity [38-40]<br />
and, in contrast, a shift to the left (higher bLa at<br />
given workload) is usually considered to represent<br />
worsening endurance capacity. [41]<br />
ª 2009 Adis Data Information BV. All rights reserved. Sports Med 2009; 39 (6)
472 Faude et al.<br />
Blood lactate concentration (mmol/L)<br />
10<br />
8<br />
6<br />
4<br />
2<br />
0<br />
Regenerative/<br />
low-intensity<br />
endurance<br />
training<br />
Aerobic <strong>threshold</strong><br />
Moderate-/<br />
high-intensity<br />
endurance<br />
training<br />
Aerobicanaerobic<br />
transition<br />
Work intensity<br />
Interval<br />
training<br />
sessions<br />
MLSS = anaerobic<br />
<strong>threshold</strong><br />
Fig. 1. A typical lactate-workload plot including the aerobicanaerobic<br />
transition as a framework to derive endurance training<br />
intensities for different intensity zones. MLSS = maximal lactate<br />
steady state.<br />
Overall lactate levels are known to be influenced<br />
by depleted glycogen stores (due to a low<br />
carbohydrate diet or preceding exhaustive exercise).<br />
[42-44] For instance, lower bLa at the same<br />
work rates have been reported in a glycogendepleted<br />
subject compared with a subject in normal<br />
condition. This may lead to a downward<br />
shift of the lactate curve and it is important<br />
that this is not falsely interpreted as an enhancement<br />
in endurance capacity. [45] Furthermore,<br />
several other factors like muscle fibre composition,<br />
glycolytic and lipolytic enzyme activity as<br />
well as capillary or mitochondrial density might<br />
influence blood lactate curves. [46] Additionally,<br />
the entire lactate curve is dependent on several<br />
other methodological issues, which should be taken<br />
into account when interpreting test results.<br />
2.1.1 Test Design and Data Treatment<br />
It is of note that the specific GXT protocol can<br />
vary considerably with regard to starting and<br />
subsequent work rates, work rate increments and<br />
stage duration. A recent review focused on the<br />
influence of varying test protocols on markers<br />
usually used in the diagnosis of endurance performance.<br />
[47] For instance, varying stage duration<br />
or work rate increments may lead to relevant<br />
differences in blood lactate curves and LTs. [48-50]<br />
A possible reason might be the time allowed for<br />
lactate diffusion in the blood until the next work<br />
rate increment. [47]<br />
In addition, there has been great debate on the<br />
best fitting procedure for the obtained bLa data<br />
set. For instance, a single- [51] or double-phase<br />
model [52] using two or three linear regression<br />
segments, a double-log model, [53] a third-order<br />
polymonial [54] or an exponential function [55] have<br />
been used in previous studies. Up to now, no<br />
generally accepted fitting procedure has been<br />
established. [47] Thus, it seems appropriate that<br />
test design as well as data fitting procedures<br />
should be chosen (and reported) as has been<br />
originally described for a certain LT.<br />
2.1.2 Methodology of Blood <strong>Lactate</strong> Determination<br />
From a methodological point of view, the site<br />
(earlobe, fingertip) as well as the method (venous,<br />
arterial, capillary) of blood sampling [56,57] and<br />
the laboratory methods (lactate analyser, analysed<br />
blood medium) [58-60] may also affect the test<br />
result. Samples taken from the earlobe have uniformly<br />
been shown to result in lower bLa than<br />
samples taken from the fingertip. [57,61,62] With<br />
regard to the analysed blood medium, plasma<br />
values were considerably higher than whole<br />
venous lactate concentrations, with capillary<br />
values lying in between. [48,56,63-65] In addition,<br />
several studies reported partly considerable differences<br />
between various lactate analysers (portable<br />
field vs laboratory analysers, amperometric<br />
vs photometric method) and under various climatic<br />
conditions. [58,66-69]<br />
The analysis of the whole blood lactate curve is<br />
a very global approach to evaluating endurance<br />
capacity. On the one hand, this approach is affected<br />
by the above-mentioned factors on overall<br />
lactate levels. On the other hand, the use of<br />
the entire curve leads to some uncertainty as to<br />
the magnitude of endurance gains that cannot be<br />
precisely estimated. However, the use of LTs<br />
enables a quantitative evaluation of changes in<br />
endurance performance. In addition, the ideal LT<br />
concept would not be affected by the abovementioned<br />
factors. There is evidence that approaches<br />
that analyse relative changes in bLa during GXTs<br />
may be favourable compared with the use of<br />
absolute lactate values in this regard. [56,67]<br />
ª 2009 Adis Data Information BV. All rights reserved. Sports Med 2009; 39 (6)
Validity of <strong>Lactate</strong> Thresholds 473<br />
2.2 A Framework for Endurance Diagnosis<br />
and Training Prescriptions<br />
In 1979, Kindermann et al. [30] introduced<br />
the concept of the aerobic-anaerobic transition<br />
as a framework for performance diagnosis<br />
and training prescription in endurance sports<br />
(figure 1). Since then, this framework has been<br />
adopted, applied and refined by several<br />
scientists either using lactate or gas exchange<br />
markers. [16,26,31,33,34,46,70-75]<br />
This model consists of two typical breakpoints<br />
that are passed during incremental exercise. In<br />
the low intensity range, there is an intensity at<br />
which bLa begin to rise above baseline levels.<br />
This intensity was originally determined using gas<br />
exchange measurements, [21,22] and Wasserman<br />
called it the ‘anaerobic <strong>threshold</strong>’. This term has<br />
since been used for various LTs, particularly those<br />
with a different physiological background, [33,75]<br />
and, thus, has caused considerable confusion.<br />
Kindermann et al. [30] and Skinner and McLellan<br />
[34] suggested this intensity be called the<br />
‘aerobic <strong>threshold</strong>’ (LT Aer ), because it marks the<br />
upper limit of a nearly exclusive aerobic metabolism<br />
and allows exercise lasting for hours. This<br />
intensity might be suitable for enhancing cardiorespiratory<br />
fitness in recreational sports, for<br />
cardiac rehabilitation in patients or for lowintensity<br />
and regenerative training sessions in<br />
high level endurance athletes. [16,25,26,32,70,76-81]<br />
Exercise intensities only slightly above the<br />
LT Aer result in elevated but constant bLa during<br />
steady-state exercise and can be maintained for<br />
prolonged periods of time (~4 hours at intensities<br />
in the range of the first increase in bLa [82-84] and<br />
45–60 minutes at an intensity corresponding to<br />
the maximal lactate steady state [MLSS] [85,86] ).<br />
Although anaerobic glycolysis is enhanced, it is<br />
speculated that such intensities may induce a<br />
considerable increase in the oxidative metabolism<br />
of muscle cells. [30,87] Theoretically, a high stimulation<br />
of oxidative metabolism for as long a period<br />
of time as is possible in this intensity range<br />
might be an appropriate load for endurance<br />
training. The highest constant workload that still<br />
leads to an equilibrium between lactate production<br />
and lactate elimination represents the MLSS.<br />
Some authors suggested that this intensity be<br />
called the ‘anaerobic <strong>threshold</strong>’. [27,30,49,88]<br />
It has been shown that the constant bLa at<br />
MLSS is not equal in all individuals and can vary<br />
considerably (values from 2 up to 10 mmol/L<br />
were reported in several studies). [50,72,86,89-93]<br />
Beneke and von Duvillard [94] as well as Beneke<br />
et al. [95] reported that bLa at MLSS is dependent<br />
on the motor pattern of exercise. Therefore, it<br />
was suggested that to determine the LT An , individualized<br />
approaches rather than a fixed bLa<br />
should be used. [88,96,97]<br />
The MLSS represents the upper border of<br />
constant load endurance training. [30,49,71,95]<br />
Intensities above the MLSS have been used to<br />
guide interval training sessions in different<br />
endurance sports. [26,31,98-102]<br />
The intensity range between LT Aer and LT An<br />
is called the aerobic-anaerobic transition. The<br />
described <strong>threshold</strong>s (first increase in bLa and<br />
MLSS) have recently also been called ‘lactate<br />
<strong>threshold</strong> and lactate turnpoint’, ‘lactate <strong>threshold</strong><br />
and anaerobic <strong>threshold</strong>’, or ‘anaerobic<br />
<strong>threshold</strong> 1 and 2’, respectively. [26,75,103,104] Within<br />
the present review, it was decided to stick to the<br />
originally introduced nomenclature. [30,31,34]<br />
There has been an exhaustive debate whether<br />
there exist clear breakpoints in the lactate/work<br />
rate relationship or whether lactate increase is<br />
rather a continuous function during incremental<br />
work. [47] Furthermore, the terms ‘aerobic’ and<br />
‘anaerobic’ <strong>threshold</strong> may suggest clearly discernible<br />
physiological processes. However, these<br />
processes are rather of a transitional nature with<br />
aerobic and anaerobic energetic pathways always<br />
simultaneously contributing to energy production<br />
during both low- and high-intensity exercise.<br />
However, the proposed model seems appropriate<br />
both from a practical and from a didactical point<br />
of view. In addition, there is evidence that the<br />
described breakpoints may have some exercise<br />
physiological relevance. It has been shown that<br />
exercise above the MLSS is associated with an<br />
over-proportional excretion of stress hormones<br />
as well as of immunological markers during<br />
constant load exercise. [105,106] Furthermore,<br />
Lucia et al. [107] observed changes in electromyographical<br />
activity of the vastus lateralis and<br />
ª 2009 Adis Data Information BV. All rights reserved. Sports Med 2009; 39 (6)
474 Faude et al.<br />
rectus femoris that were coincidental with the<br />
aerobic-anaerobic transition in 28 elite male<br />
cyclists.<br />
The widespread use of this model as well as<br />
the absence of an accepted alternative was the<br />
rationale for using this framework in the present<br />
review to categorize published LT <strong>concepts</strong>.<br />
3. Validation of <strong>Lactate</strong> Thresholds<br />
3.1 Competition Performance<br />
It is widely accepted that LTs (and the submaximal<br />
course of bLa during incremental<br />
exercise) are a criterion measure for aerobic<br />
endurance performance. [24,26,30,72,81,108] In particular,<br />
it has been shown that LTs are superior to<br />
maximal oxygen uptake when assessing endurance<br />
performance in homogenous groups of<br />
athletes. [11,12,109-111] The obvious gold standard<br />
to validate an LT concept is to compare it with<br />
the most recent competition performance in an<br />
endurance event (concurrent validity) or to assess<br />
its value in predicting endurance performance in<br />
future events (predictive validity). As an alternative<br />
to competition performance, the results of<br />
laboratory tests simulating an endurance event<br />
can be used. This might have the advantage of<br />
a higher standardization and, therefore, these<br />
test results may be more reliable. Correlations<br />
between the test value (LT) and the validity<br />
criterion (competition performance) can be dependent<br />
on several confounding factors such<br />
as, for example, the chosen competitive event<br />
(duration, laboratory or outdoor, athletic track<br />
or off-road), the sport that is evaluated as well<br />
as sex or age group and its heterogeneity in terms<br />
of endurance.<br />
3.2 The Maximal <strong>Lactate</strong> Steady State<br />
Endurance capacity can – from a metabolic<br />
point of view – be regarded as the highest steady<br />
state by energy supply from oxidative phosphorylation.<br />
[87] Therefore, another approach to assess<br />
aerobic endurance performance is the determination<br />
of the highest constant exercise intensity<br />
that can be maintained for a longer period of time<br />
Blood lactate concentration (mmol/L)<br />
10<br />
8<br />
6<br />
4<br />
2<br />
0<br />
Rest<br />
10 20 30 40<br />
Time (min)<br />
MLSS<br />
Fig. 2. The blood lactate response to several constant workload<br />
exercises with different intensities. The highest workload during<br />
which blood lactate concentrations can be still accepted as being<br />
steady state is defined as the maximal lactate steady state (MLSS).<br />
without a continuous rise in bLa. This intensity<br />
represents the MLSS, which has been shown to be<br />
highly related to competition performance in<br />
endurance events (r [correlation coefficient] =<br />
0.92 with 8 km running, r = 0.87 with 5 km running<br />
and r = 0.84 with 40 km cycling time trial<br />
speed, respectively). [112-114] The MLSS has been<br />
defined by some authors as the ‘anaerobic<br />
<strong>threshold</strong>’ because it represents an exercise<br />
intensity that can be maintained without considerable<br />
contribution of anaerobic metabolism.<br />
[27,30,50,72,115] Each higher intensity results in<br />
a clearly identifiable increase in bLa with time<br />
during constant load work. [50,86,88]<br />
The gold standard for the determination of the<br />
MLSS is performing several constant load trials<br />
of at least 30 minutes’ duration on different days<br />
at various exercise intensities (in the range of<br />
50–90% V O 2max , figure 2). [49,50,86,116,117] An increase<br />
in bLa of not more than 1 mmol/L between<br />
10 and 30 minutes during the constant load trials<br />
appears to be the most reasonable procedure for<br />
MLSS determination. [86,115]<br />
MLSS represents a steady state in several but<br />
not all physiological parameters. For instance,<br />
oxygen uptake, carbon dioxide output, respiratory<br />
exchange ratio and bicarbonate concentration<br />
were reported to remain nearly constant<br />
during constant load exercise at MLSS, but<br />
respiratory rate and heart rate significantly<br />
increased during this time. [85,118]<br />
ª 2009 Adis Data Information BV. All rights reserved. Sports Med 2009; 39 (6)
Validity of <strong>Lactate</strong> Thresholds 475<br />
In several endurance sports it is recommended<br />
to aim at a defined metabolic strain when a<br />
certain training stimulus is intended. [71,73,119,120]<br />
Therefore, it seems likely that training intensities<br />
for endurance training can be appropriately described<br />
when MLSS is known.<br />
For the purposes of this review based on the<br />
above-mentioned rationales, LTs are considered<br />
valid as performance indicators when there are<br />
high linear correlations with (simulated) endurance<br />
performance. In addition, a close<br />
relationship between LTs and MLSS suggests<br />
validity with regard to the prescription of training<br />
intensities. Therefore, it is desirable that LTs<br />
should fulfil both validity criteria.<br />
4. <strong>Lactate</strong> Threshold Concepts<br />
For the purposes of the present paper, the<br />
MEDLINE database PubMed was searched for<br />
the search terms ‘lactate <strong>threshold</strong>’, ‘aerobic<br />
<strong>threshold</strong>’ and ‘anaerobic <strong>threshold</strong>’ combined<br />
with either ‘endurance performance’ or ‘maximal<br />
lactate steady state’. Additionally, the references<br />
of the selected articles were searched for further<br />
relevant papers. The located original publications<br />
were searched for papers describing different LT<br />
<strong>concepts</strong> (section 4.1), a correlation between LTs<br />
and (simulated) endurance performance (section<br />
4.2) or the relationship between LTs and the<br />
MLSS (section 4.3).<br />
4.1 Located <strong>Lactate</strong> Threshold Concepts<br />
A total of 25 different LT <strong>concepts</strong> were<br />
located. Two studies were excluded from the<br />
present analysis because <strong>threshold</strong> determination<br />
was not solely based on bLa but also took gas<br />
exchange measurements into account. [121,122] All<br />
<strong>threshold</strong> <strong>concepts</strong> were divided into three categories.<br />
Several authors used so-called fixed blood<br />
lactate <strong>threshold</strong>s (LT fix ) during incremental<br />
exercise to evaluate aerobic endurance performance.<br />
These fixed bLas were set at 2, 2.5, 3 or<br />
4 mmol/L [24,108,123-125] with LT4 (4 mmol/L lactate<br />
<strong>threshold</strong>, originally described by Mader<br />
et al. [24] and by others later as the onset of blood<br />
lactate accumulation [OBLA] [108] ) being the most<br />
frequently used method.<br />
4.1.1 Aerobic <strong>Lactate</strong> Thresholds<br />
Table I shows an overview of LT <strong>concepts</strong> that<br />
could be categorized as the first rise in bLa above<br />
baseline levels (LT Aer ). Several researchers described<br />
the procedure to determine this <strong>threshold</strong><br />
with terms like ‘‘the first significant/marked/<br />
systematic/non-linear/sharp/abrupt sustained increase<br />
in bLa above baseline’’. [30,110,126-133,138]<br />
Although the visual determination of the first rise<br />
of bLa above baseline levels seems obvious and<br />
simple, in practice it is associated with considerable<br />
problems because of the only slight changes<br />
in bLa on the first steps during GXTs. Yeh<br />
et al. [142] demonstrated that the visual detection<br />
of the LT Aer (in that study called ‘anaerobic<br />
<strong>threshold</strong>’) led to relevant differences between<br />
observers. Therefore, it does not seem appropriate<br />
to determine this <strong>threshold</strong> by simple visual<br />
inspection. Thus, other methods were developed<br />
to make <strong>threshold</strong> determination more objective.<br />
For instance, some authors took the typical<br />
error of their lactate analysers into account and<br />
Table I. <strong>Lactate</strong> <strong>threshold</strong> <strong>concepts</strong> that were categorized in the<br />
aerobic <strong>threshold</strong> category. For further explanation see text<br />
Method and description<br />
Work intensity or oxygen uptake<br />
before/at which bLa begins to increase above baseline level [110,126]<br />
at which bLa exhibits a marked/systematic/significant/non-linear/<br />
sharp/abrupt sustained increase above baseline<br />
value [30,110,127-133]<br />
first significant elevation of lactate level (approximately 2 mmol/L) [30,34]<br />
before an elevation in bLa above baseline (at least 0.2 mmol/L due to<br />
error of lactate analyser) [123,134]<br />
rise in delta lactate (onset of plasma lactate accumulation) [109]<br />
at minimum lactate equivalent (bLa divided by oxygen uptake or work<br />
intensity) [36,135-137]<br />
at which plasma lactate concentration begins to increase when log<br />
bLa is plotted against log (work intensity) [53]<br />
at which bLa increases 0.5 mmol/L above resting concentration [138]<br />
at which bLa increases 1 mmol/L above baseline (i.e. lactate at low<br />
intensity corresponding to 40–60% V O 2max ) [111,139]<br />
preceding a bLa increase by 1 mmol/L or more [140,141]<br />
bLa = blood lactate concentrations; V O 2max = maximal oxygen uptake.<br />
ª 2009 Adis Data Information BV. All rights reserved. Sports Med 2009; 39 (6)
476 Faude et al.<br />
Table II. <strong>Lactate</strong> <strong>threshold</strong> <strong>concepts</strong> that were categorized in the anaerobic <strong>threshold</strong> category. For further explanation see text<br />
Threshold concept<br />
Method and description<br />
IAT (Stegmann et al.) [88]<br />
Tangent to bLa curve from recovery curve where bLa is equal to the value at end of GXT<br />
IAT (Keul et al.) [96] Tangent to bLa curve at 51°<br />
IAT (Simon et al.) [97] Tangent to bLa curve at 45°<br />
IAT (Berg et al.) [137]<br />
Intersection point between tangent for the minimum lactate equivalent and the linear function<br />
for the final 90 sec of GXT<br />
IAT (Bunc et al.) [143]<br />
Intersection between the exponential regression of the lactate curve and the bisector of the<br />
tangents of the upper and lower parts of the lactate curve<br />
IAT (Dickhuth et al.) [36,136]<br />
1.5 mmol/L above minimum lactate equivalent<br />
IAT (Baldari and Guidetti) [144]<br />
The second lactate increase of at least 0.5 mmol/L from the previous value<br />
D max (Cheng et al.) [54]<br />
Maximal distance from bLa curve to the line formed by its endpoints<br />
D mod (Bishop et al.) [140]<br />
Maximal distance from bLa curve to the line formed by the point before the first rise in bLa and<br />
the value at cessation of exercise<br />
<strong>Lactate</strong> turnpoint [103]<br />
The final running velocity before the observation of a sudden and sustained increase in bLa<br />
between LT Aer and V O 2max<br />
<strong>Lactate</strong> minimum speed [145]<br />
Minimum in bLa during GXT after high intensity exercise<br />
bLa = blood lactate concentration; GXT = incremental exercise test; IAT = individual anaerobic <strong>threshold</strong>; LT Aer = aerobic <strong>threshold</strong>;<br />
V O 2max = maximal oxygen uptake.<br />
determined this LT as the workload 0.2 mmol/L<br />
above the lowest exercise lactate value. [123]<br />
Hughson and Green [138] arbitrarily chose an increase<br />
of 0.5 mmol/L above resting lactate concentrations.<br />
Another work group [111,139] chose a<br />
1 mmol/L increment above lactate levels at low<br />
intensity (~40% to 60% V O 2max ) because it could<br />
be determined objectively and in a standardized<br />
manner in all subjects. Furthermore, the lowest<br />
value when bLa is divided by work intensity or<br />
V O 2 has also been used as a marker for LT Aer<br />
(minimum lactate equivalent). [36,135-137] Whereas<br />
Beaver and colleagues [53] used a log-log transformation<br />
to assess the first rise in bLa more objectively<br />
as the intersection of two linear regressions,<br />
Farrell et al. [109] plotted the difference in bLa<br />
between two consecutive stages against work intensity<br />
and determined the first rise of this relationship<br />
(onset of plasma lactate accumulation).<br />
4.1.2 Anaerobic <strong>Lactate</strong> Thresholds<br />
All <strong>threshold</strong> <strong>concepts</strong> that were assigned either<br />
to the MLSS or to a rapid/distinct change in<br />
the inclination of the blood lactate curve were<br />
categorized as LT An (table II).<br />
Originally, the LT4 was established because it<br />
seemed to be the highest bLa that was sustainable<br />
for a longer duration and, therefore, was regarded<br />
as the upper border for constant load endurance<br />
training. [24] It was soon recognized that a fixed<br />
bLa does not take into account considerable<br />
interindividual differences and that LT4 may frequently<br />
underestimate (particularly in anaerobically<br />
trained subjects) or overestimate (in<br />
aerobically trained athletes) real endurance capacity.<br />
[88,96,97,146] Therefore, several so-called ‘individualized’<br />
LT <strong>concepts</strong> were developed. For<br />
instance, Keul et al. [96] and Simon et al. [97] determined<br />
the individual anaerobic <strong>threshold</strong> (IAT)<br />
at a certain inclination of the lactate curve (tangent<br />
of 51° and 45°, respectively). However, it<br />
seems questionable whether the use of a fixed inclination<br />
may reflect individual lactate kinetics<br />
better than a fixed bLa.<br />
Stegmann et al. [88] developed a more complicated<br />
model that is based on the exercise lactate<br />
curve as well as on the lactate course during the<br />
early recovery period. This model is based on<br />
several assumptions regarding lactate distribution<br />
in blood and muscle compartments, lactate<br />
diffusion through biological membranes and<br />
lactate elimination. However, some of these premises<br />
have been challenged. [8,147]<br />
Berg et al. [137] defined the LT An as the intersection<br />
point between the tangent at the minimum<br />
lactate equivalent and the linear function<br />
ª 2009 Adis Data Information BV. All rights reserved. Sports Med 2009; 39 (6)
Validity of <strong>Lactate</strong> Thresholds 477<br />
for the final 90 seconds of GXT. Similarly, Bunc<br />
et al. [143] determined the LT An as the intersection<br />
between the exponential regression of the lactate<br />
curve and the bisector of the tangents on the upper<br />
and lower parts of the regression. A comparable<br />
model was established by Cheng et al. [54] and<br />
called the D max method. Those authors determined<br />
the maximal perpendicular distance of the<br />
lactate curve from the line connecting the start<br />
with the endpoint of the lactate curve. It is obvious<br />
that these <strong>threshold</strong> models are dependent<br />
on the start intensity as well as the maximal effort<br />
spent by the subjects. To eliminate the influence<br />
of the start point of the GXT, Bishop et al. [140]<br />
connected the LT Aer with the endpoint of the<br />
lactate curve and observed that this modified<br />
D max <strong>threshold</strong> (D mod ) was also highly correlated<br />
with performance during a 1-hour time trial in 24<br />
female cyclists.<br />
Tegtbur et al. [145] developed the so-called lactate<br />
minimum test. This test starts with a short<br />
supramaximal exercise leading to high bLa. A<br />
short rest period (about 8 minutes) [145] should<br />
allow for an equilibrium between muscle and<br />
bLa. Immediately after this rest period, a standard<br />
incremental exercise test is conducted. After<br />
an initial fall of bLa at low exercise intensities,<br />
bLa begins to rise again. The lowest point of the<br />
lactate curve, the lactate minimum speed (LMS),<br />
is assumed to mark the LT An . This procedure has<br />
recently been criticized because standardization<br />
is difficult. [112,148] For instance, the induced acidosis<br />
prior to the incremental test is unlikely to be<br />
uniform for different subjects. Additionally, initial<br />
intensity as well as stage increment and duration<br />
seem to affect LMS. Furthermore, supramaximal<br />
exercise might be contraindicated in some instances,<br />
for example in cardiac patients or in athletes<br />
at some time points during their training.<br />
Baldari and Guidetti [144] defined the IAT as<br />
the workload corresponding to the second lactate<br />
increase of at least 0.5 mmol/L with the second<br />
increase greater than or equal to the first one. A<br />
limitation to this approach is that only discrete<br />
stages according to the test protocol can be<br />
identified as <strong>threshold</strong> workload. Additionally,<br />
those authors determined the IAT by plotting<br />
each lactate value against the preceding workload.<br />
This was claimed to be done because during<br />
3-minute stages no steady-state lactate level could<br />
be reached [147] and, therefore, it was hypothesized<br />
that a lactate value at a given 3-minute stage<br />
would represent the realistic value of the previous<br />
stage.<br />
From empirical observations, the work group<br />
of Dickhuth et al. [36,135,136] estimated the IAT<br />
at a blood lactate concentration 1.5 mmol/L<br />
above the minimum lactate equivalent (i.e. above<br />
LT Aer ). Finally, the lactate turnpoint (LTP)<br />
has been defined as the final running velocity<br />
before the observation of a sudden and sustained<br />
increase in bLa between LT Aer and<br />
V O 2max . [103]<br />
Reproducibility of the velocity or power output<br />
at LTs has been reported to be high (r > 0.9,<br />
independent of whether LT fix , LT Aer or LT An<br />
were analysed). [52,149-152] For V O 2 at LTs, reliability<br />
coefficients seem to be slightly lower<br />
(r = 0.8–0.9). [150,152,153]<br />
4.2 <strong>Lactate</strong> Thresholds and (Simulated)<br />
Competition Results<br />
Thirty-eight studies were located that compared<br />
LT values with performance in endurance<br />
events or simulated competitions. Six studies<br />
were excluded from the analysis. Three of these<br />
studies compared an LT obtained during cycling<br />
exercise with running performance, [110,154,155]<br />
two studies only reported LT as a fraction of<br />
V O 2max , [11,156] and one study reported correlations<br />
with time-to-exhaustion in an open-end interval<br />
programme. [157] A total of 32 studies were thus<br />
included in this analysis.<br />
Eighteen studies evaluated the correlation of<br />
the work intensity (running velocity or V O 2 )at<br />
various LTs with performance in running competitions<br />
of different distances (800 m up to marathon;<br />
table III). [108,109,112,123,124,129-132,134,135,158-164]<br />
Competition distances from 0.8 to 3.2 km, from<br />
5 km to 16.1 km and from 21.1 to 42.2 km were<br />
subsumed as correlates of short-, middle- and<br />
long-distance endurance events. The main result<br />
was that nearly all studies reported high correlation<br />
coefficients with (simulated) competition<br />
results. These results were confirmed by Weltman<br />
ª 2009 Adis Data Information BV. All rights reserved. Sports Med 2009; 39 (6)
478 Faude et al.<br />
0.79 [123]<br />
0.88 [135]<br />
0.90 [159]<br />
0.91 [135]<br />
0.76 [161]<br />
Table III. Correlation coefficients between lactate <strong>threshold</strong>s and running performance over various distances<br />
Threshold concept 0.8–3.2 km 5 km–16.1 km 19.3–42.2 km<br />
v V O 2<br />
v V O 2<br />
v V O 2<br />
LT fix 0.82 [135]<br />
0.88 [131] 0.94 [163]<br />
0.85 [131]<br />
0.69 [131] 0.95 [163]<br />
0.93 [158]<br />
0.60 [132]<br />
0.94 [159]<br />
0.74 [163] 0.91 [163]<br />
0.88 [123]<br />
0.86 [123]<br />
0.85 [123]<br />
0.87 [134]<br />
0.85 [134]<br />
0.84 [134]<br />
0.78 [132]<br />
0.75 [123]<br />
0.75 [123]<br />
0.72 [134]<br />
0.74 [134]<br />
0.75 [134]<br />
0.73 [158]<br />
0.51 [131]<br />
0.91 [135]<br />
0.91 [159]<br />
0.93 [159]<br />
0.91 [159]<br />
0.84 [159]<br />
0.91 [159]<br />
0.83 [160]<br />
0.92 [159]<br />
0.92 [159]<br />
0.83 [159]<br />
0.88 [159]<br />
0.93 [159]<br />
0.86 [163]<br />
0.81 [135]<br />
0.98 [124]<br />
0.98 [124]<br />
0.98 [124]<br />
0.68 [129]<br />
0.96 [108]<br />
0.92 [163] 0.83 [163]<br />
0.73 [163]<br />
0.68 [131]<br />
0.55 [131]<br />
0.81 [112]<br />
Median (min–max) 0.85 (0.68–0.93) 0.73 (0.51–0.79) 0.91 (0.81–0.95) 0.89 (0.74–0.93) 0.92 (0.68–0.98) 0.76 (0.73–0.83)<br />
LT Aer 0.74 [135]<br />
0.85 [123]<br />
0.70 [134]<br />
0.93 [158]<br />
0.77 [132]<br />
0.43 [131]<br />
0.65 [131]<br />
0.70 [131]<br />
0.91 [109] 0.77 [123]<br />
0.61 [134]<br />
0.84 [158]<br />
0.69 [132]<br />
0.77 [131]<br />
0.66 [131]<br />
0.64 [131]<br />
0.85 [109]<br />
0.62 [162]<br />
0.66 [162]<br />
0.58 [162] 0.73 [135]<br />
0.79 [135]<br />
0.78 [160]<br />
0.96 [109]<br />
0.97 [109]<br />
0.79 [130]<br />
0.83 [130]<br />
0.79 [130]<br />
0.84 [130]<br />
0.83 [130]<br />
0.81 [130]<br />
0.93 [112]<br />
0.94 [163]<br />
0.92 [163]<br />
0.92 [163]<br />
0.89 [163]<br />
0.87 [163]<br />
0.85 [163] 0.89 [109]<br />
0.91 [109]<br />
0.84 [162]<br />
0.83 [162]<br />
0.79 [162]<br />
0.69 [162]<br />
0.92 [162]<br />
0.79 [162]<br />
0.76 [130]<br />
0.77 [130]<br />
0.84 [130]<br />
0.81 [130]<br />
0.82 [130]<br />
0.88 [130]<br />
0.72 [163]<br />
0.56 [163]<br />
0.66 [163]<br />
0.52 [163]<br />
0.81 [163]<br />
0.69 [163] 0.76 [135]<br />
0.81 [135]<br />
0.78 [129]<br />
0.97 [109]<br />
0.98 [109]<br />
0.90 [163]<br />
0.91 [163]<br />
0.87 [163]<br />
0.86 [163]<br />
0.83 [163]<br />
0.77 [163] 0.91 [109]<br />
0.89 [109]<br />
0.69 [163]<br />
0.52 [163]<br />
0.66 [163]<br />
0.42 [163]<br />
0.80 [163]<br />
0.65 [163]<br />
Median (min–max) 0.74 (0.43–0.93) 0.66 (0.58–0.85) 0.84 (0.73–0.97) 0.79 (0.45–0.92) 0.86 (0.76–0.98) 0.68 (0.42–0.91)<br />
LT An 0.88 [135] 0.91 [135]<br />
0.92 [135]<br />
0.86 [160]<br />
0.83 [112]<br />
0.93 [163]<br />
0.91 [163]<br />
0.94 [163]<br />
0.90 [163]<br />
0.76 [164]<br />
0.73 [164] 0.83 [163]<br />
0.70 [163]<br />
0.81 [163]<br />
0.66 [163]<br />
0.45 [164]<br />
0.45 [164] 0.93 [135]<br />
0.93 [135]<br />
0.90 [163]<br />
0.91 [163]<br />
0.90 [163]<br />
0.89 [163] 0.68 [161]<br />
0.83 [163]<br />
0.71 [163]<br />
0.81 [163]<br />
0.67 [163]<br />
Median (min–max) 0.88 0.91 (0.83–0.94) 0.76 (0.66–0.83) 0.91 (0.89–0.93) 0.71 (0.67–0.83)<br />
LT fix = fixed lactate <strong>threshold</strong>; LT Aer = aerobic <strong>threshold</strong>; LT An = anaerobic <strong>threshold</strong>; v = velocity; V O 2 = oxygen uptake.<br />
et al., [123,134] who cross-validated the obtained<br />
regression equations and found high correlation<br />
coefficients between actual and predicted scores.<br />
There is a tendency for higher correlations with<br />
longer endurance events (0.43–0.93 in short-term<br />
events vs 0.68–0.98 over the long-distance<br />
competitions). Additionally, correlations tended<br />
to be higher for LT fix and LT An compared with<br />
LT Aer . This might be due to the average intensity<br />
in running events being higher than the intensity<br />
ª 2009 Adis Data Information BV. All rights reserved. Sports Med 2009; 39 (6)
Validity of <strong>Lactate</strong> Thresholds 479<br />
corresponding to the first increase in bLa. In total,<br />
the results of the analysed studies point to a<br />
common variance of LTs and competition results<br />
in running events between 55% and 85%.<br />
In cycling, a total of eight studies evaluated the<br />
relationship between LTs and (simulated) cycling<br />
time trial performance (table IV). [12,89,140,141,165-168]<br />
Only one study analysed the correlation with<br />
short-duration time trial performance (4000 m<br />
individual pursuit) and found a high correlation<br />
coefficient of r = 0.86 in 18 male high-performance<br />
track cyclists. [167] Four studies evaluated distances<br />
between 13.5 and 20 km or time trial durations<br />
between 20 and 30 minutes. [89,165,166,168] The<br />
correlation coefficients in these studies were in<br />
most cases higher (between 0.8 and 0.9) than for<br />
the longer time trials (40 km or 60–90 minutes,<br />
r ~ 0.7). [140,141,165] Overall, the results of these<br />
studies were more heterogeneous. Correlation<br />
coefficients between LTs and (simulated) competition<br />
performance varied between r = 0.23 [165]<br />
and r = 0.93. [89] In total, the results of the analysed<br />
studies point to a common variance of LTs<br />
and competition results between 35% and 85% in<br />
cycling events. However, the low number of studies<br />
and the heterogeneous results point to the<br />
need for further carefully designed studies to<br />
arrive at more comprehensive conclusions with<br />
regard to the relationship of LTs and time trial<br />
performance in cycling.<br />
Two studies were found that analysed the relationship<br />
of LT markers with mountain bike<br />
cross-country race performance. [169,170] Such<br />
races are usually conducted on a graded terrain<br />
with considerable time spent ascending and descending.<br />
Impellizzeri et al. [170] observed high<br />
correlations between LT Aer as well as OBLA and<br />
race time during a 31 km mountain bike race.<br />
Whereas correlations were about 0.7 when LT<br />
was expressed in absolute terms, correlations<br />
became considerably higher (~0.9) when power<br />
output at LT was expressed relative to body<br />
mass. Similarly, Gregory et al. [169] reported<br />
higher correlations between LT Aer and a crosscountry<br />
time trial in 11 male mountain bikers<br />
when LT Aer was expressed as related to body<br />
mass (r ~ 0.5 in absolute terms vs r ~ 0.8 relative to<br />
body mass). This finding can be explained with<br />
the considerable influence of bodyweight and<br />
body composition on performance capacity in<br />
cyclists during ascents. [171-173]<br />
In addition to the studies in running and<br />
cycling, another four studies were detected<br />
that evaluated LTs and (simulated) competition<br />
Table IV. Correlation coefficients between lactate <strong>threshold</strong>s and cycling time trial events over various distances and times<br />
Threshold concept 4 km 13.5–20 km; 20–30 min 40 km; 60–90 min<br />
PO V O 2<br />
PO V O 2<br />
PO V O 2<br />
0.54 [165]<br />
LT fix 0.23 [165]<br />
0.90 [166] 0.81 [140]<br />
0.82 [166]<br />
0.60 [141]<br />
0.91 [165]<br />
0.93 [12]<br />
Median (min–max) 0.82 (0.23–0.90) 0.60 (0.54–0.81)<br />
LT Aer 0.86 [167] 0.67 [165]<br />
0.88 [168] 0.65 [140]<br />
0.88 [166]<br />
0.86 [166]<br />
0.91 [168]<br />
0.59 [141]<br />
0.61 [140]<br />
0.69 [140]<br />
Median (min–max) 0.86 0.88 (0.67–0.91) 0.65 (0.59–0.91) 0.93<br />
LT An 0.45 [165]<br />
0.89 [166]<br />
0.91 [166]<br />
0.93 [89] 0.77 [165]<br />
0.58 [141]<br />
0.52 [141]<br />
0.72 [141]<br />
0.84 [140]<br />
0.83 [140]<br />
Median (min–max) 0.90 (0.45–0.93) 0.75 (0.52–0.84)<br />
LT Aer = aerobic <strong>threshold</strong>; LT An = anaerobic <strong>threshold</strong>; LT fix = fixed lactate <strong>threshold</strong>; PO = power output; V O 2 = oxygen uptake.<br />
ª 2009 Adis Data Information BV. All rights reserved. Sports Med 2009; 39 (6)
480 Faude et al.<br />
However, an overview of those studies is beyond the<br />
performance. Two of these studies analysed competitive<br />
or from gas exchange measurements. [183-189] or 0.2 m/s, respectively, above the LMS. Those<br />
race walkers. Yoshida et al. [174] found<br />
correlation coefficients for OBLA as well as for<br />
LT Aer of 0.94 and 0.85, respectively, with walking<br />
pace during a 5 km road race in eight female race<br />
walkers. Similar results were observed by Hagberg<br />
scope of the present review.<br />
There are several studies that examined the<br />
metabolic responses during steady-state exercise<br />
intensities related to LTs but did not analyse exercise<br />
intensities slightly above or below. Schnabel<br />
and Coyle [111] in a heterogeneous group of race et al. [190] observed average steady-state lactate<br />
walkers with correlation coefficients of 0.94 and<br />
0.82 for velocity and oxygen uptake at LT Aer in<br />
a 20 km race walking performance.<br />
concentrations (~4.5 mmol/L) during 50-minute<br />
runs at the IAT according to Stegmann et al. [88]<br />
However, no other intensity was analysed in this<br />
Two studies dealt with rowing performance investigation. Stegmann and Kindermann [146]<br />
and LTs. Whereas Ingham et al. [175] observed high<br />
correlations (r = 0.86–0.92) between work rate at<br />
compared 50-minute cycling exercise in 19 subjects<br />
at the IAT as well as at LT4 and found steady-state<br />
fixed and aerobic LTs and 2000 m ergometer lactate levels (~4 mmol/L) during IAT trials,<br />
performance in 41 rowers of different categories, whereas exercise at LT4 resulted in continuously<br />
Cosgrove et al. [176] found considerably lower rising bLa (up to 9.6 mmol/L) and a premature<br />
correlations (r = 0.39–0.73) in 13 male rowers.<br />
To summarize, the overwhelming majority of<br />
published studies on the relationship between<br />
LTs and endurance performance showed strong<br />
correlations, particularly for running events. This<br />
supports findings of earlier training studies that<br />
found training-induced improvements in competitive<br />
performance significantly correlated with<br />
improvements in LTs. [130,162] Although it seems<br />
likely that other influences such as central nervous<br />
system processes may have regulatory and<br />
cessation. This is in line with findings of Oyono-<br />
Enguelle et al., [191] who similarly reported no lactate<br />
steady state in three out of five subjects during<br />
exercise at LT4. In contrast, Loat and Rhodes [189]<br />
found continuously increasing bLa (on average<br />
from 3.4 mmol/L after 15 minutes to 4.6 mmol/L<br />
after 45 minutes) and premature fatigue during<br />
60-minute constant load trials at the IAT. However,<br />
those authors did not use the originally described<br />
test protocol and Heck [50] has shown that IAT<br />
determination is dependent on the protocol used.<br />
decisive characteristics in endurance events as it Baldari and Guidetti [144] compared steadystate<br />
was recently claimed, [177] peripheral metabolic<br />
adaptations highly related to the LT [46] seem to<br />
be a necessary and important prerequisite for<br />
aerobic endurance performance.<br />
running at their IAT determined when lactate<br />
values were plotted against the corresponding<br />
exercise intensity (IAT m ) and against the preceding<br />
intensity (IAT a ) and found steady-state<br />
lactate levels for IAT a (~4 mmol/L -1 ) but not for<br />
IAT m . However, due to the determination procedure,<br />
the difference between both <strong>threshold</strong>s<br />
4.3 <strong>Lactate</strong> Thresholds and Maximal <strong>Lactate</strong><br />
Steady State<br />
was exactly one stage increment and no other<br />
intensities in between were evaluated. Ribeiro<br />
MLSS determination has become very popular<br />
in performance diagnosis in several endurance<br />
sports. Thus, numerous studies have dealt with<br />
the problem of an adequate estimation of MLSS<br />
during one single laboratory visit. For instance,<br />
some authors tried to estimate MLSS from<br />
performance during all-out time trials (5 km or<br />
40 km) [114,178] from physiological strain (bLa, heart<br />
rate, ratings of perceived exertion) during standardized<br />
sub-maximal constant-load exercise [179-182]<br />
et al. [192] assessed a 40-minute steady-state cycling<br />
exercise at LT Aer , between LT Aer and LT An<br />
(LTP), at LT An as well as between LT An and maximum.<br />
Those authors found on average steadystate<br />
lactate levels up to LT An (~5 mmol/L -1 ),<br />
whereas at the highest intensity, bLa increased<br />
continuously and exercise had to be terminated<br />
prematurely.<br />
Bacon and Kern [193] and Tegtbur et al. [145]<br />
compared constant load trials at LMS and 5%<br />
ª 2009 Adis Data Information BV. All rights reserved. Sports Med 2009; 39 (6)
Validity of <strong>Lactate</strong> Thresholds 481<br />
authors found that LMS intensity but not the<br />
higher intensity on average resulted in a lactate<br />
steady state. However, in the study of Bacon and<br />
Kern, [193] the average blood lactate increase between<br />
minutes 12 and 28 during the constant load<br />
trial at the LMS +5% intensity was 1.2 mmol/L,<br />
and in four out of ten subjects a lactate steady<br />
state according to the recommended criterion<br />
[72,115] was present.<br />
A total of 11 studies evaluated the relationship<br />
between one or more LT <strong>concepts</strong> and MLSS<br />
using the recommended procedure, including<br />
several constant load trials of at least 30 minutes’<br />
duration to determine the MLSS (table V). One<br />
study determined MLSS with 20-minute constant<br />
load trials. [113]<br />
Most researchers analysed the relationship of<br />
LT4 with MLSS. [49,72,90,92,112,117] For instance,<br />
Heck and colleagues [49,50,72] found strong correlations<br />
between LT4 and MLSS during running<br />
as well as during cycling exercise. However, the<br />
fitness level of their subjects was quite heterogeneous<br />
and, therefore, the high correlations to<br />
some extent might be spurious. Additionally,<br />
they observed that the velocity at LT4 was higher<br />
than MLSS velocity when stage duration during<br />
the GXT was 3 minutes, whereas this was not<br />
the case with 5-minute stages. Therefore, these<br />
authors concluded that LT4 gives a valuable<br />
estimate of the MLSS when stage duration is<br />
at least 5 minutes. Also, Jones and Doust [112]<br />
found a high correlation between LT4 and the<br />
MLSS in a homogenous group of trained runners<br />
with LT4 being higher than MLSS (3-minute<br />
stages). Lower correlations were found by<br />
van Schuylenbergh et al. [92] in elite cyclists as<br />
well as by Beneke [117] in a homogenous group<br />
of rowers. Also, LT4 and MLSS did not differ<br />
significantly with 6-minute stages, [92] whereas<br />
LT4 was considerably higher than MLSS with<br />
3-minute stages. [117] Lajoie et al. [90] evaluated<br />
whether the intensity corresponding to 4 mmol/L<br />
lactate during a GXT with 8-minute stages and<br />
30 W increments is appropriate to estimate the<br />
MLSS in nine cyclists. Average power output at<br />
MLSS and LT4 was not significantly different.<br />
However, because bLa at MLSS differed considerably<br />
between subjects, the authors concluded<br />
that it is unrealistic to rely on a blood lactate<br />
value of 4 mmol/L as a universal criterion for<br />
MLSS. Unfortunately, a more detailed analysis<br />
regarding the correlation or individual differences<br />
between LT4 and MLSS was not reported.<br />
Heck et al. [49,50] observed high correlations<br />
between MLSS and the IAT according to<br />
Stegmann et al. [88] In addition, running velocity<br />
was not significantly different between IAT<br />
and MLSS independent of stage duration (3 or<br />
5 minutes), whereas in cycling IAT was about<br />
8% higher than MLSS. Urhausen et al. [86] found<br />
in runners as well as in cyclists that constant load<br />
trials at IAT resulted on average in a lactate<br />
steady state, whereas a 5% higher intensity led to<br />
a continuous rise in bLa. Similarly, McLellan and<br />
Jacobs [91] arrived at the conclusion that the IAT<br />
is a valid estimate for the MLSS in most subjects,<br />
although there exists a considerable difference in<br />
a few cases. Unfortunately, these studies reported<br />
no measure of correlation between IAT and<br />
MLSS or no quantitative data on individual differences<br />
between IAT and MLSS. In contrast to<br />
the previously mentioned studies, Beneke [117]<br />
found the IAT to be considerably higher than<br />
MLSS in nine rowers. Additionally, the correlation<br />
in this study was lower than was observed<br />
by Heck et al. [49] This finding might be due to<br />
the more homogenous performance level of the<br />
rowers as well as to the slow increment in the<br />
chosen test protocol. [50]<br />
Heck et al. [49] and Heck [50] found high correlations<br />
between the IAT according to Keul<br />
et al. [96] and Bunc et al. [143] and the MLSS in running<br />
and cycling. However, the high correlations<br />
might be partly accounted for by the heterogenous<br />
endurance level of the subjects. Furthermore,<br />
both <strong>threshold</strong>s were dependent on the test<br />
protocol during the running tests (3-minute vs<br />
5-minute stages).<br />
The LMS was evaluated in two studies. [89,112]<br />
The results of these studies were contradictory.<br />
Jones and Doust [112] found only a low correlation<br />
between LMS and MLSS. Additionally, LMS<br />
was considerably lower than MLSS. In contrast,<br />
LMS was not significantly different from<br />
MLSS in the study of MacIntosh et al. [89] These<br />
contrasting observations might have been due to<br />
ª 2009 Adis Data Information BV. All rights reserved. Sports Med 2009; 39 (6)
482 Faude et al.<br />
Table V. Comparison of lactate <strong>threshold</strong> <strong>concepts</strong> with MLSS determined by several constant load trials of different intensity<br />
Threshold concept Subjects Main outcome Reference<br />
LT4, OBLA<br />
16 healthy<br />
males<br />
(running)<br />
High correlation between LT4 and MLSS (r = 0.98)<br />
LT4 on average 0.12 m/s higher than MLSS with 3 min stages but not<br />
with 5 min stages during GXT<br />
Heterogenous endurance level<br />
Heck et al. [49,72]<br />
IAT (Stegmann et al. [88] )<br />
IAT (Keul et al. [96] )<br />
22 healthy<br />
subjects<br />
(cycling)<br />
8 trained male<br />
runners<br />
Significant correlation between LT4 and MLSS (r = 0.92)<br />
LT4 on average 19.9 W higher than MLSS<br />
Heterogenous endurance level, slow increase in power output<br />
(+6W/min)<br />
High correlation (r = 0.93) between OBLA and MLSS<br />
OBLA on average 0.4 km/h higher than MLSS<br />
21 elite cyclists Low correlation (r = 0.71) between LT4 and MLSS<br />
No significant difference between LT4 and MLSS (MLSS 15 W higher)<br />
Homogenous endurance level<br />
9 male rowers Significant correlation (r = 0.82) between LT4 and MLSS<br />
LT4 significantly higher (32 W) than MLSS<br />
Homogenous endurance level<br />
10 well trained<br />
cyclists<br />
16 healthy<br />
males<br />
(running)<br />
22 healthy<br />
subjects<br />
(cycling)<br />
16 trained<br />
cyclists<br />
14 trained<br />
runners<br />
11 males<br />
(cycling)<br />
Average power output at LT4 and MLSS was not significantly different<br />
(282 W vs 277 W)<br />
Strong MLSS criterion (
Validity of <strong>Lactate</strong> Thresholds 483<br />
Table V. Contd<br />
Threshold concept Subjects Main outcome Reference<br />
IAT (Bunc et al. [143] ) 16 healthy<br />
males<br />
(running)<br />
High correlation between IAT and MLSS (r = 0.98–0.99)<br />
IAT velocity on average considerably higher than MLSS for 3-min<br />
(+0.31 m/s) as well as 5 min stages (+0.14 m/s) during GXT<br />
Heterogenous endurance level of subjects<br />
Heck et al. [49]<br />
LMS<br />
22 healthy<br />
subjects<br />
(cycling)<br />
10 trained male<br />
runners<br />
14 cyclists or<br />
triathletes<br />
Significant correlation between IAT and MLSS (r = 0.89)<br />
IAT on average 71.5 W higher than MLSS<br />
Heterogenous endurance level, slow increase in power output<br />
(+6W/min)<br />
Low correlation (r = 0.61) between LMS and MLSS<br />
LMS on average 0.8 km/h lower than MLSS<br />
LMS on average not different from MLSS<br />
No good estimate of MLSS by LMS in three subjects<br />
MLSS criterion:
484 Faude et al.<br />
Table VI. Mean bias (difference maximal lactate steady state [MLSS]-LT) and 95% limits of agreement (LoA) for four different lactate<br />
<strong>threshold</strong> <strong>concepts</strong> during treadmill (n = 16) and cycle ergometry (n = 22). Results calculated from raw data reported by Heck et al. [49,50,72] (with<br />
permission)<br />
<strong>Lactate</strong> <strong>threshold</strong> concept<br />
Treadmill ergometry<br />
3 min stages, +0.4 m/s<br />
mean bias<br />
(m/s)<br />
LoA<br />
(m/s)<br />
LoA<br />
(%)<br />
Treadmill ergometry<br />
5 min stages, +0.4 m/s<br />
mean bias<br />
(m/s)<br />
LoA<br />
(m/s)<br />
LoA<br />
(%)<br />
Cycle ergometry<br />
2 min stages, +25 W<br />
mean bias<br />
(W)<br />
LT4 -0.13 –0.35 –8 0.02 –0.39 –9 -19.8 –28.4 –14<br />
IAT (Keul et al. [96] ) -0.20 –0.39 –9 0.06 –0.35 –8 -21.0 –22.4 –11<br />
IAT (Stegmann et al. [88] ) -0.03 –0.51 –12 -0.03 –0.37 –9 -15.0 –35.0 –18<br />
IAT (Bunc et al. [143] ) -0.33 –0.33 –8 -0.14 –0.37 –9 -71.4 –52.8 –27<br />
IAT = individual anaerobic <strong>threshold</strong>; LT4 = 4 mmol/L <strong>threshold</strong>.<br />
LoA<br />
(W)<br />
LoA<br />
(%)<br />
view it would be of interest to know the absolute<br />
variability of individual differences between the<br />
LT and MLSS. An appropriate means to report<br />
this variability may be the mean bias and the 95%<br />
LoA as it was described by Bland and Altman.<br />
[194] There is only one study available that<br />
applied this procedure. [103] Such a procedure<br />
would also allow for assessing heteroscedasticity<br />
(i.e. whether the differences depend on the magnitude<br />
of the mean or – in this case – endurance<br />
capacity). [195]<br />
Table VI shows an example calculation of the<br />
mean bias and the 95% LoA for four different LT<br />
<strong>concepts</strong> from raw data reported by Heck et<br />
al. [49,50,72] These data show a mean bias between<br />
0.5% and 8%, with LoA of about 10% in a running<br />
exercise. This means that for each new<br />
subject within the study population it could be<br />
expected (with a 95% probability) that the difference<br />
between MLSS and the respective LT is<br />
within these LoA. [195] For the cycling exercise the<br />
results are more heterogenous with greater mean<br />
bias and LoA. However, due to the limited data<br />
points these observations are preliminary and<br />
should be confirmed by further research.<br />
5. Conclusions and Perspectives<br />
In conclusion, it can be stated that a huge<br />
amount of evidence exists that LT <strong>concepts</strong> are of<br />
considerable importance for the diagnosis as well<br />
as the prediction of aerobic endurance performance.<br />
The concept of the aerobic-anaerobic<br />
transition may serve as a reasonable means for<br />
performance diagnosis and intensity prescription<br />
in endurance sports. However, there are several<br />
open questions that should be appropriately<br />
addressed by future research. These are:<br />
Whereas the relationship of LTs with competition<br />
performance is well established in running<br />
events and less strongly in cycling, there is lack<br />
of evidence for most other endurance sports.<br />
Scientific studies comparing LTs with MLSS<br />
are rare and the results are partially conflicting.<br />
This might be due to different methodological<br />
approaches. It is suggested that the<br />
MLSS be assessed by the established procedure<br />
using several constant load trials with<br />
different intensities [72,115] and that the MLSS<br />
be compared with a chosen LT. To do so,<br />
measures of absolute agreement between LTs<br />
and MLSS should be reported according<br />
to the method introduced by Bland and<br />
Altman. [194]<br />
In this context, it is important to know the basic<br />
variability and reproducibility of the MLSS. Up<br />
to now, no scientific data addressing this question<br />
exist. Therefore, it is recommended to evaluate<br />
the variability of MLSS in future research.<br />
Of note, this may enable an evaluation of the<br />
differences between LT and MLSS compared<br />
with the basic variability of the MLSS and,<br />
thus, give more detailed information on the<br />
quality of the MLSS estimate.<br />
Although there has been much and controversial<br />
debate on the LT phenomenon during<br />
the last three decades, many scientific studies<br />
have dealt with LT <strong>concepts</strong>, their value in as-<br />
ª 2009 Adis Data Information BV. All rights reserved. Sports Med 2009; 39 (6)
Validity of <strong>Lactate</strong> Thresholds 485<br />
sessing endurance performance or in prescribing<br />
exercise intensities in endurance training. It might<br />
be speculated that a considerable part of the debate<br />
has to be attributed to the misinterpretation<br />
of the physiological basis of the phenomenon.<br />
The presented framework may help to clarify the<br />
controversy and may give a rational basis for<br />
performance diagnosis and training prescriptions<br />
in future research as well as in sports practice.<br />
Acknowledgements<br />
No sources of funding were used to assist in the preparation<br />
of this review. The authors have no conflicts of interest<br />
that are relevant to the content of this manuscript.<br />
References<br />
1. Gladden LB. <strong>Lactate</strong> metabolism: a new paradigm for the<br />
third millennium. J Physiol 2004 Jul 1; 558 (Pt 1): 5-30<br />
2. Fletcher WM, Hopkins FG. Lactic acid in amphibian<br />
muscle. J Physiol (London) 1907; 35: 247-309<br />
3. Meyerhof O. Untersuchung u¨ ber die Wa¨ rmestro¨ mung der<br />
vitalen Oxydationsvorga¨ nge. Biochem Z 1911; 5: 246-328<br />
4. Douglas CG, Haldane JS. The regulation of normal<br />
breathing. J Physiol 1909; 38: 420-40<br />
5. Ryffel GH. Lactic acid metabolism: a critical review. Quart<br />
J Med 1910; 3: 221-3<br />
6. Hill AV, Lupton H. Muscular exercise, lactic acid and the<br />
supply and utilization of oxygen. Quart J Med 1923; 16:<br />
135-71<br />
7. Margaria R, Edwards HT, Dill DB. The possible mechanism<br />
of contracting and paying the oxygen debt and the<br />
role of lactic acid in muscular contraction. Am J Physiol<br />
1933; 106: 689-714<br />
8. Gladden LB. Muscle as a consumer of lactate. Med Sci<br />
Sports Exerc 2000 Apr; 32 (4): 764-71<br />
9. Brooks GA. The lactate shuttle during exercise and<br />
recovery. Med Sci Sports Exerc 1986 Jun; 18 (3): 360-8<br />
10. Robergs RA, Ghiasvand F, Parker D. Biochemistry of<br />
exercise-induced metabolic acidosis. Am J Physiol Regul<br />
Integr Comp Physiol 2004 Sep; 287 (3): R502-16<br />
11. Coyle EF, Coggan AR, Hopper MK, et al. Determinants of<br />
endurance in well-trained cyclists. J Appl Physiol 1988;<br />
64 (6): 2622-30<br />
12. Coyle EF, Feltner ME, Kautz SA, et al. Physiological and<br />
biomechanical factors associated with elite endurance<br />
cycling performance. Med Sci Sports Exerc 1991 Jan;<br />
23 (1): 93-107<br />
13. Lucı´ a A, Pardo J, Dura´ ntez A, et al. Physiological differences<br />
between professional and elite road cyclists. Int J<br />
Sports Med 1998; 19: 342-8<br />
14. Impellizzeri FM, Marcora SM, Rampinini E, et al. Correlations<br />
between physiological variables and performance<br />
in high level cross-country off-road cyclists. Br J Sports<br />
Med 2005 Oct; 39 (10): 747-51<br />
15. Sjodin B, Svedenhag J. Applied physiology of marathon<br />
running. Sports Med 1985 Mar-Apr; 2 (2): 83-99<br />
16. Faria EW, Parker DL, Faria IE. The science of cycling:<br />
physiology and training, part 1. Sports Med 2005; 35 (4):<br />
285-312<br />
17. Jacobs I. Blood lactate: implications for training and sports<br />
performance. Sports Med 1986; 3 (1): 10-25<br />
18. Conley DL, Krahenbuhl GS. Running economy and distance<br />
running performance of highly trained athletes.<br />
Med Sci Sports Exerc 1980; 12 (5): 357-60<br />
19. Hollmann W. 42 years ago: development of the <strong>concepts</strong> of<br />
ventilatory and lactate <strong>threshold</strong>. Sports Med 2001; 31 (5):<br />
315-20<br />
20. Meyer T, Scharhag J, Kindermann W. Peak oxygen uptake:<br />
myth and truth about an internationally accepted<br />
reference value. Z Kardiol 2005 Apr; 94 (4): 255-64<br />
21. Hollmann W. Ho¨ chst- und dauerleistungsfa¨ higkeit des<br />
sportlers. Mu¨ nchen: Barth, 1963<br />
22. Wasserman K, McIlroy MB. Detecting the <strong>threshold</strong> of<br />
anaerobic metabolism in cardiac patients. Am J Cardiol<br />
1964; 14: 844-52<br />
23. Wells JG, Balke B, Van Fossan DD. Lactic acid accumulation<br />
during work: a suggested standardization of work<br />
classification. J Appl Physiol 1957 Jan; 10 (1): 51-55<br />
24. Mader A, Liesen H, Heck H, et al. Zur Beurteilung der<br />
sportartspezifischen ausdauerleistungsfa¨ higkeit im labor.<br />
Sportarzt Sportmed 1976; 27: 80-8, 109-12<br />
25. Atkinson G, Davison R, Jeukendrup A, et al. Science and<br />
cycling: current knowledge and future directions for research.<br />
J Sports Sci 2003 Sep; 21 (9): 767-87<br />
26. Jones AM. The physiology of the world record holder for<br />
the women´ s marathon. Int J Sports Sci Coaching 2006;<br />
1 (2): 101-16<br />
27. Svedahl K, MacIntosh BR. Anaerobic <strong>threshold</strong>: the concept<br />
and methods of measurement. Can J Appl Physiol<br />
2003 Apr; 28 (2): 299-323<br />
28. Brooks GA. Anaerobic <strong>threshold</strong>: review of the concept<br />
and directions for future research. Med Sci Sports Exerc<br />
1985; 17 (1): 22-34<br />
29. Myers J, Ashley E. Dangerous curves: a perspective on<br />
exercise, lactate, and the anaerobic <strong>threshold</strong>. Chest 1997<br />
Mar; 111 (3): 787-95<br />
30. Kindermann W, Simon G, Keul J. The significance of the<br />
aerobic-anaerobic transition for the determination of<br />
work load intensities during endurance training. Eur J<br />
Appl Physiol 1979; 42: 25-34<br />
31. Meyer T, Lucia A, Earnest CP, et al. A conceptual framework<br />
for performance diagnosis and training prescription<br />
from submaximal gas exchange parameters: theory and<br />
application. Int J Sports Med 2005 Feb; 26 Suppl. 1:<br />
S38-48<br />
32. McLellan TM, Skinner JS. The use of the aerobic <strong>threshold</strong><br />
as a basis for training. Can J Appl Sport Sci 1981; 6 (4):<br />
197-201<br />
33. McLellan TM. The anaerobic <strong>threshold</strong>: concept and<br />
controversy. Austr J Sci Med Sport 1987; 19 (2): 3-8<br />
34. Skinner JS, McLellan TH. The transition from aerobic to<br />
anaerobic metabolism. Res Q Exerc Sport 1980; 51 (1):<br />
234-48<br />
ª 2009 Adis Data Information BV. All rights reserved. Sports Med 2009; 39 (6)
486 Faude et al.<br />
35. Wasserman K, Whipp BJ, Koyl SN, et al. Anaerobic<br />
<strong>threshold</strong> and respiratory gas exchange during exercise.<br />
J Appl Physiol 1973; 35 (2): 236-43<br />
36. Dickhuth HH, Yin L, Niess A, et al. Ventilatory, lactatederived<br />
and catecholamine <strong>threshold</strong>s during incremental<br />
treadmill running: relationship and reproducibility. Int J<br />
Sports Med 1999 Feb; 20 (2): 122-7<br />
37. Peronnet F, Aguilaniu B. Lactic acid buffering, nonmetabolic<br />
CO2 and exercise hyperventilation: a critical<br />
reappraisal. Respir Physiol Neurobiol 2006 Jan 25;<br />
150 (1): 4-18<br />
38. Yoshida T, Udo M, Chida M, et al. Specificity of physiological<br />
adaptation to endurance training in distance runners<br />
and competitive walkers. Eur J Appl Physiol Occup<br />
Physiol 1990; 61 (3-4): 197-201<br />
39. Acevedo EO, Goldfarb AH. Increased training intensity<br />
effects on plasma lactate, ventilatory <strong>threshold</strong>, and endurance.<br />
Med Sci Sports Exerc 1989; 21 (5): 563-8<br />
40. Bosquet L, Leger L, Legros P. Methods to determine<br />
aerobic endurance. Sports Med 2002; 32 (11): 675-700<br />
41. Mujika I, Padilla S. Cardiorespiratory and metabolic<br />
characteristics of detraining in humans. Med Sci Sports<br />
Exerc 2001 Mar; 33 (3): 413-21<br />
42. McLellan TM, Gass GC. The relationship between the<br />
ventilation and lactate <strong>threshold</strong>s following normal, low<br />
and high carbohydrate diets. Eur J Appl Physiol Occup<br />
Physiol 1989; 58 (6): 568-76<br />
43. Reilly T, Woodbridge V. Effects of moderate dietary manipulations<br />
on swim performance and on blood lactateswimming<br />
velocity curves. Int J Sports Med 1999 Feb;<br />
20 (2): 93-7<br />
44. Yoshida T. Effect of dietary modifications on lactate<br />
<strong>threshold</strong> and onset of blood lactate accumulation during<br />
incremental exercise. Eur J Appl Physiol 1984; 53 (3):<br />
200-5<br />
45. Maassen N, Busse MW. The relationship between lactic<br />
acid and work load: a measure for endurance capacity or<br />
an indicator of carbohydrate deficiency? Eur J Appl<br />
Physiol Occup Physiol 1989; 58 (7): 728-37<br />
46. Midgley AW, McNaughton LR, Jones AM. Training to<br />
enhance the physiological determinants of long-distance<br />
running performance: can valid recommendations be<br />
given to runners and coaches based on current scientific<br />
knowledge? Sports Med 2007; 37 (10): 857-80<br />
47. Bentley DJ, Newell J, Bishop D. Incremental exercise test<br />
design and analysis: implications for performance diagnostics<br />
in endurance athletes. Sports Med 2007; 37 (7):<br />
575-86<br />
48. Foxdal P, Sjodin B, Sjodin A, et al. The validity and accuracy<br />
of blood lactate measurements for prediction of<br />
maximal endurance running capacity: dependency of<br />
analyzed blood media in combination with different<br />
designs of the exercise test. Int J Sports Med 1994; 15 (2):<br />
89-95<br />
49. Heck H, Hess G, Mader A. Comparative study of different<br />
lactate <strong>threshold</strong> <strong>concepts</strong> [Vergleichende Untersuchung<br />
zu verschiedenen Laktat-Schwellenkonzepten]. Dtsch Z<br />
Sportmed 1985; 36 (1+2): 19-25, 40-52<br />
50. Heck H. Laktat in der Leistungsdiagnostik. Schorndorf:<br />
Hofmann, 1991<br />
51. Lundberg MA, Hughson RL, Weisiger KH, et al. Computerized<br />
estimation of lactate <strong>threshold</strong>. Comput<br />
Biomed Res 1986 Oct; 19 (5): 481-6<br />
52. Grant S, McMillan K, Newell J, et al. Reproducibility of<br />
the blood lactate <strong>threshold</strong>, 4 mmol.l(-1) marker, heart<br />
rate and ratings of perceived exertion during incremental<br />
treadmill exercise in humans. Eur J Appl Physiol 2002<br />
Jun; 87 (2): 159-66<br />
53. Beaver WL, Wasserman K, Whipp BJ. Improved detection<br />
of lactate <strong>threshold</strong> during exercise using a log-log transformation.<br />
J Appl Physiol 1985; 59 (6): 1936-40<br />
54. Cheng B, Kuipers H, Snyder AC, et al. A new approach for<br />
the determination of ventilatory and lactate <strong>threshold</strong>s.<br />
Int J Sports Med 1992; 13 (7): 518-22<br />
55. Hughson RL, Weisiger KH, Swanson GD. Blood lactate<br />
concentration increases as a continuous function in progressive<br />
exercise. J Appl Physiol 1987; 62 (5): 1975-81<br />
56. Robergs RA, Chwalbinska-Moneta J, Mitchell JB, et al.<br />
Blood lactate <strong>threshold</strong> differences between arterialized<br />
and venous blood. Int J Sports Med 1990; 11 (6): 446-51<br />
57. Feliu J, Ventura JL, Segura R, et al. Differences between<br />
lactate concentration of samples from ear lobe and the<br />
finger tip. J Physiol Biochem 1999 Dec; 55 (4): 333-9<br />
58. McNaughton LR, Thompson D, Philips G, et al. A comparison<br />
of the lactate Pro, Accusport, Analox GM7 and<br />
Kodak Ektachem lactate analysers in normal, hot and<br />
humid conditions. Int J Sports Med 2002 Feb; 23 (2): 130-5<br />
59. Thin AG, Hamzah Z, FitzGerald MX, et al. <strong>Lactate</strong> determination<br />
in exercise testing using an electrochemical<br />
analyser: with or without blood lysis? Eur J Appl Physiol<br />
Occup Physiol 1999 Jan; 79 (2): 155-9<br />
60. Buono MJ, Yeager JE. Intraerythrocyte and plasma lactate<br />
concentrations during exercise in humans. Eur J Appl<br />
Physiol Occup Physiol 1986; 55 (3): 326-9<br />
61. Forsyth JJ, Farrally MR. A comparison of lactate concentration<br />
in plasma collected from the toe, ear, and fingertip<br />
after a simulated rowing exercise. Br J Sports Med<br />
2000 Feb; 34 (1): 35-8<br />
62. Draper N, Brent S, Hale B, et al. The influence of sampling<br />
site and assay method on lactate concentration in response<br />
to rock climbing. Eur J Appl Physiol 2006 Nov;<br />
98 (4): 363-72<br />
63. Hildebrand A, Lormes W, Emmert J, et al. <strong>Lactate</strong> concentration<br />
in plasma and red blood cells during incremental<br />
exercise. Int J Sports Med 2000 Oct; 21 (7): 463-8<br />
64. Foxdal P, Sjodin B, Rudstam H, et al. <strong>Lactate</strong> concentration<br />
differences in plasma, whole blood, capillary finger<br />
blood and erythrocytes during submaximal graded exercise<br />
in humans. Eur J Appl Physiol Occup Physiol 1990;<br />
61 (3-4): 218-22<br />
65. Foxdal P, Sjodin A, Ostman B, et al. The effect of different<br />
blood sampling sites and analyses on the relationship between<br />
exercise intensity and 4.0 mmol.l-1 blood lactate<br />
concentration. Eur J Appl Physiol Occup Physiol 1991;<br />
63 (1): 52-4<br />
66. Medbø JI, Mamen A, Holt Olsen O, et al. Examination of<br />
four different instruments for measuring blood lactate concentration.<br />
Scand J Clin Lab Invest 2000 Aug; 60 (5): 367-80<br />
67. Buckley JD, Bourdon PC, Woolford SM. Effect of measuring<br />
blood lactate concentrations using different auto-<br />
ª 2009 Adis Data Information BV. All rights reserved. Sports Med 2009; 39 (6)
Validity of <strong>Lactate</strong> Thresholds 487<br />
mated lactate analysers on blood lactate transition<br />
<strong>threshold</strong>s. J Sci Med Sport 2003 Dec; 6 (4): 408-21<br />
68. van Someren KA, Howatson G, Nunan D, et al. Comparison<br />
of the <strong>Lactate</strong> Pro and Analox GM7 blood lactate<br />
analysers. Int J Sports Med 2005 Oct; 26 (8): 657-61<br />
69. Bishop D. Evaluation of the Accusport lactate analyser. Int<br />
J Sports Med 2001 Oct; 22 (7): 525-30<br />
70. Lucı´ a A, Hoyos J, Chicarro JL. Physiology of professional<br />
road cycling. Sports Med 2001; 31 (5): 325-37<br />
71. Weltman A. The blood lactate response to exercise.<br />
Champaign IL: Human Kinetics, 1995<br />
72. Heck H, Mader A, Hess G, et al. Justification of the<br />
4-mmol/l lactate <strong>threshold</strong>. Int J Sports Med 1985; 6 (3):<br />
117-30<br />
73. Seiler KS, Kjerland GO. Quantifying training intensity<br />
distribution in elite endurance athletes: is there evidence<br />
for an ‘‘optimal’’ distribution? Scand J Med Sci Sports<br />
2006 Feb; 16 (1): 49-56<br />
74. Esteve-Lanao J, San Juan AF, Earnest CP, et al. How do<br />
endurance runners actually train? Relationship with<br />
competition performance. Med Sci Sports Exerc 2005<br />
Mar; 37 (3): 496-504<br />
75. Bourdon P. Blood lactate transition <strong>threshold</strong>s: <strong>concepts</strong><br />
and controversies. In: Gore J, editor. Physiological tests<br />
for elite athletes/Australian Sports Commission. Champaign<br />
(IL): Human Kinetics, 2000: 50-65<br />
76. Meyer T, Faude O, Urhausen A, et al. Different effects of<br />
two regeneration regimens on immunological parameters<br />
in cyclists. Med Sci Sports Exerc 2004 Oct; 36 (10): 1743-9<br />
77. Meyer T, Gorge G, Schwaab B, et al. An alternative<br />
approach for exercise prescription and efficacy testing in<br />
patients with chronic heart failure: a randomized controlled<br />
training study. Am Heart J 2005 May; 149 (5): e1-7<br />
78. McConnell TR, Clark BA, Conlin NC, et al. Gas exchange<br />
anaerobic <strong>threshold</strong>: implications for prescribing exercise<br />
in cardiac rehabilitation. J Cardiopulmonary Rehabil<br />
1993; 13: 31-6<br />
79. Faude O, Meyer T, Urhausen A, et al. Recovery training in<br />
cyclists: ergometric, hormonal and psychometric findings.<br />
Scand J Med Sci Sports. Epub 2008 Apr 23<br />
80. Weltman A, Seip RL, Snead D, et al. Exercise training at<br />
and above the lactate <strong>threshold</strong> in previously untrained<br />
women. Int J Sports Med 1992; 13 (3): 257-63<br />
81. Londeree BR. Effect of training on lactate/ventilatory<br />
<strong>threshold</strong>s: a meta-analysis. Med Sci Sports Exerc 1997<br />
Jun; 29 (6): 837-43<br />
82. Scharhag J, Meyer T, Gabriel HH, et al. Does prolonged<br />
cycling of moderate intensity affect immune cell function?<br />
Br J Sports Med 2005 Mar; 39 (3): 171-7<br />
83. Meyer T, Gabriel HH, Auracher M, et al. Metabolic profile<br />
of 4 h cycling in the field with varying amounts of carbohydrate<br />
supply. Eur J Appl Physiol 2003 Jan; 88 (4-5): 431-7<br />
84. Meyer T, Faude O, Gabriel H, et al. Ventilatory <strong>threshold</strong><br />
and individual anaerobic <strong>threshold</strong> are reliable prescriptors<br />
for intensity of cycling training [abstract]. Med<br />
Sci Sports Exerc 2000; 32 Suppl. 5: S171<br />
85. Baron B, Noakes TD, Dekerle J, et al. Why does exercise<br />
terminate at the maximal lactate steady state intensity? Br<br />
J Sports Med 2008 Oct; 42 (10): 528-33<br />
86. Urhausen A, Coen B, Weiler B, et al. Individual anaerobic<br />
<strong>threshold</strong> and maximum lactate steady state. Int J Sports<br />
Med 1993; 14 (3): 134-9<br />
87. Mader A, Heck H. A theory of the metabolic origin<br />
of ‘‘anaerobic <strong>threshold</strong>’’. Int J Sports Med 1986 Jun;<br />
7 Suppl. 1: 45-65<br />
88. Stegmann H, Kindermann W, Schnabel A. <strong>Lactate</strong> kinetics<br />
and individual anaerobic <strong>threshold</strong>. Int J Sports Med<br />
1981; 2: 160-5<br />
89. MacIntosh BR, Esau S, Svedahl K. The lactate minimum<br />
test for cycling: estimation of the maximal lactate steady<br />
state. Can J Appl Physiol 2002 Jun; 27 (3): 232-49<br />
90. Lajoie C, Laurencelle L, Trudeau F. Physiological responses<br />
to cycling for 60 minutes at maximal lactate<br />
steady state. Can J Appl Physiol 2000 Aug; 25 (4): 250-61<br />
91. McLellan TM, Jacobs I. Reliability reproducibility and<br />
validity of the individual anaerobic <strong>threshold</strong>. Eur J Appl<br />
Physiol 1993; 67 (2): 125-31<br />
92. Van Schuylenbergh R, Vanden Eynde B, Hespel P. Correlations<br />
between lactate and ventilatory <strong>threshold</strong>s and the<br />
maximal lactate steady state in elite cyclists. Int J Sports<br />
Med 2004 Aug; 25 (6): 403-8<br />
93. Beneke R, Hutler M, Leithauser RM. Maximal lactatesteady-state<br />
independent of performance. Med Sci Sports<br />
Exerc 2000 Jun; 32 (6): 1135-9<br />
94. Beneke R, von Duvillard SP. Determination of maximal<br />
lactate steady state response in selected sports events. Med<br />
Sci Sports Exerc 1996 Feb; 28 (2): 241-6<br />
95. Beneke R, Leithauser RM, Hutler M. Dependence of the<br />
maximal lactate steady state on the motor pattern of exercise.<br />
Br J Sports Med 2001 Jun; 35 (3): 192-6<br />
96. Keul J, Simon G, Berg A, et al. Bestimmung der individuellen<br />
anaeroben Schwelle zur Leistungsbewertung<br />
und Trainingsgestaltung. Dtsch Z Sportmed 1979; 30: 212-8<br />
97. Simon G, Berg A, Dickhuth H-H, et al. Bestimmung der<br />
anaeroben Schwelle in Abha¨ ngigkeit von Alter und<br />
von der Leistungsfa¨ higkeit. Dtsch Z Sportmed 1981; 32:<br />
7-14<br />
98. Coen B. Individuelle anaerobe Schwelle-Methodik und<br />
Anwendung in der sportmedizinischen Leistungsdiagnostik<br />
und Trainingssteuerung leichtathletischer Laufdisziplinen.<br />
Ko¨ ln: Sport und Buch Strauss, 1997<br />
99. Coen B, Schwarz L, Urhausen A, et al. Control of training<br />
in middle- and long-distance running by means of the<br />
individual anaerobic <strong>threshold</strong>. Int J Sports Med 1991;<br />
12 (6): 519-24<br />
100. Niess AM, Fehrenbach E, Strobel G, et al. Evaluation of<br />
stress responses to interval training at low and moderate<br />
altitudes. Med Sci Sports Exerc 2003 Feb; 35 (2): 263-9<br />
101. Niess AM, Ro¨ cker K, Baumann I, et al. Laktatverhalten<br />
bei extensiven Tempolaufbelastungen unter Flachlandund<br />
moderaten Ho¨ henbedingungen. Leistungssport 1999;<br />
(3): 49-53<br />
102. Faude O, Meyer T, Scharhag J, et al. Volume vs intensity in<br />
the training of competitive swimmers. Int J Sports Med<br />
2008 Nov; 29 (11): 906-12<br />
103. Smith CG, Jones AM. The relationship between critical<br />
velocity, maximal lactate steady-state velocity and lactate<br />
turnpoint velocity in runners. Eur J Appl Physiol 2001 Jul;<br />
85 (1-2): 19-26<br />
ª 2009 Adis Data Information BV. All rights reserved. Sports Med 2009; 39 (6)
488 Faude et al.<br />
104. Davis HA, Bassett J, Hughes P, et al. Anaerobic <strong>threshold</strong><br />
and lactate turnpoint. Eur J Appl Physiol 1983; 50 (3):<br />
383-92<br />
105. Urhausen A, Weiler B, Coen B, et al. Plasma catecholamines<br />
during endurance exercise of different intensities as<br />
related to the individual anaerobic <strong>threshold</strong>. Eur J Appl<br />
Physiol 1994; 69: 16-20<br />
106. Gabriel H, Kindermann W. The acute immune response<br />
to exercise: what does it mean? Int J Sports Med 1997;<br />
18 Suppl. 1: S28-45<br />
107. Lucia A, Sanchez O, Carvajal A, et al. Analysis of the<br />
aerobic-anaerobic transition in elite cyclists during incremental<br />
exercise with the use of electromyography. Br J<br />
Sports Med 1999 Jun; 33 (3): 178-85<br />
108. Sjodin B, Jacobs I. Onset of blood lactate accumulation<br />
and marathon running performance. Int J Sports Med<br />
1981; 2 (1): 23-6<br />
109. Farrell PA, Wilmore JH, Coyle EF, et al. Plasma lactate<br />
accumulation and distance running performance. Med Sci<br />
Sports 1979; 11 (4): 338-44<br />
110. Yoshida T, Chida M, Ichioka M, et al. Blood lactate<br />
parameters related to aerobic capacity and endurance<br />
performance. Eur J Appl Physiol 1987; 56 (1): 7-11<br />
111. Hagberg JM, Coyle EF. Physiological determinants of endurance<br />
performance as studied in competitive racewalkers.<br />
Med Sci Sports Exerc 1983; 15: 287-9<br />
112. Jones AM, Doust JH. The validity of the lactate minimum<br />
test for determination of the maximal lactate steady state.<br />
Med Sci Sports Exerc 1998 Aug; 30 (8): 1304-13<br />
113. Haverty M, Kenney WL, Hodgson JL. <strong>Lactate</strong> and gas<br />
exchange responses to incremental and steady state running.<br />
Br J Sports Med 1988; 22 (2): 51-4<br />
114. Harnish CR, Swensen TC, Pate RR. Methods for estimating<br />
the maximal lactate steady state in trained cyclists.<br />
Med Sci Sports Exerc 2001 Jun; 33 (6): 1052-5<br />
115. Beneke R. Methodological aspects of maximal lactate<br />
steady state: implications for performance testing. Eur J<br />
Appl Physiol 2003 Mar; 89 (1): 95-9<br />
116. Billat VL, Sirvent P, Py G, et al. The concept of maximal<br />
lactate steady state: a bridge between biochemistry,<br />
physiology and sport science. Sports Med 2003; 33 (6):<br />
407-26<br />
117. Beneke R. Anaerobic <strong>threshold</strong>, individual anaerobic<br />
<strong>threshold</strong>, and maximal lactate steady state in rowing.<br />
Med Sci Sports Exerc 1995; 27 (6): 863-7<br />
118. Baron B, Dekerle J, Robin S, et al. Maximal lactate steady<br />
state does not correspond to a complete physiological<br />
steady state. Int J Sports Med 2003 Nov; 24 (8): 582-7<br />
119. Urhausen A, Coen B, Kindermann W. Individual assessment<br />
of the aerobic-anaerobic transition by measurements<br />
of blood lactate. In: Garrett Jr WE, Kirkendall DT,<br />
editors. Exercise and sport science. Philadelphia (PA):<br />
Lippincott Williams & Wilkins, 2000: 267-75<br />
120. Mujika I, Busso T, Geyssant A, et al. Modeling the effects<br />
of training in competitive swimming. In: Troup JP,<br />
Hollander AP, Strasse D, editors. Biomechanics and medicine<br />
in swimming. London: E & FN Spon, 1996: 221-8<br />
121. Kumagai S, Tanaka K, Matsuura Y, et al. Relationships of<br />
the anaerobic <strong>threshold</strong> with the 5 km, 10 km, and 10 mile<br />
races. Eur J Appl Physiol 1982; 49 (1): 13-23<br />
122. Aunola S, Rusko H. Does anaerobic <strong>threshold</strong> correlate<br />
with maximal lactate steady-state? J Sports Sci 1992;<br />
10 (4): 309-23<br />
123. Weltman A, Snead D, Seip R, et al. Prediction of lactate<br />
<strong>threshold</strong> and fixed blood lactate concentrations from<br />
3200-m running performance in male runners. Int J Sports<br />
Med 1987 Dec; 8 (6): 401-6<br />
124. Fo¨ hrenbach R, Mader A, Hollmann W. Determination of<br />
endurance capacity and prediction of exercise intensities<br />
for training and competition in marathon runners. Int<br />
J Sports Med 1987; 8: 11-8<br />
125. Hurley BF, Hagberg JM, Allen WK, et al. Effect of training<br />
on blood lactate levels during submaximal exercise.<br />
J Appl Physiol 1984; 56 (5): 1260-4<br />
126. Ivy JL, Withers RT, Van Handel PJ, et al. Muscle<br />
respiratory capacity and fiber type as determinants<br />
of the lactate <strong>threshold</strong>. J Appl Physiol 1980 Mar; 48 (3):<br />
523-7<br />
127. Caiozzo VJ, Davis JA, Ellis JF, et al. A comparison of gas<br />
exchange indices used to detect the anaerobic <strong>threshold</strong>.<br />
J Appl Physiol 1982; 53 (5): 1184-9<br />
128. Tanaka H. Predicting running velocity at blood lactate<br />
<strong>threshold</strong> from running performance tests in adolescent<br />
boys. Eur J Appl Physiol 1986; 55 (4): 344-8<br />
129. Tanaka K, Matsuura Y. Marathon performance, anaerobic<br />
<strong>threshold</strong>, and onset of blood lactate accumulation.<br />
J Appl Physiol 1984; 57 (3): 640-3<br />
130. Tanaka K, Matsuura Y, Matsuzaka A, et al. A longitudinal<br />
assessment of anaerobic <strong>threshold</strong> and distance-running<br />
performance. Med Sci Sports Exerc 1984 Jun; 16 (3): 278-82<br />
131. Yoshida T, Udo M, Iwai K, et al. Significance of the contribution<br />
of aerobic and anaerobic components to several<br />
distance running performances in female athletes. Eur<br />
J Appl Physiol Occup Physiol 1990; 60 (4): 249-53<br />
132. Yoshida T, Udo M, Iwai K, et al. Physiological characteristics<br />
related to endurance running performance in female<br />
distance runners. J Sports Sci 1993 Feb; 11 (1): 57-62<br />
133. Davis JA, Vodak P, Wilmore JH, et al. Anaerobic <strong>threshold</strong><br />
and maximal aerobic power for three modes of<br />
exercise. J Appl Physiol 1976 Oct; 41 (4): 544-50<br />
134. Weltman J, Seip R, Levine S, et al. Prediction of lactate<br />
<strong>threshold</strong> and fixed blood lactate concentrations from<br />
3200-m time trial running performance in untrained<br />
females. Int J Sports Med 1989 Jun; 10 (3): 207-11<br />
135. Roecker K, Schotte O, Niess AM, et al. Predicting competition<br />
performance in long-distance running by means<br />
of a treadmill test. Med Sci Sports Exerc 1998 Oct; 30 (10):<br />
1552-7<br />
136. Dickhuth HH, Huonker M, Mu¨ nzel T, et al. Individual<br />
anaerobic <strong>threshold</strong> for evaluation of competitive athletes<br />
and patients with left ventricular dysfunctions. In: Bachl N,<br />
Graham TE, Lo¨ llgen H, editors. Advances in ergometry.<br />
Berlin: Springer, 1991: 173-9<br />
137. Berg A, Stippig J, Keul J, et al. Zur Beurteilung der<br />
Leistungsfa¨ higkeit und Belastbarkeit von Patienten mit<br />
coronarer Herzkrankheit. Dtsch Z Sportmed 1980; 31:<br />
199-205<br />
138. Hughson RL, Green HJ. Blood acid-base and lactate<br />
relationships studied by ramp work tests. Med Sci Sports<br />
Exerc 1982; 14 (4): 297-302<br />
ª 2009 Adis Data Information BV. All rights reserved. Sports Med 2009; 39 (6)
Validity of <strong>Lactate</strong> Thresholds 489<br />
139. Coyle EF, Martin WH, Ehsani AA, et al. Blood lactate<br />
<strong>threshold</strong> in some well-trained ischemic heart disease<br />
patients. J Appl Physiol 1983 Jan; 54 (1): 18-23<br />
140. Bishop D, Jenkins DG, Mackinnon LT. The relationship<br />
between plasma lactate parameters, W peak and 1-h cycling<br />
performance in women. Med Sci Sports Exerc 1998 Aug;<br />
30 (8): 1270-5<br />
141. Amann M, Subudhi AW, Foster C. Predictive validity of<br />
ventilatory and lactate <strong>threshold</strong>s for cycling time trial<br />
performance. Scand J Med Sci Sports 2006 Feb; 16 (1):<br />
27-34<br />
142. Yeh MP, Gardner RM, Adams TD, et al. ‘‘Anaerobic<br />
<strong>threshold</strong>’’: problems of determination and validation.<br />
J Appl Physiol 1983 Oct; 55 (4): 1178-86<br />
143. Bunc V, Heller J, Novack J, et al. Determination of the<br />
individual anaerobic <strong>threshold</strong>. Acta Univ Carol, Gymnica<br />
1985; 27: 73-81<br />
144. Baldari C, Guidetti L. A simple method for individual<br />
anaerobic <strong>threshold</strong> as predictor of max lactate<br />
steady state. Med Sci Sports Exerc 2000 Oct; 32 (10):<br />
1798-802<br />
145. Tegtbur U, Busse MW, Braumann KM. Estimation of an<br />
individual equilibrium between lactate production and<br />
catabolism during exercise. Med Sci Sports Exerc 1993<br />
May; 25 (5): 620-7<br />
146. Stegmann H, Kindermann W. Comparison of prolonged<br />
exercise tests at the individual anaerobic <strong>threshold</strong> and the<br />
fixed anaerobic <strong>threshold</strong> of 4 mmol/l lactate. Int J Sports<br />
Med 1982; 3 (2): 105-10<br />
147. Orok CJ, Hughson RL, Green HJ, et al. Blood lactate<br />
responses in incremental exercise as predictors of constant<br />
load performance. Eur J Appl Physiol 1989; 59 (4):<br />
262-7<br />
148. Carter H, Jones AM, Doust JH. Effect of incremental test<br />
protocol on the lactate minimum speed. Med Sci Sports<br />
Exerc 1999 Jun; 31 (6): 837-45<br />
149. Coen B, Urhausen A, Kindermann W. Individual anaerobic<br />
<strong>threshold</strong>: methodological aspects of its assessment in<br />
running. Int J Sports Med 2001 Jan; 22 (1): 8-16<br />
150. Weltman A, Snead D, Stein P, et al. Reliability and validity<br />
of a continuous incremental treadmill protocol for the<br />
determination of lactate <strong>threshold</strong>, fixed blood lactate<br />
concentrations, and V O 2max . Int J Sports Med 1990;<br />
11 (1): 26-32<br />
151. Aunola S, Rusko H. Reproducibility of aerobic and anaerobic<br />
<strong>threshold</strong>s in 20-50 year old men. Eur J Appl Physiol<br />
1984; 53 (3): 260-6<br />
152. Pfitzinger P, Freedson PS. The reliability of lactate measurements<br />
during exercise. Int J Sports Med 1998 Jul;<br />
19 (5): 349-57<br />
153. Zhou S, Weston SB. Reliability of using the D-max method<br />
to define physiological responses to incremental exercise<br />
testing. Physiol Meas 1997 May; 18 (2): 145-54<br />
154. Takeshima N, Tanaka K. Prediction of endurance running<br />
performance for middle-aged and older runners. Br J<br />
Sports Med 1995 Mar; 29 (1): 20-3<br />
155. Tanaka K, Matsuura Y, Kumagai S, et al. Relationships of<br />
anaerobic <strong>threshold</strong> and onset of blood lactate accumulation<br />
with endurance performance. Eur J Appl Physiol<br />
Occup Physiol 1983; 52 (1): 51-6<br />
156. Bourdin M, Messonnier L, Hager JP, et al. Peak<br />
power output predicts rowing ergometer performance<br />
in elite male rowers. Int J Sports Med 2004 Jul; 25 (5):<br />
368-73<br />
157. Bjorklund G, Pettersson S, Schagatay E. Performance<br />
predicting factors in prolonged exhausting exercise of<br />
varying intensity. Eur J Appl Physiol 2007 Mar; 99 (4):<br />
423-9<br />
158. Grant S, Craig I, Wilson J, et al. The relationship between<br />
3 km running performance and selected physiological<br />
variables. J Sports Sci 1997 Aug; 15 (4): 403-10<br />
159. Fay L, Londeree BR, LaFontaine TP, et al. Physiological<br />
parameters related to distance running performance in<br />
female athletes. Med Sci Sports Exerc 1989 Jun; 21 (3):<br />
319-24<br />
160. Nicholson RM, Sleivert GG. Indices of lactate <strong>threshold</strong><br />
and their relationship with 10-km running velocity. Med<br />
Sci Sports Exerc 2001 Feb; 33 (2): 339-42<br />
161. Lehmann M, Berg A, Kapp R, et al. Correlations between<br />
laboratory testing and distance running performance in<br />
marathoners of similar performance ability. Int J Sports<br />
Med 1983 Nov; 4 (4): 226-30<br />
162. Tanaka K, Watanabe H, Konishi Y, et al. Longitudinal<br />
associations between anaerobic <strong>threshold</strong> and distance<br />
running performance. Eur J Appl Physiol Occup Physiol<br />
1986; 55 (3): 248-52<br />
163. Tokmakidis SP, Leger LA, Pilianidis TC. Failure to obtain<br />
a unique <strong>threshold</strong> on the blood lactate concentration<br />
curve during exercise. Eur J Appl Physiol Occup Physiol<br />
1998 Mar; 77 (4): 333-42<br />
164. Stratton E, O’Brien BJ, Harvey J, et al. Treadmill velocity<br />
best predicts 5000-m run performance. Int J Sports Med<br />
2009; 30 (1): 40-5<br />
165. Bentley DJ, McNaughton LR, Thompson D, et al. Peak<br />
power output, the lactate <strong>threshold</strong>, and time trial performance<br />
in cyclists. Med Sci Sports Exerc 2001 Dec;<br />
33 (12): 2077-81<br />
166. McNaughton LR, Roberts S, Bentley DJ. The relationship<br />
among peak power output, lactate <strong>threshold</strong>, and shortdistance<br />
cycling performance: effects of incremental exercise<br />
test design. J Strength Cond Res 2006 Feb; 20 (1):<br />
157-61<br />
167. Craig NP, Norton KI, Bourdon PC, et al. Aerobic and<br />
anaerobic indices contributing to track endurance cycling<br />
performance. Eur J Appl Physiol Occup Physiol 1993;<br />
67 (2): 150-8<br />
168. Nichols JF, Phares SL, Buono MJ. Relationship between<br />
blood lactate response to exercise and endurance performance<br />
in competitive female master cyclists. Int J Sports<br />
Med 1997 Aug; 18 (6): 458-63<br />
169. Gregory J, Johns DP, Walls JT. Relative versus absolute<br />
physiological measures as predictors of mountain bike<br />
cross-country race performance. J Strength Cond Res<br />
2007 Feb; 21 (1): 17-22<br />
170. Impellizzeri FM, Rampinini E, Sassi A, et al. Physiological<br />
correlates to off-road cycling performance. J Sports Sci<br />
2005 Jan; 23 (1): 41-47<br />
171. Coyle EF. Improved muscular efficiency displayed as Tour<br />
de France champion matures. J Appl Physiol 2005 Jun;<br />
98 (6): 2191-6<br />
ª 2009 Adis Data Information BV. All rights reserved. Sports Med 2009; 39 (6)
490 Faude et al.<br />
172. Lucia A, Earnest C, Arribas C. The Tour de France:<br />
a physiological review. Scand J Med Sci Sports 2003 Oct;<br />
13 (5): 275-83<br />
173. Impellizzeri FM, Marcora SM. The physiology of mountain<br />
biking. Sports Med 2007; 37 (1): 59-71<br />
174. Yoshida T, Udo M, Iwai K, et al. Physiological determinants<br />
of race walking performance in female race walkers.<br />
Br J Sports Med 1989 Dec; 23 (4): 250-4<br />
175. Ingham SA, Whyte GP, Jones K, et al. Determinants of<br />
2000 m rowing ergometer performance in elite rowers. Eur<br />
J Appl Physiol 2002 Dec; 88 (3): 243-6<br />
176. Cosgrove MJ, Wilson J, Watt D, et al. The relationship<br />
between selected physiological variables of rowers and<br />
rowing performance as determined by a 2000 m ergometer<br />
test. J Sports Sci 1999 Nov; 17 (11): 845-52<br />
177. Noakes TD. The central governor model of exercise<br />
regulation applied to the marathon. Sports Med 2007;<br />
37 (4-5): 374-7<br />
178. Swensen TC, Harnish CR, Beitman L, et al. Noninvasive<br />
estimation of the maximal lactate steady state in trained<br />
cyclists. Med Sci Sports Exerc 1999 May; 31 (5): 742-6<br />
179. Snyder AC, Woulfe T, Welsh R, et al. A simplified approach<br />
to estimating the maximal lactate steady state. Int<br />
J Sports Med 1994; 15 (1): 27-31<br />
180. Kilding AE, Jones AM. Validity of a single-visit protocol to<br />
estimate the maximum lactate steady state. Med Sci<br />
Sports Exerc 2005 Oct; 37 (10): 1734-40<br />
181. Billat V, Dalmay F, Antonini MT, et al. A method for<br />
determining the maximal steady state of blood lactate<br />
concentration from two levels of submaximal exercise.<br />
Eur J Appl Physiol Occup Physiol 1994; 69 (3): 196-202<br />
182. Palmer AS, Potteiger JA, Nau KL, et al. A 1-day maximal<br />
lactate steady-state assessment protocol for trained runners.<br />
Med Sci Sports Exerc 1999 Sep; 31 (9): 1336-41<br />
183. Loat CE, Rhodes EC. Relationship between the lactate and<br />
ventilatory <strong>threshold</strong>s during prolonged exercise. Sports<br />
Med 1993; 15 (2): 104-15<br />
184. Simon J, Young JL, Gutin B, et al. <strong>Lactate</strong> accumulation<br />
relative to the anaerobic and respiratory compensation<br />
<strong>threshold</strong>s. J Appl Physiol 1983; 54 (1): 13-7<br />
185. Yamamoto Y, Miyashita M, Hughson RL, et al. The<br />
ventilatory <strong>threshold</strong> gives maximal lactate steady state.<br />
Eur J Appl Physiol 1991; 63 (1): 55-9<br />
186. Scheen A, Juchmes J, Cession-Fossion A. Critical analysis<br />
of the ‘‘anaerobic <strong>threshold</strong>’’ during exercise at constant<br />
workloads. Eur J Appl Physiol Occup Physiol 1981;<br />
46 (4): 367-77<br />
187. Laplaud D, Guinot M, Favre-Juvin A, et al. Maximal<br />
lactate steady state determination with a single incremental<br />
test exercise. Eur J Appl Physiol 2006 Mar; 96 (4):<br />
446-52<br />
188. Dekerle J, Baron B, Dupont L, et al. Maximal lactate<br />
steady state, respiratory compensation <strong>threshold</strong> and<br />
critical power. Eur J Appl Physiol 2003 May; 89 (3-4):<br />
281-8<br />
189. Loat CER, Rhodes EC. Comparison of the lactate and<br />
ventilatory <strong>threshold</strong>s during prolonged work. Biol Sport<br />
1996; 13 (1): 3-12<br />
190. Schnabel A, Kindermann W, Schmitt WM, et al. Hormonal<br />
and metabolic consequences of prolonged running at<br />
the individual anaerobic <strong>threshold</strong>. Int J Sports Med 1982;<br />
3 (3): 163-8<br />
191. Oyono-Enguelle S, Heitz A, Marbach J, et al. Blood<br />
lactate during constant-load exercise at aerobic and<br />
anaerobic <strong>threshold</strong>s. Eur J Appl Physiol 1990; 60 (5):<br />
321-30<br />
192. Ribeiro JP, Hughes V, Fielding RA, et al. Metabolic and<br />
ventilatory responses to steady state exercise relative to<br />
lactate <strong>threshold</strong>s. Eur J Appl Physiol Occup Physiol<br />
1986; 55 (2): 215-21<br />
193. Bacon L, Kern M. Evaluating a test protocol for predicting<br />
maximum lactate steady state. J Sports Med Phys Fitness<br />
1999 Dec; 39 (4): 300-8<br />
194. Bland JM, Altman DG. Statistical methods for assessing<br />
agreement between two methods of clinical measurement.<br />
Lancet 1986 Feb 8; 1 (8476): 307-10<br />
195. Atkinson G, Nevill AM. Statistical methods for assessing<br />
measurement error (reliability) in variables relevant to<br />
sports medicine. Sports Med 1998 Oct; 26 (4): 217-38<br />
Correspondence: Dr Oliver Faude, Institute of Sports and<br />
Preventive Medicine, University of Saarland, Campus Bldg.<br />
B 8.2, 66123 Saarbrücken, Germany.<br />
E-mail: o.faude@mx.uni-saarland.de<br />
ª 2009 Adis Data Information BV. All rights reserved. Sports Med 2009; 39 (6)