Lactate threshold concepts - UFPR
Lactate threshold concepts - UFPR
Lactate threshold concepts - UFPR

You also want an ePaper? Increase the reach of your titles
YUMPU automatically turns print PDFs into web optimized ePapers that Google loves.
472 Faude et al.<br />
Blood lactate concentration (mmol/L)<br />
10<br />
8<br />
6<br />
4<br />
2<br />
0<br />
Regenerative/<br />
low-intensity<br />
endurance<br />
training<br />
Aerobic <strong>threshold</strong><br />
Moderate-/<br />
high-intensity<br />
endurance<br />
training<br />
Aerobicanaerobic<br />
transition<br />
Work intensity<br />
Interval<br />
training<br />
sessions<br />
MLSS = anaerobic<br />
<strong>threshold</strong><br />
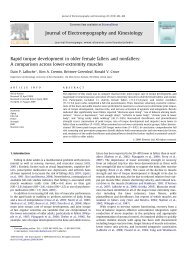
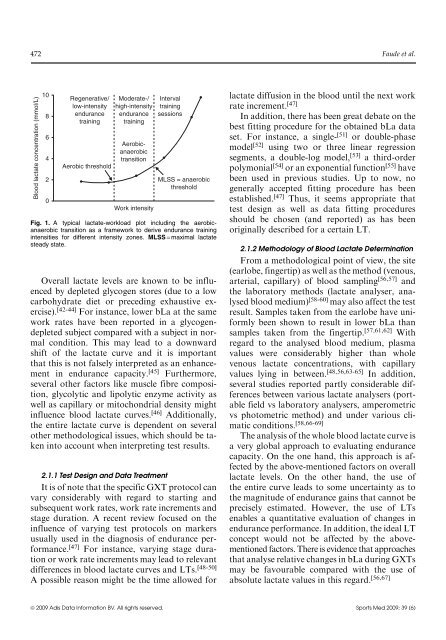
Fig. 1. A typical lactate-workload plot including the aerobicanaerobic<br />
transition as a framework to derive endurance training<br />
intensities for different intensity zones. MLSS = maximal lactate<br />
steady state.<br />
Overall lactate levels are known to be influenced<br />
by depleted glycogen stores (due to a low<br />
carbohydrate diet or preceding exhaustive exercise).<br />
[42-44] For instance, lower bLa at the same<br />
work rates have been reported in a glycogendepleted<br />
subject compared with a subject in normal<br />
condition. This may lead to a downward<br />
shift of the lactate curve and it is important<br />
that this is not falsely interpreted as an enhancement<br />
in endurance capacity. [45] Furthermore,<br />
several other factors like muscle fibre composition,<br />
glycolytic and lipolytic enzyme activity as<br />
well as capillary or mitochondrial density might<br />
influence blood lactate curves. [46] Additionally,<br />
the entire lactate curve is dependent on several<br />
other methodological issues, which should be taken<br />
into account when interpreting test results.<br />
2.1.1 Test Design and Data Treatment<br />
It is of note that the specific GXT protocol can<br />
vary considerably with regard to starting and<br />
subsequent work rates, work rate increments and<br />
stage duration. A recent review focused on the<br />
influence of varying test protocols on markers<br />
usually used in the diagnosis of endurance performance.<br />
[47] For instance, varying stage duration<br />
or work rate increments may lead to relevant<br />
differences in blood lactate curves and LTs. [48-50]<br />
A possible reason might be the time allowed for<br />
lactate diffusion in the blood until the next work<br />
rate increment. [47]<br />
In addition, there has been great debate on the<br />
best fitting procedure for the obtained bLa data<br />
set. For instance, a single- [51] or double-phase<br />
model [52] using two or three linear regression<br />
segments, a double-log model, [53] a third-order<br />
polymonial [54] or an exponential function [55] have<br />
been used in previous studies. Up to now, no<br />
generally accepted fitting procedure has been<br />
established. [47] Thus, it seems appropriate that<br />
test design as well as data fitting procedures<br />
should be chosen (and reported) as has been<br />
originally described for a certain LT.<br />
2.1.2 Methodology of Blood <strong>Lactate</strong> Determination<br />
From a methodological point of view, the site<br />
(earlobe, fingertip) as well as the method (venous,<br />
arterial, capillary) of blood sampling [56,57] and<br />
the laboratory methods (lactate analyser, analysed<br />
blood medium) [58-60] may also affect the test<br />
result. Samples taken from the earlobe have uniformly<br />
been shown to result in lower bLa than<br />
samples taken from the fingertip. [57,61,62] With<br />
regard to the analysed blood medium, plasma<br />
values were considerably higher than whole<br />
venous lactate concentrations, with capillary<br />
values lying in between. [48,56,63-65] In addition,<br />
several studies reported partly considerable differences<br />
between various lactate analysers (portable<br />
field vs laboratory analysers, amperometric<br />
vs photometric method) and under various climatic<br />
conditions. [58,66-69]<br />
The analysis of the whole blood lactate curve is<br />
a very global approach to evaluating endurance<br />
capacity. On the one hand, this approach is affected<br />
by the above-mentioned factors on overall<br />
lactate levels. On the other hand, the use of<br />
the entire curve leads to some uncertainty as to<br />
the magnitude of endurance gains that cannot be<br />
precisely estimated. However, the use of LTs<br />
enables a quantitative evaluation of changes in<br />
endurance performance. In addition, the ideal LT<br />
concept would not be affected by the abovementioned<br />
factors. There is evidence that approaches<br />
that analyse relative changes in bLa during GXTs<br />
may be favourable compared with the use of<br />
absolute lactate values in this regard. [56,67]<br />
ª 2009 Adis Data Information BV. All rights reserved. Sports Med 2009; 39 (6)