Lactate threshold concepts - UFPR
Lactate threshold concepts - UFPR
Lactate threshold concepts - UFPR

Create successful ePaper yourself
Turn your PDF publications into a flip-book with our unique Google optimized e-Paper software.
476 Faude et al.<br />
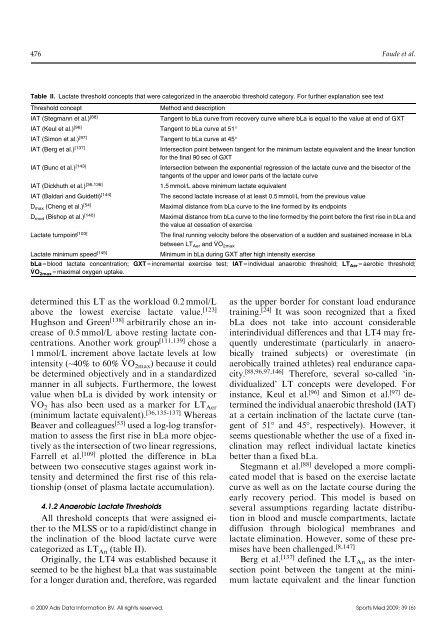
Table II. <strong>Lactate</strong> <strong>threshold</strong> <strong>concepts</strong> that were categorized in the anaerobic <strong>threshold</strong> category. For further explanation see text<br />
Threshold concept<br />
Method and description<br />
IAT (Stegmann et al.) [88]<br />
Tangent to bLa curve from recovery curve where bLa is equal to the value at end of GXT<br />
IAT (Keul et al.) [96] Tangent to bLa curve at 51°<br />
IAT (Simon et al.) [97] Tangent to bLa curve at 45°<br />
IAT (Berg et al.) [137]<br />
Intersection point between tangent for the minimum lactate equivalent and the linear function<br />
for the final 90 sec of GXT<br />
IAT (Bunc et al.) [143]<br />
Intersection between the exponential regression of the lactate curve and the bisector of the<br />
tangents of the upper and lower parts of the lactate curve<br />
IAT (Dickhuth et al.) [36,136]<br />
1.5 mmol/L above minimum lactate equivalent<br />
IAT (Baldari and Guidetti) [144]<br />
The second lactate increase of at least 0.5 mmol/L from the previous value<br />
D max (Cheng et al.) [54]<br />
Maximal distance from bLa curve to the line formed by its endpoints<br />
D mod (Bishop et al.) [140]<br />
Maximal distance from bLa curve to the line formed by the point before the first rise in bLa and<br />
the value at cessation of exercise<br />
<strong>Lactate</strong> turnpoint [103]<br />
The final running velocity before the observation of a sudden and sustained increase in bLa<br />
between LT Aer and V O 2max<br />
<strong>Lactate</strong> minimum speed [145]<br />
Minimum in bLa during GXT after high intensity exercise<br />
bLa = blood lactate concentration; GXT = incremental exercise test; IAT = individual anaerobic <strong>threshold</strong>; LT Aer = aerobic <strong>threshold</strong>;<br />
V O 2max = maximal oxygen uptake.<br />
determined this LT as the workload 0.2 mmol/L<br />
above the lowest exercise lactate value. [123]<br />
Hughson and Green [138] arbitrarily chose an increase<br />
of 0.5 mmol/L above resting lactate concentrations.<br />
Another work group [111,139] chose a<br />
1 mmol/L increment above lactate levels at low<br />
intensity (~40% to 60% V O 2max ) because it could<br />
be determined objectively and in a standardized<br />
manner in all subjects. Furthermore, the lowest<br />
value when bLa is divided by work intensity or<br />
V O 2 has also been used as a marker for LT Aer<br />
(minimum lactate equivalent). [36,135-137] Whereas<br />
Beaver and colleagues [53] used a log-log transformation<br />
to assess the first rise in bLa more objectively<br />
as the intersection of two linear regressions,<br />
Farrell et al. [109] plotted the difference in bLa<br />
between two consecutive stages against work intensity<br />
and determined the first rise of this relationship<br />
(onset of plasma lactate accumulation).<br />
4.1.2 Anaerobic <strong>Lactate</strong> Thresholds<br />
All <strong>threshold</strong> <strong>concepts</strong> that were assigned either<br />
to the MLSS or to a rapid/distinct change in<br />
the inclination of the blood lactate curve were<br />
categorized as LT An (table II).<br />
Originally, the LT4 was established because it<br />
seemed to be the highest bLa that was sustainable<br />
for a longer duration and, therefore, was regarded<br />
as the upper border for constant load endurance<br />
training. [24] It was soon recognized that a fixed<br />
bLa does not take into account considerable<br />
interindividual differences and that LT4 may frequently<br />
underestimate (particularly in anaerobically<br />
trained subjects) or overestimate (in<br />
aerobically trained athletes) real endurance capacity.<br />
[88,96,97,146] Therefore, several so-called ‘individualized’<br />
LT <strong>concepts</strong> were developed. For<br />
instance, Keul et al. [96] and Simon et al. [97] determined<br />
the individual anaerobic <strong>threshold</strong> (IAT)<br />
at a certain inclination of the lactate curve (tangent<br />
of 51° and 45°, respectively). However, it<br />
seems questionable whether the use of a fixed inclination<br />
may reflect individual lactate kinetics<br />
better than a fixed bLa.<br />
Stegmann et al. [88] developed a more complicated<br />
model that is based on the exercise lactate<br />
curve as well as on the lactate course during the<br />
early recovery period. This model is based on<br />
several assumptions regarding lactate distribution<br />
in blood and muscle compartments, lactate<br />
diffusion through biological membranes and<br />
lactate elimination. However, some of these premises<br />
have been challenged. [8,147]<br />
Berg et al. [137] defined the LT An as the intersection<br />
point between the tangent at the minimum<br />
lactate equivalent and the linear function<br />
ª 2009 Adis Data Information BV. All rights reserved. Sports Med 2009; 39 (6)