Table of Contents Modular kaizen - Public Health Foundation
Table of Contents Modular kaizen - Public Health Foundation
Table of Contents Modular kaizen - Public Health Foundation

Create successful ePaper yourself
Turn your PDF publications into a flip-book with our unique Google optimized e-Paper software.
<strong>Modular</strong> <strong>kaizen</strong>: Dealing with Disruptions is a publication <strong>of</strong> the <strong>Public</strong> <strong>Health</strong><br />
<strong>Foundation</strong>, with a limited first printing in March 2011.<br />
Suggested Citation<br />
Bialek, R, Duffy, G, Moran, J. <strong>Modular</strong> <strong>kaizen</strong>: Dealing with Disruptions. Washington,<br />
DC: the <strong>Public</strong> <strong>Health</strong> <strong>Foundation</strong>; 2011.<br />
Additional Resources<br />
To find other Quality Improvement publications, please visit the <strong>Public</strong> <strong>Health</strong><br />
<strong>Foundation</strong> bookstore at: http://bookstore.phf.org/<br />
To explore free tools, resources and samples, please visit the <strong>Public</strong> <strong>Health</strong> <strong>Foundation</strong><br />
website at: http://www.phf.org/Pages/default.aspx<br />
_______________________________________________________________________<br />
<strong>Modular</strong> <strong>kaizen</strong>: Dealing with Disruptions
<strong>Modular</strong> <strong>kaizen</strong><br />
<strong>Table</strong> <strong>of</strong> <strong>Contents</strong><br />
Acknowledgement<br />
Preface and Overview<br />
ii<br />
iii<br />
Chapter 1: The Value <strong>of</strong> Performance Management 1<br />
Chapter 2: The House <strong>of</strong> <strong>Modular</strong> <strong>kaizen</strong> 13<br />
Chapter 3: Implementing Performance Improvement through <strong>Modular</strong> <strong>kaizen</strong> 23<br />
Chapter 4: A System View <strong>of</strong> the Disrupted Process 31<br />
Chapter 5: Focus on the Disruption – Develop the Response Team 45<br />
Chapter 6: <strong>Modular</strong> Flow for Rapid Cycle Improvement 55<br />
Chapter 7: Tri-Metric Matrix 69<br />
Chapter 8: Standardizing and Controlling the New System 77<br />
Chapter 9: Change Management 91<br />
Chapter 10: Daily Work Management: Using Quality Improvement<br />
Skills in Daily Work 101<br />
Appendices<br />
Appendix A: Dr. W. Edwards Deming 111<br />
Appendix B: Additional References 113<br />
Appendix C: Templates and Examples 117<br />
Appendix D: Author Biographies 133<br />
Index 135<br />
i<br />
_______________________________________________________________________<br />
<strong>Modular</strong> <strong>kaizen</strong>: Dealing with Disruptions
Acknowledgements<br />
After ten years <strong>of</strong> practicing and developing the concepts <strong>of</strong> <strong>Modular</strong> <strong>kaizen</strong>, the authors<br />
thank the Centers for Disease Control and Prevention (CDC) for making possible the<br />
publication <strong>of</strong> this book, supported by Cooperative Agreement Number 3U38HM000518.<br />
The contents <strong>of</strong> this book are solely the responsibility <strong>of</strong> the authors and do not<br />
necessarily represent the <strong>of</strong>ficial views <strong>of</strong> CDC.<br />
The authors are grateful to the <strong>Public</strong> <strong>Health</strong> <strong>Foundation</strong> in Washington, DC and to<br />
Ms. Deborah Alexander, Program Administrator at the <strong>Public</strong> <strong>Health</strong> <strong>Foundation</strong>, for her<br />
skilled editing <strong>of</strong> this book.<br />
This book represents an important new tool that health departments can use as they work<br />
to improve performance and outcomes under the National <strong>Public</strong> <strong>Health</strong> Improvement<br />
Initiative (NPHII).<br />
ii<br />
_______________________________________________________________________<br />
<strong>Modular</strong> <strong>kaizen</strong>: Dealing with Disruptions
Preface and Overview<br />
Dr. W. Edwards Deming, the twentieth century quality leader, is quoted as saying “A bad<br />
system will defeat a good person every time.” 1 People who have struggled with a poorly<br />
designed process can probably relate to that situation. The bad system grinds people<br />
down until they no longer care about the quality <strong>of</strong> the product or service delivered to the<br />
customer. People using a bad system take out their frustration on the customers who<br />
complain about the poor quality that they are receiving. This destructive cycle affects<br />
both the person using the bad process and those receiving the poor quality product or<br />
service.<br />
<strong>Public</strong> health budgets have taken a significant hit during the recent economic downturn,<br />
causing a reduction in workforce and increase in workload to meet community needs.<br />
This two-edged sword <strong>of</strong> forced change has encouraged an interruptive crisis approach to<br />
daily work. The increasing use <strong>of</strong> mobile communications has further exacerbated this<br />
short-term, “quickly-respond-to-crises” culture. Constantly responding to crises takes a<br />
toll on the employees involved. Frequent crises increase employee stress levels by<br />
constantly pulling staff away from daily work which must be accomplished to meet longterm<br />
customer needs.<br />
The authors have experimented with numerous quality improvement (QI) approaches to<br />
improve working environments which generate a “bad system.” Over the years we have<br />
encountered many different types <strong>of</strong> organizational problems. We are always intrigued<br />
with the way organizations handle a major crisis disruption to their day-to-day<br />
environment. The usual response is a rapid, reactive, non-data-driven approach which<br />
usually makes the problem worse. Organizations that get into a crisis rarely take the time<br />
to check before doing anything. Rather than spend the time to check the reality <strong>of</strong> their<br />
current situation, they quickly take action on very limited information. Many times these<br />
quick responses make the situation worse and harder to correct.<br />
The authors have developed a concept called <strong>Modular</strong> <strong>kaizen</strong> to address the need for<br />
continuous improvement within public health’s highly interruptive environment. All <strong>of</strong><br />
the components <strong>of</strong> an effective Kaizen event are planned; however, the activities are<br />
scheduled in small segments that fit the rapidly changing calendar <strong>of</strong> team members and<br />
subject matter experts. This approach is complimentary to both the Plan-Do-Check-Act<br />
(PDCA) and Define, Measure, Analyze, Improve, Control (DMAIC) models <strong>of</strong> QI. The<br />
basic PDCA approach, using tools designed for <strong>Modular</strong> <strong>kaizen</strong>, is introduced in Chapter<br />
2, The House <strong>of</strong> <strong>Modular</strong> <strong>kaizen</strong>. The more robust approach based on the DMAIC<br />
structure <strong>of</strong> Lean Six Sigma is <strong>of</strong>fered in Chapter 6, <strong>Modular</strong> Flow/Rapid Cycle.<br />
1 The Quote Garden: A Harvest <strong>of</strong> Quotes for Word Lovers. http://www.quotegarden.com/leanmanufacturing.html.<br />
Updated February 27, 2011. Accessed May 28, 2010. Appendix A has an introduction<br />
to Dr. W. Edwards Deming.<br />
iii<br />
_______________________________________________________________________<br />
<strong>Modular</strong> <strong>kaizen</strong>: Dealing with Disruptions
The <strong>Modular</strong> <strong>kaizen</strong> model starts with “check” to investigate and understand the situation<br />
to see if the disruption has a special cause or whether it is a normal variation <strong>of</strong> a standard<br />
process. Once the disruption is identified, the Limited Information Collection Principle 2<br />
guides data collection <strong>of</strong> performance measures to establish the severity and urgency <strong>of</strong><br />
the disruption, estimate who and what is impacted, and estimate the disruption timeline.<br />
The Limited Information Collection Principle is based on the premise that a problem<br />
cannot be solved by throwing data at it. Instead, it is important to gather information that<br />
is useful and relevant, continually questioning “what purpose does this information<br />
serve?” 3<br />
The next step is “act.” Based on the data gathered in “check,” the response team does one<br />
<strong>of</strong> the following:<br />
• Do nothing – continue to monitor the disruption until it has either dissipated<br />
or needs more attention. If more analysis is required, investigate by<br />
establishing a team to investigate the disruption and report back. The report<br />
back is in the form <strong>of</strong> a high-level scope document.<br />
• Respond by taking short-term actions that apply all available resources to<br />
stabilize the process. A PDCA cycle is employed to solve the disruption and<br />
bring it under control.<br />
In Chapter 3, Implementing Performance Management through <strong>Modular</strong> <strong>kaizen</strong>, the<br />
beginning <strong>of</strong> this approach is documented when a major disruption hit a hospital<br />
unexpectedly.<br />
<strong>Modular</strong> <strong>kaizen</strong> is effectively structured to take advantage <strong>of</strong> an assessment <strong>of</strong> the eight<br />
Lean Wastes (<strong>Table</strong> 2.1) during process improvement activities. Pre-project planning<br />
provides a platform for identifying potential areas <strong>of</strong> waste before resources are expended<br />
on early measurement activities. This priority setting encourages experiments designed to<br />
identify effective data gathering based on operational feedback. Because project<br />
milestones are <strong>of</strong>ten set more widely apart than normal Kaizen events, less pressure is<br />
placed on teams to rush sampling or other observational activities during the assessment<br />
phase.<br />
The word Kaizen comes from the Japanese words “kai” which means change and “zen”<br />
which means good. Today Kaizen means good change or continuous improvement<br />
towards a standard <strong>of</strong> excellence. A traditional Kaizen event is a problem-solving<br />
approach that requires training and facilitation to analyze and re-orient a process. The<br />
overall concept <strong>of</strong> Kaizen is a system that encourages everyone to suggest incremental<br />
changes, eliminating “one time” improvement events. Under Kaizen the organization is<br />
2 H<strong>of</strong>fherr G, Moran J, Nadler G. Breakthrough Thinking in Total Quality Management. Englewood Cliffs,<br />
NJ: PTR Prentice Hall; 1994.<br />
3 H<strong>of</strong>fherr G, Moran J, Nadler G. Breakthrough Thinking in Total Quality Management. Englewood Cliffs,<br />
NJ: PTR Prentice Hall; 1994.<br />
iv<br />
_______________________________________________________________________<br />
<strong>Modular</strong> <strong>kaizen</strong>: Dealing with Disruptions
constantly improving. Kaizen does well in an organization that encourages and rewards<br />
teamwork and a customer-centric culture, using daily work management at all levels to<br />
make individual improvement.<br />
Two <strong>of</strong> the most common uses <strong>of</strong> Kaizen are:<br />
<br />
<br />
Kaizen Event –a problem-solving approach that requires training and<br />
facilitation to analyze and re-orient a process.<br />
Kaizen Blitz – same as an event but is focused on a short activity <strong>of</strong> two to<br />
eight days to improve a process and requires substantial use <strong>of</strong> human<br />
resources for this time period.<br />
This book is about the use <strong>of</strong> <strong>Modular</strong> <strong>kaizen</strong>, defined as the improvement or redesign<br />
project planned along a timeline that recognizes the highly volatile nature <strong>of</strong> the public<br />
health organization’s core business processes. High-priority projects are planned at the<br />
senior leadership level to establish realistic milestones, resources, and measurements to<br />
ensure a return on investment that includes not only financial commitment but also the<br />
involvement <strong>of</strong> highly skilled facilitators and subject matter experts.<br />
<strong>Modular</strong> <strong>kaizen</strong> is not a training event but is an interactive, consultant-led, problemsolving<br />
process that utilizes in-house subject matter experts to minimize disruption to<br />
regularly scheduled organizational activities. The <strong>Modular</strong> <strong>kaizen</strong> flow is shown in<br />
Figure 1.<br />
Plan<br />
<strong>Modular</strong> <strong>kaizen</strong> Flow<br />
Act<br />
Do/<br />
Disrupt<br />
Check<br />
check<br />
Do<br />
<strong>Modular</strong><br />
<strong>kaizen</strong><br />
act<br />
Plan<br />
Figure 1: <strong>Modular</strong> <strong>kaizen</strong> improvement cycle flow<br />
A <strong>Modular</strong> <strong>kaizen</strong> approach minimizes disruptions by making sure no “act” is executed<br />
until “check” has been done to establish the baseline measurement <strong>of</strong> where a disruption<br />
begins. When any action is taken, it is taken in an informed manner and is short-term in<br />
nature. Once the disruption is fully understood, it is appropriate to charter a team to<br />
v<br />
_______________________________________________________________________<br />
<strong>Modular</strong> <strong>kaizen</strong>: Dealing with Disruptions
develop a plan using the complete PDCA cycle that can then be implemented. This<br />
second cycle <strong>of</strong> “check” and “act” validates (checks) the final improved outcome and acts<br />
to document the changes for future sustainability.<br />
This small c and a cycle is the basis <strong>of</strong> <strong>Modular</strong> <strong>kaizen</strong>, as shown in Figure 2. The<br />
iterative nature <strong>of</strong> rapid cycle improvement, as described in Chapter 6, <strong>Modular</strong><br />
Flow/Rapid Cycle, is the key to sustaining and improving the integrated set <strong>of</strong> core<br />
processes which comprise the organization as a whole.<br />
check<br />
act<br />
Figure 2: Check-act iterative improvement cycle<br />
The <strong>Modular</strong> <strong>kaizen</strong> approach minimizes disruption by making sure no “action” is<br />
executed until “check” has been done and data has been analyzed to identify the reality <strong>of</strong><br />
the current situation. <strong>Modular</strong> <strong>kaizen</strong> is an approach that resists the urge to respond to a<br />
disruption with panic. Once the process is stabilized, a full PDCA cycle is undertaken to<br />
develop a plan and action steps to minimize the recurrence <strong>of</strong> the disruption proactively.<br />
The final step at the end <strong>of</strong> any <strong>Modular</strong> <strong>kaizen</strong> activity is to document successes and<br />
lessons learned. Sharing the benefit <strong>of</strong> this planned modular improvement approach to<br />
crisis strengthens the total organizational leadership system.<br />
vi<br />
_______________________________________________________________________<br />
<strong>Modular</strong> <strong>kaizen</strong>: Dealing with Disruptions
Chapter 1: The Value <strong>of</strong> Performance Management<br />
Performance Management as a Driver for <strong>Modular</strong> <strong>kaizen</strong> activities<br />
Performance management is the practice <strong>of</strong> actively using performance data to improve<br />
the public’s health. This practice involves strategic use <strong>of</strong> performance measures and<br />
standards to establish performance targets and goals. Performance management practices<br />
can be used to prioritize and allocate resources; to inform managers about necessary<br />
adjustments or changes in policies or programs; to frame reports on success in meeting<br />
performance goals; and to improve the quality <strong>of</strong> public health practice. Performance<br />
management uses a set <strong>of</strong> management and analytic processes supported by technology<br />
that enables an organization to define strategic goals and then measure and manage<br />
performance against those goals. Core performance management processes include goal<br />
setting, financial planning, operational planning, consolidation <strong>of</strong> data, reporting, data<br />
analysis, quality improvement (QI), evaluation <strong>of</strong> results, and monitoring <strong>of</strong> key<br />
performance indicators. The focus <strong>of</strong> these performance management activities is to<br />
ensure that goals are consistently met in an effective and efficient manner by an<br />
organization, a department, or an employee.<br />
<strong>Modular</strong> <strong>kaizen</strong> is an approach to help performance managers reach the goals that they<br />
have set for their public health agency. <strong>Modular</strong> <strong>kaizen</strong> ties key performance indicators to<br />
priority process improvement activities. Performance management maintains the ongoing<br />
monitoring <strong>of</strong> critical operations within the organization. Strategic planning based upon<br />
customer requirements establishes essential outcomes that define organizational success<br />
and optimum results. Strategic business assessment on at least an annual basis provides<br />
feedback on what outcomes are being met and where gaps are within critical outcomes.<br />
Performance management uses both leading and lagging indicators 1 to anticipate and<br />
track performance relative to internal and external customer requirements. The planning<br />
and milestone design <strong>of</strong> improvement efforts reflected through <strong>Modular</strong> <strong>kaizen</strong> aligns<br />
activities to key performance indicators which support priority outcomes <strong>of</strong> the<br />
organization.<br />
The Importance <strong>of</strong> Performance Management<br />
Applying performance management techniques has measurably improved quality,<br />
outputs, and outcomes <strong>of</strong> public health services. The coordinated efforts <strong>of</strong> performance<br />
management strategies can impact an agency in a number <strong>of</strong> ways. Some <strong>of</strong> the ways<br />
performance management can positively influence a public health agency include:<br />
<br />
<br />
better return on dollars invested in health;<br />
greater accountability for funding and increases in the public’s trust;<br />
1 Bialek R, Duffy G, Moran J. The <strong>Public</strong> <strong>Health</strong> Quality Improvement Handbook. Milwaukee, WI:<br />
Quality Press; 2009.<br />
1<br />
________________________________________________________________________<br />
<strong>Modular</strong> <strong>kaizen</strong>: Dealing with Disruptions Chapter 1
educed duplication <strong>of</strong> efforts;<br />
better understanding <strong>of</strong> public health accomplishments and priorities among<br />
employees;<br />
partners, and the public;<br />
increased sense <strong>of</strong> cooperation and teamwork;<br />
increased emphasis on quality, rather than quantity; and<br />
improved problem-solving.<br />
The Accountable Government Initiative - an Update on Our Performance Management<br />
Agenda states that performance management efforts for 2011 are focused on six strategies<br />
that have the highest potential for achieving meaningful performance improvement<br />
within and across Federal agencies. 2<br />
1. Driving agency top priorities;<br />
2. Cutting waste;<br />
3. Reforming contracting;<br />
4. Closing the Information Technology gap;<br />
5. Promoting accountability and innovation through open government;<br />
6. Attracting and motivating top talent.<br />
The President’s Management Council (PMC) – a group <strong>of</strong> agency deputy secretaries<br />
chaired by Jeffrey Zients – is overseeing the effort to achieve these goals. Working with<br />
partners in Congress, the PMC is pursuing a management agenda that embraces<br />
technological innovations and management best practices to improve effectiveness,<br />
efficiency, and customer service. This updated directive from 2010 gives more specific<br />
definition to the concept <strong>of</strong> performance management than was available in previous<br />
initiatives.<br />
Effective PM Drives <strong>Modular</strong> <strong>kaizen</strong> Project Design<br />
Performance management involves quantitative and qualitative measures which<br />
accurately reflect the true achievement <strong>of</strong> operations against established standards. <strong>Health</strong><br />
departments are governed by local, state, regional or federal standards, based upon<br />
legislation, funding bodies, or community objectives. These standards usually specify<br />
outcomes such as percentage <strong>of</strong> population served, number <strong>of</strong> tests completed,<br />
vaccinations administered, or rate <strong>of</strong> disease encountered within a representative sample.<br />
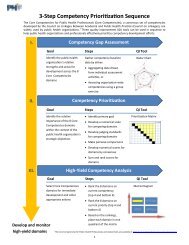
Figure 1.1 illustrates the sequence generally employed to establish effective performance<br />
measures for critical health department processes. The health agency senior staff<br />
document leadership direction through mission, vision, and overall department<br />
objectives. Based upon this operational foundation, an annual to 3-year strategic plan is<br />
2 Zients, JD. (2010, September 14) The Accountable Government Initiative – an Update on Our<br />
Performance Management Agenda. Memorandum for the senior executive service, Washington, DC.<br />
2<br />
________________________________________________________________________<br />
<strong>Modular</strong> <strong>kaizen</strong>: Dealing with Disruptions Chapter 1
generated. This strategic plan is validated based upon an assessment <strong>of</strong> needs, reflecting<br />
customer requirements, as identified by target populations, stakeholders, community<br />
partners, funding sources, and other priority inputs.<br />
Once critical outcomes are identified, measures are established to monitor activities<br />
which support the necessary outcomes related to each priority. Measures may be interim<br />
milestones which track ongoing activities to enable long-term achievements or terminal<br />
measures documenting the final achievement <strong>of</strong> required outcomes. The Turning Point<br />
Model, developed by The Turning Point Performance Management National Excellence<br />
Collaborative, 3 is an effective approach for both interim and outcome measures for<br />
performance management within health departments.<br />
Focus effective performance measures through alignment to<br />
organizational objectives<br />
Leadership Strategic Plan Customers Measures<br />
•S ‐ Skills/Style<br />
•W – Risks<br />
•O – Opportunity<br />
•T – Barriers<br />
(Individual)<br />
•Organization Design •Needs/Pr<strong>of</strong>iles •Key Performance<br />
Indicators<br />
•Infrastructure •Direct interviews<br />
•Regulations/Standards<br />
•High Level Process Map •Best practices<br />
•Org. Level SWOT<br />
•Outcomes<br />
•Complaints<br />
•Outputs<br />
•Industry research<br />
•Interim milestones<br />
•Competitive analysis<br />
•Monitor & control<br />
•QFD<br />
Figure 1.1: Performance Management measures must align with organizational<br />
objectives<br />
Performance Management Results in <strong>Public</strong> <strong>Health</strong><br />
According to the February 2002 Performance Management National Excellence Collaborative<br />
(PMC) Survey on Performance Management Practices in States: Results <strong>of</strong> a<br />
3 The Turning Point Performance Management National Excellence Collaborative. From Silos to Systems:<br />
Using Performance Management to Improve the <strong>Public</strong>’s <strong>Health</strong>. Washington, DC: <strong>Public</strong> <strong>Health</strong><br />
<strong>Foundation</strong>; 2002.<br />
3<br />
________________________________________________________________________<br />
<strong>Modular</strong> <strong>kaizen</strong>: Dealing with Disruptions Chapter 1
Baseline Assessment <strong>of</strong> State <strong>Health</strong> Agencies, 4 76 percent <strong>of</strong> responding state health<br />
agencies reported that their performance management efforts resulted in improved<br />
performance. Most reported that performance improvement pertained to:<br />
<br />
<br />
<br />
improved delivery <strong>of</strong> services (program, clinical, preventive) and the ten<br />
Essential <strong>Public</strong> <strong>Health</strong> Services;<br />
improved administration/management, contracting, tracking/reporting,<br />
coordination; and<br />
improved policies or legislation.<br />
More current activities continue to support the use <strong>of</strong> performance management to<br />
prioritize and drive efficient improvements within local, state, tribal, and territorial health<br />
departments. During the second half <strong>of</strong> the last decade, driven by the vision <strong>of</strong> <strong>Health</strong>y<br />
People 2010, many health departments became involved in self-assessments through<br />
initiatives such as the National <strong>Public</strong> <strong>Health</strong> Performance Standards Program and began<br />
identifying formal processes and measures to meet requirements set by federal, state, or<br />
other funding organizations.<br />
On the local level in Florida, one <strong>of</strong> the authors has been involved with the Orange<br />
County <strong>Health</strong> Department (OCHD) since 2006 in a series <strong>of</strong> process improvement team<br />
efforts focused on improving testing processes for sexually transmitted diseases (STD)<br />
and immunology, reducing cycle time <strong>of</strong> Septic System Permitting and implementing an<br />
Integrated Quality System across the total health department. A case study <strong>of</strong> the OCHD<br />
STD 2006 project is available through the <strong>Public</strong> <strong>Health</strong> <strong>Foundation</strong> website. 5 Additional<br />
process improvement and redesign activities were undertaken during 2008 and 2009,<br />
using the Lean Six Sigma approach to QI. 6<br />
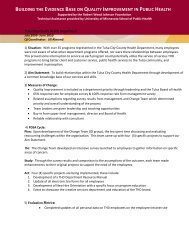
The Orange County <strong>Health</strong> Department in Florida chartered a QI team to reduce total<br />
time for administering child immunizations. Figure 1.2 is a Value Stream Map measuring<br />
how long each major step in the immunization process took before the process was<br />
improved. The QI team identified a number <strong>of</strong> disruptions to the process, including times<br />
when patients’ families were waiting to be interviewed and times for children to receive<br />
their immunizations. Note the triangle shapes, indicating that between 8 and 12 patients<br />
were waiting at each clinic “station” during the complete flow <strong>of</strong> the process. Once the<br />
inefficiencies in the process were identified, the QI team and the immunization nurse<br />
manager redesigned the clinic flow. As a result, all waiting was removed. Patient time<br />
was reduced from 33 to 4 minutes, while overall process time was reduced from 16 to 11<br />
minutes.<br />
4 The Turning Point National Excellence Collaborative. Turning Point Survey on Performance<br />
Management Practices in States: Results <strong>of</strong> a Baseline Assessment <strong>of</strong> State <strong>Health</strong> Agencies. Seattle, WA:<br />
Turning Point National Program Office at the University <strong>of</strong> Washington; 2002.<br />
5 <strong>Public</strong> <strong>Health</strong> <strong>Foundation</strong>. Orange County Quality Improvement Project.<br />
http://www.phf.org/programs/PMQI/Pages/Orange_County_Quality_Improvement_Project.aspx. Updated<br />
2011. Accessed February 19, 2011.<br />
6 Duffy G, Moran J, Riley W. Quality Function Deployment and Lean-Six Sigma Applications in <strong>Public</strong><br />
<strong>Health</strong>. Milwaukee, WI: Quality Press; 2010.<br />
4<br />
________________________________________________________________________<br />
<strong>Modular</strong> <strong>kaizen</strong>: Dealing with Disruptions Chapter 1
Additional efficiency gained through correcting inaccurate and missing client data<br />
resolved significant disruption to the immunization team as well as to the billing<br />
department. Reliability <strong>of</strong> information within the customer record allowed asynchronous<br />
access to the information by billing and expedited checkout so that it could be collapsed<br />
into the previous process step. Reducing the patient time required to go through the<br />
immunization process increased the reputation <strong>of</strong> the clinic. Word <strong>of</strong> mouth among the<br />
customer base encouraged more <strong>of</strong> the population to use child immunization services.<br />
How Departments Can Use Performance Management<br />
QI efforts are critical at all levels <strong>of</strong> the organization. Certainly the commitment <strong>of</strong> senior<br />
management in setting and maintaining a culture <strong>of</strong> performance and quality is<br />
imperative to long-term success. Involving the direct workforce in the identification and<br />
resolution <strong>of</strong> performance problems on a daily basis is also imperative for effectiveness.<br />
Line and staff management are in a good position to see both the strategic direction<br />
coming from senior <strong>of</strong>ficers as well as the individual contribution <strong>of</strong> the line worker.<br />
Medical<br />
Records<br />
Database<br />
0-8 0-10<br />
0-12<br />
Registration<br />
Review<br />
Records<br />
Give<br />
Immunization<br />
Check Out &<br />
Charge Sheet<br />
8 mins 10 mins 15 mins<br />
33 mins<br />
5 minutes 3 minutes 3 minutes 5 minutes<br />
16 minutes<br />
Figure 1.2: Value Stream Map for performance <strong>of</strong> child immunization process<br />
Some <strong>of</strong> the important contributions <strong>of</strong> middle managers in performance management<br />
are:<br />
<br />
<br />
<br />
<br />
Identify aspects <strong>of</strong> the work that has and has not resulted in satisfactory results;<br />
Identify trends;<br />
Further investigate the nature <strong>of</strong> particular problems;<br />
Set targets for future periods;<br />
Motivate managers and staff to improve performance; increase their interest in<br />
5<br />
________________________________________________________________________<br />
<strong>Modular</strong> <strong>kaizen</strong>: Dealing with Disruptions Chapter 1
etter serving customers;<br />
Hold managers and staff accountable;<br />
Develop and improve programs and policies; and<br />
Help design policies and budgets and explain these to stakeholders. 7<br />
Improving Performance is About Using Data<br />
Performance management is the practice <strong>of</strong> actively using performance data to improve<br />
the public’s health. This practice involves strategic use <strong>of</strong> performance measures and<br />
standards to establish performance targets and goals. Performance management practices<br />
can also be used to prioritize and allocate resources; to inform managers about needed<br />
adjustments or changes in policy or program directions to meet goals; to frame reports on<br />
the success in meeting performance goals; and to improve the quality <strong>of</strong> public health<br />
practice.<br />
Performance management includes the following components evident in Figure 1.3:<br />
1. Performance standards—establishment <strong>of</strong> organizational or system<br />
performance standards, targets, and goals to improve public health practices.<br />
2. Performance measures—development, application, and use <strong>of</strong> performance<br />
measures to assess achievement <strong>of</strong> such standards.<br />
3. Reporting progress—documentation and reporting progress in meeting<br />
standards and targets and sharing this information through feedback.<br />
4. Quality improvement (QI)—establishment <strong>of</strong> a program or process to manage<br />
change and achieve QI in public health policies, programs, or infrastructure based<br />
on performance standards, measurements, and reports.<br />
The four components <strong>of</strong> Performance Management can be applied to:<br />
<br />
<br />
<br />
<br />
<br />
<br />
<br />
Human Resource Development;<br />
Data and Information Systems;<br />
Customer Focus and Satisfaction;<br />
Financial Systems;<br />
Management Practices;<br />
<strong>Public</strong> <strong>Health</strong> Programs and Services; and<br />
<strong>Health</strong> Status Improvement<br />
7 Lichiello P. Guidebook for Performance Measurement. Seattle, WA: Turning Point National Program<br />
Office, 1999: 48. www.turningpointprogram.org/Pages/lichello.pdf - Based on Hatry HP, Fall M, Singer<br />
TO, and Liner EB. Monitoring the Outcomes <strong>of</strong> Economic Development Programs. Washington, DC: The<br />
Urban Institute Press; 1990.<br />
6<br />
________________________________________________________________________<br />
<strong>Modular</strong> <strong>kaizen</strong>: Dealing with Disruptions Chapter 1
A performance management system is the continuous use <strong>of</strong> all <strong>of</strong> the above practices so<br />
that they are integrated into an agency’s core operations. Performance management can<br />
be carried out at multiple levels, including the programmatic, organizational, and local,<br />
state, tribal, and territorial levels.<br />
Figure 1.3: Performance Management Framework and Components 8<br />
Integrating Performance Management Techniques into Operations using<br />
<strong>Modular</strong> <strong>kaizen</strong><br />
Figure 1.3 is a high-level sequence for establishing performance management. <strong>Modular</strong><br />
<strong>kaizen</strong> is designed to focus on the strategic priorities <strong>of</strong> the organization. Once leadership<br />
has identified a strategic direction for the organization, properly collected customer<br />
requirements drive the highest priority objectives. Once key objectives are known, the<br />
next step is to set specific performance standards, targets, and goals to meet these<br />
objectives. Development, application, and use <strong>of</strong> performance measures make it possible<br />
to assess achievement <strong>of</strong> such standards. Measures designed to drive and assess progress<br />
toward high-priority objectives or outcomes are called key performance indicators.<br />
<strong>Modular</strong> <strong>kaizen</strong> depends upon the performance management system to measure the<br />
capacity, process, or outcomes <strong>of</strong> established performance standards and targets. It is<br />
most efficient for QI projects to use the same standards and measures which drive key<br />
8 The Turning Point Performance Management National Excellence Collaborative. From Silos to Systems:<br />
Using Performance Management to Improve the <strong>Public</strong>’s <strong>Health</strong>. Washington, DC: <strong>Public</strong> <strong>Health</strong><br />
<strong>Foundation</strong>; 2002.<br />
7<br />
________________________________________________________________________<br />
<strong>Modular</strong> <strong>kaizen</strong>: Dealing with Disruptions Chapter 1
priorities within the organization. This approach ensures that QI activities are most<br />
closely aligned with the most important outcomes.<br />
Reporting progress <strong>of</strong> improvement efforts is a critical component <strong>of</strong> <strong>Modular</strong> <strong>kaizen</strong>.<br />
Interim reporting is crucial for communicating milestones, validating findings, verifying<br />
assumptions, and escalating the resolution <strong>of</strong> obstacles to success. Reporting provides<br />
formal documentation for future improvement, archival, recognition, and best practice<br />
sharing. Reports and information should regularly be made available to managers, staff,<br />
and others, including community partners and funding providers.<br />
Finally, the fourth quadrant in the Turning Point model is the quality improvement (QI)<br />
process. <strong>Modular</strong> <strong>kaizen</strong> is part <strong>of</strong> the lean family <strong>of</strong> improvement models. Lean supports<br />
the establishment <strong>of</strong> a program or process to manage change and achieve QI in public<br />
health policies, programs, or infrastructure based on performance standards,<br />
measurements, and reports.<br />
The use <strong>of</strong> QI processes emphasizes the importance <strong>of</strong> the information included in a<br />
progress report or other document. A critical ending step for any effective QI effort is the<br />
development <strong>of</strong> a control plan for monitoring and sustaining the gains achieved by the<br />
improvement team. <strong>Modular</strong> <strong>kaizen</strong> uses the organization’s existing documentation<br />
process to manage changes in policies, programs, or infrastructure based on performance<br />
standards, measurements, and reports. If documentation processes do not yet exist for the<br />
organization, <strong>Modular</strong> <strong>kaizen</strong> is a valid approach for creating these processes. Chapter 4,<br />
The House <strong>of</strong> <strong>Modular</strong> <strong>kaizen</strong>, introduces a number <strong>of</strong> tools and techniques designed to<br />
guide a QI team through establishing efficient processes for improvement, measurement,<br />
and documentation.<br />
Examples <strong>of</strong> the Four Components<br />
A successful performance management system is driven by jurisdictional needs and is<br />
designed to align closely with a public health agency’s mission and strategic plans. <strong>Public</strong><br />
health agencies have applied the four components in a variety <strong>of</strong> ways.<br />
Performance Standards<br />
<strong>Public</strong> health agencies and their partners can benefit from using national standards, statespecific<br />
standards, benchmarks from other jurisdictions, or agency-specific targets to<br />
define performance expectations. The National <strong>Public</strong> <strong>Health</strong> Performance Standards<br />
Program (NPHPSP) defines performance in each <strong>of</strong> the ten Essential <strong>Public</strong> <strong>Health</strong><br />
Services for state and local public health systems and governing bodies. The NPHPSP<br />
supports users <strong>of</strong> the national standards with a variety <strong>of</strong> technical assistance products,<br />
including online data submission and an analytic report for the user jurisdiction. Some<br />
states have developed their own performance standards for local health departments.<br />
These state standards serve a variety <strong>of</strong> purposes, such as to provide a benchmark for<br />
continuous QI, to determine eligibility for state subsidies, or for self-assessments in<br />
meeting established standards.<br />
8<br />
________________________________________________________________________<br />
<strong>Modular</strong> <strong>kaizen</strong>: Dealing with Disruptions Chapter 1
The <strong>Public</strong> <strong>Health</strong> Accreditation Board (PHAB) has developed a national voluntary<br />
accreditation program for state, tribal, local, and territorial health departments. The goal<br />
<strong>of</strong> the accreditation program is to improve and protect the health <strong>of</strong> every community by<br />
advancing the quality and performance <strong>of</strong> health departments. 9<br />
It is important to set challenging but achievable targets. Achieving performance targets<br />
should require concerted efforts, resources, and managerial action. If targets can be<br />
achieved easily despite budget cuts and limited efforts, little motivation to improve<br />
performance or to invest in additional agency efforts is generated.<br />
Performance Measures<br />
To select specific performance measures, public health agencies may consult national and<br />
other sources as well as develop their own procedures to help them determine how to best<br />
assess and measure their organizations’ performance. Performance measures typically<br />
reflect jurisdictional needs and the feasibility <strong>of</strong> collecting the necessary data for<br />
measurement purposes.<br />
Reporting <strong>of</strong> Progress<br />
How a public health agency tracks and reports progress depends upon the purposes <strong>of</strong> its<br />
performance management system and the intended users <strong>of</strong> performance data. In Ohio,<br />
the Department <strong>of</strong> <strong>Health</strong> publishes periodic reports on key measures identified by<br />
Department staff, which are used by the agency for making improvements. Relevant state<br />
and national performance indicators are reviewed by representatives <strong>of</strong> all interested<br />
parties. Casting a wider net for reporting and accountability, the Virginia Department <strong>of</strong><br />
<strong>Health</strong> established resources at www.vdh.state.va.us 10 to make performance reports and<br />
planning information accessible to policy makers, public health partners, agency<br />
employees, and citizens.<br />
Donabedian’s 11 assessment framework <strong>of</strong> structures, processes, and outcomes can help<br />
public health agencies examine performance in distinct aspects <strong>of</strong> their system. An<br />
optimal performance management approach creates feedback loops around all three<br />
aspects. <strong>Public</strong> health performance should be managed for:<br />
1. structures such as financial and information resources<br />
2. processes such as health promotion and epidemiology services<br />
3. outcomes such as health status and cost savings<br />
For an illustration <strong>of</strong> a continuous performance feedback loop involving structural<br />
capacity, processes, and outcomes related to public health, refer to the performance<br />
9 <strong>Public</strong> <strong>Health</strong> Accreditation Board. www.phaboard.org. Accessed March 2, 2011.<br />
10 Virginia Department <strong>of</strong> <strong>Health</strong>. www.vdh.state.va.us. Accessed February 28, 2011.<br />
11 Donabedian, A. The quality <strong>of</strong> care. How can it be assessed? Journal <strong>of</strong> the American Medical<br />
Association. 1988; 260:1743-8.<br />
9<br />
________________________________________________________________________<br />
<strong>Modular</strong> <strong>kaizen</strong>: Dealing with Disruptions Chapter 1
measurement model in Figure 1.4. In the model, the macro or community context <strong>of</strong><br />
public health translates into an integrated system <strong>of</strong> structural capacity and process<br />
guided by the public health system’s mission and purpose. This integrated system drives<br />
the effectiveness, efficiency, and equity <strong>of</strong> the outcomes <strong>of</strong> the local public health system.<br />
M<br />
A<br />
C<br />
R<br />
O<br />
C<br />
O<br />
N<br />
T<br />
E<br />
X<br />
T<br />
P<br />
U<br />
B<br />
L<br />
I<br />
C<br />
H<br />
E<br />
A<br />
L<br />
T<br />
H<br />
S<br />
Y<br />
S<br />
T<br />
E<br />
M<br />
PHS Mission<br />
and Purpose<br />
Philosophy<br />
Goals<br />
“Core Functions”<br />
Structural Capacity<br />
Information Resources<br />
Organizational Resources<br />
Physical Resources<br />
Human Resources<br />
Fiscal Resources<br />
Processes<br />
The 10 Essential<br />
<strong>Public</strong> <strong>Health</strong><br />
Services<br />
Outcomes<br />
Effectiveness<br />
Efficiency<br />
Equity<br />
Figure 1.4: Conceptual Framework <strong>of</strong> the <strong>Public</strong> <strong>Health</strong> System as a Basis for<br />
Measuring Systems Performance 12<br />
Performance management, through setting standards, identifying efficient and effective<br />
measures, reporting progress and continuously improving based upon key performance<br />
indicators, establishes a foundation for QI. <strong>Modular</strong> <strong>kaizen</strong> uses this performance<br />
management system to focus on the highest impact improvements while integrating<br />
improvement activities into the daily management <strong>of</strong> the organization. The activityoriented<br />
format <strong>of</strong> <strong>Modular</strong> <strong>kaizen</strong> recognizes the systemic integration <strong>of</strong> critical health<br />
department processes while allowing for interruption <strong>of</strong> improvement efforts based upon<br />
the priority <strong>of</strong> department outcomes. Key performance indicators are the foundation for<br />
organizing improvement activities in tasks which can be accomplished in tandem with<br />
daily management.<br />
12 Handler A, Issel M, and Turnock B. A conceptual framework to measure performance <strong>of</strong> the public<br />
health system. American Journal <strong>of</strong> <strong>Public</strong> <strong>Health</strong>. 2001, 91: 1235–1239.<br />
10<br />
________________________________________________________________________<br />
<strong>Modular</strong> <strong>kaizen</strong>: Dealing with Disruptions Chapter 1
Quality Improvement Process<br />
An established QI process brings consistency to the agency’s approach to managing<br />
performance, motivates improvement, and helps capture lessons learned. An established<br />
QI process may focus on an aspect <strong>of</strong> performance, such as customer satisfaction, or cut<br />
across the entire health agency. Rather than leave the use <strong>of</strong> performance data to chance,<br />
some health departments have instituted processes to ensure that they continually take<br />
actions to improve performance and accountability. In its highly dynamic process for<br />
system-wide improvement, the Florida Department <strong>of</strong> <strong>Health</strong> charges its Performance<br />
Improvement Office with coordinating resources and efforts to perform regular<br />
performance management reviews and provide feedback to managers and local county<br />
administrators. As part <strong>of</strong> the state’s QI process, state and local staff develop<br />
collaborative agreements that specify what each party will do to help improve<br />
performance in identified areas.<br />
11<br />
________________________________________________________________________<br />
<strong>Modular</strong> <strong>kaizen</strong>: Dealing with Disruptions Chapter 1
12<br />
________________________________________________________________________<br />
<strong>Modular</strong> <strong>kaizen</strong>: Dealing with Disruptions
Chapter 2: The House <strong>of</strong> <strong>Modular</strong> <strong>kaizen</strong><br />
Introduction<br />
<strong>Modular</strong> <strong>kaizen</strong> is based on the concept <strong>of</strong> Lean Enterprise 1 , which uses tools for efficient<br />
use <strong>of</strong> resources across the whole system <strong>of</strong> interrelated processes. Traditional lean tools<br />
grew out <strong>of</strong> the automotive and industrial sectors and over time were modified to support<br />
service and other transactional environments. <strong>Modular</strong> <strong>kaizen</strong> modifies many <strong>of</strong> the same<br />
tools for a highly interruptive, fast-paced workplace.<br />
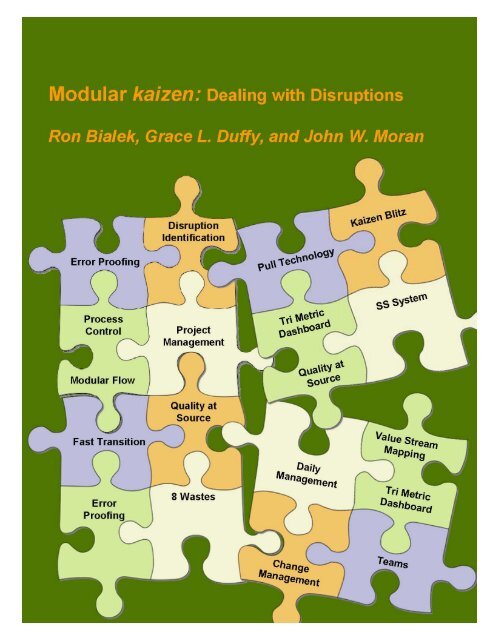
Figure 2.1 lists the major tools <strong>of</strong> <strong>Modular</strong> <strong>kaizen</strong>. These tools are designed to assess<br />
current state performance, identify process disruptions, and reduce or eliminate any waste<br />
which reduces the efficiency <strong>of</strong> the overall flow <strong>of</strong> operations.<br />
Figure 2.1: The House <strong>of</strong> <strong>Modular</strong> <strong>kaizen</strong><br />
As shown in Figure 2.1, the foundation for any improvement effort is Change<br />
Management. Chapter 9 describes the basic requirements for managing change. <strong>Modular</strong><br />
<strong>kaizen</strong> uses change management to anticipate potential change to the organization.<br />
1 Beecr<strong>of</strong>t GD. Duffy G. Moran J. The Executive Guide to Improvement and Change. Milwaukee, WI:<br />
Quality Press; 2002.<br />
13<br />
________________________________________________________________________<br />
<strong>Modular</strong> <strong>kaizen</strong>: Dealing with Disruptions Chapter 2
Change creates an opportunity for improvement. The entry into the House <strong>of</strong> <strong>Modular</strong><br />
<strong>kaizen</strong> is Value Stream Mapping, the technique for identifying opportunities for<br />
efficiency and elimination <strong>of</strong> process waste.<br />
PDCA: Use <strong>of</strong> the <strong>Modular</strong><br />
<strong>kaizen</strong> basic tools<br />
Act<br />
7: Tri‐metric dashboard<br />
13: Process control<br />
Plan<br />
2: Value stream mapping<br />
4: Disruption identification<br />
7: Tri‐metric dashboard<br />
13: Process control<br />
Act<br />
Plan<br />
Check<br />
Do<br />
Check<br />
3: 5S<br />
5: 8‐Wastes<br />
6: Force & Effect + ca<br />
7: Tri‐metric dashboard<br />
13: Process control<br />
Structure<br />
1: Change management<br />
8: Teams<br />
9: Project management<br />
17: Daily work management<br />
Do<br />
10: Kaizen blitz<br />
11: Error pro<strong>of</strong>ing<br />
12: Quality at source<br />
14: Fast transition<br />
16: <strong>Modular</strong> flow<br />
Figure 2.2: Sequence <strong>of</strong> <strong>Modular</strong> <strong>kaizen</strong> tools by PDCA phase<br />
Figure 2.2 suggests a sequence for using the tools <strong>of</strong> <strong>Modular</strong> <strong>kaizen</strong> within the Plan–Do–<br />
Check–Act (PDCA) cycle for process improvement. Strategic tools are used to establish<br />
an overall structure to support PDCA activities. During the Plan phase <strong>of</strong> the PDCA<br />
cycle, measures are used to identify any disruption to the expected process flow.<br />
Opportunities for improvement are prioritized based upon an integrated performance<br />
management system, tracking key objectives <strong>of</strong> the organization. Chapter 3 describes the<br />
value <strong>of</strong> alignment to organizational priorities using performance management. The Do<br />
phase uses tools to test improvement options for the best alternative, based upon<br />
resources available in the time allowed. The <strong>Modular</strong> <strong>kaizen</strong> tools suggested during the<br />
Check phase focus attention on specific areas <strong>of</strong> disruption, while performance<br />
management again is the basis <strong>of</strong> the Act phase, where updated processes are<br />
standardized for ongoing sustainment <strong>of</strong> efficiencies.<br />
14<br />
________________________________________________________________________<br />
<strong>Modular</strong> <strong>kaizen</strong>: Dealing with Disruptions Chapter 2
The Evolution <strong>of</strong> the House <strong>of</strong> <strong>Modular</strong> <strong>kaizen</strong><br />
The <strong>Modular</strong> <strong>kaizen</strong> set <strong>of</strong> tools is closely related to the traditional Lean Enterprise tool<br />
bag. Figure 2.3 is the traditional House <strong>of</strong> Lean as described by George Alukal and<br />
Anthony Manos. 2 The terminology describing the individual tools in the traditional<br />
House is based upon manufacturing applications. Success using the lean tools within<br />
manufacturing created interest by other industries in realizing the same efficiencies. Early<br />
work by Michael George 3 using lean combined with Six Sigma tools within the service<br />
industry encouraged many organizations to modify the initial manufacturing tools to a<br />
broad range <strong>of</strong> industries, including healthcare, non-pr<strong>of</strong>it, government, and others.<br />
Kaizen-Continuous Improvement<br />
Pull/Kanban<br />
Cellular/Flow<br />
Total Productive Maintenance<br />
Quality at Source<br />
Point-<strong>of</strong>-Use-Storage<br />
Quick Changeover<br />
Standardized Work Batch Reduction Teams<br />
5S System Visual Controls Streamlined Layout<br />
Value<br />
Stream<br />
Mapping<br />
Change Management<br />
Figure 2.3: Traditional House <strong>of</strong> Lean<br />
The building blocks <strong>of</strong> the traditional “House <strong>of</strong> Lean” include:<br />
Change Management: Change management is a process which helps to define the step[s<br />
necessary to achieve a desired outcome.<br />
Value Stream Mapping (VSM): VSM is a special type <strong>of</strong> process map that examines<br />
flow within a process with the intent <strong>of</strong> maximizing efficiency and eliminating waste or<br />
non-value added steps.<br />
2 Beecr<strong>of</strong>t GD. Duffy G. Moran J. The Executive Guide to Improvement and Change. Milwaukee, WI:<br />
Quality Press; 2002.<br />
3 George M. Lean Six Sigma for Service. New York: McGraw-Hill; 2003.<br />
15<br />
________________________________________________________________________<br />
<strong>Modular</strong> <strong>kaizen</strong>: Dealing with Disruptions Chapter 2
5S System: 5S is a visual method <strong>of</strong> setting the workplace in order. It is a system for<br />
workplace organization and standardization. The five steps that go into this technique all<br />
start with the letter S in Japanese (seiri, seiton, seison, seiketsu and shitsuke). These five<br />
terms are loosely translated as Sort, Set in order, Shine, Standardize, and Sustain in<br />
English. This Lean Six Sigma (LSS) tool is used <strong>of</strong>ten in both front and back <strong>of</strong>fice<br />
applications. Clean, orderly workplaces reduce both aural and visual noise.<br />
Visual Controls: The placement in plain view <strong>of</strong> all tooling, parts, production activities<br />
and indicators so that everyone involved can understand the status <strong>of</strong> the system at a<br />
glance is crucial. Labeling <strong>of</strong> storage cabinets, closets, and other workstation resources is<br />
an example <strong>of</strong> this tool, along with diagrams <strong>of</strong> frequently performed activities for either<br />
customers or staff.<br />
Streamlined Layout: A workplace needs to be designed according to optimum<br />
operational sequence. Value stream mapping is a means <strong>of</strong> representing flow <strong>of</strong> the<br />
product or service through the process. A few <strong>of</strong> the important components <strong>of</strong> this flow<br />
include value-added activities, non-value-added activities, non-value-added but necessary<br />
activities, work in process (WIP), inventory (queues), processing time, and lead time.<br />
Standardized Work: The consistent performance <strong>of</strong> a task according to prescribed<br />
methods without waste and focused on ergonomic movement is important. Spaghetti<br />
diagrams are a visual representation, using a continuous flow line to trace the path <strong>of</strong> a<br />
task or activity through a process.<br />
Batch Reduction: The best batch size is one-piece flow. If one-piece flow is not<br />
appropriate, the batch size should be reduced to the smallest size possible.<br />
Teams: In the lean environment, emphasis is on working in teams, whether they are<br />
process improvement teams or daily work teams. Lean Six Sigma incorporates the use <strong>of</strong><br />
teams whenever possible to provide multiple perspectives for decision-making and<br />
problem-solving.<br />
Quality at Source: Inspection and process control by front line employees helps them to<br />
be certain that the product or service that is passed on to the next process is <strong>of</strong> acceptable<br />
quality. Since staffing is usually tight, having the skills readily available by more than<br />
one person in the <strong>of</strong>fice saves time and provides backup within the <strong>of</strong>fice.<br />
Point-<strong>of</strong>-Use-Storage: Raw material, parts, information, tools, work standards,<br />
procedures, etc. should be stored where needed. Natural work teams within a department<br />
<strong>of</strong>ten design a common work area to maximize availability <strong>of</strong> supplies and work stations<br />
for effectiveness <strong>of</strong> staff within the <strong>of</strong>fice.<br />
Quick Changeover: The ability to change staff or equipment rapidly, usually in minutes,<br />
so that multiple products in smaller batches can be run on the same equipment is crucial.<br />
Another common application is the consolidation <strong>of</strong> computerized data input systems so<br />
16<br />
________________________________________________________________________<br />
<strong>Modular</strong> <strong>kaizen</strong>: Dealing with Disruptions Chapter 2
that staff does not have to take one program down and bring up another to input different<br />
forms when working with the same customer.<br />
Pull/Kanban: This system <strong>of</strong> cascading production and delivery instructions from<br />
downstream to upstream activities directs that the upstream supplier does not produce<br />
until the downstream customer signals a need, using a “Kanban” system.<br />
Cellular/Flow: Physically linking and arranging manual and machine process steps into<br />
the most efficient combination to maximize value-added content while minimizing waste<br />
leads to single-piece flow.<br />
Total Productive Maintenance: This lean equipment maintenance strategy maximizes<br />
overall equipment effectiveness. Although the title <strong>of</strong> this tool seems complex, it is really<br />
quite simple. Every <strong>of</strong>fice has equipment such as copiers, printers, or shredders that<br />
require scheduled maintenance, calibration, new release updates, etc. A preprinted<br />
checklist or electronic reminder system for when administrative, technical, or other<br />
programmatic updates are required minimizes downtime or lack <strong>of</strong> availability <strong>of</strong><br />
equipment when needed.<br />
Figure 2.1 uses the format <strong>of</strong> the traditional House <strong>of</strong> Lean to identify the major tools<br />
adjusted for the <strong>Modular</strong> <strong>kaizen</strong> application appropriate for highly ”interruption-driven”<br />
organizations. Some <strong>of</strong> the tools are pulled directly from the traditional lean techniques.<br />
Others have been slightly modified to support the modular nature <strong>of</strong> the planned<br />
improvement steps <strong>of</strong> <strong>Modular</strong> <strong>kaizen</strong>. Change management remains the foundation for<br />
<strong>Modular</strong> <strong>kaizen</strong>, just as it supports the traditional lean concepts. A Culture <strong>of</strong> QI requires<br />
the adoption <strong>of</strong> change on a continuous basis to maximize resources based upon<br />
flexibility and agility to meet customer requirements. The tool which identifies<br />
opportunities to employ the tools <strong>of</strong> <strong>Modular</strong> <strong>kaizen</strong> is also consistent with traditional<br />
lean concepts. Value Stream Mapping, as follow-on to flowcharting and processmapping,<br />
remains a robust vehicle for identifying disruptions and opportunities for<br />
improvement within existing processes or those under initial design.<br />
The tools within the House <strong>of</strong> <strong>Modular</strong> <strong>kaizen</strong> are:<br />
1. Change Management: A process which helps to define the steps necessary to<br />
achieve a desired outcome.<br />
2. Value Stream Mapping (VSM): A special type <strong>of</strong> process map that examines<br />
flow within a process with the intent <strong>of</strong> maximizing efficiency and eliminating<br />
waste <strong>of</strong> non-value added steps.<br />
3. 5S System: A visual method <strong>of</strong> setting the workplace in order. The use <strong>of</strong> 5S is<br />
no different under the concept <strong>of</strong> <strong>Modular</strong> <strong>kaizen</strong> or traditional lean. Although<br />
first documented for organizational effectiveness within manufacturing and<br />
assembly operations, 5S is successfully used in health department, hospitals, front<br />
<strong>of</strong>fices <strong>of</strong> small businesses, non-pr<strong>of</strong>its, and organizations <strong>of</strong> all types. Some<br />
simple examples <strong>of</strong> each <strong>of</strong> the five organizing activities are:<br />
17<br />
________________________________________________________________________<br />
<strong>Modular</strong> <strong>kaizen</strong>: Dealing with Disruptions Chapter 2
a. Sort – Separate items, documents, or ideas. Distinguish the necessary<br />
from the unnecessary. Get rid <strong>of</strong> what no longer holds value. Free up<br />
space for other materials and ideas that support the organization more<br />
effectively.<br />
b. Straighten – “A place for everything and everything in its place” is<br />
applicable for this step. Pegboards with locations clearly marked in a<br />
home garage or workshop, the numbering and proper placement <strong>of</strong> books<br />
in a library, or organization <strong>of</strong> the supply cabinet in the <strong>of</strong>fice so that it is<br />
neat and easy to use would exemplify the result <strong>of</strong> straightening.<br />
c. Shine – Tidying the copier room, washing and waxing the reception area,<br />
keeping oil and grease <strong>of</strong>f <strong>of</strong> the automobile service bay floor, or keeping<br />
equipment clean in the laboratory exemplify this step.<br />
d. Standardize – It is helpful to have as few different ways to perform<br />
frequent activities as possible. Monitor and maintain the first three S’s.<br />
Standardized processes, workflows, documentation and equipment, where<br />
possible, simplify the workplace. This element facilitates cross-training,<br />
providing backup for tasks and minimizing work procedures.<br />
e. Sustain – Exert the discipline to stick to the 5S procedures for the longterm.<br />
Set a schedule to Sort, Straighten, Shine, Standardize and Sustain so<br />
that this iterative set <strong>of</strong> activities perpetually re-invigorates the workplace<br />
and the staff who populate it. Clean, orderly workplaces reduce noise, both<br />
aural and visual.<br />
5S can be instituted in any location. An environmental health department used 5S<br />
to:<br />
<br />
<br />
<br />
<br />
<br />
Sort in-process applications for Septic System Permits;<br />
Set-in-Order all applications by placing them in “Green Folders” for visual<br />
recognition;<br />
Shine the desks and work areas, thereby locating all “lost” in-process<br />
applications that were causing the average turn-around time for processing<br />
to be extended;<br />
Standardize the Septic System Permit application process by flowcharting<br />
and documenting the steps for consistency and ease <strong>of</strong> training new<br />
employees; and<br />
Sustain the process by including measures and review points for the<br />
<strong>of</strong>fice’s senior coordinator and first-line supervisor.<br />
4. Disruption identification: Identifying the places where work is interrupted or<br />
where the process breaks down provides excellent opportunities for improvement.<br />
Disruptions identify either organizational bottlenecks or specific breaks in the<br />
flow <strong>of</strong> daily operations and procedures that waste time or other resources.<br />
18<br />
________________________________________________________________________<br />
<strong>Modular</strong> <strong>kaizen</strong>: Dealing with Disruptions Chapter 2
5. 8 Wastes: If an activity consumes resource time or capital but does not add value,<br />
it must be wasteful and should be eliminated. The idea is to eliminate as many <strong>of</strong><br />
these wastes as possible in daily work activities. Removing waste makes<br />
additional time and resources available for higher priority outcomes <strong>of</strong> the<br />
department. An explanation <strong>of</strong> the Eight Types <strong>of</strong> Waste is shown in <strong>Table</strong> 2.1.<br />
6. Force & Effect + ca: The Force & Effect Chart is designed to identify barriers to<br />
agreement among team members concerning a specific situation. Once barriers<br />
are identified, Check and Act (c + a) phases <strong>of</strong> the improvement cycle are used to<br />
resolve disruptions and return stable operation.<br />
7. Tri-metric dashboard: The Tri-metric dashboard helps the decision maker<br />
measure important aspects <strong>of</strong> a process’s capacity, process capability, and<br />
outcomes.<br />
8. Teams: In the lean environment, the emphasis is on working in teams, whether<br />
they are process improvement teams or daily work teams. <strong>Modular</strong> <strong>kaizen</strong><br />
employs teams not only for the traditional purposes but also for backup when<br />
subject matter experts are interrupted from their improvement efforts to address<br />
other key business priorities.<br />
9. Project management: This tool involves all activities associated with planning,<br />
scheduling, and controlling projects. Good project management ensures that an<br />
organization’s resources are used efficiently and effectively. 4<br />
10. Kaizen blitz: Kaizens, or blitzes, are improvement events where people work<br />
only on improvement for a few days, up to a full week. In a traditional Kaizen<br />
project, the people from a particular work area come together with a few experts<br />
for four or five consecutive days and complete most or all <strong>of</strong> a Define-Measure-<br />
Analyze-Improve-Control (DMAIC) cycle on a narrowly targeted, high-priority<br />
issue. The model has been so successful that this basic approach has been adapted<br />
to other uses such as service design sessions.<br />
11. Error pro<strong>of</strong>ing: Error-pro<strong>of</strong>ing refers to the implementation <strong>of</strong> failsafe<br />
mechanisms to prevent a process from producing defects.<br />
12. Quality at source: Inspection and process control by front-line employees<br />
ensures that the product or service that is passed on to the next process is <strong>of</strong><br />
acceptable quality. Since staffing is usually tight, having the skills readily<br />
available by more than one person in the <strong>of</strong>fice saves time and provides backup<br />
within the <strong>of</strong>fice.<br />
4 Evans J, Lindsay W. The Management and Control <strong>of</strong> Quality, 6th Ed. Mason, OH: Thomson<br />
Southwestern; 2005.<br />
19<br />
________________________________________________________________________<br />
<strong>Modular</strong> <strong>kaizen</strong>: Dealing with Disruptions Chapter 2
Waste Description <strong>Public</strong> <strong>Health</strong> Example<br />
Overprocessing<br />
Spending more time than<br />
necessary to produce the product<br />
or service.<br />
Combining customer survey<br />
instruments into one form rather<br />
than developing specific<br />
instruments for each program.<br />
Transportation<br />
Handling<br />
Unnecessary<br />
Motion<br />
Unnecessary<br />
Inventory<br />
Waiting<br />
Defects<br />
Unnecessary movement <strong>of</strong><br />
materials or double handling.<br />
Extra steps taken by employees<br />
and equipment to accommodate<br />
inefficient process layouts.<br />
Any excess inventory that is not<br />
directly required for the current<br />
customer’s order.<br />
Periods <strong>of</strong> inactivity in a<br />
downstream process that occur<br />
because an upstream activity<br />
does not produce or deliver on<br />
time.<br />
Errors produced during a service<br />
transaction or while developing a<br />
product.<br />
Department vehicles stored in<br />
central facility, requiring constant<br />
movement <strong>of</strong> vehicles to and from<br />
other high- traffic locations.<br />
Immunology testing equipment<br />
stored in cabinets far from<br />
specialist work area.<br />
Overestimating vaccination<br />
support materials, requiring<br />
additional locked storage cases,<br />
inventory counting, and<br />
reconciliation.<br />
Paperwork waiting for<br />
management signature or review.<br />
Ineffective scripts for initial intake<br />
applications. Unclear directions<br />
for filling out required forms.<br />
Overproduction Items produced in excess<br />
quantity and products made<br />
before the customer needs them.<br />
People<br />
Not fully using people’s abilities<br />
(mental, creative, skills,<br />
experience, and so on)<br />
under/overutilization <strong>of</strong><br />
resources.<br />
<strong>Table</strong> 2.1: Eight Types <strong>of</strong> Wastes<br />
Insurance filing or immunization<br />
record opened before all required<br />
information is received.<br />
Poor job design, ineffective<br />
process design within business<br />
functions, lack <strong>of</strong> empowerment,<br />
maintaining a staffing complement<br />
not in balance with workload<br />
demand.<br />
20<br />
________________________________________________________________________<br />
<strong>Modular</strong> <strong>kaizen</strong>: Dealing with Disruptions Chapter 2
13. Process control: This tool is used to monitor, control, and improve process<br />
performance over time by studying variation and its source. <strong>Modular</strong> <strong>kaizen</strong> uses<br />
a combination <strong>of</strong> run, control, and Paynter Charts to track and represent process<br />
performance visually.<br />
14. Fast transition: This tool is translated from Quick Changeover in a production to<br />
a service environment by providing cross training for staff to allow quick<br />
movement from one project or customer requirement to another within a small<br />
<strong>of</strong>fice.<br />
15. Pull technology: This system <strong>of</strong> cascading procedures and instructions from<br />
downstream to upstream activities ensures that the upstream supplier does not<br />
perform activity related to a specific transaction or service until the downstream<br />
customer signals a need.<br />
16. <strong>Modular</strong> flow: Organizations <strong>of</strong>ten empower an improvement team <strong>of</strong> crossfunctional<br />
clerical staff, specialists, and management to create a seamless<br />
sequence <strong>of</strong> steps from customer application through processing to delivery and<br />
final review. <strong>Modular</strong> <strong>kaizen</strong> designs these sequenced steps into segments that can<br />
be efficiently performed within the time frames allowed by a highly interruptive<br />
workplace.<br />
17. Daily work management: The utilization <strong>of</strong> the tools and techniques <strong>of</strong> quality<br />
improvement (QI) in day-to-day work activities by those doing the work is<br />
crucial. Daily work management puts control and change at the lowest level<br />
possible within the organization. QI in daily work is called “daily work<br />
management” (DWM) because it uses the tools and techniques <strong>of</strong> QI to make<br />
daily work better, more customer-focused, and more manageable.<br />
Use <strong>of</strong> the tools contained within the House <strong>of</strong> <strong>Modular</strong> <strong>kaizen</strong> is not limited to the<br />
PDCA phase in which they are listed in Figure 2.2. Although the tools strongly support<br />
the phase identified, in Figure 2.2, like all tools, they are to be used when conditions are<br />
appropriate. A subsequent chapter suggests the sequence <strong>of</strong> tool usage under the DMAIC<br />
cycle <strong>of</strong> lean Six Sigma. <strong>Modular</strong> <strong>kaizen</strong> facilitates designing and implementing process<br />
improvement activities in a series <strong>of</strong> tasks which can be accomplished within the normal<br />
work flow <strong>of</strong> assigned team members and subject matter experts.<br />
21<br />
________________________________________________________________________<br />
<strong>Modular</strong> <strong>kaizen</strong>: Dealing with Disruptions Chapter 2
22<br />
________________________________________________________________________<br />
<strong>Modular</strong> <strong>kaizen</strong>: Dealing with Disruptions
Chapter 3: Implementing Performance Improvement through <strong>Modular</strong> <strong>kaizen</strong><br />
<strong>Modular</strong> <strong>kaizen</strong> supports performance improvement across a timeline that recognizes the<br />
highly volatile nature <strong>of</strong> core business processes. The pace <strong>of</strong> business has increased<br />
rapidly over recent years. No longer can leadership rip critical resources away from front<br />
line operations to focus on parallel improvement efforts. Improvement activities must be<br />
integrated into existing workloads, using scarce resources when they are most available.<br />
<strong>Modular</strong> <strong>kaizen</strong> is driven by the existing key performance measures established<br />
throughout the organization. Where measures are not yet identified, <strong>Modular</strong> <strong>kaizen</strong><br />
techniques identify metrics supporting top priorities for customer service and internal<br />
efficiencies. Pre-project planning identifies priority areas <strong>of</strong> improvement for rapid<br />
results. By using the performance measurement system already integrated into daily<br />
operations, process improvement activities are targeted on effective outcomes and<br />
ongoing reduction <strong>of</strong> waste. Existing technology and information system resources are<br />
exploited as much as possible, while identifying potential areas for consolidation <strong>of</strong> data<br />
systems and improved functionality.<br />
The inclusive nature <strong>of</strong> a <strong>Modular</strong> <strong>kaizen</strong> team addresses the needs <strong>of</strong> both internal and<br />
external customers. Since project milestones may be set more widely apart than normal<br />
Kaizen events, less pressure is placed on teams to rush sampling or other activities during<br />
the assessment phase. Analysis and decision-making are data-driven, using both interim<br />
and outcome effectiveness measures. Milestone reviews are built into the <strong>Modular</strong> <strong>kaizen</strong><br />
timeline for senior management approval and adjustment. Project documentation creates<br />
an archive <strong>of</strong> empirical evidence to be shared with other agencies and public health<br />
system partners.<br />
<strong>Modular</strong> <strong>kaizen</strong> is not a training event but is a hands-on, facilitator-led, problem-solving<br />
process that utilizes in-house subject matter experts to customize the improvement effort<br />
and develop exacting performance evaluation instruments. Highly visible <strong>Modular</strong> <strong>kaizen</strong><br />
improvement efforts draw and retain top talent through challenging involvement with<br />
critical processes. Margaret J. Wheatley, bestselling author and researcher <strong>of</strong> living<br />
systems within human organizations, writes;<br />
“I don’t believe that organizations are ever changed by imposing a model<br />
developed elsewhere. So little transfers to, or inspires, those trying to work at<br />
change in their own organization. In every organization, we need to look<br />
internally, to see one another as the critical resources on this voyage <strong>of</strong><br />
discovery.” 1<br />
Off-the-shelf improvement models are rarely effective tools for successful operational<br />
implementation. Improvement must be based upon the needs <strong>of</strong> the specific organization.<br />
1 Wheatley M. Leadership and the New Science – Discovering Order in a Chaotic World, 2 nd Ed. San<br />
Francisco, CA: Berrett-Koehler Publishers, Inc; 1999.<br />
23<br />
________________________________________________________________________<br />
<strong>Modular</strong> <strong>kaizen</strong>: Dealing with Disruptions Chapter 3
<strong>Modular</strong> <strong>kaizen</strong> is a concept within the family <strong>of</strong> Kaizen approaches that recognizes the<br />
reality <strong>of</strong> the environment and culture in which organizations function. Each organization<br />
evolves as a result <strong>of</strong> decisions made by leaders as they:<br />
<br />
<br />
<br />
<br />
<br />
define the strategic plan;<br />
identify target customer populations;<br />
develop core processes;<br />
identify areas to cut waste; and<br />
establish performance measures.<br />
The hands-on facilitated performance improvement cycle involves management and staff<br />
at all levels <strong>of</strong> the organization. Since no two organizations are exactly the same, each<br />
<strong>Modular</strong> <strong>kaizen</strong> event varies depending on culture, leadership, and critical performance<br />
requirements. <strong>Modular</strong> <strong>kaizen</strong> design teams may be comprised <strong>of</strong> internal personnel,<br />
subject matter experts, customers, cross-functional partners/agencies or others familiar<br />
with the process targeted for improvement. Since each <strong>Modular</strong> <strong>kaizen</strong> project is<br />
customized to address top organizational goals, the use <strong>of</strong> skilled contract resources is<br />
usually well within the scope <strong>of</strong> regulatory limitations.<br />
A traditional Kaizen event is a problem-solving approach that requires training and<br />
facilitation to analyze and re-orient a process. The overall concept <strong>of</strong> Kaizen is a system<br />
that encourages everyone to suggest incremental changes. No “one time” event to<br />
improve occurs. Under Kaizen the organization is constantly improving. Kaizen does<br />
well in an organization that encourages and rewards teamwork and a customer-centric<br />
culture, using daily work management at all levels to make individual improvement.<br />
Most Kaizen improvements are designed as fast-track events which pull leaders and<br />
subject matter experts out <strong>of</strong> the day-to-day activities to focus solely on the desired result.<br />
More recently, the quality community has put even more focus on separating the<br />
improvement activity from daily operations by initiating the Kaizen Blitz, which is the<br />
same as a Kaizen event but is focused on a short spurt <strong>of</strong> between two and eight days to<br />
improve a process. The Blitz requires substantial use <strong>of</strong> human resources for this time<br />
period. The Blitz configuration totally removes the strongest members <strong>of</strong> the organization<br />
for the duration <strong>of</strong> the improvement effort.<br />
<strong>Modular</strong> <strong>kaizen</strong> is a modification <strong>of</strong> the traditional Kaizen improvement process,<br />
designed to provide the same rapid results without removing critical personnel from daily<br />
operations. <strong>Modular</strong> <strong>kaizen</strong> uses a step-function approach by breaking the improvement<br />
cycle into blocks <strong>of</strong> action plans and tasks which support the highly interruptive<br />
environment <strong>of</strong> today’s organization. Effective use <strong>of</strong> data, leadership, and<br />
communication provide ongoing accountability so that tasks are initiated or paused<br />
without losing improvement gains. Existing resources are coordinated with other top<br />
priority programs, seeking to maximize effectiveness while eliminating waste.<br />
24<br />
________________________________________________________________________<br />
<strong>Modular</strong> <strong>kaizen</strong>: Dealing with Disruptions Chapter 3
If an organization can improve from the inside by changing processes, reducing waste,<br />
and improving efficiency, capacity, and quality, it will be in a better position to absorb<br />
the change and continue to do business. As quality improves, disruptions to the system<br />
are reduced. As efficiency improves, the ability to satisfy customers improves. As<br />
resources are more efficiently used, costs can be kept under control.<br />
Bringing a Quality Improvement (QI) philosophy to an organization takes time. It<br />
requires building a culture that says, “Everyone, everywhere in the organization, will<br />
improve every day.” Leadership, creative thinking, and problem solving must occur at all<br />
levels. All stakeholders must understand why something is done, what services the<br />
organization provides, and how they can best deliver those services. Training in the tools<br />
and techniques <strong>of</strong> lean are necessary. A change in culture requires a change in the<br />
underlying organizational processes since culture follows process.<br />
It sounds like a daunting undertaking, but when an organization gets involved in<br />
improvement and change, momentum starts to build, and everyone in the organization<br />
can see the weaknesses in the processes and are equipped and empowered to correct<br />
them. Then, an organization can make quantum leaps in quality, efficiency,<br />
customer/client access, and staff satisfaction. Customers are happier and more satisfied.<br />
Employees are freed from mundane and wasteful tasks and can spend more time<br />
performing vital functions and serving their customers. Overall, financial statements and<br />
overall performance improve substantially.<br />
The tools <strong>of</strong> QI are easy to learn. It is one <strong>of</strong> the best features <strong>of</strong> QI. With a little training,<br />
everyone can apply these tools. Once people are taught how to see the waste in a process,<br />
they will see it everywhere. The challenge is to apply leadership, priorities, and resources<br />
to the identified problems to ensure that the right tools are used to find and fix the root<br />
cause <strong>of</strong> a problem and then organize the work to eliminate the problem.<br />
Two <strong>of</strong> the most common uses <strong>of</strong> Kaizen are:<br />
<br />
<br />
Kaizen Event –a problem-solving approach that requires training and<br />
facilitation to analyze and re-orient a process.<br />
Kaizen Blitz – same as an event but focused on a short period <strong>of</strong> two to eight<br />
days to improve a process, requiring substantial use <strong>of</strong> human resources.<br />
This book is about the use <strong>of</strong> <strong>Modular</strong> <strong>kaizen</strong>. <strong>Modular</strong> <strong>kaizen</strong> is defined as the<br />
improvement or redesign project planned along a timeline that recognizes the highly<br />
volatile nature <strong>of</strong> the customer’s core business processes. High-priority projects are<br />
planned at the senior leadership level to establish realistic milestones, resources, and<br />
measurements to ensure a return on investment that includes not only financial<br />
commitment but also the involvement <strong>of</strong> highly skilled facilitators and subject matter<br />
experts.<br />
25<br />
________________________________________________________________________<br />
<strong>Modular</strong> <strong>kaizen</strong>: Dealing with Disruptions Chapter 3
<strong>Modular</strong> <strong>kaizen</strong> is effectively structured to take advantage <strong>of</strong> an assessment <strong>of</strong> the eight<br />
Lean Wastes during process improvement activities. Pre-project planning provides a<br />
platform for identifying potential areas <strong>of</strong> waste before resources are expended on early<br />
measurement activities. We focus on the Limited Information Collection Principle 2 to<br />
determine where the most likely areas are located for waste reduction. This priority<br />
setting <strong>of</strong> tasks encourages experiments designed to identify effective data gathering<br />
based on operational feedback.<br />
<strong>Modular</strong> <strong>kaizen</strong> is not a training event but is instead an interactive, consultant/facilitatorled,<br />
problem-solving process that utilizes in-house subject matter experts using the<br />
<strong>Modular</strong> <strong>kaizen</strong> model shown below in Figure 3.1.<br />
Plan<br />
<strong>Modular</strong> <strong>kaizen</strong> Flow<br />
Act<br />
Do/<br />
Disrupt<br />
Check<br />
check<br />
Do<br />
<strong>Modular</strong><br />
<strong>kaizen</strong><br />
act<br />
Figure 3.1: <strong>Modular</strong> <strong>kaizen</strong> flow<br />
Plan<br />
The <strong>Modular</strong> <strong>kaizen</strong> model starts with Check where it is crucial to investigate and<br />
understand the disruption and see if it has a special cause, understand what the<br />
severity/urgency is, estimate who/what is impacted, estimate the length <strong>of</strong> the disruption<br />
timeline and use the Limited Information Collection Principle to guide data collection.<br />
The next step is Act. Based on the data gathered in Check, the response team would:<br />
1. Do nothing – continue to monitor the disruption until they feel it has either<br />
dissipated or needs more attention. If more attention is needed, then establishing<br />
an investigative team to analyze the disruption and report back is important. The<br />
report back would be a high- level scope document.<br />
2 H<strong>of</strong>fherr G, Moran J, and Nadler, G. Breakthrough Thinking In Total Quality Management.<br />
Englewood Cliffs, NJ: PTR Prentice Hall; 1994.<br />
26<br />
________________________________________________________________________<br />
<strong>Modular</strong> <strong>kaizen</strong>: Dealing with Disruptions Chapter 3
2. Respond by taking short-term actions to stabilize the process while the team<br />
allocates time to use the PDCA Cycle to solve the problem and bring the process<br />
back under control.<br />
After the Do phase <strong>of</strong> the PDCA Cycle, it is time to evaluate and determine when<br />
disruption is under control. Resources can now be returned to departments to resume<br />
regular activities. This action is represented by the green line on the model shown in<br />
Figure 3.1. At this point, the team documents lessons learned, knowledge gained, and any<br />
surprising results that emerged. It is important to continue to monitor activities and hold<br />
the gains so that the disruption remains under control.<br />
If the disruption is not under control, activity follows the red line in Figure 3.1. The<br />
improvement team must modify the approach taken or repeat the Plan/Do phase to make<br />
new improvements and then check to see how the disruption responds to the new<br />
approach.<br />
A <strong>Modular</strong> <strong>kaizen</strong> example:<br />
One day in the early morning hours in July 2001, a major power outage happened in a<br />
major city, and it impacted a hospital that was filled with patients, an active operating<br />
room with a full schedule, and a rehabilitation unit that was filled to capacity. The<br />
temperature that day was expected to reach 98 degrees. First reports were that power<br />
would not be returned to service for a week.<br />
The senior staff quickly assembled at 6:30 AM. Rather than going into a panicked<br />
planning mode, they calmly realized that this was an unplanned disruption to their<br />
regularly scheduled activities.<br />
The first thing that they did was “Check.” What was the real status <strong>of</strong> the power outage<br />
and what were the conditions within the hospital? The president <strong>of</strong> the hospital called the<br />
mayor and president <strong>of</strong> the utility company to explain the immediate needs <strong>of</strong> the<br />
hospital. It was explained to the president <strong>of</strong> the utility company that a press conference<br />
with the mayor was scheduled at the hospital at 9:00 AM. He was invited to attend to<br />
explain why the hospital would have to close for a week. Board members were notified to<br />
see where they could put pressure on the system to get the power on and what recourse<br />
the hospital may have to recover any losses. Again, no action was taken; they simply<br />
“Checked” to see what leverage resources were available.<br />
The medical and nursing staff did a “Check” on patient status to determine who could<br />
withstand a temperature increase and who could not. Those patients who could not would<br />
be transferred. What surgeries could be postponed and which ones had to happen? What<br />
rehabilitation activities could take place and what should be postponed if power could not<br />
be restored?<br />
27<br />
________________________________________________________________________<br />
<strong>Modular</strong> <strong>kaizen</strong>: Dealing with Disruptions Chapter 3
The maintenance staff did a “Check” on the status <strong>of</strong> the standby generators, secured<br />
regular fuel deliveries, and had the in-house electrical system checked to ensure that no<br />
potential problems occurred. In addition, they developed a power diagram to show what<br />
systems could be handled on internal generators and what would stay down.<br />
Housekeeping “Checked” on how many sizes and types <strong>of</strong> fans were available. Then they<br />
deployed and acquired additional large fans to keep the air moving throughout the<br />
hospital.<br />
A patient letter was developed by public relations and distributed to all patients, staff, and<br />
relatives explaining the situation. Nursing staff checked in regularly with patients to keep<br />
them informed.<br />
These various activities occurred between 6:00 and 9:00 AM. At the press conference,<br />
the utility president stated that he would have a large mobile generator at the hospital by<br />
12:00 PM; it was 200 miles away. The mayor called the governor and had a state police<br />
escort arranged to transport it more quickly, if possible. The mayor would have all <strong>of</strong> the<br />
roads open when it reached the city limits so that it could move through any potential<br />
traffic backups without any delays. The hospital senior staff “Checked” first, understood<br />
what they were facing, and then did small “Act” steps to make short-term responses that<br />
were grounded in fact and not emotion.<br />
check<br />
Many small<br />
repeat cycles <strong>of</strong><br />
check and act<br />
act<br />
Figure 3.2: The check/act repeating improvement cycle<br />
After the 9:00 AM press conference, “check” <strong>of</strong> <strong>Modular</strong> <strong>kaizen</strong> went back into effect.<br />
From each <strong>of</strong> the checks, small actions were taken to stabilize the situation and make the<br />
hospital ready for additional generator power. This process is shown in Figure 3.2.<br />
First, maintenance worked with the utility company to determine where the generator<br />
would be located and how it would hook in. They determined that a new box was<br />
required, and it was installed before the generator arrived. They measured and decided<br />
how long a feed was required to reach the new box and what fuel was required. A truck<br />
was on site at 11:00 AM, ready to fuel the generator. The utility company and<br />
maintenance staff checked the hospital electric distribution system to look for potential<br />
failure areas when the new generator was turned on. What could potentially fail was<br />
pinpointed, and a fix was determined and ready to go. The hospital leaders understood<br />
what they were facing and did “Act” as appropriate to rectify problems that could arise<br />
when the generator was being hooked up and power would be transmitted.<br />
28<br />
________________________________________________________________________<br />
<strong>Modular</strong> <strong>kaizen</strong>: Dealing with Disruptions Chapter 3
Leaders then conducted a temperature check, and it was up to 80 degrees. More fans<br />
were acquired and deployed; window shades were shut. At 10:30 AM a few elderly<br />
patients were transferred to a sister hospital because they needed a cooler environment.<br />
By 11:00 AM, the temperature was still in the bearable 80 degree range. The generator<br />
arrived at 12:00 PM and was ready to transmit power at 12:30 PM. By 2:00 PM the<br />
temperature was decreasing, and by 5:00 PM it was cool in the hospital.<br />
This situation lasted for three more days, but panic did not ensue. Constant check was the<br />
rule throughout this crisis with no panicked planning or arbitrary actions taken. Out <strong>of</strong><br />
each check came a logical small action plan which was executed. If further follow-up was<br />
required, it was acted upon. Staff continued their regular routine in the hospital with<br />
occasional update meetings, causing a disruption to their regular schedule. Subject matter<br />
experts were called upon as necessary and again they could resume their regular routine<br />
with minor interruptions. The hospital operated in a normal mode with a major disruption<br />
occurring because they Checked before Acting.<br />
A <strong>Modular</strong> <strong>kaizen</strong> approach minimized the disruption and made sure that no “action” was<br />
executed until “check” had been done to establish the beginning point. Once the situation<br />
stabilized, the senior staff did a full PDCA cycle, documenting lessons learned and<br />
making plans to ensure that if this situation or crisis impacting the hospital happened<br />
again, actions could be taken in advance to minimize the situation.<br />
29<br />
________________________________________________________________________<br />
<strong>Modular</strong> <strong>kaizen</strong>: Dealing with Disruptions Chapter 3
30<br />
________________________________________________________________________<br />
<strong>Modular</strong> <strong>kaizen</strong>: Dealing with Disruptions
Chapter 4: A System View <strong>of</strong> the Disrupted Process<br />
Introduction<br />
An organization is a system <strong>of</strong> activities composed <strong>of</strong> a web <strong>of</strong> regularly occurring interrelationships.<br />
A system dovetails and drives excellence across the organization. This<br />
system <strong>of</strong> inter-relationships has common patterns, behaviors, and properties that can be<br />
understood through measurement. Measurement is used to develop greater insight into<br />
the behavior <strong>of</strong> these interrelated groups <strong>of</strong> activities. Measures are gathered from tasks<br />
and activities which form complex, goal-oriented processes. Activity level measures are<br />
rolled up to department and division levels until consolidated measures finally summarize<br />
operations for the health department as a whole.<br />
A system is an organized collection <strong>of</strong> parts, functions, or subsystems that are integrated<br />
to accomplish an overall goal. The system has various inputs which are acted upon by<br />
certain processes to produce outputs, which together accomplish the overall desired goal<br />
for the system. A system is usually made up <strong>of</strong> smaller systems or subsystems. For<br />
example, an organization is made up <strong>of</strong> many administrative and management functions,<br />
products, services, groups, and individuals. If one part <strong>of</strong> the system is changed, the<br />
nature <strong>of</strong> the overall system is <strong>of</strong>ten changed. 1<br />
The goal <strong>of</strong> any organization is to build a highly functioning system that continually<br />
exchanges measurement feedback among its various parts. This constant exchange <strong>of</strong><br />
measures ensures that activities remain closely aligned and focused on achieving the<br />
goals <strong>of</strong> the organization. If any <strong>of</strong> the parts or activities in the system seems misaligned<br />
through its measurement monitoring program, the system must make necessary<br />
adjustments to achieve its goals more efficiently. 2<br />
Work Processes Integrate to Form a System<br />
Both a systems view and a functional view <strong>of</strong> work processes are important to understand<br />
how the subsystems, or functions, are interrelated. The interrelationship usually is in the<br />
form <strong>of</strong> inputs and outputs which are delivered to internal or external customers. These<br />
inputs and outputs can be measured both quantitatively and qualitatively to determine<br />
how the parts and the system are functioning and where improvements should be made.<br />
Figure 4.1 shows a system and functional view <strong>of</strong> work processes. Big “Q,” at the left <strong>of</strong><br />
Figure 4.1, relates to the quality functions required to sustain the overall performance <strong>of</strong><br />
1 McNamara C. Free Management Library. http://managementhelp.org/systems/systems.htm. Accessed<br />
February 5, 2011.<br />
2 McNamara C. Free Management Library. http://managementhelp.org/systems/systems.htm, Accessed<br />
February 5,2011.<br />
31<br />
________________________________________________________________________<br />
<strong>Modular</strong> <strong>kaizen</strong>: Dealing with Disruptions Chapter 4
the organization as it relates to its environment <strong>of</strong> suppliers and customers. The system<br />
level functions <strong>of</strong> quality are decompressed into smaller functions related to individual<br />
programs or departments at the tactical and operating levels <strong>of</strong> the organization. Little “q”<br />
improvements, at the right <strong>of</strong> the figure, are tasks that create change.<br />
Functional<br />
View<br />
Systems View<br />
Big “Q”<br />
Cross Functional<br />
Improvement<br />
Programs or<br />
Departments<br />
Programs or<br />
Departments<br />
Programs or<br />
Departments<br />
Programs or<br />
Departments<br />
Little “q”<br />
Improvements<br />
Figure 4.1: Big “Q” drives to little “q”<br />
Quality improvement (QI) in public health is a never-ending process that pervades the<br />
organization when fully implemented. Top organizational leaders address the quality <strong>of</strong><br />
the system at a macro level (Big “Q”). In the middle, pr<strong>of</strong>essional staff attack problems<br />
in programs or service areas by improving particular processes (little “q”). At the<br />
individual level, staff seek ways <strong>of</strong> improving their own behaviors and environments<br />
(individual “q”). 3 Figure 4.2 is a comparison <strong>of</strong> the strategic, tactical, and operational<br />
levels <strong>of</strong> Big “Q,” little “q,” and individual “q” within an organization. <strong>Modular</strong> <strong>kaizen</strong><br />
uses the focusing effect <strong>of</strong> measurement to translate the performance management<br />
strategies identified by leadership (Big “Q”) down to the functional or departmental<br />
activities (little “q”).<br />
3 Duffy G, Moran J, Riley W. Quality Function Deployment and Lean-Six Sigma Applications in <strong>Public</strong><br />
<strong>Health</strong>. Milwaukee, WI: Quality Press; 2010.<br />
32<br />
________________________________________________________________________<br />
<strong>Modular</strong> <strong>kaizen</strong>: Dealing with Disruptions Chapter 4
Topic Big ‘Q’ – organization-wide Little ‘q’ – program/unit<br />
Individual ‘q’<br />
Improvement<br />
Specific project focus System focus Daily work level focus<br />
Quality Improvement<br />
Planning<br />
Evaluation <strong>of</strong> Quality<br />
Program/unit level Tied to the strategic plan Tied to yearly<br />
individual performance<br />
Performance <strong>of</strong> a Responsiveness to a Performance <strong>of</strong> daily<br />
process over time community need work<br />
Processes<br />
Quality Improvement<br />
Goals<br />
Delivery <strong>of</strong> a service Cut across all programs Daily work<br />
and activities<br />
Individual program/unit Strategic Plan Individual performance<br />
level plans<br />
plans<br />
Figure 4.2: Contrasting Big “Q,” Little “q,” and Individual “q”<br />
When starting their quality journey, public health organizations tend to embrace little “q,”<br />
which means striving for quality in a limited or specific improvement project or area.<br />
This endeavor is accomplished by utilizing an integrated set <strong>of</strong> QI methods and<br />
techniques that help to create a value map, 4 identify the key quality characteristics,<br />
analyze process performance, reengineer the process if needed, and provide methods to<br />
lock in improvements. Little “q” can be viewed as a tactical approach to implementing<br />
quality and beginning to generate a culture <strong>of</strong> QI within the organization. 5<br />
Involve People in Describing Processes<br />
The overall concept <strong>of</strong> managing a complete system <strong>of</strong> organizational processes includes<br />
designing, executing, and optimizing cross-functional business activities that incorporate<br />
people, technology, processes, and <strong>of</strong>ten community partners. <strong>Health</strong> departments are<br />
expert at involving the community in utilizing scarce resources in innovative ways to<br />
resolve problems. Many successful improvement teams involve a combination <strong>of</strong> staff,<br />
community partners, subject matter experts, and specialized consultants who share their<br />
expertise for the most efficient resolution to a problem.<br />
4 A value map is a specialized process map which identifies monetary or other quantitative measures <strong>of</strong><br />
where value is added by the activities performed within a process.<br />
5 Beitsch L, Bialek R, C<strong>of</strong>sky A, Corso L, Moran J, Riley W. Defining Quality Improvement in <strong>Public</strong><br />
<strong>Health</strong>. Journal <strong>of</strong> <strong>Public</strong> <strong>Health</strong> Management and Practice, 2009; 16(1): 5-7.<br />
33<br />
________________________________________________________________________<br />
<strong>Modular</strong> <strong>kaizen</strong>: Dealing with Disruptions Chapter 4
Process - Level #1<br />
Step #1<br />
Step #2<br />
Step #3<br />
Process - Level #2<br />
Step #1 Step #2<br />
Step #3<br />
Process - Level #3<br />
Step #1 Step #2 Step #3<br />
Select Select the the appropriate appropriate process process level.<br />
level.<br />
Figure 4.3: Example <strong>of</strong> the hierarchy <strong>of</strong> processes from organizational to individual<br />
task level<br />
Figure 4.3 illustrates the categorization <strong>of</strong> a high-level process into steps which can be<br />
further categorized into processes at a more detailed level. As the process is expanded<br />
from a strategic design to actual work instructions, the level <strong>of</strong> detail within each process<br />
becomes greater until finally the process is equivalent to a work instruction for an<br />
individual performing the work. Chapter 10, Daily Work Management, describes this task<br />
level and the importance <strong>of</strong> the individual in identifying disruptions and other<br />
opportunities for improving efficiencies within the organization.<br />
Analyze System Disruption<br />
When a disruption occurs in a stable system, the impact it has caused must be defined.<br />
One way to analyze the disruption is to identify what has been impacted in the overall<br />
system using a Disruption and Impact Matrix as shown in Figure 4.4. The first thing to<br />
understand is what areas were impacted in the current stable state. These impacted areas<br />
are called Areas <strong>of</strong> Concern (AoC). AoCs can be functional as well as system-level<br />
concerns. Once the AoCs are documented, a broad sense <strong>of</strong> how they are impacted is<br />
determined. The next step is to analyze whether the impacted areas are under the control<br />
or influence <strong>of</strong> the organization. If the organization controls the process under study,<br />
action can be taken directly to minimize the impact. If the organization can only<br />
34<br />
________________________________________________________________________<br />
<strong>Modular</strong> <strong>kaizen</strong>: Dealing with Disruptions Chapter 4
influence the AoC, taking action might be slower since others may need to be involved<br />
before making decisions to stabilize the current state. Once we begin to analyze the AoC<br />
over which we have control, the Force and Effect Diagram + ca, described in Chapter 6,<br />
is a very useful tool to help a response team begin to check and then take small action<br />
steps to stabilize the situation.<br />
How?<br />
Areas <strong>of</strong> Concern<br />
Control<br />
Influence<br />
AoC<br />
AoC<br />
Impacts<br />
AoC<br />
Disruption<br />
Disrupted State<br />
AoC<br />
Current Stable State<br />
Figure 4.4: Disruption and Impact Matrix<br />
The AoCs should be prioritized within both control and influence categories. It is best to<br />
start with the AoCs that have been most strongly impacted since these are usually the<br />
ones upon which to focus limited resources.<br />
<strong>Modular</strong> <strong>kaizen</strong>, as an approach based on the lean family <strong>of</strong> improvement tools, views the<br />
interaction among processes within the organization from an efficiency perspective.<br />
Figure 4.5 illustrates methods by which lean activities seek to reduce waste and eliminate<br />
redundancies as work is performed. A typical process is shown in Figure 4.5 on the left<br />
with embedded error correction, unnecessary tasks, and queuing or waiting before<br />
outcomes are realized. The more efficient process flow on the right shows a very direct<br />
flow to the desired outcome.<br />
35<br />
________________________________________________________________________<br />
<strong>Modular</strong> <strong>kaizen</strong>: Dealing with Disruptions Chapter 4
...and a lean value stream for the<br />
same process:<br />
A typical waste-filled value stream...<br />
Desired<br />
Outcome<br />
Error-Correction<br />
Loop<br />
Unnecessary<br />
Task<br />
Task Waits<br />
in Queue<br />
Approval<br />
Cycle<br />
Deliverable<br />
Created<br />
Desired<br />
Outcome<br />
Figure 4.5: Comparison <strong>of</strong> typical process waste and the efficiency <strong>of</strong> a lean process<br />
<strong>Modular</strong> <strong>kaizen</strong> uses the existing pace <strong>of</strong> the organization to plan improvement activities<br />
based upon the highest priority areas <strong>of</strong> impact. Figure 4.6 illustrates the concept <strong>of</strong><br />
Kaizen activity as a series <strong>of</strong> improvement steps interspersed with standard operations.<br />
When a problem is encountered, a Kaizen activity is planned and implemented, thus<br />
raising the standard <strong>of</strong> performance for the impacted process. As actual performance is<br />
improved, the standard is raised.<br />
Perpetual System <strong>of</strong> Improvement<br />
Performance<br />
Standard<br />
Kaizen<br />
Standard<br />
Kaizen<br />
Problem<br />
Problem<br />
Standard (Capability)<br />
Actual (Performance)<br />
Time<br />
Standard<br />
Problem<br />
Kaizen<br />
Record <strong>of</strong> best known method to perform work repeatedly<br />
Actual performance has fallen below proven capability<br />
Develop a better method to perform work repeatedly<br />
Figure 4.6: The Kaizen method <strong>of</strong> perpetual improvement<br />
36<br />
________________________________________________________________________<br />
<strong>Modular</strong> <strong>kaizen</strong>: Dealing with Disruptions Chapter 4
Figure 4.6 is a generic illustration <strong>of</strong> continuous lean Kaizen process improvement.<br />
Traditional Kaizen approaches are designed to group improvements into short, intense<br />
bursts <strong>of</strong> activity which remove the response team from normal operations. An even more<br />
focused approach is the Kaizen Blitz, which sequesters the response team until the<br />
improvement is defined, piloted, and initially implemented. Although the Kaizen Blitz is<br />
an effective approach for high severity situations where work cannot continue until the<br />
problem is resolved, not all improvement situations require such drastic means. The<br />
benefit <strong>of</strong> <strong>Modular</strong> <strong>kaizen</strong> is that improvements are integrated into daily work activities,<br />
based upon the impact <strong>of</strong> the disruption, resources, and personnel available. Detailed<br />
examples <strong>of</strong> integrated improvement are shared in subsequent chapters.<br />
Once the focus <strong>of</strong> analysis efforts is understood, the next step is to define the disrupted<br />
process at a high level. The tool for either a system or functional view <strong>of</strong> a process is a<br />
SIPOC + CM Form shown in Figure 4.7 and a completed SIPOC + CM in Figure 4.8.<br />
S I P O C + CM Form<br />
Begins With:<br />
Constraints:<br />
Ends With:<br />
Process/Activities:<br />
Measures<br />
Inputs:<br />
Outputs:<br />
Suppliers:<br />
Customers:<br />
Figure 4.7: SIPOC + CM Form<br />
The SIPOC + CM Form is a data collection form employed to illustrate a system or<br />
functional view <strong>of</strong> a process. It helps the response team gather relevant information about<br />
the process, including suppliers, inputs, the high-level process steps, outputs, and<br />
customers. The SIPOC + CM Form also prompts the user to identify key measures that<br />
assure alignment with organizational priorities, along with constraints that impact the<br />
process in its current state. The SIPOC + CM Form is a high-level view <strong>of</strong> the “As Is”<br />
state <strong>of</strong> a process under investigation.<br />
37<br />
________________________________________________________________________<br />
<strong>Modular</strong> <strong>kaizen</strong>: Dealing with Disruptions Chapter 4
6<br />
Figure 4.8: Completed SIPOC + CM<br />
Form 6<br />
6 SIPOC + CM form completed by the Iowa Department <strong>of</strong> <strong>Public</strong> <strong>Health</strong>, Bureau <strong>of</strong> Family <strong>Health</strong> for<br />
Title V Maternal <strong>Health</strong> Program. Contributed by Ms. Janet Beaman, Iowa Department <strong>of</strong> <strong>Public</strong> <strong>Health</strong>,<br />
2011.<br />
38<br />
________________________________________________________________________<br />
<strong>Modular</strong> <strong>kaizen</strong>: Dealing with Disruptions Chapter 4
A SIPOC + CM Form is useful to capture the basics <strong>of</strong> the process under study. Using the<br />
SIPOC + CM Form is a vehicle to get the collective knowledge <strong>of</strong> team members about a<br />
process recorded in an easily viewable format or when concise communication about the<br />
process must be conveyed to others.<br />
The process to develop a SIPOC + CM is:<br />
On a piece <strong>of</strong> flip chart paper, draw the SIPOC + CM diagram with seven blocks<br />
indicating the components <strong>of</strong> SIPOC.<br />
Clearly identify the process under study and define the process boundaries (start<br />
and end points) so that all participants understand the scope <strong>of</strong> the analysis.<br />
On the SIPOC+CM form, identify the data available for each <strong>of</strong> the following major<br />
categories:<br />
Suppliers – who or what (internal or external) provides the raw materials,<br />
information, or technology to the process<br />
Inputs – what material or information specifications are needed by the process<br />
Process – a high-level Flow Chart <strong>of</strong> the key five to seven core activities that<br />
comprise the process, <strong>of</strong>fering a 35,000 foot view <strong>of</strong> the process. The detail steps<br />
will be developed in a flowchart.<br />
Outputs – what the process produces as products, services, or technology<br />
Customers – the main users <strong>of</strong> the process’s output<br />
+ C – constraints facing the system or process<br />
+ M – measures being used or to be used to manage the performance <strong>of</strong> the<br />
process<br />
Review the form for accuracy with relevant stakeholders, sponsors, and other interested<br />
parties.<br />
The SIPOC + CM is the initial picture <strong>of</strong> a process. Once the general expectations <strong>of</strong> the<br />
process are agreed upon, the next step is to define the process at the level <strong>of</strong> individual<br />
steps and tasks. Depending on the purpose <strong>of</strong> the map, one <strong>of</strong> three major categories <strong>of</strong><br />
maps may be used.<br />
Process Maps Provide Different Views <strong>of</strong> the System<br />
Figure 4.9 provides an overview <strong>of</strong> the three major types <strong>of</strong> process mapping tools: value<br />
map, process map, and flowchart.<br />
A value map is a high-level representation <strong>of</strong> the process which guides the team through<br />
identification <strong>of</strong> where activities increase the value <strong>of</strong> the process output in the eyes <strong>of</strong><br />
the customer or final user. This tool, <strong>of</strong>ten called a value stream map, is a system-level<br />
instrument, since value is <strong>of</strong>ten added through a series <strong>of</strong> interrelated processes. The<br />
result <strong>of</strong> changing one process in the stream <strong>of</strong> activities may negatively impact the<br />
39<br />
________________________________________________________________________<br />
<strong>Modular</strong> <strong>kaizen</strong>: Dealing with Disruptions Chapter 4
efficiency <strong>of</strong> another process within the system. The intent <strong>of</strong> the value map is to remove<br />
all activities which add no value to the end product or service and to reduce any waste<br />
which makes those process steps that add value less efficient.<br />
Value Map, Process Map & Flowchart<br />
Value Map<br />
Process Map<br />
Flow Chart<br />
(Value Stream Map)<br />
Starts with first process block Starts with inputs Starts with start block<br />
Focuses on one service from<br />
beginning to end<br />
Does not use decision boxes<br />
Identifies individual<br />
process <strong>of</strong> a larger<br />
process<br />
Has very few<br />
decision boxes<br />
Identifies each step <strong>of</strong> a<br />
process<br />
Has many decision<br />
boxes<br />
Ends with last process block Ends with outputs Ends with end block<br />
Encompasses the complete set <strong>of</strong><br />
processes and/or steps<br />
representing a defined value<br />
stream<br />
Illustrates value versus non-value<br />
added process activities<br />
May be part <strong>of</strong> a<br />
procedure<br />
Helps paint a high<br />
level picture<br />
Is usually a procedure<br />
on its own<br />
Helps paint a detail<br />
picture<br />
Figure 4.9: Value Map, Process Map, & Flowchart characteristics compared<br />
The process map is a symbolic representation <strong>of</strong> a single process without a lot <strong>of</strong> detail.<br />
The intent is to provide a high-level picture <strong>of</strong> the steps within a process. This picture<br />
provides a strategic view <strong>of</strong> how one process may impact others and assists in the overall<br />
balancing <strong>of</strong> resources across a set <strong>of</strong> interrelated processes.<br />
A flowchart is a detailed picture <strong>of</strong> a process at the procedural level. This version <strong>of</strong> a<br />
process map includes steps, decisions, inputs from outside the process, and outputs or<br />
interchanges with resources or other activities outside the process. The flowchart<br />
provides enough information about the process to establish working measures for<br />
monitoring and improving outcomes or interim milestones.<br />
40<br />
________________________________________________________________________<br />
<strong>Modular</strong> <strong>kaizen</strong>: Dealing with Disruptions Chapter 4
Processing<br />
Verify<br />
Application WIII<br />
Verify with Data<br />
C/T 9 days (D7<br />
Avg. 5/07)<br />
W/T<br />
Figure 4.10: As-Is Value (Stream) Map <strong>of</strong> Florida agency customer intake process –<br />
2008 7<br />
The example in Figure 4.10 illustrates the output <strong>of</strong> a value stream map. Each step <strong>of</strong> the<br />
series <strong>of</strong> processes is measured for wait times, number <strong>of</strong> persons waiting, cycle time for<br />
each step, and total elapsed time. Also included is use <strong>of</strong> resources (procedures,<br />
materials, personnel, etc.). This example does not convert time values into dollar<br />
amounts, although many value maps do. The intent <strong>of</strong> using this version <strong>of</strong> process map<br />
is to reduce disruption and time through the total flow <strong>of</strong> the overall system comprised <strong>of</strong><br />
interrelated processes.<br />
Figure 4.11 is a basic process map <strong>of</strong> a health department childhood immunization clinic.<br />
This high-level picture <strong>of</strong> clinic flow provides enough information for communication<br />
about the general operation <strong>of</strong> the activity. Little detailed information is available from<br />
this map type. The intent here is to focus the scope <strong>of</strong> discussion around a particular<br />
activity.<br />
7 SIPOC + CM form completed by the Florida Department <strong>of</strong> <strong>Public</strong> <strong>Health</strong>.<br />
41<br />
________________________________________________________________________<br />
<strong>Modular</strong> <strong>kaizen</strong>: Dealing with Disruptions Chapter 4
Child arrives at clinic<br />
Register<br />
Need<br />
Immunization<br />
Yes<br />
Give<br />
Immunization<br />
Child leaves clinic<br />
No<br />
Figure 4.11: Basic Process Map for Childhood Immunization Clinic<br />
The detailed flowchart reflected in Figure 4.12 shows enough detail to identify activity<br />
and some outcome measures. The level <strong>of</strong> each block or decision symbol in the example<br />
Septic Systems Permitting flowchart is at the point where a work instruction or procedure<br />
could be the next level <strong>of</strong> granularity if more detail were desired.<br />
Original Septic system permitting<br />
flowchart<br />
rehost<br />
Figure 4.12: As-Is Flowchart <strong>of</strong> Environmental Services Department Septic System<br />
Permitting<br />
42<br />
________________________________________________________________________<br />
<strong>Modular</strong> <strong>kaizen</strong>: Dealing with Disruptions Chapter 4
Understand the System to Manage Performance<br />
Understanding individual processes is critical for measuring and maintaining<br />
organizational performance. Improving processes individually, however, without<br />
assessing the interconnected impact <strong>of</strong> change to related processes is a recipe for<br />
inefficiency. The tools introduced in this chapter provide the reader with the ability to<br />
envision the interrelated nature <strong>of</strong> the department as a system <strong>of</strong> processes to meet the<br />
strategic goals <strong>of</strong> the organization. Change management and the ramifications <strong>of</strong><br />
performance management on the overall operation <strong>of</strong> the health department are covered<br />
in subsequent chapters. Once the overall expectations <strong>of</strong> system performance are<br />
understood, additional tools are available to define the cause <strong>of</strong> disruptions and analyze<br />
the best alternatives for reducing or eliminating waste and defects. Change and<br />
improvement are successful when accomplished at the level <strong>of</strong> daily work management.<br />
These accomplishments are integrated into the overall activities <strong>of</strong> the organization.<br />
Performance management techniques capture the results <strong>of</strong> these improvements at the<br />
middle and senior management levels.<br />
The concept <strong>of</strong> <strong>Modular</strong> <strong>kaizen</strong> is dependent upon accurate measures to move effectively<br />
through the planned steps <strong>of</strong> an improvement project. Organizing tasks within a <strong>Modular</strong><br />
<strong>kaizen</strong> project includes a possibility that one task may be performed and the next task left<br />
to wait until the improvement team comes together again much later to pick up the<br />
problem-solving and decision-making. Having a well-defined, organized matrix <strong>of</strong><br />
requirements provides a solid foundation for resuming effective operations after a<br />
planned hiatus.<br />
<strong>Modular</strong> <strong>kaizen</strong> suggests the development <strong>of</strong> a Tri-Metric Matrix to support performance<br />
management for most processes. The Tri-Metric Matrix helps guide the decision maker to<br />
measure the important aspects <strong>of</strong> a process’s capacity, process capability, and outcomes.<br />
Because <strong>of</strong> the interrelated nature <strong>of</strong> processes within a total system, the overall capacity,<br />
capability, and outcome <strong>of</strong> one process is usually dependent upon interaction with other<br />
processes. Chapter 7 describes the Tri-Metric Matrix and how it supports the overall<br />
performance <strong>of</strong> the organization using the <strong>Modular</strong> <strong>kaizen</strong> approach.<br />
43<br />
________________________________________________________________________<br />
<strong>Modular</strong> <strong>kaizen</strong>: Dealing with Disruptions Chapter 4
44<br />
________________________________________________________________________<br />
<strong>Modular</strong> <strong>kaizen</strong>: Dealing with Disruptions
Chapter 5: Focus on the Disruption – Develop the Response Team<br />
Introduction<br />
The main enemy <strong>of</strong> efficient operations is disruption. Anything that hinders the smooth<br />
and efficient flow <strong>of</strong> interactions between organizational processes required to reach the<br />
goal must be identified and removed. Chapter 1, The Value <strong>of</strong> Performance Management,<br />
introduces the importance <strong>of</strong> tying improvement efforts to the key performance indicators<br />
<strong>of</strong> the organization. Chapter 4, System View <strong>of</strong> the Process, explores the intricate balance<br />
<strong>of</strong> minimizing disruption among cross-functional processes and the broader challenge <strong>of</strong><br />
efficiency across suppliers, organizations, and customers.<br />
Disruption Identification<br />
Plan<br />
<strong>Modular</strong> <strong>kaizen</strong> Flow<br />
Act<br />
Do/<br />
Disrupt<br />
Check<br />
Disruption<br />
check<br />
do<br />
<strong>Modular</strong><br />
Kaizen<br />
act<br />
plan<br />
Figure 5.1: Using the “Check:” phase to Identify Disruption<br />
The iterative check and act cycle described in previous chapters is the basic building<br />
block for minimizing disruption. The Plan-Do-Check-Act (PDCA) cycle shown in Figure<br />
5.1 is constantly comparing what is actually happening in a process to what is supposed<br />
to happen. Figure 5.2 illustrates a simple gap analysis model where a sensor is applied to<br />
a defined process (1). The sensor (2), either technical or human, compares the measured<br />
process performance against an expected goal (3). Depending on the comparison <strong>of</strong><br />
actual performance to the goal, an actuator is employed. If the comparison is equal to<br />
actual or within specified performance limits, the actuator (4) may simply document that<br />
performance is within expected variation and return to normal processing (5). If the<br />
45<br />
________________________________________________________________________<br />
<strong>Modular</strong> <strong>kaizen</strong>: Dealing with Disruptions Chapter 5
comparison shows actual performance beyond normal variation, the actuator performs<br />
additional measures to ascertain whether the process is capable <strong>of</strong> meeting expected<br />
outcomes through improvement or redesign, if necessary.<br />
Figure 5.1 makes allowances for the three different actuator responses, based upon the<br />
severity <strong>of</strong> the disruption. The check phase in the routine PDCA cycle monitors key<br />
performance indicators for sustainability <strong>of</strong> normal operations. When either technical<br />
equipment or front-line personnel observe a disruption that is beyond normal process<br />
variation, the <strong>Modular</strong> <strong>kaizen</strong> flow enters the Check–Act–Plan–Do (CAPD) <strong>Modular</strong><br />
<strong>kaizen</strong> response cycle.<br />
The Check phase in the CAPD <strong>Modular</strong> <strong>kaizen</strong> cycle gathers additional data to assess the<br />
severity <strong>of</strong> the disruption identified by the Do phase in the routine PDCA cycle. If the<br />
disruption can be resolved with minimal improvement to the process or related resources,<br />
the Act phase is employed to return the process to normal operation. The green and red<br />
arrows in Figure 5.1 show entry into the CAPD cycle from the routine PDCA cycle, entry<br />
into the Act phase to resolve the minimal disruption, and return to the PDCA cycle <strong>of</strong><br />
normal operations.<br />
If the Check phase in the CAPD <strong>Modular</strong> <strong>kaizen</strong> response cycle indicates that the<br />
disruption is severe enough to require significant improvement or redesign <strong>of</strong> the process,<br />
the whole CAPD cycle will be activated. The response team will analyze the data from<br />
the Check phase, use the Act phase to identify alternative solutions to the disruption,<br />
move to the Plan phase to design the specific improvement or total redesign, then pilot<br />
the solution during the Do phase <strong>of</strong> the CAPD cycle. If the pilot solution resolves the root<br />
cause <strong>of</strong> the disruption, the operation returns to the PDCA cycle to formalize the changes<br />
and update documentation for sustainability. If the solution does not meet long-term<br />
requirements, the response team remains in the CAPD <strong>Modular</strong> <strong>kaizen</strong> cycle for<br />
continued measurements and improvement efforts.<br />
Prioritize Disruptions Based Upon Areas <strong>of</strong> Concern<br />
<strong>Modular</strong> <strong>kaizen</strong> uses the key performance indicators (KPIs) established during strategic<br />
planning to prioritize work on minimizing disruption. KPIs are established as the basis<br />
for performance management across the total set <strong>of</strong> processes which comprise the<br />
organization. Performance management tracks KPIs on a consistent basis as the target<br />
for identifying disruptions. <strong>Modular</strong> <strong>kaizen</strong> analyzes the disruption during the Check<br />
phase as Areas <strong>of</strong> Concern for further data gathering and response team action.<br />
Figure 5.2 illustrates the sequence <strong>of</strong> activities to establish measures and indicators at the<br />
daily work management level. As indicated in Chapter 1, The Value <strong>of</strong> Performance<br />
Management, the head <strong>of</strong> an organization and functional directors set organization-level<br />
46<br />
________________________________________________________________________<br />
<strong>Modular</strong> <strong>kaizen</strong>: Dealing with Disruptions Chapter 5
goals and objectives, based upon the Voice <strong>of</strong> the Customer. 1 A working draft <strong>of</strong> the<br />
strategic plan, including high-level objectives and outcomes, cascades down through the<br />
organization to be assessed by those who will perform the daily work to accomplish<br />
the tasks.<br />
Alignment “Vertically” Within the Organization<br />
Duffy 2005<br />
Figure 5.2: Align core processes vertically within the organization<br />
As shown in Figure 5.2, policy is deployed to the workforce, while actions, dates, and<br />
tasks to meet goals and objectives are returned upwards for validation and integration<br />
into a final strategic plan. Measures and indicators can only be efficiently created once<br />
tasks are identified. High-level outcome indicators and generic performance expectations<br />
are set for all objectives in the early stages <strong>of</strong> strategic planning. Once the policies, goals,<br />
and objectives cascade downward into the organization, management, team leaders, and<br />
workforce verify capability <strong>of</strong> operations level processes to meet the high-level indicators<br />
Once an Area <strong>of</strong> Concern (AoC) is identified by the response team, a Disruption and<br />
Impact Matrix is used to clarify the details <strong>of</strong> the situation. Figure 5.3 shows a Disruption<br />
and Impact Matrix with a number <strong>of</strong> AoCs listed in table format. The matrix is developed<br />
1 Voice <strong>of</strong> the Customer (VOC) is a result <strong>of</strong> an organization’s efforts to understand customers’ needs and<br />
expectations and to provide products and services that truly meet such needs and expectations.<br />
47<br />
________________________________________________________________________<br />
<strong>Modular</strong> <strong>kaizen</strong>: Dealing with Disruptions Chapter 5
along a force field analysis 2 concept which seeks to minimize the disruption by<br />
strengthening the ability <strong>of</strong> the AoCs to meet customer requirements or performance<br />
management objectives. The end goal <strong>of</strong> the Disruption and Impact Matrix is to guide the<br />
response team to return the disrupted state to the current, desired state <strong>of</strong> the process.<br />
How?<br />
Areas <strong>of</strong> Concern (AoC)<br />
Control<br />
Influence<br />
AoC<br />
AoC<br />
Impacts<br />
AoC<br />
Disruption<br />
Disrupted State<br />
AoC<br />
Current Stable State<br />
Figure 5.3: Disruption and Impact Matrix<br />
An additional aspect <strong>of</strong> the Disruption and Impact Matrix is the left column - Control and<br />
Influence. This column prompts the response team to ascertain whether they are in<br />
control <strong>of</strong> the AoC and its resolution or whether they can only influence the resolution <strong>of</strong><br />
the disrupted state. Different behaviors are required when attempting to influence the<br />
outcome <strong>of</strong> others’ actions, rather than being in control <strong>of</strong> the resources and decisions.<br />
Figure 5.4 is a representation <strong>of</strong> a Circle <strong>of</strong> Influence.<br />
Figure 5.4: Circle <strong>of</strong> Influence<br />
2 For more information on Force Field Analysis, refer to Bialek R, Duffy G, and Moran J, The <strong>Public</strong><br />
<strong>Health</strong> Quality Improvement Handbook. Milwaukee, WI: Quality Press; 2009.<br />
48<br />
________________________________________________________________________<br />
<strong>Modular</strong> <strong>kaizen</strong>: Dealing with Disruptions Chapter 5
The authors have found a useful approach for involving others in the resolution <strong>of</strong><br />
process disruptions from Dr. Stephen R. Covey. 3 The most effective area in which to act<br />
is that in which we have the strongest control. As seen in Figure 5.5, the area <strong>of</strong> control is<br />
in the center <strong>of</strong> the Circle <strong>of</strong> Influence. Process owners and those who control the<br />
resources that support public health programs have the best opportunity to assess and<br />
anticipate areas <strong>of</strong> disruption to those programs. They call the shots; they own the<br />
environment.<br />
The next most effective area in which to manage disruption is where strong partnerships<br />
with customers, community, corporate sponsors, and related agencies exist. This area is<br />
one in which some level <strong>of</strong> influence over the use <strong>of</strong> resources and the eventual outcomes<br />
<strong>of</strong> the programs <strong>of</strong> involvement are evident. A group may not own the resources, but it<br />
can use its relationship with others to guide the positive outcomes <strong>of</strong> activities and<br />
decision-making.<br />
The outer loop <strong>of</strong> concern is the highest level <strong>of</strong> risk for both positive and negative<br />
consequences <strong>of</strong> decisions or actions. Areas where a person is interested in the outcomes<br />
but has little or no ability to guide and influence the actions <strong>of</strong> others require a complex<br />
set <strong>of</strong> relationships. Response teams are <strong>of</strong>ten on the edges <strong>of</strong> the activity and outcomes<br />
for programs such as this. It is important not to commit scarce resources, personnel, or<br />
reputation on the outcomes <strong>of</strong> programs where potential exists but influence or control<br />
over what happens is not available.<br />
The control and influence column in Figure 5.3 leads the response team to the initial<br />
consideration <strong>of</strong> how to address the AoC to impact the disruption most efficiently. The<br />
“How” column in Figure 5.4 can only be addressed once the team understands how much<br />
control they have over the resources required to affect changes to the disrupted process.<br />
Chapter 6, <strong>Modular</strong> Flow/Rapid Cycle, will introduce additional tools to drill down into<br />
the details <strong>of</strong> the disruption to gather specific data and implement effective and efficient<br />
resolutions based upon the performance management requirements <strong>of</strong> the organization.<br />
Choose a Team that Tolerates Conflict<br />
The response team chartered to address the disruption and return the impacted process to<br />
standard operation will need a strong set <strong>of</strong> skills and behaviors which include conflict<br />
management. Conflict is a recognized stage in the team development process. Scholtes,<br />
Joiner, and Streibel describe the four phases <strong>of</strong> team development (forming, storming,<br />
norming, and performing) in The Team Handbook. 4 Since conflict will happen during<br />
most disruption response activities, it might as well be beneficial.<br />
3 Covey S. The 7 Habits <strong>of</strong> Highly Effective People. New York: Simon & Schuster; 1990.<br />
4 Joiner B, Scholtes P, Streibel,B. The Team Handbook, 2 nd ed. Madison, WI: Oriel Incorporated; 2000.<br />
49<br />
________________________________________________________________________<br />
<strong>Modular</strong> <strong>kaizen</strong>: Dealing with Disruptions Chapter 5
Conflict between or among team members can occur at any <strong>of</strong> the stages but is more<br />
likely to surface during the Forming and Storming stages. Conflict is common and useful.<br />
It is a sign <strong>of</strong> change and movement. Conflict is neither good nor bad. The effort should<br />
not be to eliminate conflict but to refocus it as a productive rather than destructive force.<br />
Conflict can be a vital, energizing force at work in any team. When conflict occurs within<br />
or among teams, it should not be ignored. Addressing the conflict, using it to find the<br />
friction that change has created within the team, and using problem-solving techniques to<br />
resolve and improve the situation generate more positive outcomes.<br />
When addressing a disruption in core business processes, it is common to experience<br />
conflict among interested parties. The response team can use this conflict to initiate<br />
positive change in resolving the disruption. Tools such as Force Field Analysis, and<br />
Force & Effect + ca 5 , and effective facilitation techniques, are useful in drawing conflict<br />
into the open for direct communication among the conflicted stakeholders. The goal is to<br />
use the issues in conflict to select the most efficient resolution that is consistent with<br />
organizational or customer requirements.<br />
Leaders, with guidance from a facilitator if needed, can help to transform a conflict into a<br />
problem-solving event by:<br />
<br />
<br />
<br />
<br />
<br />
<br />
<br />
Welcoming differences among teams, team members, and stakeholders<br />
Listening attentively with understanding rather than judgment<br />
Helping to clarify common goals among the conflicting parties<br />
Acknowledging and accepting the feelings <strong>of</strong> the individuals involved<br />
Offering support to the parties in resolving the differences<br />
Reinforcing the value <strong>of</strong> each <strong>of</strong> the parties to the organization as a whole<br />
Creating appropriate means for communication between those involved in the<br />
conflict<br />
No matter what form teams take, common characteristics <strong>of</strong> all successful teams exist.<br />
The organization must focus on integrating these characteristics into daily work<br />
management BEFORE implementing the team concept. Much is written about these<br />
components <strong>of</strong> effective team building; this chapter covers the basics.<br />
John Zenger 6 includes the following as some crucial characteristics for members when<br />
first initiating a team environment:<br />
<br />
<br />
Common goals;<br />
Leadership;<br />
5 The Force & Effect + ca tool is described in Chapter 6, <strong>Modular</strong> Flow/Rapid Cycle.<br />
6 Zenger, et al, Leading Teams, Mastering the New Role. San Jose, CA: Zenger-Miller, Inc; 1994.<br />
50<br />
________________________________________________________________________<br />
<strong>Modular</strong> <strong>kaizen</strong>: Dealing with Disruptions Chapter 5
Involvement;<br />
Self-esteem;<br />
Open communication;<br />
Power to make decisions;<br />
Planning;<br />
Trust;<br />
Respect for others; and<br />
Conflict resolution.<br />
These characteristics are major contributors to high employee morale. They also<br />
positively influence customer satisfaction, whether internal or external. The same skills<br />
that leaders are required to use work well at all levels <strong>of</strong> the organization. Figure 5.5<br />
summarizes many <strong>of</strong> the characteristics and elements <strong>of</strong> dynamic and successful teams.<br />
Figure 5.5: Characteristics <strong>of</strong> an Effective Team 7<br />
7 Beecr<strong>of</strong>t GD, Duffy G, Moran J. The Executive Guide to Improvement and Change. Milwaukee, WI:<br />
Quality Press; 2002.<br />
51<br />
________________________________________________________________________<br />
<strong>Modular</strong> <strong>kaizen</strong>: Dealing with Disruptions Chapter 5
Application <strong>of</strong> Disruption and Impact Matrix<br />
The quality improvement (QI) team for a local health department was called upon to<br />
address a severe disruption in the immunization department. Records in the immunization<br />
database were incorrect or missing, causing insufficient vaccine re-stocking, lost funds<br />
recovery, and incorrect patient records. Figure 5.7 is the Disruption and Impact Matrix,<br />
reflecting the response team’s first assessment <strong>of</strong> the Areas <strong>of</strong> Concern for improvement<br />
or redesign. The disrupted state is identified on the right side <strong>of</strong> the form as “Records<br />
incomplete or missing. Vaccines unaccounted for.” The current stable state was entered at<br />
the bottom <strong>of</strong> the form as “All immunization records correctly updated by End <strong>of</strong> Day.<br />
All vaccines accounted for and expiration dates controlled.”<br />
The team observed the clinic immunization process and discovered that the nursing staff<br />
was not updating the customer record at the end <strong>of</strong> each immunization event. Some<br />
nurses had not been trained on the immunization data collection application so were<br />
either guessing what fields to fill in or asking another nurse to perform the update for<br />
them. The backlog <strong>of</strong> updates <strong>of</strong>ten rolled into the next day, when memories were less<br />
accurate, thereby further corrupting the information.<br />
How?<br />
Areas <strong>of</strong> Concern (AoC)<br />
Control<br />
Influence<br />
AoC<br />
AoC<br />
Impacts<br />
AoC<br />
Disruption<br />
Disrupted State<br />
AoC<br />
Current Stable State<br />
Figure 5.6: Disruption and Impact Matrix for Immunization Response Team<br />
The team agreed that the local health department staff controlled when the record was<br />
updated and what data was entered into the collection screen. The top two Areas <strong>of</strong><br />
Concern in Figure 5.6 are in the “Control” area <strong>of</strong> the form. The team also realized that<br />
the shipment <strong>of</strong> replacement vaccine was not under health department control but could<br />
be heavily influenced by having correct inventory information in the database from which<br />
the supplier drew restocking counts. Likewise, funding came from outside the department<br />
52<br />
________________________________________________________________________<br />
<strong>Modular</strong> <strong>kaizen</strong>: Dealing with Disruptions Chapter 5
and was also based upon the quantity <strong>of</strong> vaccine used and the population served. Supply<br />
and Funding Areas <strong>of</strong> Concern were placed in the “Influence” area <strong>of</strong> the form.<br />
The response team used the visual representation provided by the Disruption and Impact<br />
Matrix to brainstorm efficient solutions to the process disruptions. Their goal was to<br />
strengthen the impact <strong>of</strong> the Areas <strong>of</strong> Concern - Accurate, Timely, Supply, and Funding -<br />
in order to minimize or eliminate the disruption. The team came to consensus on “How”<br />
each impact would be addressed and added this information to the form. The “How” at<br />
this point was a high-level suggestion requiring implementation planning. This scenario<br />
will be continued in Chapter 6, <strong>Modular</strong> Flow/Rapid Cycle, with further drill down into<br />
disruption resolution.<br />
53<br />
________________________________________________________________________<br />
<strong>Modular</strong> <strong>kaizen</strong>: Dealing with Disruptions Chapter 5
54<br />
________________________________________________________________________<br />
<strong>Modular</strong> <strong>kaizen</strong>: Dealing with Disruptions
Chapter 6: <strong>Modular</strong> Flow for Rapid Cycle Improvement<br />
<strong>Modular</strong> <strong>kaizen</strong> is a structured plan for scheduling improvement tasks, including the<br />
availability <strong>of</strong> information and resources in units which can be performed within the time<br />
limits <strong>of</strong> a busy and interruption-filled work environment. This planning involves<br />
employees in a well-defined context <strong>of</strong> tasks and deliverables closely aligned to the<br />
highest priorities <strong>of</strong> the department. <strong>Modular</strong> <strong>kaizen</strong> takes advantage <strong>of</strong> the lean concept<br />
<strong>of</strong> Rapid Cycle Plan-Do-Check-Act (PDCA) to plan and implement improvements<br />
quickly and effectively, using the resources available in the time allowed.<br />
Although <strong>Modular</strong> <strong>kaizen</strong> is also effective with more complex improvement models such<br />
as Define-Measure-Analyze-Improve-Control (DMAIC) or Design for Six Sigma<br />
(DFSS), this text focuses on the entry level model <strong>of</strong> PDCA. Later publications will<br />
associate the <strong>Modular</strong> <strong>kaizen</strong> approach to more complex improvement models.<br />
While it is tempting to think that a single improvement approach will work well for an<br />
entire organization, the workplace is rarely so tidy. In reality, the unit <strong>of</strong> improvement<br />
activity should be matched to the response team members’ specific jobs and roles—or at<br />
least distinct categories <strong>of</strong> jobs and roles. To resolve a disruption in an individual<br />
department or function, it is not enough to launch a set <strong>of</strong> organization-wide initiatives or<br />
to count on a piece <strong>of</strong> application s<strong>of</strong>tware. Instead, leaders <strong>of</strong> busy health workers must<br />
understand the specific task needs <strong>of</strong> their personnel and tailor improvement activities to<br />
these requirements.<br />
Few organizations have thought systematically about where additional structured<br />
improvement planning could enhance efficiency. A good starting point is to identify the<br />
working characteristics <strong>of</strong> response team members and understand the range <strong>of</strong> tasks that<br />
they perform. The unit <strong>of</strong> analysis should be a particular job, not the organization as a<br />
whole. This practice is important in <strong>Modular</strong> <strong>kaizen</strong> because different pr<strong>of</strong>essionals and<br />
staff within the same organization <strong>of</strong>ten have very different knowledge and information<br />
requirements. Furthermore, information is more readily structured for some jobs than for<br />
others, and some workers might resist planned improvement activities more than others.<br />
Change management techniques to assist in matching approaches to working styles are<br />
addressed in a later chapter.<br />
Too <strong>of</strong>ten we encounter teams or organizations that launch an improvement effort but<br />
take three months to do what could be accomplished in three days or three hours. They<br />
waste too much time and energy by not solving the problem quickly. These teams fail to<br />
hold the gains or move on to the next organizational challenge. Consequences <strong>of</strong><br />
improperly planning an improvement initiative or not engaging in Rapid Cycle PDCA is<br />
that team members lose interest, become bored with a long process, do not gain<br />
experience and knowledge in applying QI, and do not see the impact <strong>of</strong> their efforts for a<br />
long time.<br />
55<br />
________________________________________________________________________<br />
<strong>Modular</strong> <strong>kaizen</strong>: Dealing with Disruptions Chapter 6
So what is Rapid Cycle PDCA? The word “Rapid” means completed or occurring in a<br />
brief period <strong>of</strong> time and characterized by speed. “Cycle” means an interval during which<br />
a recurring sequence <strong>of</strong> events occurs. 1 Therefore Rapid Cycle PDCA, as shown in<br />
Figure 6.1, is applying the recurring sequence <strong>of</strong> PDCA in a brief period <strong>of</strong> time to solve<br />
a problem or issue facing a team or organization that will achieve breakthrough or<br />
continuous improvement results quickly. 2<br />
PDCA should be repeatedly implemented in spirals <strong>of</strong> increasing<br />
knowledge <strong>of</strong> the system that converge on the ultimate goal, each<br />
cycle closer than the previous.<br />
A<br />
P<br />
A<br />
P<br />
C<br />
D<br />
A<br />
C<br />
P<br />
D<br />
C<br />
D<br />
Hold the Gains<br />
Rapid<br />
Cycle*<br />
Project Difficulty<br />
Knowledge & Experience<br />
Figure 6.1: Rapid Cycle PDCA as a sequence <strong>of</strong> increasingly difficult improvement<br />
acts<br />
<strong>Modular</strong> <strong>kaizen</strong> uses the concept <strong>of</strong> Rapid Cycle PDCA to plan improvements in task<br />
level activities that can be performed quickly. These focused tasks are interspersed with<br />
daily work normally performed by response team members. Daily work management is<br />
explained in Chapter 10.<br />
Figure 6.2 shows the Rapid Cycle Process Model which defines the steps to ensure a<br />
successful rapid cycle application <strong>of</strong> PDCA.<br />
1 The Trustees <strong>of</strong> Princeton University. Wordnet: A lexical database for English.<br />
www.wordnet.princeton.edu. Published 2011. Accessed February 14, 2011.<br />
2 Duffy G, Moran J, Riley, W. Rapid Cycle PDCA. Quality Texas <strong>Foundation</strong> Update. August, 2009.<br />
56<br />
________________________________________________________________________<br />
<strong>Modular</strong> <strong>kaizen</strong>: Dealing with Disruptions Chapter 6
Understand the<br />
issue, and Current State<br />
Define the desired Future<br />
State<br />
Develop a clear<br />
AIM Statement<br />
Consultative<br />
Training &<br />
Team<br />
Formation<br />
Repeat the<br />
Rapid PDCA<br />
Cycle<br />
Monitor and Hold<br />
The Gains<br />
Rapid Cycle Period<br />
Complete Rapid Cycle PDC/SA Checklist<br />
Define the Improvement Timeline<br />
Apply Training<br />
Analyze Baseline Data<br />
Develop Solutions<br />
Launch Pilot Improvements<br />
Additional training sessions<br />
Develop improvement measures<br />
Evaluate results<br />
Figure 6.2: Rapid Cycle PDCA/PDSA Process Model 3<br />
The Rapid Cycle Process is defined as follows:<br />
<br />
<br />
<br />
<br />
<br />
<br />
<br />
<br />
<br />
<br />
Realization <strong>of</strong> a problem to correct. Management is committed to making the<br />
change.<br />
Act to start a resolution or change to the problem by utilizing the QI tools and<br />
techniques.<br />
Plan for success by developing a clear AIM statement.<br />
Involve key constituents in the PDCA process.<br />
Develop the change team and establish the rapid cycle timeline.<br />
Consultative training interventions as required by the team occur.<br />
analYze baseline data and understand the current state and scope <strong>of</strong> the problem.<br />
Construct solutions to get to the desired future state.<br />
Launch pilot improvement solutions to determine if the desired change can be<br />
achieved.<br />
Evaluate results achieved from pilot improvement, make any necessary<br />
adjustments, and launch it throughout the organization.<br />
3 Duffy G, Moran J, Riley, W. Rapid Cycle PDCA. Quality Texas <strong>Foundation</strong> Update. August, 2009.<br />
57<br />
________________________________________________________________________<br />
<strong>Modular</strong> <strong>kaizen</strong>: Dealing with Disruptions Chapter 6
The utilization <strong>of</strong> a Rapid Cycle PDCA process helps organizations realize a quick return<br />
on their investment in QI. Some <strong>of</strong> the benefits <strong>of</strong> instituting Rapid Cycle PDCA are:<br />
Short cycles <strong>of</strong> change to accelerate quality improvement (QI) in the organization;<br />
Hold the gains as a platform for the next level <strong>of</strong> project improvement;<br />
Development <strong>of</strong> a broad base <strong>of</strong> QI knowledge and experience in the organization<br />
that will help in the establishment <strong>of</strong> an organization-wide culture <strong>of</strong> quality and<br />
excellence;<br />
Solutions to many organizational problems that will promote needed<br />
organizational change and improvement; and<br />
Provision <strong>of</strong> an iterative opportunity for team members to reinforce their QI<br />
knowledge quickly in the next project.<br />
A Pre-Planning Check Sheet has been developed to help in using Rapid Cycle PDCA 4<br />
(see Appendix C). The Check Sheet contains questions that guide the response team<br />
when starting a Rapid Cycle or <strong>Modular</strong> <strong>kaizen</strong> QI project. This checklist addresses the<br />
Rapid Cycle pre-planning to ensure a successful improvement project. The Check Sheet<br />
provides columns to indicate what has been completed (√) and what needs to be done<br />
(TBD) along with the expected completion date.<br />
Example <strong>of</strong> <strong>Modular</strong> <strong>kaizen</strong> flow <strong>of</strong> tools and techniques<br />
The <strong>Modular</strong> <strong>kaizen</strong> approach to rapid cycle improvement is structured to fit within the<br />
existing time and resource requirements <strong>of</strong> the response team, resolving the disruption.<br />
The rest <strong>of</strong> this chapter illustrates the flow <strong>of</strong> planning and design <strong>of</strong> a <strong>Modular</strong> <strong>kaizen</strong><br />
event related to the major power outage scenario introduced in Chapter 3. A number <strong>of</strong><br />
the elements <strong>of</strong> the House <strong>of</strong> <strong>Modular</strong> <strong>kaizen</strong> are employed to identify the disruption,<br />
focus on high priority Areas <strong>of</strong> Concern, map a process to respond to the disruption in the<br />
short term, and implement a full PDCA cycle to resolve the disruptive issues through<br />
strategic process improvement and redesign.<br />
Not all elements <strong>of</strong> the House <strong>of</strong> <strong>Modular</strong> <strong>kaizen</strong> found in Chapter 2 (Figure 2.2) are<br />
required for each disruptive occurrence. The elements illustrated in the Major Urban<br />
Hospital Power Outage example are:<br />
#4: Disruption Identification #12 Quality at Source<br />
#6: Force and Effect + ca #13 Process Control<br />
#7: Tri-metric Matrix #14 Fast Transition<br />
#8: Teams #17 Daily Work Management<br />
#9: Project Management<br />
4 Some Rapid Cycle explanations refer to the Plan-Do-Study-Act (PDSA) cycle rather than PDCA. Dr.<br />
Deming used the PDSA term in later years to reduce the tension sometimes generated by using the word<br />
“check.” The “check” term is used with <strong>Modular</strong> <strong>kaizen</strong> to refer to continuous monitoring and measuring<br />
in support <strong>of</strong> organizational performance management.<br />
58<br />
________________________________________________________________________<br />
<strong>Modular</strong> <strong>kaizen</strong>: Dealing with Disruptions Chapter 6
The continuous monitoring <strong>of</strong> operational performance is the entry point for disruption<br />
identification. Frequently, standard measures <strong>of</strong> key department objectives will provide<br />
data indicating that something is hindering the smooth flow <strong>of</strong> a critical process. These<br />
subtle indicators are <strong>of</strong>ten missed in a highly interruption-filled organization because<br />
people are focused on immediate tasks. A combination <strong>of</strong> project management, tri-metric<br />
matrix (Chapter 7), and daily work management (Chapter 10) provides the opportunity<br />
for team leaders, senior management, or front-line staff to compare actual process<br />
performance against the documented standards <strong>of</strong> performance.<br />
Figure 6.3 is the completed Association <strong>of</strong> Disruption to Area <strong>of</strong> Concern (ADAoC)<br />
Form for the power outage scenario. The form provides a checklist <strong>of</strong> major causes <strong>of</strong><br />
disruption within organizations. Other sources <strong>of</strong> disruption can be added to the form to<br />
personalize the instrument. In this scenario, the disruption was quite apparent as soon as<br />
it happened. No power in a busy, urban hospital is a catastrophe with multiple associated<br />
disruptions.<br />
The four major disruptions identified for the power outage were:<br />
<br />
<br />
<br />
<br />
Balancing work priorities<br />
Competing assignments<br />
Environmental conditions<br />
Unavailability <strong>of</strong> equipment, tools, or documentation<br />
Senior management rallied immediately, as seen in the scenario introduced in Chapter 3,<br />
by calling a situation meeting at 6:30 AM to check the current status <strong>of</strong> hospital<br />
operations and patient schedules. Teams were assigned to check the status <strong>of</strong> patients,<br />
surgery schedules, power generators, room temperatures, rehabilitation center<br />
appointments, and other Areas <strong>of</strong> Concern stemming from the total loss <strong>of</strong> power within<br />
the facility. Figure 6.4 is a Disruption and Impact Matrix listing the major Areas <strong>of</strong><br />
Concern (AoC) facing senior hospital leadership. The AoCs are categorized as those<br />
within the control <strong>of</strong> the hospital or only able to be influenced by senior leadership. The<br />
“How” to address the area depended on the level <strong>of</strong> control the hospital had on the AoC.<br />
For example, rescheduling elective surgery was completely within the control <strong>of</strong><br />
operating room administration. Without power in the facility, lowering the temperature<br />
on a hot July day needed assistance from outside the hospital and could only be<br />
influenced by senior leadership.<br />
59<br />
________________________________________________________________________<br />
<strong>Modular</strong> <strong>kaizen</strong>: Dealing with Disruptions Chapter 6
Association <strong>of</strong> Disruption to Area <strong>of</strong> Concern: Long-Term Power Outage in Large,<br />
Urban Hospital<br />
√ Potential Cause <strong>of</strong> Disruption How the Disruption Impacts Specific Daily Work<br />
Management<br />
√ Balancing Work Priorities –<br />
fluctuating work demands that create<br />
an unstable work schedule observed<br />
to interfere with performance based<br />
upon key performance indicators<br />
Implementation failure– failing to<br />
translate a customer requirement<br />
into concrete action within the<br />
performance parameters<br />
√ Competing Assignments –<br />
interference from other tasks that are<br />
customarily performed parallel to<br />
this process<br />
√ Environmental Conditions –<br />
physical factors within the process<br />
environment that do or are<br />
anticipated to impact performance<br />
and/or process outcomes<br />
√<br />
Unavailability <strong>of</strong> Equipment, Tools<br />
or Documentation – constraints that<br />
impact the smooth execution <strong>of</strong><br />
tasks to meet performance indicators<br />
and process outcomes<br />
The immediate need to anticipate and prepare for a<br />
potentially long power outage in the hospital<br />
destabilized existing morning rounds, scheduled<br />
surgeries, and other daily management activities.<br />
Although the high-priority requirement to prepare<br />
for the power outage was critical, a need to<br />
maintain a minimum service level for some patients<br />
and transfer others who could not be<br />
accommodated in-house was unavoidable.<br />
Facilities, security, maintenance, nursing,<br />
physicians and administrative staff were required to<br />
perform normal daily management activities while<br />
taking on additional tasks associated with the<br />
unexpected power outage.<br />
The anticipated heat in the hospital during the July<br />
power outage created a potentially life-threatening<br />
environment for patients with respiratory<br />
conditions. Lack <strong>of</strong> power negated use <strong>of</strong> surgical<br />
rooms. Medical and culinary processes were<br />
disrupted. Other environmental and sanitary<br />
conditions impacted many normal processes.<br />
Inadequate backup generators, fans, cooling<br />
equipment, medical equipment and other tools<br />
created a challenge for support personnel. Response<br />
teams were called upon to devise innovative plans<br />
for assessing the short and long-term needs <strong>of</strong><br />
patients, out-patients and those scheduled for<br />
elective surgery during the power outage period.<br />
60<br />
________________________________________________________________________<br />
<strong>Modular</strong> <strong>kaizen</strong>: Dealing with Disruptions Chapter 6
Evidence–Based Research on Real-<br />
Time Application - Missing best<br />
practice information on successful<br />
application <strong>of</strong> knowledge and tools<br />
for implementation <strong>of</strong> performance<br />
management<br />
Cause & Effect Contingencies –<br />
alternative approaches not identified<br />
in advance for minor process<br />
adjustments, either through<br />
improvement or redesign<br />
Organizational Cracks – work<br />
delays; bottlenecks, missing/wrong<br />
materials; poor downstream or<br />
cross-functional communication; or<br />
other similar barriers affecting<br />
process performance<br />
Unclear Policies – unclear or non–<br />
existent policies conflict with<br />
process performance; also where<br />
policy directly contradicts a work<br />
direction or intuitive action<br />
Politics – politically expedient<br />
actions cause conflict with efficient<br />
performance to meet customer<br />
requirements<br />
Power & Accountability –<br />
relationship and power issues with<br />
functional leadership or stakeholders<br />
that adversely affects process<br />
performance. Issues with team<br />
member accountability<br />
Unclear or Conflicting Regulations<br />
–standards or regulations create<br />
conflict for correct and consistent<br />
compliance during process<br />
performance<br />
Work Culture, Norms, and Values –<br />
organizational culture interferes with<br />
the efficient performance <strong>of</strong> process<br />
tasks or negatively impacts process<br />
outcomes<br />
Figure 6.3: Association <strong>of</strong> Disruption to Areas <strong>of</strong> Concern Form<br />
61<br />
________________________________________________________________________<br />
<strong>Modular</strong> <strong>kaizen</strong>: Dealing with Disruptions Chapter 6
How?<br />
Areas <strong>of</strong> Concern<br />
Disruption<br />
Control<br />
Surgery scheduled<br />
50% <strong>of</strong> needed capacity<br />
Use data to drive<br />
performance<br />
Increasing in hospital<br />
Patients<br />
Generators<br />
Audit<br />
Temperature<br />
No Power in<br />
Hospital<br />
Influence<br />
Response to situation<br />
Utility Co.<br />
Make a bad situation<br />
worse<br />
Media<br />
Figure 6.4: Disruption and Impact Matrix – power outage scenarios<br />
Figure 6.5 illustrates a <strong>Modular</strong> <strong>kaizen</strong> tool designed to engage those whose work is<br />
disrupted in the resolution. Most high-performing pr<strong>of</strong>essionals are self-organizing,<br />
meaning that they expect to drive their work processes, not be driven by them. This<br />
characteristic <strong>of</strong> self-organization is frequently observed in health departments.<br />
Effective self-organization is supported by two critical elements: a clear sense <strong>of</strong> identity<br />
and freedom. In organizations, if people are free to make their own decisions, guided by a<br />
clear organizational identity for them to reference, the whole system develops greater<br />
coherence and strength. The organization is less controlling but more orderly. Selforganizing<br />
systems teach an important lesson about how change happens in living<br />
systems. When the system is far from equilibrium (e.g. in disruption), singular or small<br />
influences can have enormous impact. It is not the law <strong>of</strong> large numbers or critical mass<br />
that creates change but the presence <strong>of</strong> a small disturbance that gets into the system and is<br />
then amplified through communication networks. 5<br />
<strong>Modular</strong> <strong>kaizen</strong> uses the inherent self-organizing tendency for knowledge workers to rebalance<br />
disruption within their operating system. Small disruptions use the “check/act”<br />
iterative process described in Chapter 3 to adjust processes continuously as evolutionary<br />
changes occur. Evolutionary changes are generally supportive <strong>of</strong> the current goals and<br />
strategies <strong>of</strong> the organization. In these situations, the traditional strategic planning<br />
process can be used as a reference from which to analyze relevant data and to plan for<br />
improvement <strong>of</strong> existing processes, products, or services.<br />
5 Wheatley M. Leadership and the New Science: Discovering Order in a Chaotic World, 2 nd ed. San<br />
Francisco: Berrett – Koehler Publishers; 1999.<br />
62<br />
________________________________________________________________________<br />
<strong>Modular</strong> <strong>kaizen</strong>: Dealing with Disruptions Chapter 6
Force & Effect + ca Chart<br />
(c) - Capacity <strong>of</strong><br />
Inhouse generators<br />
Power<br />
No Electricity<br />
Environment<br />
(c) – Check for hot spots<br />
Temperature in Building<br />
Increasing<br />
(a) – Secure fuel supply<br />
Disruptive<br />
State:<br />
Massive<br />
Power<br />
Outage<br />
(a) – Stop new<br />
surgeries<br />
(a) – Transfer case<br />
(a) – Communicate<br />
With relatives<br />
(a) – Deploy Fans<br />
(a) – Secure ice supply<br />
(c) – Rooms without Power<br />
OR –<br />
Operating Room<br />
(a) – Shade windows<br />
Cases in rooms<br />
with no power<br />
(c) – Determine<br />
in Discomfort<br />
(a) – Move to<br />
cooler area<br />
Work with EMS<br />
(a) – Transfer<br />
Patients<br />
Discomfort<br />
with heat<br />
Current<br />
Stable<br />
State:<br />
Hospital<br />
Operating<br />
Normally<br />
Figure 6.5: Force & Effect + ca Chart – power outage scenario<br />
Contrasting with evolutionary change is revolutionary change. When the disruption<br />
diverges radically from existing assumptions, more deliberation is required for resolution.<br />
The revolutionary model requires the design <strong>of</strong> options for resolution which may not be<br />
compatible with the traditional strategic direction <strong>of</strong> the organization. Barriers to change<br />
are generally higher when change takes the organization and its workforce away from<br />
their current comfort zone. The goal for revolutionary change is to identify alternative<br />
solutions having either the most positive or least negative impact to the long-term success<br />
<strong>of</strong> the organization. 6<br />
One <strong>of</strong> the most successful techniques for helping people accept change is to involve<br />
them in the change. Figure 6.5 illustrates a Force & Effect + (c)(a) Chart developed by<br />
key leaders from each <strong>of</strong> the major hospital functional units. Leaders from facilities,<br />
engineering, nursing, case management, and the executive <strong>of</strong>fices came together after the<br />
6:30 AM meeting to anticipate the areas <strong>of</strong> greatest impact to normal operations.<br />
Providing a vehicle for the participants to express their concerns verbally reduced<br />
tensions and focused attention on finding solutions, not complaining about barriers. The<br />
actions identified during the development <strong>of</strong> the Force & Effect + (c)(a) form became a<br />
task list <strong>of</strong> small “act” steps.<br />
Once the response team defined the scope <strong>of</strong> the power outage and major impacts to<br />
patients, staff, and other stakeholders, the next step was to generate a high-level picture<br />
6 Beecr<strong>of</strong>t D. Duffy G. and Moran J. The Executive Guide to Improvement and Change. Milwaukee, WI:<br />
Quality Press; 2002.<br />
63<br />
________________________________________________________________________<br />
<strong>Modular</strong> <strong>kaizen</strong>: Dealing with Disruptions Chapter 6
<strong>of</strong> the response process. Figure 6.6 illustrates the SIPOC + CM created that clarified the<br />
boundaries <strong>of</strong> the process. The SIPOC + CM form is the first step in process control. The<br />
form guides discovery concerning suppliers, inputs, general process steps, outputs and<br />
customers <strong>of</strong> the process. In addition, the form provides an opportunity to identify major<br />
constraints to be addressed, as well as identification <strong>of</strong> realistic measures to ensure that<br />
results are achieved.<br />
Once the leadership and selected specialists within the hospital and community had made<br />
a complete “check” <strong>of</strong> the current situation, response teams were employed to perform<br />
small “act” functions to adjust normal operations to accommodate the power outage.<br />
Because <strong>of</strong> the initial project management and process control steps taken by leadership<br />
immediately upon disruption identification, the “act” steps were understood well enough<br />
to be performed succinctly in parallel with monitoring patients and performing required<br />
normal tasks.<br />
High Level S I P O C + CM Form: Power Outage<br />
Begins With:<br />
Major power<br />
outage in city<br />
Constraints:<br />
Process/Activities:<br />
Time before heat <strong>of</strong> day impacts patients,<br />
Availability <strong>of</strong> fans, mobile generators,<br />
subject matter experts, facility power<br />
hookups, limited ability to transfer patients<br />
•6:30 AM status meeting<br />
•“check” on all current processes<br />
•Hold press conference, send press release<br />
•Create check list <strong>of</strong> “check/act” reqt’s<br />
•Transfer patients, adjust schedules<br />
•Install mobile generator<br />
•Continuous monitoring<br />
•Full PDCA cycle, Document lessons learned<br />
Ends With:<br />
Power restored,<br />
PDCA for<br />
stabilized process<br />
Measures<br />
Power when/where needed<br />
# patients impacted<br />
Customer satisfaction<br />
Staff satisfaction,<br />
documentation in place<br />
Inputs:<br />
Information from power company<br />
Mobile generator, fuel<br />
Electrical materials, temperature monitors<br />
Fans, press release, risk analysis <strong>of</strong> losses,<br />
patient requirements, communications<br />
from community, etc.<br />
Outputs:<br />
Safe and secure patients, sufficient energy<br />
supply to meet critical need, adequate cooling<br />
to meet care needs, satisfied relatives,<br />
community leaders, public, updated check list<br />
for future response, lessons learned and<br />
documented, up‐to‐date procedures<br />
Suppliers:<br />
Sr. Hospital Staff, medical/nursing staff, maintenance,<br />
Housekeeping, public relations, other H/C providers<br />
Mayor, governor, state police, subject matter experts,<br />
equipment providers<br />
Customers:<br />
Patients, relatives, staff, Board <strong>of</strong> Directors, community,<br />
senior management, city leaders<br />
Figure 6.6: SIPOC + CM defining the scope and high-level process for power outage<br />
The key to fast transition <strong>of</strong> tasks is clear direction and understanding <strong>of</strong> the end result.<br />
The small “act” steps performed by nursing, engineering, maintenance, and the executive<br />
<strong>of</strong>fice were consistent with standard procedures within the hospital. The timing was<br />
critical, as was the requirement to transfer some patients to other locations and reschedule<br />
elective procedures until power was restored. Each <strong>of</strong> these tasks had been defined and<br />
rehearsed previous to this unexpected outage. The hospital leadership employed “quality<br />
at the source” by having all critical procedures defined, validated, and practiced before<br />
they were needed in an emergency situation.<br />
64<br />
________________________________________________________________________<br />
<strong>Modular</strong> <strong>kaizen</strong>: Dealing with Disruptions Chapter 6
An example <strong>of</strong> the Operating Room response team plan is shown in Figure 6.7. The<br />
operating room administrative staff did a “check” step to ascertain which rooms were<br />
functional using direct power generators and scheduled any critical surgeries into those<br />
rooms. An outcome <strong>of</strong> this “check” step was the realization that not enough local<br />
generators were available to meet the needs <strong>of</strong> critical hospital functions. As described in<br />
the scenario in Chapter 3, the response team alerted senior leadership, who arranged for<br />
the mayor to secure an additional mobile generator from outside the city.<br />
Disruption and Impact Diagram<br />
Areas <strong>of</strong> Concern<br />
c<br />
Disruptive Force<br />
Disruption:<br />
Massive<br />
Power Outage<br />
© Which rooms<br />
Have direct<br />
generator<br />
power<br />
a<br />
Unable to use all OR rooms<br />
Stable<br />
Current<br />
State<br />
Use those<br />
rooms<br />
(a)<br />
OR<br />
Figure 6.7: Disruption and Impact Diagram for operating room response<br />
The continued hourly senior leadership status updates provided additional small “act”<br />
tasks that were integrated into the regular routines <strong>of</strong> the nursing, engineering,<br />
housekeeping, facilities, and administrative staff. Figure 6.8 is a portion <strong>of</strong> the Disruption<br />
form completed as a detailed outcome <strong>of</strong> the Force & Effect + ca chart shown in Figure<br />
6.5. Once the high priority “act” requirements were identified by senior leadership,<br />
functional response teams were empowered to analyze the specific requirements and<br />
perform the small “act” steps to anticipate installation <strong>of</strong> the mobile generator sent from<br />
the northern part <strong>of</strong> the state. Other response teams established a facilities temperature<br />
monitoring schedule as part <strong>of</strong> the normal daily work management activities on the<br />
hospital floors.<br />
The <strong>Modular</strong> <strong>kaizen</strong> Disruption form is a modification <strong>of</strong> a standard risk management<br />
form used in lean enterprise applications. This form is simplified to exclude the weighted<br />
priority calculations <strong>of</strong> the more traditional Failure Mode and Effects worksheet. The<br />
priority for action has already been established by senior leadership during the “check”<br />
step previous to response team engagement.<br />
65<br />
________________________________________________________________________<br />
<strong>Modular</strong> <strong>kaizen</strong>: Dealing with Disruptions Chapter 6
<strong>Modular</strong> <strong>kaizen</strong> Disruption Form<br />
High Priority Barriers to Address<br />
Process or<br />
Activity Name:<br />
Hospital Power Outage<br />
Prepared by: Quality VP<br />
Responsible: President <strong>of</strong> Hospital Date (Orig) _7/8/2001______ (Rev) 7/ 13/2001<br />
Process or<br />
Activity Step<br />
What is the Disruption? Impact <strong>of</strong> Disruption Priority Potential Causes<br />
How is the Disruption<br />
Managed Now?<br />
CHECK<br />
Actions Recommended Performance Measures Owner Actions Taken<br />
DO<br />
PLAN<br />
ACT<br />
What is the<br />
process step/<br />
activity under<br />
investigation?<br />
In what way is the<br />
activity impacted?<br />
What is the impact on the How<br />
outcome (Customer severe is<br />
Requirements) or internal the<br />
requirements? impact?<br />
What are the existing What are the actions for What controls or Who is<br />
controls and reducing the occurrence measures will responsible for What are the completed<br />
What causes the<br />
procedures that prevent <strong>of</strong> the cause or effectively prevent this the actions taken to eliminate<br />
activity to go wrong?<br />
either the cause or minimizing the disruption from recommended the disruption?<br />
disruption?<br />
disruption?<br />
recurring? action?<br />
adeqiate reserves at<br />
Service level agreement with<br />
Electrical power No external electtricity<br />
for the hospital available for 3 days<br />
No fuel for emergency<br />
generators<br />
High<br />
Emergency need for<br />
Long standing contract<br />
large increase in fuel for<br />
with distributor<br />
power generators<br />
Secure reliable fuel supply<br />
Test escalation procedures<br />
distributor, logistics to<br />
delivery fuel, local<br />
storage capacity for<br />
Facilities<br />
Director<br />
fuel distributor, escalation<br />
procedure for emergencies,<br />
alert process with power<br />
cyclical requirement<br />
company<br />
Environmental<br />
control<br />
heat rising in facility<br />
Some patients heat<br />
intolerant, medications,<br />
equipment need cool<br />
environment<br />
High<br />
Loss <strong>of</strong> power to cooling Montiroing <strong>of</strong> tempertures<br />
systems<br />
in facility and equipment<br />
Checklist for patient<br />
Inventory <strong>of</strong> fans, althernate<br />
Director <strong>of</strong><br />
requirements, adequate<br />
power source, transfer<br />
Nursing, Chief<br />
inventory, alternate power<br />
critical patients<br />
Engineer, CFO<br />
plan<br />
Check for hot spots, shade<br />
windows, secure ice supply,<br />
deploy fans, transfer patients<br />
Operating Room Rooms without power<br />
Cases in rooms with no<br />
power<br />
High<br />
Loss <strong>of</strong> external power,<br />
lack <strong>of</strong> adequate<br />
alternate power<br />
Reschedule elective<br />
Stop new surgeries,<br />
surgeries, transfer critical<br />
transfer cases,<br />
patients, move to OR with<br />
communicate with relatives<br />
alternate power<br />
100% critical surgery<br />
coverage, accurae<br />
assessment <strong>of</strong> triage<br />
Reschedule surgeries,<br />
OR admiistration transfer patients, close all but<br />
Director<br />
Ors with alternate power<br />
source<br />
Contact EMS to transfer<br />
Hourly temperature<br />
patients, Contact other<br />
Patient<br />
monitoring<br />
Discomfort with heat<br />
Heat intolerance by some<br />
patients<br />
High<br />
Medical condition, age,<br />
personal decision<br />
Fans, ice packs, transfer<br />
monitoring, "check" on all<br />
patients during rounding,<br />
Temperature, transfer<br />
list, patient satisfaction<br />
Director <strong>of</strong><br />
Nursing<br />
institutions, reschedule<br />
elective surgeries, move to<br />
escalation where appropriate<br />
cooler area, continued<br />
monitoring<br />
Figure 6.8: <strong>Modular</strong> <strong>kaizen</strong> Disruption Form – Prioritizing barriers addressed<br />
The <strong>Modular</strong> <strong>kaizen</strong> Disruption form indicates activity related to a full Check-Act-Plan-<br />
Do response cycle, including how the disruption is managed currently, actions<br />
recommended to resolve the disruption permanently, performance measures to sustain<br />
future outcomes, and actions taken in the short term.<br />
The <strong>Modular</strong> <strong>kaizen</strong> Disruption form is the basic working document from which response<br />
teams derive the requirements for action. The information gathered on the Disruption<br />
form is used by the response team to generate small “act” steps that integrate efficiently<br />
with the normally scheduled activities <strong>of</strong> the department. The intent <strong>of</strong> <strong>Modular</strong> <strong>kaizen</strong> is<br />
to deconstruct a disruption to the extent that the cause is resolved by adjusting what is<br />
already being done in the workplace. Where the impacted process needs more than<br />
adjustment <strong>of</strong> normal operations, a work-around is identified for the short term, while<br />
redesign efforts by subject matter experts are initiated.<br />
The hospital leadership team successfully managed a major power outage in their facility<br />
through fast assessment, engagement <strong>of</strong> the workforce, and effective communication with<br />
outside resource partners. Although the short-term response was effective in reducing<br />
temperature in the hospital and providing power to critical functions, a long-term process<br />
needed to be established to error-pro<strong>of</strong> the situation moving forward.<br />
Figure 6.9 is the process map created once the power outage response was complete.<br />
Once the pressure was <strong>of</strong>f the organization, the response teams performed a full PDCA<br />
cycle to create an efficient, stable process for handling major power outages. The process<br />
map is the beginning <strong>of</strong> a series <strong>of</strong> detailed flowcharts for individual departments and is<br />
66<br />
________________________________________________________________________<br />
<strong>Modular</strong> <strong>kaizen</strong>: Dealing with Disruptions Chapter 6
part <strong>of</strong> the process control element <strong>of</strong> <strong>Modular</strong> <strong>kaizen</strong>. Detailed flowcharts were the basis<br />
<strong>of</strong> formal work instructions for electrical, facilities, maintenance, housekeeping,<br />
medical/nursing, public relations and executive action. These flowcharts are not included<br />
in this scenario. The detailed flowcharts are subject to frequent modification as daily<br />
work management requirements are updated. Including one snapshot in time within a<br />
long-term document is not appropriate.<br />
Figure 6.9: Power Outage Response Process Map<br />
One final yet critical document for standardization <strong>of</strong> performance management is the<br />
Tri-metric matrix. This document ties the high priority actions to resolve a major power<br />
outage with the ongoing performance management system <strong>of</strong> the organization. This form<br />
analyzes the AoCs from the Disruption and Impact form illustrated in Figure 6.4. The<br />
information included in the Tri-metric matrix is part <strong>of</strong> process control for long-term<br />
sustainability <strong>of</strong> the improved set <strong>of</strong> processes for responding to a major power outage.<br />
The <strong>Modular</strong> <strong>kaizen</strong> approach minimized the disruption to normal hospital operations<br />
during a major power outage. The interaction <strong>of</strong> “check” and “act” steps based upon data<br />
rather than emotion and the empowerment <strong>of</strong> the impacted workforce created an efficient,<br />
effective response team effort. The short-term response that was successful although less<br />
efficient than a carefully pre-planned process was sufficient to meet the needs <strong>of</strong> patients,<br />
staff, and community. The follow-on design <strong>of</strong> additional <strong>Modular</strong> <strong>kaizen</strong> steps provided<br />
67<br />
________________________________________________________________________<br />
<strong>Modular</strong> <strong>kaizen</strong>: Dealing with Disruptions Chapter 6
a smooth flow <strong>of</strong> process redesign while subject matter experts engaged in their regular<br />
responsibilities. Chapter 10, Daily Work Management, provides additional guidance on<br />
integrating improvement activities into regularly assigned work schedules.<br />
Tri-Metric Matrix: Power Outage<br />
Tri‐Metric Indicator Definition Baseline Improvement<br />
Target<br />
1. Capacity:<br />
electrical<br />
# Amperage/ Volts Amount <strong>of</strong> power<br />
available to service<br />
equipment needs<br />
Standard required<br />
electrical output <strong>of</strong><br />
hospital requirement at<br />
full patient load<br />
Supplemental capacity<br />
available through hospital<br />
connections to alternate<br />
power sources<br />
2. Capacity:<br />
patient care<br />
•% Coverage<br />
•Cycle time to meet<br />
requirements<br />
All patient needs<br />
adequately covered,<br />
rescheduled, or<br />
transferred to alternate<br />
care provider<br />
Standard, documented<br />
hospital performance<br />
management service<br />
levels<br />
Checklist in place and<br />
rehearsed for anticipated<br />
disruptions to normal<br />
service delivery environment<br />
3. Process:<br />
Temperature<br />
•Degrees Fahrenheit<br />
Comfortable summer<br />
temperature <strong>of</strong> 75<br />
degrees in patient areas<br />
Normal summer<br />
temperature on patient<br />
floors is on the average<br />
75 degrees<br />
Control any raise in<br />
temperature above 75<br />
degrees on patient floors<br />
through alternative cooling<br />
means<br />
4. Outcome:<br />
Satisfaction<br />
% “top box” patient<br />
% “top box” staff<br />
Percent <strong>of</strong> patient and<br />
staff satisfaction rated<br />
as “very satisfied”<br />
Compared to national<br />
hospital survey data <strong>of</strong><br />
patient, staff ratings<br />
Attain greater than 80%<br />
responses above 75th<br />
percentile ranking <strong>of</strong><br />
national survey data<br />
5. Outcome:<br />
Service level<br />
% critical patient care<br />
completed to<br />
requirements<br />
Amount <strong>of</strong> critical and<br />
non‐elective patient<br />
care delivered on time<br />
and within standards<br />
Using industry<br />
accepted, documented<br />
medical and audit<br />
requirements<br />
Increase ability to provide<br />
non‐critical care at defined<br />
service level<br />
Figure 6.10: Tri-metric matrix: power outage scenario<br />
68<br />
________________________________________________________________________<br />
<strong>Modular</strong> <strong>kaizen</strong>: Dealing with Disruptions Chapter 6
Chapter 7: Tri-Metric Matrix<br />
Albert Einstein understood the difficulty <strong>of</strong> measurement when he said “Not everything<br />
that can be counted counts and not everything that counts can be counted.” 1<br />
Organizations spend a lot <strong>of</strong> time and money trying to obtain timely and relevant<br />
information about their customers, markets, processes, employees, finances, and product<br />
and service outcomes. They build elaborate dashboards and form committees to track<br />
hundreds <strong>of</strong> measures and then wonder why they do not have any useful information<br />
upon which to base important decisions. It is essential to have a process to convert data to<br />
information and then to knowledge. Dr. Edwards Deming stated “Lack <strong>of</strong> knowledge . . .<br />
that is the problem.” 2 Decision makers take data, apply statistical processes to it, display<br />
it graphically, and convert it to knowledge to make decisions.<br />
Organizations attempt to capture all relevant information on a situation <strong>of</strong> interest to<br />
them; they think that information is knowledge. They indiscriminately go about amassing<br />
information and measurements to “find out all there is to know.” This action wastes time,<br />
effort, and money. When they eventually have all relevant information available, they<br />
find that it is useless because it is not centered on a specific need. This gathering <strong>of</strong> all <strong>of</strong><br />
the information impedes planning and problem-solving by burying an organization in an<br />
avalanche <strong>of</strong> irrelevant, unmanageable details. It leads to “analysis-paralysis.”<br />
Furthermore, the information and measurements produce a sense <strong>of</strong> satisfaction about the<br />
current situation. Just because all information is available, <strong>of</strong>tentimes people think that a<br />
situation can be controlled. A former boss <strong>of</strong> one <strong>of</strong> the authors stated the foolishness <strong>of</strong><br />
this indiscriminate amassing <strong>of</strong> information many years ago when collecting data about a<br />
process. He stated “We need to know what we are going to do with the data before we<br />
actually collect it.” Unfortunately, his wisdom <strong>of</strong>ten goes unheeded.<br />
The Limited Information Collection Principle <strong>of</strong> Breakthrough Thinking should be<br />
applied in all instances when data gathering is necessary. The Limited Information<br />
Collection Principle is based on the premise that a problem cannot be solved by throwing<br />
data at it. The Limited Information Collection Principle is the opposite <strong>of</strong> the<br />
indiscriminate amassing <strong>of</strong> information and measurements to “find out all there is to<br />
know.” Finding it all out wastes time, effort, and money. It impedes planning and<br />
problem-solving by burying the problem in an avalanche <strong>of</strong> irrelevant, unmanageable<br />
details which usually lead to analysis paralysis.<br />
1 BrainyQuote.com. Definition <strong>of</strong> Counted. http://www.brainyquote.com/words/co/counted148801.html.<br />
Accessed October 19, 2010.<br />
2 BrainyQuote.com. Talk: W. Edwards Deming. http://en.wikiquote.org/wiki/Talk:W._Edwards_Deming,<br />
Accessed October 19, 2010. See Appendix A for an Introduction to the work <strong>of</strong> Dr. W. Edwards Deming.<br />
69<br />
________________________________________________________________________<br />
<strong>Modular</strong> <strong>kaizen</strong>: Dealing with Disruptions Chapter 7
Continually asking “what purpose could this information serve” before starting to collect<br />
any data 3 and then gathering useful and relevant data according to the unique aspect <strong>of</strong><br />
the situation is essential.<br />
Measurement is a key ingredient <strong>of</strong> any improvement program. To make lasting<br />
improvements, everyone in an organization needs to understand how to measure and<br />
monitor processes and be able to use that data and information to prioritize where<br />
improvements need to be made. Improvement consumes scarce organizational resources<br />
and should be focused at the most important and strategic needs <strong>of</strong> the organization.<br />
Measurement helps to shift attention to areas <strong>of</strong> important needs.<br />
The concept <strong>of</strong> <strong>Modular</strong> <strong>kaizen</strong> is dependent upon accurate measures to move effectively<br />
through the planned steps <strong>of</strong> an improvement project. Organizing tasks within a <strong>Modular</strong><br />
<strong>kaizen</strong> project includes a possibility that one task may be performed and the next task left<br />
to wait until the improvement team comes together again much later to pick up the<br />
problem-solving and decision-making. Having a well-defined, organized matrix <strong>of</strong><br />
requirements provides a solid foundation for resuming effective operations after a<br />
planned hiatus.<br />
A Tri-Metric Matrix can be developed for most processes. The Tri-Metric Matrix helps to<br />
guide the decision maker to measure the important aspects <strong>of</strong> a process’s capacity,<br />
capability, and outcomes. When developing measures for a Tri-Metric Matrix, the<br />
following questions need to be asked for each measure that is proposed:<br />
<br />
<br />
<br />
<br />
<br />
<br />
<br />
<br />
<br />
<br />
What is the measure measuring?<br />
What is the baseline for this measure?<br />
If no baseline exists, can one be obtained or developed?<br />
Will this measure help to understand how the process is functioning?<br />
Is the measure directly linked to the current strategy?<br />
Will this measure positively impact the process under study?<br />
Will the measure positively impact the customers if it is improved?<br />
Will employees have personal incentives to improve this measure?<br />
Are improvements in the measure likely to result in better service?<br />
Are the resources available for improving this measure?<br />
3 H<strong>of</strong>fherr G, Moran J, and Nadler G. Breakthrough Thinking in Total Quality Management. Englewood<br />
Cliffs, NJ: PTR Prentice Hall; 1994.<br />
70<br />
________________________________________________________________________<br />
<strong>Modular</strong> <strong>kaizen</strong>: Dealing with Disruptions Chapter 7
When developing Tri-Metric Measures for a process, the goal is to determine what<br />
measures should be the Key Process Indicators (KPI). The following areas are some<br />
guidelines for potential major KPIs.<br />
Effectiveness—Does the process output conform to stated requirements?<br />
Goal: Doing the right things.<br />
Efficiency—Does the process produce the required output at minimum resource<br />
cost? Goal: Doing the right things well.<br />
Quality—Does the output meet customer requirements and expectations?<br />
Timeliness—Does the process produce its output correctly and on time?<br />
Productivity—How well does the process use its inputs to produce its output?<br />
Goal: Establish the ratio <strong>of</strong> the amount <strong>of</strong> output per unit <strong>of</strong> input.<br />
Output —How much does the process produce in a given time period?<br />
Depending on the process in place, the KPI may be a combination <strong>of</strong> the above. It is<br />
desirable to have proactive measures that show what is happening now in the process<br />
rather than reactive measures that show what has happened. Whatever measures are<br />
decided upon should give a clear indication <strong>of</strong> how the process is operating and should<br />
indicate when action must be taken. This process is also displayed in Chapter 12 – Daily<br />
Work Management.<br />
Tri-Metric Indicator Definition Baseline Improvement<br />
Target<br />
1. Capacity<br />
2. Process<br />
3. Outcome<br />
<strong>Table</strong> 7.1: The Tri-Metric Matrix<br />
<strong>Table</strong> 7.1 shows the basic elements <strong>of</strong> the Tri-Metric Matrix. Three Tri-Metrics that<br />
every improvement project needs to focus on are:<br />
1. Capacity measures <strong>of</strong> the process under study. The capacity <strong>of</strong> a process is<br />
defined as an output measure which is a measure <strong>of</strong> activity. Sometimes this<br />
is referred to as the maximum output rate measured in terms <strong>of</strong> some type <strong>of</strong><br />
units provided per period <strong>of</strong> time. For example, ten customers can be<br />
processed per hour in a clinic, 100 calls per hour can be processed in a call<br />
center, eight surgeries per hour can be moved through an operating room<br />
(OR), or 200 boxes <strong>of</strong> tissues can be made every ten minutes. Once the<br />
maximum output rate <strong>of</strong> a process is known, then the capacity utilization or<br />
the percentage <strong>of</strong> the maximum output that is currently being utilized can be<br />
understood. Knowing that the OR has a 75% utilization rate for the past<br />
three weeks can become useful information.<br />
71<br />
________________________________________________________________________<br />
<strong>Modular</strong> <strong>kaizen</strong>: Dealing with Disruptions Chapter 7
Sometimes it is useful to understand activity measures which describe the level <strong>of</strong><br />
resources committed to a process. Just knowing these three measures does little to<br />
help us understand how the process is satisfying our customers. Process and<br />
output measures help us understand the capability <strong>of</strong> the process to meet customer<br />
needs. <strong>Table</strong> 7.2 shows some typical capacity measures.<br />
Tri-Metric Indicator Definition Baseline Improvement<br />
Target<br />
1. Capacity Output Rate Units/time 400/hour 450/hour<br />
Capacity<br />
Utilization<br />
% <strong>of</strong> maximum<br />
output utilized<br />
75% 85%<br />
2. Process<br />
3. Outcome<br />
Resources<br />
Committed<br />
FTE, space,<br />
equipment, etc.<br />
40 FTE<br />
900 square feet<br />
30 FTE<br />
800 square feet<br />
<strong>Table</strong> 7.2: Sample Tri-Metric Matrix<br />
2. Process measures are descriptors <strong>of</strong> how the process is performing in its<br />
current state. It is very important to understand how the current state is<br />
operating and define the baseline before attempting any type <strong>of</strong> improvement<br />
activities. It is important not to change a process before understanding where<br />
it is centered or the amount <strong>of</strong> variation that is present. The most common<br />
measures <strong>of</strong> a process are the mean and the standard deviation. Once those<br />
measures have been calculated, conducting a capability study which<br />
measures the number <strong>of</strong> standard deviations between the process mean and<br />
the nearest specification limit in sigma units can occur. In general, as a<br />
process’s standard deviation rises, or the mean <strong>of</strong> the process moves away<br />
from the center <strong>of</strong> the tolerance:<br />
<br />
<br />
fewer standard deviations will fit between the mean and the nearest<br />
specification limit<br />
an increased likelihood <strong>of</strong> items outside specification will occur<br />
The two indices used in defining process capability are:<br />
<br />
<br />
Cp - Measures the variation - how well the data fits within the upper<br />
and lower specification limits (USL, LSL) - width <strong>of</strong> the process<br />
distribution relative to a set <strong>of</strong> limits<br />
Cpk - Measures the central tendency – it is an index which measures<br />
how close a process is running to its specification limits and how<br />
centered the data is between the specification limits.<br />
72<br />
________________________________________________________________________<br />
<strong>Modular</strong> <strong>kaizen</strong>: Dealing with Disruptions Chapter 7
The larger the index, the less likely it is that any item will be outside the<br />
specifications. <strong>Table</strong> 7.3 shows some typical process measures.<br />
Tri-Metric Indicator Definition Baseline Improvement<br />
Target<br />
1. Capacity Output Rate Units/time 400/hour 450/hour<br />
Capacity<br />
Utilization<br />
% <strong>of</strong> maximum<br />
output utilized<br />
75% 85%<br />
Resources<br />
Committed<br />
FTE*, space,<br />
equipment, etc.<br />
2. Process Mean Mathematical<br />
average <strong>of</strong> a set<br />
<strong>of</strong> numbers.<br />
3. Outcome<br />
Standard<br />
Deviation<br />
Cp<br />
Cpk<br />
*FTE = Full-Time Equivalent Headcount<br />
<strong>Table</strong> 7.3: Sample Tri-Metric Process Measures<br />
Measurement<br />
<strong>of</strong> variability<br />
or the square<br />
root <strong>of</strong> the<br />
variance<br />
How well the<br />
data fits within<br />
the spec limits<br />
(USL, LSL)<br />
How centered<br />
the data is<br />
between the<br />
spec limits<br />
40 FTE<br />
900 square<br />
feet<br />
30 FTE<br />
800 square feet<br />
In the service industries, healthcare, and public health, many processes do not have<br />
defined specifications. For processes without defined specifications, it is important to<br />
develop limits with the customers <strong>of</strong> the process variation that they will tolerate. The<br />
authors propose developing an Upper Toleration Limit (UTL) and Lower Toleration<br />
Limit (LTL) to allow use <strong>of</strong> either Run Charts or Control Charts. The questions to ask a<br />
customer might be “How long are you willing to wait for the doctor, for a flu shot, to get<br />
service in a WIC clinic, or to get a meal at a fast food restaurant?”<br />
Since many customers understand that waits are inevitable, it is important to compile an<br />
average from many customers on what would be the UTL on wait time. Everyone would<br />
like zero wait time, but realistically people will accept a minimal wait. Defining that<br />
minimal acceptable wait as the LTL is important.<br />
73<br />
________________________________________________________________________<br />
<strong>Modular</strong> <strong>kaizen</strong>: Dealing with Disruptions Chapter 7
As an example, our customers <strong>of</strong> the XYZ process have been surveyed, and they<br />
indicated the following for wait time to get services: UTL = 15 minutes and LTL = 5<br />
minutes.<br />
A process capability study <strong>of</strong> this process shows its center and its variability. It is<br />
possible to see if the process is capable <strong>of</strong> meeting customer wait time levels. If it is not,<br />
improvements can be made to center the process so that it meets customer needs. This<br />
approach could also be applied to cycle time and Process Efficiency Percentages.<br />
3. Outcome measures are measures <strong>of</strong> the result <strong>of</strong> a process output. An outcome<br />
measure is used to measure the success <strong>of</strong> a process. For most processes, an AIM<br />
statement is developed to focus what the process is supposed to accomplish and<br />
by when. Examples <strong>of</strong> outcome measures are:<br />
Achieving a Press Ganey score for patient satisfaction <strong>of</strong> 99%<br />
Reducing hemoglobin A1c (HbA1c) to less than 7 for patients with diabetes<br />
<strong>Health</strong>care acquired adverse event - < three surgical site infections<br />
300 accident-free days<br />
98% TB completion <strong>of</strong> therapy<br />
97% Medicaid billing success rates<br />
100% HIV regimen compliance<br />
< 5% Tobacco use by middle and high school students<br />
< 8 minutes clinic waiting time<br />
<strong>Table</strong> 7.4 shows some typical outcome measures. Measurement is the key to having<br />
processes that successfully deliver customer satisfaction. Measurement needs to build<br />
outward from capacity to process to outcomes. These three measures must be aligned and<br />
monitored on a regular basis to ensure that processes are running at maximum efficiency.<br />
Measuring capacity, process, and outcomes gives three critical perspectives to the overall<br />
performance <strong>of</strong> a process. Capacity dictates whether resources to meet current demand <strong>of</strong><br />
the product or service are available. Process allows the monitoring <strong>of</strong> the continuing<br />
effectiveness <strong>of</strong> activities performed to create an acceptable product or service. Outcome<br />
gauges the satisfaction <strong>of</strong> the end user with the product or service once it is delivered or<br />
experienced.<br />
The Tri-Metric Matrix is a tool which guides an improvement team through the steps <strong>of</strong><br />
identifying capacity requirements, process expectations, and outcomes for a product or<br />
service. The value <strong>of</strong> this tool is more than a checklist for filling in customer or process<br />
requirements. This tool prompts the improvement team to interact with customers,<br />
74<br />
________________________________________________________________________<br />
<strong>Modular</strong> <strong>kaizen</strong>: Dealing with Disruptions Chapter 7
suppliers, subject matter experts, and each other to understand enough about the overall<br />
process to control it effectively.<br />
Tri-Metric Indicator Definition Baseline Improvement<br />
Target<br />
1. Capacity Output Rate Units/time 400/hour 450/hour<br />
Capacity<br />
Utilization<br />
% <strong>of</strong> maximum<br />
output utilized<br />
75% 85%<br />
2. Process<br />
3. Outcome<br />
Resources<br />
Committed<br />
Mean<br />
Standard<br />
Deviation<br />
Cp<br />
Cpk<br />
Customer<br />
Satisfaction<br />
Accident-free<br />
days<br />
TB<br />
completion <strong>of</strong><br />
therapy<br />
FTE, space,<br />
equipment, etc.<br />
Mathematical<br />
average <strong>of</strong> a set <strong>of</strong><br />
numbers.<br />
Measurement <strong>of</strong><br />
variability or the<br />
square root <strong>of</strong> the<br />
variance<br />
How well the data<br />
fits within the spec<br />
limits (USL, LSL)<br />
How centered the<br />
data is between the<br />
spec limits<br />
% satisfied<br />
customer<br />
# accident-free<br />
days<br />
Patients completing<br />
therapy<br />
successfully<br />
40 FTE<br />
900 square feet<br />
30 FTE<br />
800 square<br />
feet<br />
µ = 10 minutes µ = 8 minutes<br />
σ = 2 minutes σ = 1.5<br />
minutes<br />
Cp = 2.0 Cp = 1.6<br />
Cpk = 1.5 Cpk = 1.0<br />
98% score 99% score<br />
300 days 350 days<br />
75% 95%<br />
<strong>Table</strong> 7.4: Example Tri-Metric Matrix Outcome Measures<br />
75<br />
________________________________________________________________________<br />
<strong>Modular</strong> <strong>kaizen</strong>: Dealing with Disruptions Chapter 7
76<br />
________________________________________________________________________<br />
<strong>Modular</strong> <strong>kaizen</strong>: Dealing with Disruptions
Chapter 8: Standardizing and Controlling the New System<br />
Once an improvement team has designed, piloted, and installed a new system, the process<br />
must be stabilized. Process stability exists when the new process is in statistical control<br />
and produces predictable results based upon customer expectations. Previous chapters<br />
discuss the concept <strong>of</strong> process capability. It is assumed that when a new system is<br />
designed and installed it is capable <strong>of</strong> producing the results desired by the patient, the<br />
public health organization’s customer. Process stability should be determined during pilot<br />
testing before final implementation is complete.<br />
The goal <strong>of</strong> standardizing and controlling a system is to achieve operational excellence.<br />
Operational excellence for an organization means that it has its business processes not<br />
only standardized but also optimized to realize the organization’s strategic objectives as<br />
quickly and efficiently as possible. Quality improvement (QI) tools support both<br />
standardization and optimization. During initial design and testing <strong>of</strong> a new or improved<br />
process, tools provide structure through which to analyze pilot process flow and outputs.<br />
Since changes tend to destabilize processes, some tools are designed to gather data<br />
created by the new testing environment. Once the improved or redesigned process is<br />
stabilized, other tools are available to monitor ongoing process performance to sustain the<br />
desired level <strong>of</strong> performance.<br />
An organization needs to standardize processes to achieve operational excellence and<br />
embed them across the entire organization. Best practices and higher performance must<br />
be replicated in every operational unit. Optimizing at the unit level risks sub-optimization<br />
at the system level. The PDCA cycle referred to in previous chapters has a counterpart<br />
called the SDCA cycle – Standardize, Do, Check, and Act. Once the right change has<br />
been designed, piloted, and approved through the PDCA cycle, the SDCA cycle keeps the<br />
new process in control. First, one would implement the Standardize process, “Do” it<br />
according to the setup designed, “Check” it through measurement to ensure that it is<br />
performing correctly, and then “Act” if a variance needs correction. One returns to the<br />
PDCA cycle if a major development occurs in customer demand, technology change, a<br />
legislative mandate, a political impetus, or other external influence that disrupts the<br />
process. These external influences generally require a significant analysis <strong>of</strong> current<br />
operations with the possibility <strong>of</strong> process improvement or redesign. The integrated<br />
PDCA/SDCA cycle is shown in Figure 8.1.<br />
When standardizing a process, its stability and capability must be understood. “While<br />
there is no direct relationship between process stability and process capability, there is an<br />
important connection: Process capability assessment should only be performed after first<br />
demonstrating process stability. If a process is unstable, we cannot predict its capability.<br />
Any estimate <strong>of</strong> process capability we make depends entirely on where the process<br />
happens to be when we collect the data. Suppose the process average is shifting about<br />
over time. An estimate <strong>of</strong> the process capability is only reflective <strong>of</strong> where the process is<br />
77<br />
________________________________________________________________________<br />
<strong>Modular</strong> <strong>kaizen</strong>: Dealing with Disruptions Chapter 8
at that point in time, not where it may go next.” 1 All processes exhibit variation. Service<br />
transactions and those processes influenced by the behavior <strong>of</strong> human beings rather than<br />
machines tend to show more variation when statistically in control. Machines are<br />
designed to repeat specific actions on a consistent basis. Human beings bring selfawareness<br />
to the process, adding a significant factor <strong>of</strong> choice and interpretation to the<br />
situation.<br />
A<br />
C<br />
Figure 8.1: The PDCA/SPCA cycle<br />
Variations are differences, usually minor, from the designed and expected outputs <strong>of</strong> a<br />
process. Some variation is found in all processes. The key to controlling processes is to<br />
control variation as much as possible.<br />
All variation has some cause. Knowing the causes <strong>of</strong> variation is important in order to<br />
determine the actions that must be taken to reduce the variation. It is most important to<br />
distinguish between special cause variation and common cause variation.<br />
Special cause variation results from unexpected or unusual occurrences that are not<br />
inherent in the process. As an example:<br />
A new clinic nurse is on her way to work in the morning when her car engine<br />
stalls because <strong>of</strong> a fuel-line leak.<br />
1 Wachs S. What is the relationship between process stability and process capability?<br />
http://www.winspc.com/datanet-quality-systems/support--resources/what-is-the-relationship-betweenprocess-stability-and-process-capability.html,<br />
Accessed November 11, 2010.<br />
78<br />
________________________________________________________________________<br />
<strong>Modular</strong> <strong>kaizen</strong>: Dealing with Disruptions Chapter 8
This occurrence was not inherent in the normal work commute process. Special causes <strong>of</strong><br />
variation account for approximately 15 percent <strong>of</strong> the observed variation in processes.<br />
They are usually very easy to detect and correct. While usually easy to detect and correct,<br />
it is important to have processes in place so that special cause variations are actually<br />
detected. These special causes are sometimes called assignable causes because the<br />
variation that results can be investigated and assigned to a particular source.<br />
Common cause variation results from how the process is designed to operate and is a<br />
natural part <strong>of</strong> the process. As an example:<br />
A new clinic nurse starts her morning commute on time, follows her normal route,<br />
and arrives at the health department nine minutes later than usual but within the<br />
overall time allowance <strong>of</strong> her schedule. She experienced a slowdown due to the<br />
timing <strong>of</strong> traffic lights.<br />
Common causes <strong>of</strong> variation account for approximately 85 percent <strong>of</strong> the observed<br />
variation in processes. When the process is in control, as it was in the above example,<br />
taking action may not be necessary. Making minor adjustments to a process because <strong>of</strong><br />
perceived common cause variation is called tampering. Tampering can drive a process<br />
into further variation due to unnecessary changes made to a stable process due to a<br />
perceived special cause that is actually a common cause. While common causes account<br />
for 85 percent <strong>of</strong> the observed variation, “Fixing” pieces <strong>of</strong> the process can be timeconsuming<br />
and miss larger aspects <strong>of</strong> the process that may warrant adjustment.<br />
Process owners should recognize that the special cause variations in quality within<br />
production or service processes can usually be detected and removed by the individuals<br />
who are operating the process. Common cause variations usually require management<br />
intervention and action to change some inherent feature <strong>of</strong> the process. This is sometimes<br />
called the “85/15 rule,” recognizing that management is responsible for providing the<br />
necessary inputs to address and correct the majority <strong>of</strong> variation problems or common<br />
causes. 2 Tools such as Check Sheets and Run Charts are useful in a wide range <strong>of</strong><br />
situations, including when a process under study is not yet stabilized. Other tools, such as<br />
Control Charts, Paynter Charts, and error-pro<strong>of</strong>ing depend upon the process being<br />
stabilized or in control before the data are reliable enough for decision making. Using<br />
tools built for stable processes on out-<strong>of</strong>-control data is a recipe for failure.<br />
Once a stable and capable process is installed, it must be monitored to ensure that the<br />
process remains stable and capable. This chapter introduces the use <strong>of</strong> five QI tools for<br />
process control. An excellent reference for information on the use <strong>of</strong> statistics in QI and<br />
process control is Quality Control by Dale Besterfield. 3<br />
2 Bauer JE, Duffy G, Westcott RT. The Quality Improvement Handbook, 2 nd ed. Milwaukee, WI: Quality<br />
Press; 2006.<br />
3 Besterfield, DH. Quality Control, 8th ed. Englewood Cliffs, NJ: Prentice Hall; 2009.<br />
79<br />
________________________________________________________________________<br />
<strong>Modular</strong> <strong>kaizen</strong>: Dealing with Disruptions Chapter 8
Graphical charts are useful to monitor a process for any variation in performance. Visual<br />
display <strong>of</strong> process data allows analysis for patterns not easily seen in numeric tables or<br />
spreadsheets. The benefit <strong>of</strong> monitoring process performance data is to detect indicators<br />
<strong>of</strong> change so that they can be acted upon and to communicate in a concise and visual<br />
manner how a process is performing during a specific time period.<br />
It is best to use the simplest graphical method to monitor a process. The method used will<br />
be determined by the availability <strong>of</strong> data and the degree to which the process needs to be<br />
controlled. All <strong>of</strong> these monitoring methods provide a dynamic visual view <strong>of</strong> process<br />
performance. Numeric tables <strong>of</strong> data or comparison <strong>of</strong> summary measures do not <strong>of</strong>fer<br />
the same graphical impact as visual representations. The following five are a few <strong>of</strong> the<br />
most common methods used either alone or in combination.<br />
A checklist is a predetermined list <strong>of</strong> items, actions, or questions that are checked <strong>of</strong>f as<br />
they are considered or completed. This type <strong>of</strong> Check Sheet is a generic tool.<br />
The checklist is best used when a process or procedure with many steps must be<br />
performed repeatedly or when a process is done infrequently and might be forgotten. The<br />
checklist is an effective tool at the beginning <strong>of</strong> a new activity or when a process with<br />
multiple steps or lots <strong>of</strong> detail has been improved or redesigned. Providing a step-by-step<br />
sequence <strong>of</strong> activities or identification <strong>of</strong> items to be accounted for hastens the<br />
stabilization <strong>of</strong> a new process. When creating a checklist for steps <strong>of</strong> a process, it is<br />
important to prepare a flowchart first to determine the steps and their sequence.<br />
Prepared checklists are widely available. Checklists that will guide the work <strong>of</strong> a<br />
response team can be found in books about teams or in final reports <strong>of</strong> health department<br />
QI projects. 4 Figure 8.2 is an example <strong>of</strong> a checklist used by Duval County<br />
Immunization Clinics in Jacksonville, Florida.<br />
Closely related to a checklist is a Check Sheet. A Check Sheet is a form used to record<br />
the frequency <strong>of</strong> specific events during a data collection period. A Check Sheet is a<br />
simple form used to collect data in an organized manner and to convert it into readily<br />
useful information. The most straightforward way to use a Check Sheet is to make a list<br />
<strong>of</strong> items expected to appear in a process and mark a check beside each item when it does<br />
appear. This type <strong>of</strong> data collection can be used for almost anything from checking <strong>of</strong>f<br />
the occurrence <strong>of</strong> particular types <strong>of</strong> defects or the counting <strong>of</strong> expected items (e.g., the<br />
number <strong>of</strong> times the telephone rings before being answered).<br />
Various innovations in Check Sheets are possible. Using a map <strong>of</strong> the community<br />
supported by the health department could be the Check Sheet. The idea in this Check<br />
Sheet is for the user simply to mark on the map the location <strong>of</strong> each septic system<br />
inspection that is made. The map becomes a very effective graphical presentation <strong>of</strong><br />
where new or repaired septic systems are. Another name for this type <strong>of</strong> Check Sheet is a<br />
“measles chart.”<br />
4 Tague NR. The Quality Toolbox, 2 nd Ed. Milwaukee, WI: Quality Press; 2004.<br />
80<br />
________________________________________________________________________<br />
<strong>Modular</strong> <strong>kaizen</strong>: Dealing with Disruptions Chapter 8
Immunization Checklist for the Clinics<br />
√<br />
Front Desk<br />
‣ Register patient in HMS<br />
‣ Cross Check for duplicate patients<br />
‣ Access FL Shots for Patient Information “Search FL Shots”<br />
‣ Ask for address, phone number, and email address (change<br />
information if necessary)<br />
‣ Import updates to HMS<br />
‣ Make sure you have selected the proper Current<br />
Immunization Provider (CIP) status is correct in FL Shots<br />
√<br />
√<br />
‣ Print Immunization History from FL Shots attach to<br />
Superbill/Chart along with Insurance verification<br />
Staff Signature<br />
RN/LPN/MA/HST<br />
‣ Greet patient<br />
‣ Assess for needed vaccines<br />
‣ Explain vaccines to be given today<br />
‣ Give VIS to patient/parent<br />
‣ Ask for any questions<br />
‣ Give Injections<br />
‣ Explain after care instructions, invite questions<br />
‣ Document immunization in Florida Shots<br />
‣ Give patient an updated record <strong>of</strong> shots w/new due date<br />
‣ Tell patient when to return for next vaccinations<br />
‣ Document in medical records<br />
Staff Signature<br />
Billing Clerk<br />
‣ Process Superbill<br />
‣ Process any collections<br />
‣ Ask did you get your updated record <strong>of</strong> shots?<br />
‣ Release Client<br />
Staff Signature<br />
Patient Label<br />
For more information, email Steve_Spitzfaden@doh.state.fl.us<br />
Figure 8.2: Immunization Checklist for Duval County <strong>Health</strong> Department Clinics 5<br />
5 Duval County <strong>Health</strong> Department, Jacksonville, Florida. 2011.<br />
81<br />
________________________________________________________________________<br />
<strong>Modular</strong> <strong>kaizen</strong>: Dealing with Disruptions Chapter 8
A Check Sheet may be used to:<br />
<br />
<br />
<br />
Collect data with minimal effort;<br />
Convert raw data into useful information; and<br />
Translate opinions <strong>of</strong> what is happening into what is actually happening.<br />
The basic steps involved in creating a Check Sheet are:<br />
1. Clarify the measurement objectives. Ask questions such as:<br />
"What is the problem?"<br />
"Why should data be collected?"<br />
"Who will use the information being collected?"<br />
"Who will collect the data?"<br />
2. Create a form for collecting data. Determine the specific things that will be<br />
measured and write this down the left side <strong>of</strong> the Check Sheet. Determine the time<br />
or place being measured and write this across the top <strong>of</strong> the columns.<br />
3. Label the measure for which data will be collected.<br />
4. Collect the data by recording each occurrence directly on the Check Sheet as it<br />
happens.<br />
5. Tally the data by totaling the number <strong>of</strong> occurrences for each category being<br />
measured.<br />
6. The data from the Check Sheet can be summarized in a number <strong>of</strong> ways, such as<br />
with a Pareto chart or histogram. Another analysis approach for data from the<br />
Check Sheet is through the run and Paynter Chart described below. 6<br />
Figure 8.3 is an example <strong>of</strong> a Check Sheet.<br />
Run Charts are charts showing how a process performs over time. It is a simple line<br />
graph that depicts a running record <strong>of</strong> process behavior over time. The running record is a<br />
chronological plotting <strong>of</strong> the data points that show the sequence in which process events<br />
occurred. These data points can represent measurements, counts, or percentages <strong>of</strong><br />
process output. This chronological plotting enables the visualization <strong>of</strong> how the process is<br />
performing and whether it is stable. The run chart helps pinpoint indicators <strong>of</strong> special<br />
causes <strong>of</strong> variation. Figure 8.4 shows a typical run chart with a median line displayed that<br />
divides the data into two equal halves. The median is the middle value in the data we<br />
have collected to plot the run chart.<br />
6 Bauer JE, Duffy G, Westcott RT. The Quality Improvement Handbook, 2 nd ed. Milwaukee, WI: Quality<br />
Press; 2006.<br />
82<br />
________________________________________________________________________<br />
<strong>Modular</strong> <strong>kaizen</strong>: Dealing with Disruptions Chapter 8
Type <strong>of</strong><br />
Defect<br />
April 23<br />
April 24<br />
April 25<br />
April 26<br />
April 27<br />
Total<br />
Defects<br />
Illegible<br />
Address<br />
IIIII IIIII<br />
IIIII IIIII I<br />
IIIII II<br />
IIIII IIIII<br />
IIIII III<br />
IIIII IIIII<br />
IIII<br />
IIIII IIIII<br />
I<br />
71<br />
Wrong State<br />
IIIII I<br />
II<br />
IIII<br />
IIIII<br />
IIIII<br />
22<br />
Wrong Zip<br />
Code<br />
IIIII IIIII<br />
IIIII IIIII<br />
IIIII<br />
IIIII IIIII<br />
III<br />
IIIII IIIII<br />
II<br />
IIIII IIIII<br />
59<br />
Bad Office<br />
Symbol<br />
III<br />
IIIII<br />
I<br />
III<br />
IIII<br />
16<br />
Total<br />
Defects<br />
50<br />
19<br />
36<br />
34<br />
29<br />
168<br />
Figure 8.3: Check Sheet tallying number <strong>of</strong> misplaced letters by reason<br />
A plot <strong>of</strong> data over time will reveal information about a process under study. Some data<br />
patterns such as the following may be observed from a Run Chart:<br />
<br />
<br />
<br />
<br />
<br />
<br />
Trends<br />
Mixtures<br />
Outliers<br />
Cycles<br />
Instability<br />
Sudden Shifts<br />
Measurement<br />
x<br />
x<br />
x<br />
x<br />
x<br />
x<br />
x<br />
x<br />
Median Line<br />
Time<br />
Figure 8.4: Run Chart showing measurements over time<br />
83<br />
________________________________________________________________________<br />
<strong>Modular</strong> <strong>kaizen</strong>: Dealing with Disruptions Chapter 8
These data patterns are some <strong>of</strong> the more common ones observed on Run Charts and are<br />
by no means all <strong>of</strong> the patterns that could be observed. When viewing and interpreting a<br />
Run Chart, variation will be observed in action since all processes have variation.<br />
Observing any trends, runs, or cycles that indicate the presence <strong>of</strong> special causes and<br />
indicating that a special cause could be present in addition to the Theory <strong>of</strong> Runs help us<br />
analyze the nature <strong>of</strong> the variation. 7 One example <strong>of</strong> the Theory <strong>of</strong> Runs is a sequence <strong>of</strong><br />
seven or more data points steadily increasing or decreasing with no change in direction.<br />
When analyzing a Run Chart, it is essential to blend knowledge <strong>of</strong> the process with the<br />
data displayed to see if a conflict exists between the outcome expected and actual<br />
performance <strong>of</strong> the process. Investigate any conflict or disruption. A listing <strong>of</strong> conflicts<br />
between expectation and reality or observable disruptions can lead to improvement<br />
opportunities. Focus on and understand any unusual patterns, shifts, cycles, or bunching<br />
<strong>of</strong> data points and verify if they are real. It is important to verify if the pattern is real since<br />
it may be a signal <strong>of</strong> a special cause that needs further investigation. Before time and<br />
resources are expended on improving a special cause signal, it must be verified.<br />
The absence <strong>of</strong> signals <strong>of</strong> special causes does not necessarily mean that a process is<br />
stable. Quality specialists suggest that a minimum <strong>of</strong> 100 observations without an out-<strong>of</strong>control<br />
signal are required before a process can be labeled as in statistical control.<br />
The Paynter Chart 8 was developed by Marvin Paynter, a quality engineer at Ford Motor<br />
Company, when he wanted to show a number <strong>of</strong> issues from different sources <strong>of</strong> inputs<br />
on a one- page tool as a summary for management. His idea was to pull together the Run<br />
Chart and Pareto data 9 into a single chart. The Paynter Chart can show emerging and<br />
declining problems, the timeframe for any corrective action and its effects, and whether<br />
or not the corrective action provided acceptable results.<br />
The Paynter Chart is a graphic tool that displays the history <strong>of</strong> a problem or opportunity<br />
over time. It can be used to monitor and track several different areas <strong>of</strong> an opportunity or<br />
occurrence <strong>of</strong> failure and highlight or show the impact <strong>of</strong> any changes or corrective<br />
actions over an extended period <strong>of</strong> time. Ideally, and to get a view <strong>of</strong> the history <strong>of</strong> a<br />
problem, the chart should show the prior few months, six if possible, and at least three to<br />
six months into the future. This visual <strong>of</strong> the timeframe for action and responses is more<br />
complete and informative.<br />
7 Evans JR, Lindsay WM. The Management and Control <strong>of</strong> Quality, 6 th ed. Mason, OH:<br />
Thompson/Southwestern; 2005.<br />
8 Munro R. Paynter Chart. American Statistical Association Detroit Chapter Newsletter. August, 1995.<br />
9 A Pareto Chart is used to focus efforts on the problems that <strong>of</strong>fer the greatest potential for improvement<br />
by showing their relative frequency or size in a descending bar graph.<br />
84<br />
________________________________________________________________________<br />
<strong>Modular</strong> <strong>kaizen</strong>: Dealing with Disruptions Chapter 8
The information on the Paynter Chart is developed from the Pareto analysis, the bar chart,<br />
the Run Chart and a table record/tally chart <strong>of</strong> measurements or events tracked over time.<br />
It demonstrates the following functions:<br />
<br />
<br />
<br />
<br />
Identifies new and reducing problems;<br />
Shows the effects over time <strong>of</strong> any changes made;<br />
Can correlate actions taken to any changes in results, acceptable or unacceptable;<br />
and<br />
Validates effect <strong>of</strong> changes over time.<br />
While the Run Chart shows a plot <strong>of</strong> measurement over time as single data points, each<br />
<strong>of</strong> those data points can have a number <strong>of</strong> items rolled up into it. The Paynter Chart<br />
allows us to click on a data point and see what is composing it as shown in Figure 8.5.<br />
The bold boxed summary point is composed <strong>of</strong> data from T, X, Y, and Z which are<br />
displayed in the Pareto Chart. From the Pareto Chart we can determine the percent <strong>of</strong><br />
contribution <strong>of</strong> each <strong>of</strong> the subdata to the total.<br />
The Paynter Chart should be constructed as the data tally sheet is created for the Run<br />
Chart since this practice will simplify the calculations later. This combination <strong>of</strong> Run and<br />
Pareto Charts provides a comprehensive visual for presenting a process’s performance.<br />
x<br />
%<br />
x<br />
x<br />
x<br />
x<br />
x<br />
x<br />
Median Line<br />
T<br />
X Y Z<br />
Figure 8.5: Paynter Chart combining Run Chart and Pareto Chart<br />
Control Chart - While every process displays variation, some processes display<br />
controlled variation that is natural to the process (common causes <strong>of</strong> variation). Other<br />
processes display uncontrolled variation that is not present in normal operation <strong>of</strong> a stable<br />
process (special causes <strong>of</strong> variation).<br />
85<br />
________________________________________________________________________<br />
<strong>Modular</strong> <strong>kaizen</strong>: Dealing with Disruptions Chapter 8
The Control Chart is similar to a Run Chart since it is a graph used to study how a<br />
process changes over time. Like a Run Chart, data are plotted in time order. The<br />
difference between the Run Chart and the Control Chart is that the Control Chart always<br />
has a central line for the Average <strong>of</strong> the data plotted and not the Median <strong>of</strong> the data that a<br />
Run Chart calculates. The Control Chart is more complicated than a Run Chart since it<br />
has calculated upper and lower control limits. These control limits are determined from<br />
historical data. By comparing current data to these lines, conclusions can be drawn about<br />
whether the process variation is in control or is out <strong>of</strong> control, affected by special causes<br />
<strong>of</strong> variation. If the process is in control, reliable predictions about its output can be made.<br />
Figure 8.6 shows a typical Control Chart with the average (mean) and control limits<br />
displayed. Some Control Charts show warning lines to alert when the process is<br />
approaching an out-<strong>of</strong>-control value. The warning line is shown in Figure 8.6. A Range<br />
Chart is frequently calculated with a Control Chart to reflect the span between the highest<br />
and lowest values <strong>of</strong> the data averaged to plot the individual points on the Control<br />
Chart. 10<br />
UCL<br />
Measurement Scale<br />
Average<br />
LCL<br />
Data Plotted In Time Ordered Sequence<br />
UCL: Upper Control Limit<br />
LCL: Lower Control Limit<br />
Figure 8.6: Control Chart showing averages <strong>of</strong> sample data plotted in time-ordered<br />
sequence<br />
10 A detailed explanation <strong>of</strong> statistical control is beyond the scope <strong>of</strong> this text. The reader is referred to a<br />
standard statistics text.<br />
86<br />
________________________________________________________________________<br />
<strong>Modular</strong> <strong>kaizen</strong>: Dealing with Disruptions Chapter 8
Rules for detecting "out-<strong>of</strong>-control" or non-random conditions were first postulated by<br />
Walter A. Shewhart in the 1920’s and became known as the Western Electric Rules. 11<br />
Lloyd S. Nelson developed the Nelson Rules 12 to help guide the interpretation <strong>of</strong> Control<br />
Charts which were similar to the Western Electric rules. A general summary <strong>of</strong> the Out<strong>of</strong>-Control<br />
Rules is shown in <strong>Table</strong> 8.1.<br />
Measurement Scale<br />
Any Point Above The UCL<br />
2 –3 Points in this area or above<br />
4 –5 points in this area or above<br />
8 points in a row in this area or above<br />
8 points in a row in this area or below<br />
4 –5 points in this area or below<br />
2 –3 Points in this area or below<br />
Any Point below the LCL<br />
UCL<br />
Average<br />
LCL<br />
Data Plotted In Time Ordered Sequence<br />
UCL: Upper Control Limit<br />
LCL: Lower Control Limit<br />
Figure 8.7: General rules for out-<strong>of</strong>-control process conditions within Control<br />
Charts<br />
Many types <strong>of</strong> Control Charts for variable data, attribute data, and special circumstances<br />
exist. Quality Control by Dale H. Besterfield is an excellent resource for entry-level QI<br />
team understanding <strong>of</strong> basic statistics, run, and Control Charts. 13<br />
Control Charts are used to:<br />
control ongoing processes by finding and correcting problems as they occur;<br />
predict the expected range <strong>of</strong> outcomes from a process;<br />
determine whether a process is stable and in statistical control;<br />
analyze patterns <strong>of</strong> process variation from special causes or common causes; and<br />
determine if a QI project should aim to prevent specific problems or to make<br />
fundamental changes to the process.<br />
11 The Western Electric Rules were codified by a specially appointed committee <strong>of</strong> the manufacturing<br />
division <strong>of</strong> the Western Electric Company and appeared in the first edition <strong>of</strong> its Statistical Quality Control<br />
Handbook in 1956.<br />
12 Nelson LS. Technical Aids. Journal <strong>of</strong> Quality Technology. 1984; 16(4): 238-239.<br />
13 Besterfield, DH. Quality Control, 8th ed. Englewood Cliffs, NJ:Prentice Hall; 2009.<br />
87<br />
________________________________________________________________________<br />
<strong>Modular</strong> <strong>kaizen</strong>: Dealing with Disruptions Chapter 8
When analyzing a Control Chart, as suggested for the Run Chart, blending knowledge <strong>of</strong><br />
the process with the data displayed to see if conflict between the outcome expected and<br />
actual performance <strong>of</strong> the process is evident is a solid start. Next, it is important to<br />
investigate any conflict or disruption. Creating a listing <strong>of</strong> conflicts between expectation<br />
and reality or observable disruptions can lead to improvement opportunities. Focusing on<br />
and understanding any unusual patterns, shifts, cycles, or bunching <strong>of</strong> data points and<br />
verifying if they are real are crucial next steps. It is important to verify if the pattern is<br />
real since it may be a signal <strong>of</strong> a special cause that needs further investigation. Before<br />
time and resources are expended on improving a special cause signal, it must be verified.<br />
Is the Control Chart you are using healthy?<br />
Does it include relevant information to help gain insight about your process?<br />
Control Charts are valuable tools to help a response team implement fundamental process<br />
changes to improve patient care. Before the team can effectively utilize the information<br />
from the chart, they must first be confident that the chart being reviewed is healthy. Just<br />
as a physician would not perform elective surgery on a patient with an infection, the team<br />
should not analyze a process improvement chart without first considering seven key<br />
attributes.<br />
S<strong>of</strong>tware is an invaluable tool for creating Control Charts; however, great diversity<br />
among s<strong>of</strong>tware programs exists. When choosing Control Charting s<strong>of</strong>tware, using these<br />
seven traits as a guide will be effective:<br />
1. Lloyd Nelson limits for computing Control Charts<br />
2. Clear, extensive, and accurate titles<br />
3. Underlying data visible on the chart<br />
4. Control limits reflect process change<br />
5. Out-<strong>of</strong>-control conditions clearly identified<br />
6. Assignable causes shown but not used in overall calculations<br />
7. Annotations used to increase understanding<br />
Error Pro<strong>of</strong>ing - focuses on two aspects <strong>of</strong> process activity: (1) prediction, or<br />
recognizing that a defect is about to occur and providing a warning, and (2) detection, or<br />
recognizing that a defect has occurred and stopping the process. Human beings tend to<br />
make mistakes inadvertently. Typical mistakes in daily work or when providing service<br />
to customers are omitted process, processing errors, setup errors, missing information,<br />
wrong information or adjustment errors.<br />
88<br />
________________________________________________________________________<br />
<strong>Modular</strong> <strong>kaizen</strong>: Dealing with Disruptions Chapter 8
Such errors can arise from the following factors:<br />
Forgetfulness due to lack <strong>of</strong> concentration<br />
Misunderstanding because <strong>of</strong> the lack <strong>of</strong> familiarity with a process or procedure<br />
Poor identification associated with lack <strong>of</strong> proper attention<br />
Lack <strong>of</strong> experience<br />
Absentmindedness<br />
Delays in judgment when a process is automated<br />
Equipment malfunctions 14<br />
Other terms for error pro<strong>of</strong>ing are “mistake pro<strong>of</strong>ing” and “Poka-Yoke,” a Japanese term<br />
coined in the early 1960’s by Shigeo Shingo, a twentieth century Japanese industrial<br />
engineer who distinguished himself as one <strong>of</strong> the world’s leading experts in<br />
manufacturing practices. 15<br />
Blaming the worker not only discourages them and lowers morale but also does not solve<br />
the problem. Many applications <strong>of</strong> error-pro<strong>of</strong>ing are deceptively simple yet creative.<br />
Usually, they are inexpensive to implement. The checklist in Figure 8.2 from Duval<br />
County, Florida is an example <strong>of</strong> error-pro<strong>of</strong>ing. The Check Sheet provides a sequential<br />
guide to all <strong>of</strong> the steps required during a customer engagement in the Immunization<br />
Clinic. By following the Check Sheet and marking <strong>of</strong>f each step as completed, the clinic<br />
pr<strong>of</strong>essional is alerted by the next unchecked item that it is the next step to be performed.<br />
At the end <strong>of</strong> the clinic visit, the same Check Sheet can be used to audit daily volume<br />
within the clinic and completion <strong>of</strong> all required steps in each process supported by such<br />
Check Sheets.<br />
<strong>Modular</strong> <strong>kaizen</strong> uses the concepts <strong>of</strong> control and standardization to identify Areas <strong>of</strong><br />
Concern and disruption. Performance management, based upon the department’s strategic<br />
plan, sets the foundation for critical measures that reflect required organization and<br />
community outcomes. Using standards set for the health department during its regular<br />
planning cycle ensures that comparison <strong>of</strong> activities performed to required outcomes<br />
closely matches the department’s mission and objectives. The more aligned response<br />
teams are to priority outcomes <strong>of</strong> the health department, the more efficient they will be in<br />
choosing process improvement projects. The benefit <strong>of</strong> keeping the “check” and “act”<br />
process directly related to priority activities is that the tasks performed blend easily with<br />
the daily work <strong>of</strong> the response team members. Fast transition is an element <strong>of</strong> the House<br />
<strong>of</strong> <strong>Modular</strong> <strong>kaizen</strong>. Response teams are able to transition quickly from normal work tasks<br />
to improvement tasks because the skills and information required for improvement are<br />
closely related to what they are doing in their normal work assignments.<br />
14 Evans JR and Lindsay WM. The Management and Control <strong>of</strong> Quality, 6 th ed. Mason, OH:<br />
Thompson/Southwestern; 2005.<br />
15 Wikimedia <strong>Foundation</strong>, Incorporated. Wikipedia: The Free Encyclopedia.<br />
http://en.wikipedia.org/wiki/Shigeo_Shingo. Updated February 27, 2011. Accessed February 27, 2011.<br />
89<br />
________________________________________________________________________<br />
<strong>Modular</strong> <strong>kaizen</strong>: Dealing with Disruptions Chapter 8
90<br />
________________________________________________________________________<br />
<strong>Modular</strong> <strong>kaizen</strong>: Dealing with Disruptions
Chapter 9: Change Management<br />
If you want to make enemies, try to change something.<br />
Woodrow Wilson<br />
Organizations wanting to adopt the <strong>Modular</strong> <strong>kaizen</strong> approach need to have a culture that<br />
can support and produce quick and rapid change; they must be ready to embrace constant<br />
change and continuous improvement towards a defined standard <strong>of</strong> excellence that is<br />
continually rising. This chapter gives leaders a road map to position their organizations<br />
for ongoing and rapid change.<br />
A common question asked by leaders and employees in various organizations is “Why do<br />
we need to change our organizations on a regular basis? We like the place the way it is!<br />
Why keep changing all <strong>of</strong> the time?” The answer is simply that the old ways <strong>of</strong><br />
accomplishing an organization’s purpose are not effective and efficient and do not work<br />
any longer in the current environment. In today's rapidly changing organizational and<br />
business environment, most organizations and their leadership realize this problem too<br />
late.<br />
Change is critical to the survival and sustainability <strong>of</strong> public health organizations.<br />
Unfortunately all organizations have “antibodies” that resist change and challenges to<br />
their legacy. These antibodies drive out new ideas and people that are considered either<br />
odd or at odds with the organization’s current existence. These antibodies want to<br />
maintain the status quo at all costs.<br />
Most organizations do not change in response to seeing what is on the horizon and<br />
wanting to prepare to meet the new challenges. Organizations change because they are<br />
forced into it kicking and screaming by the aggressiveness <strong>of</strong> their competitors, political<br />
or fiscal changes, or by their customers. Few organizations change because they have<br />
visionary leadership that is able to foresee a shifting and sliding marketplace and position<br />
their organization for the next market momentum move. These leaders understand the<br />
Triggers <strong>of</strong> Change and the Four Variables <strong>of</strong> Successful Change. 1 Leaders want to know<br />
what and how much to change and when. The Triggers <strong>of</strong> Change and the Four Variables<br />
<strong>of</strong> Successful Change at different levels <strong>of</strong> intensity are shown in Figure 9.1. The<br />
intensity levels require varying levels <strong>of</strong> effort and investment <strong>of</strong> scarce resources. When<br />
making an investment in change, one needs to be cautious and try to minimize the risk <strong>of</strong><br />
failure. The best change is one that minimizes the intensity <strong>of</strong> the Four Variables <strong>of</strong><br />
Successful Change, thus reducing the stress and strain on the organization undergoing<br />
change. For instance, it is preferable for change to occur without maximizing<br />
1 Parts <strong>of</strong> this chapter are based on a previous work: Mead J, Moran J. TECHNOSPEED Change. The TQM<br />
Magazine. 2001; 13 (4): 224-231.<br />
91<br />
________________________________________________________________________<br />
<strong>Modular</strong> <strong>kaizen</strong>: Dealing with Disruptions Chapter 9
management involvement, resistance, degree <strong>of</strong> change, and resources. This approach<br />
optimizes the possibility <strong>of</strong> successful change.<br />
The Four Variables <strong>of</strong> Successful Change<br />
Low<br />
Management Involvement<br />
High<br />
High<br />
Trigger II<br />
Trigger IV<br />
High<br />
Resource Commitment<br />
Change The Way We Function<br />
Trigger I<br />
Change The Way We Work<br />
Change The Way We Do Business<br />
Trigger III<br />
Change The Way We Interact<br />
Resistance to Change<br />
Low<br />
Minor<br />
Major<br />
Degree <strong>of</strong> Change<br />
Figure 9.1: The Four Variables <strong>of</strong> Successful Change<br />
Radical<br />
Low<br />
Change has always been ubiquitous. In the past, the luxury <strong>of</strong> changing at a leisurely and<br />
more controlled pace was possible. What would once have been a long process <strong>of</strong><br />
changing a culture now has to be a shortened process; the organization might disappear if<br />
it takes too long to change. Today the rule is “Change Quickly, Change Often, or Cease<br />
to Exist.” The organizational culture must be able to support constant change.<br />
Why have past change efforts not been successful?<br />
In the past, the “Water and Wait” philosophy <strong>of</strong> change was common. The training and<br />
consulting companies would dictate that the “process” was important; given enough time,<br />
it would deliver the desired results. Organizations quickly lost patience with "Water and<br />
Wait" change methodologies. Not many organizations reaped the benefit <strong>of</strong> “Water and<br />
Wait.” It used to be that people had to be sold on change. In today’s fast-paced world,<br />
the options are either change or be passed by. Change is a core competency for even the<br />
most basic <strong>of</strong> jobs. Organizations <strong>of</strong>ten need to be prescriptive when change needs to<br />
occur as to how soon it will be implemented and accomplished. This prescriptive<br />
approach helps employees understand the importance <strong>of</strong> change to the organization and<br />
for the benefit <strong>of</strong> its customers.<br />
________________________________________________________________________<br />
92<br />
<strong>Modular</strong> <strong>kaizen</strong>: Dealing with Disruptions Chapter 9
Simply training people on how to change will not achieve the desired results because the<br />
whole organization never reaches a point where everyone is trained at the same level and<br />
at the same time. Oftentimes, it is not affordable to stop work and train everyone. Some<br />
organizations adopt the imbedded Change Agent approach where selected individuals are<br />
trained in the philosophy <strong>of</strong> change and then dropped into the organization to make<br />
miracles happen. These embedded Change Agents soon find that without all <strong>of</strong> the Core<br />
Ingredients as shown in Figure 9.2—power, authority, interpersonal skills, and<br />
commitment—they become quickly frustrated. When someone who has no authority or<br />
power is invited in to help an organization, it is important that someone from within that<br />
organization becomes the imbedded change agent who can further the assistance; instead,<br />
the person in the organization <strong>of</strong>ten watches the usual pattern develop <strong>of</strong> a cluster <strong>of</strong><br />
trainings, assessments, and change targets set to be implemented. Then the reality sets in<br />
that the organization being assisted has other priorities not related to the change<br />
envisioned; meetings get canceled, follow-on trainings get postponed, change targets slip,<br />
and the imbedded change agent gets frustrated and ultimately gets blamed for the failure.<br />
Simply stated, in the absence <strong>of</strong> leadership and organization-wide commitment to change,<br />
a Change Agent’s success will be limited.<br />
Core Ingredients and Dimensions <strong>of</strong> Change<br />
Low<br />
High<br />
Authority<br />
High<br />
High<br />
Interpersonal Skills<br />
Fast Burn Out<br />
(Imbedded)<br />
Water and Wait<br />
The Complete Leader<br />
“Change Agent”<br />
Push Agent<br />
Commitment<br />
(Process)<br />
(Dictator)<br />
Low<br />
Low<br />
Low<br />
Power<br />
High<br />
Figure 9.2: Core Ingredients and Dimensions <strong>of</strong> Change<br />
Real Change Agents have all four Core Ingredients <strong>of</strong> Change at the highest level, and<br />
they lead change by example in their areas <strong>of</strong> responsibility. If leaders lack interpersonal<br />
skills and commitment, they become push agents; since they have been told to lead the<br />
________________________________________________________________________<br />
93<br />
<strong>Modular</strong> <strong>kaizen</strong>: Dealing with Disruptions Chapter 9
change because <strong>of</strong> their position, they typically do not believe in it. Push agents achieve<br />
some limited degree <strong>of</strong> success initially, but then those employees whom they lead soon<br />
stop listening and acting since they see that leadership is not really committed or<br />
engaged.<br />
Once a true organizational change effort gets started, an effective way to train all <strong>of</strong> the<br />
people on how to change is on-the-job training. Teaching and showing them how to<br />
change by doing a little change all <strong>of</strong> the time is most beneficial. Individuals become<br />
great Change Agents when they are actually practicing changing on a regular and<br />
consistent basis. Change has to be led; it cannot be delegated.<br />
How does an organization approach constant change?<br />
Successful organizations approach change by constantly reinventing themselves, thinking<br />
ahead, and making minor changes so that they are always positioned for the next wave <strong>of</strong><br />
change in the marketplace. This way employees view change not as a strange<br />
phenomenon to resist but as one to embrace and not fear. It is important not to make<br />
everyone an agent <strong>of</strong> change within the organization. Simply developing Change Agents<br />
skilled only in the philosophy <strong>of</strong> change wastes resources since they usually have never<br />
actually implemented change but have only talked about it in the abstract. Putting<br />
employees through two to three days <strong>of</strong> mock exercises <strong>of</strong> change working on<br />
hypothetical issues also is likely to have little, if any, lasting impact. In both cases, no<br />
link to reality is evident; nothing beats doing it for real. Saving “Water and Wait” training<br />
and consulting dollars and investing them in the first three Triggers <strong>of</strong> Change will help<br />
to lower the resistance to the fourth Trigger <strong>of</strong> Change—“The way we do business.” This<br />
approach has a higher potential return on investment.<br />
What behaviors can leaders use to support change on an individual level?<br />
At the end <strong>of</strong> each week, the leadership and employees <strong>of</strong> an organization should be<br />
asking themselves “How have we changed this week? How must we change next week?”<br />
Leaders can encourage potential change innovators to emerge and the early adopters <strong>of</strong><br />
change to continue by nurturing, facilitating, and protecting creative and worthwhile<br />
change ideas in addition to appropriate responses to change. Leaders can provide this<br />
support by standing behind the creative employee’s ideas, finding resources within the<br />
organization to put their subordinates’ new ideas into action, and publicly recognizing<br />
individuals who exhibit the organization’s preferred response-to-change behaviors. When<br />
leaders fail to support and find resources for new ways <strong>of</strong> doing business, these ideas and<br />
adaptive behaviors can wither and die before their potential benefits are ever considered<br />
and before others can observe and emulate the early or successful adopters <strong>of</strong> new<br />
changes. Without visible leadership support, any change program will be viewed as just<br />
another top management fad to be waited out until it disappears.<br />
________________________________________________________________________<br />
94<br />
<strong>Modular</strong> <strong>kaizen</strong>: Dealing with Disruptions Chapter 9
When must a consistent and sustainable change effort be initiated?<br />
Does an organization wait for disaster or have foresight? The Four Triggers <strong>of</strong> Change<br />
shown in Figure 9.1 are arranged in four quadrants, bound by the Four Variables <strong>of</strong><br />
Successful Change at different levels <strong>of</strong> intensity. The Four Variables <strong>of</strong> Successful<br />
Change—Management Involvement, Degree <strong>of</strong> Change, Resource Commitment, and<br />
Resistance to Change—are elements that need to be thought through in advance <strong>of</strong><br />
starting any change effort, defining how much can realistically be accomplished and in<br />
what timeframe.<br />
The fourth Trigger <strong>of</strong> Change, “Change the Way We Do Business,” is a total<br />
transformational cultural change and the most difficult to accomplish in a short<br />
timeframe. Often when a more intensive Trigger <strong>of</strong> Change occurs, organizations shoot<br />
themselves in the foot. When an organization undertakes radical and quick change, it is<br />
usually as a knee-jerk reaction to being caught flat-footed in a changing marketplace or<br />
surprised by a competitor that is fierce and flexible. Massive upheaval usually results.<br />
The resistance to the change internally is high and sometimes rebellious. Management<br />
must heavily involve itself in making the change and patching up the mistakes caused by<br />
engaging in this massive change, possibly defending itself against charges <strong>of</strong><br />
incompetence. The philosophy that is espoused is to link the organization quickly to a<br />
new vision and possibly a new business model that may or may not be well-devised. Thus<br />
the possibility <strong>of</strong> successful execution <strong>of</strong> a Total Transformational Cultural Change is<br />
small, and very few organizations do this well.<br />
The fourth Trigger <strong>of</strong> Change is the only level where all Four Variables <strong>of</strong> Successful<br />
Change must be at their maximum level <strong>of</strong> intensity. Running four activities at their<br />
maximum level and expecting them to mesh and turn out the desired result typically is<br />
more wishful thinking than reality. At least one or two <strong>of</strong> them will have a misstep and<br />
throw the rest out <strong>of</strong> synchronization. When this happens, the desired goal is not capable<br />
<strong>of</strong> being reached, much less effort or loss recouped.<br />
Organizations have better success with change if they use the other three Triggers <strong>of</strong><br />
Change since the Four Variables <strong>of</strong> Successful Change are at different levels <strong>of</strong> intensity;<br />
some are low, and some need to be high. The odds <strong>of</strong> success are higher when only one<br />
or two variables that need to be maintained at high intensity levels are in place.<br />
The first type <strong>of</strong> change, or first Trigger <strong>of</strong> Change, may result from a desire within the<br />
organization to seek small and continuous improvements. These changes typically are<br />
more gradual and less overarching. All Four Variables <strong>of</strong> Successful Change function at<br />
their lowest levels <strong>of</strong> intensity. When this occurs, each part <strong>of</strong> the organization is making<br />
gradual and continuous improvement in the way that it works and is a great way to train<br />
individuals in how to change. This on-the-job employee basic-level change training<br />
works.<br />
________________________________________________________________________<br />
95<br />
<strong>Modular</strong> <strong>kaizen</strong>: Dealing with Disruptions Chapter 9
The second Trigger <strong>of</strong> Change may result from a desire within the organization for<br />
structural change that will affect the organization’s functions. This type <strong>of</strong> change has<br />
Resistance to Change at its highest level <strong>of</strong> intensity and Management Involvement at a<br />
low level <strong>of</strong> intensity. This change can be accomplished quickly since it usually is a<br />
reorganization that can be isolated to specific departments and business units. Usually the<br />
resistance is confined to a specific area in the organization and can be controlled and<br />
monitored. The Resistance to Change may be isolated to a few individuals that can be<br />
coached or consulted into joining the effort. This type <strong>of</strong> change happens whenever<br />
certain functions are no longer needed, the organization needs to be flattened, a key<br />
manager or employee leaves, a business unit is sold, or a product or service line is<br />
discontinued. Such change is healthy for an organization in the long run since it<br />
repositions the organization to focus its employees and resources on new tasks or new<br />
businesses for the future.<br />
The third Trigger <strong>of</strong> Change may result when a need and desire for change in the way<br />
people interact within the organization is evident. This type <strong>of</strong> organizational behavior<br />
change has the Degree <strong>of</strong> Change and Management Development at their highest levels<br />
<strong>of</strong> intensity. This type <strong>of</strong> change involves having a very clear philosophy statement <strong>of</strong><br />
why it is necessary to change the way employees interact and support each other in the<br />
organization. This new philosophy <strong>of</strong> change could be a new mission, vision, values, or<br />
goals for the organization. The degree <strong>of</strong> change is high since people will be required to<br />
act and behave in entirely different ways in order to meet the new goals in the<br />
organization.<br />
If organizations are constantly working on the First Trigger <strong>of</strong> Change and are<br />
occasionally making Trigger Two and Three Changes, they will, in effect, accomplish a<br />
Level Four Change in an organized manner over time while reducing the stress on the<br />
organization that a complete level four radical transformational change entails.<br />
How are organizations and their employees best engaged in supporting a successful<br />
change effort?<br />
Once a Trigger <strong>of</strong> Change is embraced, it is important to engage everyone fully in the<br />
change effort. Figure 9.3, the “Change Commitment Spectrum,” shows steps that the<br />
organization and the individual can take; these steps increase the likelihood <strong>of</strong> a<br />
successful change effort.<br />
When a change effort begins, both the organization and individual employees struggle<br />
with the Translation Spectrum shown in Figure 9.3. The Translation Spectrum introduces<br />
stress and anxiety into an organization. This stress and anxiety result from an<br />
organization not completely defining what it is trying to achieve with its change effort. If<br />
the concept <strong>of</strong> “what change will accomplish” is not clear and compelling, then the<br />
individuals in the organization cannot envision what the end state will be and how they fit<br />
into that picture. When individuals cannot picture a future reality that clearly includes<br />
them in the “Big Picture,” they begin to feel stressed and anxious. Successful change<br />
________________________________________________________________________<br />
96<br />
<strong>Modular</strong> <strong>kaizen</strong>: Dealing with Disruptions Chapter 9
esults when an organization helps its employees move seamlessly through the<br />
Translation Spectrum. Concept to reality is easier when the end state is clearly defined<br />
rather than one that each individual interprets differently.<br />
Change Commitment Spectrum<br />
High Organization<br />
Low Individual<br />
Organization<br />
Individual<br />
High Concept<br />
Low Reality<br />
Commitment To Change<br />
Step 1. CATALYST<br />
•Cause<br />
•Why<br />
Step 2. RESULT<br />
• Output<br />
• Expectation<br />
Step 3. CAPACITY<br />
• Experience<br />
• Assessment/Needs<br />
Step 4. SKILL<br />
• Capability<br />
• Development/Training<br />
Translation Spectrum<br />
High Individual<br />
High Organization<br />
High Reality<br />
Low Concept<br />
Figure 9.3: Change Commitment Spectrum<br />
What strategies decrease stress, anxiety, and tension in individual employees? Four<br />
primary questions need to be answered to an individual’s satisfaction before they can<br />
even attempt to “give it their all” when faced with change. The individual can answer the<br />
first two questions; the organization and its leadership answer the last two questions.<br />
1. Do I have the capacity (experience) to change?<br />
2. Do I have the capability (skills) to change?<br />
3. What is the change that is wanted?<br />
4. What is the expectation <strong>of</strong> results to be achieved?<br />
All four questions need to be addressed to all parties’ satisfaction to ensure that they<br />
wholeheartedly move with the change. If any one <strong>of</strong> the answers is perceived as unclear<br />
or threatening according to the individual, then the person will be less likely to move with<br />
the change and more likely to hesitate, work at partial speed or energy, sabotage the<br />
change, or simply not participate in the change. The likelihood <strong>of</strong> successful change<br />
decreases quickly when the individual perceives more than one answer to these questions<br />
as threatening, unclear, or negative.<br />
Organizational imperatives explain the “what” and the “why” <strong>of</strong> change to an employee.<br />
While organizations are improving their ability and consistency in addressing these<br />
issues, the individual imperatives that speak to “how” the change will occur are <strong>of</strong>ten<br />
________________________________________________________________________<br />
97<br />
<strong>Modular</strong> <strong>kaizen</strong>: Dealing with Disruptions Chapter 9
assumed or overlooked. One only need look to Maslow’s Hierarchy <strong>of</strong> Needs 2 to<br />
understand that the individual’s perceptions are the root <strong>of</strong> greater anxiety and stress and<br />
are the more common and frequent reasons why change efforts are not successful in<br />
organizations.<br />
Consequently, when addressing the capacity for change, it is essential to look to past<br />
individual and organizational experiences. How much change have they experienced?<br />
What types <strong>of</strong> changes have occurred? How have individuals and groups reacted? As a<br />
first step towards a proactive stance, management needs to determine how small changes<br />
can be built into the daily, weekly, and quarterly regimen <strong>of</strong> individuals and workgroups<br />
(e.g., national workgroups, teams, etc.). In many cases, these changes are occurring now,<br />
but the capability to handle them rapidly with an economy <strong>of</strong> energy while productively<br />
requiring that a singular focus be put on what is happening, how people are reacting, and<br />
what the expectations are for output is crucial.<br />
How do you really accelerate change?<br />
Individual behavior provides us with four signposts for rapid and successful change.<br />
Signpost 1: Usually, a catalytic event provides the energy or impetus to change.<br />
Without the pain or anticipated pain <strong>of</strong> a catalyst, the necessary commitment energy<br />
<strong>of</strong>ten is not present to drive through the discomfort <strong>of</strong> change.<br />
Signpost 2: Next, the individual forms an image <strong>of</strong> a better; future state as an<br />
antidote, or alternative, to the flawed status quo condition. Again, without the<br />
promise <strong>of</strong> substantial improvement, the initial energy required for successful change<br />
does not exist.<br />
These first two signposts are fairly conceptual in nature. They set the stage for the next<br />
two signposts by building the urgency, energy, and commitment needed to take personal<br />
action and commit individual resources. Successful framing within these first two<br />
signposts is not a guarantee that change will be implemented or successful, but the<br />
absence <strong>of</strong> one or both is a strong predictor <strong>of</strong> failure or flawed change.<br />
Signpost 3: Capacity consists <strong>of</strong> the individual taking stock <strong>of</strong> his/her own current<br />
knowledge and resources and performing a gap analysis between present capacity<br />
and the ideal future state. Also, it is important to decide what information, skill, or<br />
ability is needed to determine a new course <strong>of</strong> action and ensure that it will be<br />
successful. The individual compares the present state to the ideal future state and<br />
determines what is needed to bridge the gap.<br />
2 Maslow A., Lowery R. (Ed.). Toward a psychology <strong>of</strong> being (3rd ed.). New York: Wiley & Sons; 1998.<br />
98<br />
________________________________________________________________________<br />
<strong>Modular</strong> <strong>kaizen</strong>: Dealing with Disruptions Chapter 9
Signpost 4: Finally, the individual fills the gaps between the status quo and the<br />
future ideal state with skill development, knowledge, practice, training, and<br />
application. These actions facilitate the move from flawed status quo to the future<br />
ideal state as the new reality.<br />
The latter two signposts are concrete, action-oriented, and increasingly labor-intensive.<br />
The chance for failure, errors, mishaps, recriminations, second-guessing and other<br />
various forms <strong>of</strong> personal pain and discomfort all exist here with higher possibility and<br />
probability. Consequently, an individual requires the most support with these steps.<br />
The interrelationship <strong>of</strong> the Four Triggers <strong>of</strong> Change, Variables <strong>of</strong> Successful Change,<br />
and the Change Commitment Spectrum are shown in Figure 9.4. In each quadrant <strong>of</strong><br />
Figure 9.4, the Four Steps <strong>of</strong> Change Commitment Spectrum is a subset <strong>of</strong> each <strong>of</strong> the<br />
Triggers <strong>of</strong> Change.<br />
The first two steps <strong>of</strong> the Change Commitment Spectrum frame the change imperative by<br />
answering the questions “why change” and “towards what result.” These answers are<br />
primarily the responsibility <strong>of</strong> the organization to set forth in a clear and compelling<br />
manner so that the individuals making the changes have the necessary energy and<br />
commitment to move forward with their work. The organization then needs to facilitate<br />
the availability <strong>of</strong> resources and reward the individuals for engaging in the subsequent<br />
two steps, “assessing needs” based on gap analysis <strong>of</strong> current capacity and future state,<br />
then “building capability” to meet that capacity through skill development.<br />
The Four Variables <strong>of</strong> Successful Change<br />
Management Involvement<br />
High<br />
Low<br />
Trigger II<br />
Trigger IV<br />
High<br />
High<br />
Change Commitment Continuum<br />
Change Commitment Continuum<br />
Resource Commitment<br />
Step 1<br />
Step 3<br />
Step 2<br />
Step 4<br />
Trigger I<br />
Change Commitment Continuum<br />
Step 1<br />
Step 3<br />
Step 1<br />
Step 3<br />
Step 2<br />
Step 4<br />
Trigger III<br />
Change Commitment Continuum<br />
Step 1<br />
Step 3<br />
Resistance to Change<br />
Step 2<br />
Step 4<br />
Step 2<br />
Step 4<br />
Low<br />
Low<br />
Minor<br />
Major<br />
Radical<br />
Degree <strong>of</strong> Change<br />
Figure 9.4: The Four Variables <strong>of</strong> Successful Change<br />
________________________________________________________________________<br />
99<br />
<strong>Modular</strong> <strong>kaizen</strong>: Dealing with Disruptions Chapter 9
Summary<br />
Organizations must approach change by constantly reinventing themselves, continually<br />
making many minor changes so that they are always positioned for the next wave <strong>of</strong><br />
change in the environment (e.g., fiscal, political, community health status). This way,<br />
their workforce views change not as strange phenomena to resist but as a concept to<br />
embrace. Change becomes routine if it is always happening. It is normal to change if one<br />
is always doing it. Organizations must constantly ask themselves:<br />
<br />
<br />
<br />
What needs to change in order for the organization to be a fierce and flexible<br />
force in the marketplace?<br />
How has the organization changed this week?<br />
How must the organization change next week?<br />
Organizations have to build a workforce that is willing to take risks and try new ways. It<br />
is a never-ending cycle <strong>of</strong> change, change, and more change in the flexible organization.<br />
The word Kaizen comes from the Japanese words “kai,” meaning change, and “zen,”<br />
meaning good. Organizations that want to embrace <strong>Modular</strong> <strong>kaizen</strong> must be ready to<br />
embrace constant change and continuous improvement towards a defined standard <strong>of</strong><br />
excellence that is always increasing.<br />
100<br />
________________________________________________________________________<br />
<strong>Modular</strong> <strong>kaizen</strong>: Dealing with Disruptions Chapter 9
Chapter 10: Daily Work Management: Using Quality Improvement Skills in Daily<br />
Work 1<br />
"If you add a little to a little and do this <strong>of</strong>ten enough, soon it will become great."<br />
Hesiod, 8th century BC Greek Poet<br />
The quotation above is the essence <strong>of</strong> quality improvement (QI) in daily work—many<br />
small, continuous improvements add up over time. QI in daily work is called “daily work<br />
management” (DWM) because it uses the tools and techniques <strong>of</strong> QI to make daily work<br />
better, more internally and externally customer-focused, and more manageable. By<br />
making daily work more manageable, it helps to reduce stress. DWM is the continuous<br />
improvement <strong>of</strong> the day-to-day work that is performed. Organizations must train their<br />
workforces at all levels in the tools and techniques <strong>of</strong> QI to institute organization-wide<br />
DWM. DWM can also be related to Standardized work from the House <strong>of</strong> <strong>Modular</strong><br />
<strong>kaizen</strong>; Standardized work is consistent performance <strong>of</strong> a task without waste according to<br />
prescribed methods, focused on human ergonomic movement.<br />
The following steps facilitate application <strong>of</strong> QI skills to daily work to make<br />
improvements that simplify tasks, focus more attention on the customer, and deliver a<br />
more consistent product or service.<br />
1. How is time spent? Using a Check Sheet, it is useful to review a calendar for a<br />
couple <strong>of</strong> months to determine in what categories time is spent. Most people find<br />
meetings and e-mails are the major categories, especially at supervisory and<br />
managerial levels. This attribution is fine for a first pass, but to use QI in daily work,<br />
it is important to be more specific. What types <strong>of</strong> meetings are attended, how are they<br />
related to the job, how much time do they take, are they regular or random meetings?<br />
Answers to these questions help to determine what work is completed on a daily<br />
basis. It is a good idea to continue to monitor where time is spent in order to capture<br />
any changes that take place.<br />
Some QI tools 2 that can help to determine where time is spent are:<br />
Check or tally sheets;<br />
Concentration diagrams (pictorial Check Sheets);<br />
Activity/Time-logs;<br />
Sampling—pick days to analyze through a random number generator; and<br />
Pie or Pareto charts to display the data.<br />
1 Parts <strong>of</strong> this chapter are based on: Duffy G, Moran J, Pierson E. Using QI Skills in Daily Work. The<br />
Quality Management Forum. Winter 2011; 36(4): 6-10.<br />
2 Bialek R, Duffy G, Moran J. The <strong>Public</strong> <strong>Health</strong> Quality Improvement Handbook. Milwaukee, WI: ASQ<br />
Quality Press, 2009.<br />
101<br />
________________________________________________________________________<br />
<strong>Modular</strong> <strong>kaizen</strong>: Dealing with Disruptions Chapter 10
2. What are key processes? Dr. W. Edwards Deming said, “If you can't describe what<br />
you do as a process, you don't know what you're doing.” 3 Once where time is spent is<br />
identified, it will point to the critical processes performed on a regular basis. The next<br />
step is to describe these critical processes with between five and ten high-level<br />
process flow steps. 4 These flow process diagrams <strong>of</strong> critical processes describe the<br />
daily work completed on a regular basis.<br />
.<br />
A QI tool to help develop a flow process diagram is a SIPOC+CM Form. 5 This form<br />
indicates who suppliers are, where the inputs are generated, the key elements <strong>of</strong> the<br />
process, where output goes, who the customers <strong>of</strong> the process are, any constraints on<br />
the process, and what measures are used to indicate how the process is performing.<br />
Another QI tool that can be used is the Flow Chart Summary Matrix 6 which helps<br />
document resources that a process consumes in generating its output.<br />
3. Are customers’ needs and wants identified? For each key process identified and<br />
mapped, the customers’ needs and wants must be described for that process. The first<br />
pass will be the process owners’ understanding <strong>of</strong> what they think the customers’<br />
needs are. Once this understanding is documented, it should be validated with the<br />
customer for alignment. If the alignment is not confirmed by the customer, the needs<br />
should be corrected and any modifications analyzed to see if the process can deliver<br />
the updated requirements.<br />
Once agreement is reached with customers on needs and wants, the same process<br />
should be performed with suppliers to make sure that they understand needs and<br />
wants, as well.<br />
Some tools <strong>of</strong> Quality Function Deployment 7 can be used to help with the analysis <strong>of</strong><br />
customer wants and needs:<br />
Process steps impact Customer Needs Matrix<br />
Kano model<br />
Understanding/interpreting the Voice <strong>of</strong> the Customer <strong>Table</strong><br />
Internal/external Customer Needs Matrix<br />
4. Is each step controlled and owned in the processes defined? A key part <strong>of</strong><br />
daily QI is that clearly defined process owners understand which parts <strong>of</strong> the<br />
process they control. Process ownership is important because it establishes the<br />
3 ThinkExist. www.thinkexist.com, Accessed February 19, 2011.<br />
4 Collett C, DeMott J, Moran J. Introduction to critical processes. A GOAL/QPC Application Report No.<br />
92-01A; 1992.<br />
5 Bialek R, Duffy G, Moran J. The <strong>Public</strong> <strong>Health</strong> Quality Improvement Handbook. Milwaukee, WI: ASQ<br />
Quality Press; 2009.<br />
6 Duffy G, Moran J. Flow Chart Summary Matrix.<br />
http://www.phf.org/resourcestools/Pages/Flow_Chart_Summary_Matrix.aspx, Accessed January 31, 2011.<br />
7 Duffy G, Moran J, Riley W. Quality Function Deployment and Lean Six Sigma Applications in <strong>Public</strong><br />
<strong>Health</strong>. Milwaukee, WI: ASQ Quality Press; 2010.<br />
102<br />
________________________________________________________________________<br />
<strong>Modular</strong> <strong>kaizen</strong>: Dealing with Disruptions Chapter 10
oles and responsibilities for the process and allows those people doing the work<br />
to make improvements. The Control and Influence Matrix 8 is a QI tool used to<br />
check each process step to determine who has control over it and if others need to<br />
be involved in order to make changes.<br />
5. Are measures for the process established? Once the process is defined, it is<br />
important to understand how it is performing. Verifying whether the process is<br />
stable, repeatable, and in control is crucial. Measurement helps to understand how<br />
well the processes are being implemented, goals are being met, customers are<br />
satisfied, and processes are in control. It is important to determine what measures<br />
should be developed as Key Process Indicators (KPI). The following areas are<br />
some major KPIs:<br />
Effectiveness—Does the process output conform to stated requirements?<br />
Goal: Doing the right things.<br />
Efficiency—Does the process produce the required output at minimum<br />
resource cost? Goal: Doing the right things well.<br />
Quality—Does the output meet customer requirements and expectations?<br />
Timeliness—Does the process produce its output correctly and on time?<br />
Productivity—How well does the process use its inputs to produce its<br />
output? Goal: Establish the ratio <strong>of</strong> the amount <strong>of</strong> output per unit <strong>of</strong> input.<br />
Output —How much does the process produce in a given time period?<br />
Depending on the process, the KPI chosen may be a combination <strong>of</strong> the above or<br />
others. It is desirable to have proactive measures that show what is happening<br />
now in the process rather than reactive measures that show what has happened.<br />
Whatever measures are chosen should give a clear indication <strong>of</strong> how the process<br />
is operating and when action must be taken.<br />
6. Can the process be monitored and controlled on a daily basis? Once the<br />
process can be measured, it needs to be monitored and controlled daily.<br />
Monitoring and controlling are important activities because these indicate when<br />
the process is out <strong>of</strong> control and corrective action needs to be taken. Monitoring,<br />
control, and reacting to important processes will be necessary to maintain<br />
performance levels and hold the gains obtained from improvement activities.<br />
Some QI tools useful for monitoring and control are:<br />
Pareto charts<br />
Histograms<br />
Scatter diagrams<br />
Run charts<br />
Control charts<br />
Stem and leaf plots<br />
8 Bialek R, Duffy G, Moran J. The <strong>Public</strong> <strong>Health</strong> Quality Improvement Handbook. Milwaukee, WI: ASQ<br />
Quality Press; 2009.<br />
103<br />
________________________________________________________________________<br />
<strong>Modular</strong> <strong>kaizen</strong>: Dealing with Disruptions Chapter 10
7. Can processes be improved? Improvement <strong>of</strong> daily work is the cornerstone <strong>of</strong> a<br />
quality system. Monitoring and control activities point out where the problem<br />
areas are. Using the Plan-Do-Check-Act (PDCA) cycle helps to analyze and<br />
develop solutions to identified problems. The following QI tools can help<br />
prioritize, analyze, and develop solutions to problems:<br />
Problem selection grid<br />
Cause and effect diagrams<br />
Solution and effect diagrams<br />
Stop-Start-Continue matrix<br />
Impact action plots<br />
8. Repeating steps 1–7 on a regular basis checks the process’s performance and<br />
uncovers additional improvement opportunities.<br />
Daily Work Management Case Study 9<br />
Sally the epidemiologist <strong>of</strong>ten feels as though her day is not her own; rarely can she get<br />
ahead on her workload. She is responsible for investigating disease outbreaks,<br />
surveillance, planning, and preparedness activities, writing reports, responding to<br />
community requests for data as well as various other tasks. No matter how many To–Do<br />
lists she makes, something always comes up that distracts her from her original priorities.<br />
She would like to manage her daily work better, and she remembers that a colleague<br />
mentioned something about some helpful QI tools that could be applied to her daily<br />
work.<br />
Sally first wants to identify what she does on a typical day and how much time it actually<br />
takes. Her favorite method is to use a random number generator to select one day every<br />
week to analyze. This week Monday was selected, and Sally spent ten minutes filling out<br />
an activity log (<strong>Table</strong> 10.1). To fill out the Daily Management activity log, she spent<br />
some time reviewing her email to see what she had accomplished on Monday. She went<br />
back through her appointment calendar and e-mails for ten previous Mondays and found<br />
that the majority <strong>of</strong> her time was spent on communicable disease investigations.<br />
Sally decided to analyze the communicable disease investigations since they took up the<br />
bulk <strong>of</strong> her time on most days. Her analysis pointed to these investigations as one <strong>of</strong> the<br />
critical processes she performs on a regular basis. She thought if she mapped out the<br />
process she used to complete an investigation, it might help her figure out where all <strong>of</strong><br />
her time is spent. So she found a template for a SIPOC+CM form and filled it out. See<br />
Figure 10.1 for Sally’s SIPOC+CM example.<br />
9 The authors wish to thank Elizabeth Pierson, MPH, CPH, Epidemiologist for Planning and Assessment at<br />
Franklin County <strong>Public</strong> <strong>Health</strong> in Columbus, Ohio for developing this case study.<br />
104<br />
________________________________________________________________________<br />
<strong>Modular</strong> <strong>kaizen</strong>: Dealing with Disruptions Chapter 10
Activity Category Amount <strong>of</strong> time spent<br />
(minutes)<br />
Pertussis, Salmonella Communicable disease<br />
50<br />
investigations<br />
Norovirus<br />
Food borne disease<br />
10<br />
investigation<br />
Grant updates Planning and preparedness 25<br />
Communicable disease Monthly meeting 5<br />
reporting system updates<br />
Phone calls and emails from<br />
hospitals<br />
Surveillance 10<br />
<strong>Table</strong> 10.1: Daily Management Activity Log<br />
Begins with:<br />
Disease report<br />
Inputs:<br />
Disease report, where patient<br />
seen, results from lab tests, info<br />
from patient<br />
Suppliers:<br />
Hospitals, labs, private physicians,<br />
schools, daycares,health<br />
departments, general public<br />
Constraints:<br />
Limited information from suppliers, no lab<br />
tests, uncooperative public<br />
Process/Activities:<br />
Receive disease report, contact provider,<br />
contact and interview patient(s), call in<br />
prescription (if needed), contact labs for tests<br />
and/or test results, arrange for sample<br />
collection, communicate with patient(s) for<br />
pick‐up and delivery <strong>of</strong> test kits and samples,<br />
follow‐up with patient(s) after appropriate<br />
amount <strong>of</strong> time, follow‐up with providers,<br />
manage data<br />
Customers:<br />
Hospitals, labs, private physicians, schools,<br />
daycares, general public<br />
Ends with:<br />
<strong>Health</strong>y individuals returning to<br />
school or work<br />
Measures:<br />
Percent patients assisted<br />
Fewer reported illnesses in<br />
community<br />
Outputs:<br />
Patient complies with<br />
recommendation and prevents<br />
further disease spread, remove<br />
patient from sensitive occupation<br />
until healthy<br />
Figure 10.1: Communicable Disease Investigation SIPOC+CM<br />
Once Sally understood one <strong>of</strong> her critical processes, she decided to investigate the<br />
customer needs and wants <strong>of</strong> this process. To do this, she made a list <strong>of</strong> potential<br />
customer desires and used a Customer Needs Matrix as shown in <strong>Table</strong> 10.2. She listed<br />
potential customers and their needs as she understood them. Then she rated the perceived<br />
level <strong>of</strong> their satisfaction on a scale <strong>of</strong> 1 to 5 with 1 being low and 5 being satisfied. She<br />
plans to use the last column after she contacts key customers to verify their needs and<br />
current level <strong>of</strong> satisfaction.<br />
________________________________________________________________________<br />
105<br />
<strong>Modular</strong> <strong>kaizen</strong>: Dealing with Disruptions Chapter 10
Customer Needs Satisfaction Checked<br />
Patients Education, Prevention, 3<br />
Prescriptions<br />
Providers Guidance 3<br />
<strong>Table</strong> 10.2: Customer Needs Matrix<br />
As Sally reviewed the process flow and other aspects <strong>of</strong> the process, she realized that she<br />
did not actually have control over all <strong>of</strong> the pieces <strong>of</strong> her daily work. Without control, the<br />
daily work had the tendency to manage her. The idea <strong>of</strong> Daily Management is that Sally<br />
was the driver <strong>of</strong> the activities, not the other way around. In the packet <strong>of</strong> information<br />
that her colleague had forwarded to her, Sally found a Control and Influence Matrix<br />
(<strong>Table</strong> 10.3). She sensed that by evaluating her level <strong>of</strong> control, she might refine the<br />
process more effectively and manage her time in more appropriate ways.<br />
Control<br />
No control<br />
Knowledge<br />
Data management<br />
[Do it]<br />
Prescribing medication<br />
[Influence]<br />
No<br />
knowledge<br />
Receive disease reports from<br />
providers<br />
[Get help]<br />
Patients don’t return phone calls<br />
[Stay away]<br />
<strong>Table</strong> 10.3: Control and Influence Matrix<br />
What she found was that she really had control only over data management. She had<br />
some influence when she contacted the provider and the patient or the lab and limited or<br />
no control over whether individuals returned her calls or picked up kits for testing.<br />
Having control over a process is not the only information Sally needs to manage a<br />
process; she needs to know a few more specifics. For instance, she needs to review the<br />
“how” <strong>of</strong> the process; measuring indicators <strong>of</strong> the process can help to ensure that she is<br />
getting the results that she wants.<br />
Of several key process indicators, Sally chose to assess the timeliness and quality <strong>of</strong> her<br />
Daily Management tasks, particularly as they relate to managing the data. In this instance,<br />
that would mean she would need to review and/or input data into the disease reporting<br />
system within a short timeframe. Sally decided to monitor the amount <strong>of</strong> time that had<br />
elapsed between notification <strong>of</strong> a disease and the first phone call to the patient. She also<br />
wanted to add a question about satisfaction to the end <strong>of</strong> each patient phone call. Based<br />
on her reviews with key customers, she determined that a goal <strong>of</strong> 30 minutes would be<br />
appropriate for the review <strong>of</strong> data and a phone call to the patient.<br />
106<br />
________________________________________________________________________<br />
<strong>Modular</strong> <strong>kaizen</strong>: Dealing with Disruptions Chapter 10
Sally decided to set up a Run Chart to track performance against a goal appropriate for<br />
reviewing and/or inputting data into the disease reporting system. She set up a tracking<br />
log to record each time she reviewed or entered data into the disease reporting system and<br />
the amount <strong>of</strong> time that elapsed between notification and action. The Run Chart for the<br />
last 20 entries is shown in Figure 10.2. These measurements are the first that Sally took;<br />
she made a run chart that gave her a total picture <strong>of</strong> the outcome <strong>of</strong> her new Daily<br />
Management activities. She needed to get an initial understanding <strong>of</strong> her performance on<br />
a real-time basis to see if she was close to the targets that she had set for herself. The Run<br />
Chart showed that <strong>of</strong> the last 20 entries, the median amount <strong>of</strong> time that had elapsed<br />
between notification <strong>of</strong> a disease and the first phone call to the patient was more than her<br />
personal target <strong>of</strong> 30 minutes. A simple look at the Run Chart indicates that Sally has<br />
more work to do in managing this part <strong>of</strong> her daily work. At this point she does not know<br />
whether the 30 minute target is too optimistic or whether other improvements can be<br />
made to the routine that she has for receiving the notification and making first contact<br />
with the patient.<br />
Monitoring a run chart is an important activity since it indicates when the process is<br />
trending upward or downward or when the average shifts. Sally’s use <strong>of</strong> simple QI tools<br />
has clearly indicated that she is not there yet.<br />
Measurement (in minutes)<br />
80<br />
70<br />
60<br />
50<br />
40<br />
30<br />
20<br />
10<br />
0<br />
1 2 3 4 5 6 7 8 9 10 11 12 13 14 15 16 17 18 19 20<br />
Time (in days)<br />
Median line<br />
Figure 10.2: Run Chart<br />
When reviewing the Run Chart, Sally realized that some inconsistencies were evident in<br />
the amount <strong>of</strong> time it takes to complete the first steps <strong>of</strong> the investigation—receiving the<br />
data, reviewing it, entering it into the data management system, and calling the patient.<br />
As Sally had realized earlier, she had control over the data management piece, so she<br />
decided that it was the reviewing and inputting into the system that needed improvement.<br />
Sally put together a simple Cause-and-Effect Diagram to investigate further, which is<br />
shown in Figure 10.3.<br />
________________________________________________________________________<br />
107<br />
<strong>Modular</strong> <strong>kaizen</strong>: Dealing with Disruptions Chapter 10
Completing the Fishbone Diagram helped Sally clarify some <strong>of</strong> the issues that could be<br />
directly addressed in the investigation process. She was able to select one <strong>of</strong> the<br />
categories identified and make changes accordingly. Sally also continued to monitor the<br />
timing and efficiency <strong>of</strong> processes so that she could systematically review the data and<br />
continue her improvement activities.<br />
Figure 10.3: Fishbone Diagram (cause and effect)<br />
Conclusion<br />
Henry Ford is quoted as saying, “Quality means doing it right when no one is looking.”<br />
Daily Work Management (DWM), when done well, is practiced day in and day out at all<br />
levels <strong>of</strong> the organization. DWM may not be apparent except for some up-to-date<br />
measurement charts on a wall or some employees meeting to solve a common problem<br />
using QI tools. It may show up as employees making a presentation using QI tools and<br />
techniques or a conference room containing a Fishbone Diagram on a flip chart from a<br />
previous meeting.<br />
________________________________________________________________________<br />
108<br />
<strong>Modular</strong> <strong>kaizen</strong>: Dealing with Disruptions Chapter 10
Some signs to notice which indicate that daily management is not yet a reality in an<br />
organization are: 10<br />
<br />
<br />
<br />
<br />
<br />
<br />
<br />
<br />
<br />
<br />
<br />
The quality <strong>of</strong> a process’s output is different from shift-to-shift, location-tolocation,<br />
person-to-person. This inconsistency relates to a lack <strong>of</strong> standardized<br />
methods, poor training, or a lack <strong>of</strong> accurate metrics.<br />
The same problems continually recur after continually being fixed.<br />
Work processes were never planned out and instead evolved over time by<br />
different people doing the job.<br />
Different areas doing the same work have different forms, collect different data,<br />
and use different technology systems.<br />
Interacting processes have different goals and objectives. A smooth hand-<strong>of</strong>f does<br />
not occur, and items are <strong>of</strong>ten lost or delayed.<br />
A constant crisis mode <strong>of</strong> operation is in place.<br />
Employees are blamed for problems that occur.<br />
Customers complain about a lack <strong>of</strong> service or long waits.<br />
Poor documentation <strong>of</strong> changes made to the process occurs. Often changes are not<br />
communicated clearly to those involved.<br />
When veteran employees take a vacation or leave, problems arise because no one<br />
else knows how tasks are normally accomplished. They were never documented.<br />
For Daily Work Management to be effective, everyone must understand how a process<br />
works, how the process interacts with other processes in the organization, and how it<br />
contributes to the strategic direction <strong>of</strong> the organization. Everyone must feel ownership <strong>of</strong><br />
the process and its output. Measurement must be a way <strong>of</strong> life. Measurement is a vehicle<br />
for improvement, not punishment. Everyone must have a customer/supplier orientation in<br />
which wants and needs are communicated and understood. Equally important is that an<br />
evolving culture in which the status quo is constantly being challenged exists. Sally<br />
began her journey using some very basic tools <strong>of</strong> quality to help organize her daily<br />
management tasks that allow her to measure real-time performance against her own<br />
personal targets. Individual performance tracking does not have to be complex. daily<br />
management is a personal target and a personal success story. The more that individuals<br />
use the skills and tools learned as team members in daily activities, the sooner a culture<br />
<strong>of</strong> QI will be experienced throughout the entire organization.<br />
10 The ROI Alliance, LLC. www.roi-ally.com. Updated 2010. Accessed February 19, 2011.<br />
109<br />
________________________________________________________________________<br />
<strong>Modular</strong> <strong>kaizen</strong>: Dealing with Disruptions Chapter 10
________________________________________________________________________<br />
110<br />
<strong>Modular</strong> <strong>kaizen</strong>: Dealing with Disruptions
Appendix A: Dr. W. Edwards Deming<br />
W. Edwards Deming is referred to by many quality pr<strong>of</strong>essionals as the primary quality<br />
“guru” <strong>of</strong> the 20 th century. Although this reference is arguable, the authors refer to<br />
Dr. Deming as a way to orient the reader to the early designers <strong>of</strong> the current quality<br />
movement.<br />
William Edwards Deming was born on October 14, 1900 in Sioux City, Iowa. His family<br />
moved to several other locations before settling in Powell, Wyoming. Dr. Deming<br />
attended the University <strong>of</strong> Wyoming, earning a bachelor’s degree in engineering in 1921.<br />
He went on to receive a master’s degree in mathematics and physics from the University<br />
<strong>of</strong> Colorado in 1925. He earned a doctorate in physics from Yale University in 1928.<br />
During the summers <strong>of</strong> 1925 and 1926, he worked for the Western Electric Company<br />
Hawthorne Plant in Chicago. It was at Hawthorne that he met Walter A. Shewhart and<br />
became interested in Shewhart’s work to standardize the production <strong>of</strong> telephone<br />
equipment. After receiving his PhD, Deming went to work for the United States<br />
government, applying Shewhart’s concepts to his work at the National Bureau <strong>of</strong> the<br />
Census. Transforming routine clerical operations into statistical process control in<br />
preparation for the 1940 population census led to six-fold productivity improvements in<br />
some processes. As a result, Deming started to run statistical courses to explain his and<br />
Shewart’s methods to engineers and designers in the United States and Canada.<br />
In 1938, Deming published Statistical Adjustment <strong>of</strong> Data and taught courses in the use<br />
<strong>of</strong> his statistical methods. The beneficial effects <strong>of</strong> Deming’s programs such as reductions<br />
in scrap and rework were seen during World War II. However, use <strong>of</strong> his techniques was<br />
generally abandoned after the war as the emphasis turned more to producing quantities <strong>of</strong><br />
consumer goods to alleviate the shortages experienced during wartime.<br />
After the war Deming was invited to Japan as an adviser to the Japanese census. He<br />
became involved with the Union <strong>of</strong> Japanese Scientists and Engineers (JUSE) after its<br />
formation in 1946. JUSE invited him to lecture to the Japanese on statistical methods. In<br />
the early 1950’s, he lectured to engineers and senior managers, including in his lectures<br />
principles now regarded as part <strong>of</strong> modern quality principles. In 1956, Deming was<br />
awarded the Shewhart medal by the American Society for Quality. Four years later,<br />
Deming’s teachings were widely known in Japan, and the Emperor <strong>of</strong> Japan awarded him<br />
the Second Order <strong>of</strong> the Sacred Treasure.<br />
In the late 1970’s, Deming started to work with major American organizations. However,<br />
his work was still relatively unknown in the United States until June 1980 when NBC<br />
aired a documentary called “If Japan Can, Why Can’t We?” Following this exposure, he<br />
became well- known and highly regarded in the quality community.<br />
Deming’s teachings reflected his statistical background by encouraging managers to<br />
focus on variability and understand the difference between special causes and common<br />
111<br />
________________________________________________________________________<br />
<strong>Modular</strong> <strong>kaizen</strong>: Dealing with Disruptions<br />
Appendix A
causes. However, his writings, teachings, and work also extended beyond statistical<br />
methods; he encouraged organizations to adopt a systematic approach to problem solving,<br />
which later became known as the Deming cycle or PDCA (Plan, Do, Check, Act). He<br />
also pushed senior managers to become actively involved in their companies’ quality<br />
improvement programs. Work completed by Deming and his followers in the United<br />
States and elsewhere has attempted to make major changes in the style <strong>of</strong> Western<br />
management. Deming constantly improved and refined his ideas and is considered by<br />
many to be the father <strong>of</strong> the modern quality revolution.<br />
Dr. Deming taught that management should have a full understanding <strong>of</strong> his philosophies<br />
in order to achieve sustainable progress in an organization. In his landmark 1986 book<br />
Out <strong>of</strong> the Crisis, Dr. Deming delineated the revolutionary management philosophy for<br />
establishing quality, productivity, and competitive position. In the book he discusses<br />
management’s failures in future planning, mainly in the prediction <strong>of</strong> problems. These<br />
shortcomings create a waste <strong>of</strong> resources which in turn increase costs and ultimately<br />
impact the prices to customers. When customers do not accept paying for such waste,<br />
they go elsewhere, resulting in loss <strong>of</strong> market for the supplier.<br />
In the introduction to Out <strong>of</strong> the Crisis, Dr. Deming talks about the need for an entirely<br />
new structure from the foundation upward to achieve the needed transformation and<br />
replace the typical American reconstruction or revision approach. Dr. Deming suggests<br />
the new structure in his renowned “14 Points <strong>of</strong> Management.” The 14 points include<br />
creating a constant purpose for the organization, eliminating reliance on inspection,<br />
constant improvement in systems, increased training, and instituting leadership.<br />
In Out <strong>of</strong> the Crisis Dr. Deming also discusses his seven “Deadly Diseases” that include a<br />
lack <strong>of</strong> constancy <strong>of</strong> purpose, focus on short-term pr<strong>of</strong>its, management that is too mobile,<br />
and excessive medical and legal costs. In 1987, the year after publication <strong>of</strong> Out <strong>of</strong> the<br />
Crisis, Dr. Deming was awarded the National Medal <strong>of</strong> Technology in America.<br />
In his final book, The New Economics for Industry, Government, Education, Dr. Deming<br />
outlined his System <strong>of</strong> Pr<strong>of</strong>ound Knowledge. This knowledge is needed for<br />
transformation from the present style <strong>of</strong> management to one <strong>of</strong> optimization. Deming’s<br />
system <strong>of</strong> pr<strong>of</strong>ound knowledge includes management’s need to understand systems,<br />
knowledge <strong>of</strong> statistical theory and variation, planning based on past experience, and<br />
understanding <strong>of</strong> psychology.<br />
Dr. Deming died in 1993 at the age <strong>of</strong> 93.<br />
112<br />
________________________________________________________________________<br />
<strong>Modular</strong> <strong>kaizen</strong>: Dealing with Disruptions<br />
Appendix A
Appendix B: Additional References<br />
Books:<br />
Beecr<strong>of</strong>t G, Duffy G, Moran J. The Executive Guide to Improvement and Change.<br />
Milwaukee, WI: American Society for Quality (ASQ) Quality Press, 2003.<br />
Bialek R, Duffy G, Moran J. The <strong>Public</strong> <strong>Health</strong> Quality Improvement Handbook.<br />
Milwaukee, WI: ASQ Quality Press; 2009.<br />
Duffy G, Moran J. Applications and Tools for Creating and Sustaining <strong>Health</strong>y Teams.<br />
Published on www.phf.org. March 2011.<br />
Duffy G, Moran J, Riley W. Quality Function Deployment and Lean Six Sigma:<br />
Applications in <strong>Public</strong> <strong>Health</strong>. Milwaukee, WI: ASQ Quality Press; 2010.<br />
Duffy G, Moran J. Executive Focus: Focusing your Life and Career. Milwaukee, WI:<br />
ASQ Quality Press; 2008.<br />
Articles:<br />
Armbruster S, Kane T, Moran J. Developing a <strong>Health</strong> Department Quality Improvement Plan.<br />
PHF Website. December 2010.<br />
http://www.phf.org/resourcestools/Documents/Developing_a_Quality_Improvement_Plan.pdf<br />
Beaty S, Moran J. Mid-State <strong>Health</strong> Center Quality Improvement Case Study. New England<br />
Rural <strong>Health</strong> Roundtable Newsletter. September 2010.<br />
http://www.phf.org/resourcestools/Pages/The_Mid_State_<strong>Health</strong>_Center_Quality_Improvement<br />
_Case_Study.aspx<br />
Beitsch L, Duffy G, Moran J. Ready, AIM, Problem Solve. Quality Texas <strong>Foundation</strong><br />
Update. October 2009.<br />
http://www.phf.org/resourcestools/Pages/Ready_AIM_Problem_Solve.aspx<br />
Bialek R, Duffy G, Moran J. SIPOC + CM Diagram. <strong>Health</strong>care Update: Quality Tools<br />
and Applications. American Society for Quality, January 13, 2009.<br />
http://www.asq.org/healthcare-use/why-quality/sipoc.html<br />
Bialek R, Duffy G, Moran J. On-the-Job Tool: Spaghetti Diagram. ASQ Weekly. October 13,<br />
2010.<br />
Bialek R, Duffy G, Moran J. Spaghetti Diagram. <strong>Health</strong>care Update: Quality Tools and<br />
Applications. March 9, 2010.<br />
http://asq.org/learn-about-quality/process-analysis-tools/overview/spaghetti-diagram.html<br />
113<br />
________________________________________________________________________<br />
<strong>Modular</strong> <strong>kaizen</strong>: Dealing with Disruptions<br />
Appendix B
Duffy G, Henry B, Moran, J, Parsons H, Riley W. Realizing Transformational Change<br />
through Quality Improvement in <strong>Public</strong> <strong>Health</strong>. Journal <strong>of</strong> <strong>Public</strong> <strong>Health</strong> Management<br />
and Practice. 2010: 16:(1): 72-78.<br />
Duffy G, McCoy K, Moran J, Riley W. The Continuum <strong>of</strong> Quality Improvement in<br />
<strong>Public</strong> <strong>Health</strong>. The Quality Management Forum. 2010:35:(4).<br />
Duffy G, Moran J. A Complete Quality System Requires A Complete Leader. Quality Texas<br />
<strong>Foundation</strong> Update. December 2010.<br />
http://www.texas-quality.org/SiteImages/125/Newsletter/December%20Newsletter%202010.pdf.<br />
Duffy G, Moran J. Flow Chart Summary Matrix. PHF E-News. March 2, 2010.<br />
http://www.phf.org/resourcestools/Pages/Flow_Chart_Summary_Matrix.aspx<br />
Duffy G, Moran J. Force and Effect Chart Guides Teams through Addressing Barriers. Six<br />
Sigma IQ. August 2010.<br />
http://www.processexcellencenetwork.com/methodologies-statistical-analysis-andtools/articles/force-and-effect-chart-guides-team-through-address/<br />
Duffy G, Moran J. Modified Approach: <strong>Modular</strong> <strong>kaizen</strong>. Six Sigma Forum Magazine.<br />
2010: 9:(4).<br />
Duffy G, Moran J. Starting and Sustaining a Complete Quality System. Quality Texas<br />
<strong>Foundation</strong> Update. August 2010.<br />
http://www.phf.org/resourcestools/Pages/Starting_and_Sustaining_a_Complete_Quality_<br />
System.aspx<br />
Duffy G, Moran J. Team Chartering. Quality Texas <strong>Foundation</strong> Update. April 2010.<br />
http://www.texas-quality.org/SiteImages/125/Newsletter/April%202010%20Newsletter.pdf<br />
Duffy G, Moran J, Riley W. Rapid Cycle PDCA. Quality Texas <strong>Foundation</strong> Update.<br />
August 2009.<br />
http://www.phf.org/resourcestools/Documents/2009.8_Article_Quality_Texas_Foundatio<br />
n_Newsletter_Rapid%20Cycle%20PDCA.pdf<br />
Duffy G, Moran J, Riley W. TAPP into the PDCA Cycle to Make Improvements in<br />
<strong>Public</strong> <strong>Health</strong>. Quality Texas <strong>Foundation</strong> Update. June 2009.<br />
http://www.texas-quality.org/SiteImages/125/Newsletter/June%202009%20%20Newsletter.pdf<br />
Duffy G, Moran J, Riley W. TAPP into the PDCA Cycle to Make Improvements in<br />
<strong>Public</strong> <strong>Health</strong>. ASQ <strong>Health</strong>care Update Newsletter. May 2009.<br />
http://www.phf.org/resourcestools/Documents/TAPP_into_the_PDCA_Cycle.pdf<br />
114<br />
________________________________________________________________________<br />
<strong>Modular</strong> <strong>kaizen</strong>: Dealing with Disruptions<br />
Appendix B
Gorenflo G, Moran J. The ABC’s <strong>of</strong> PDCA. PHF Website. April 2010.<br />
http://www.phf.org/resourcestools/Pages/The_ABCs_<strong>of</strong>_PDCA.aspx<br />
Katkowsky S, Kent L, Divine S, Hunter J, Bialek R, Beitsch L, Moran J. Using QI Tools<br />
to Make a Difference in H1N1 Flu Immunization Clinics: A Local <strong>Health</strong> Department's<br />
Experience. Pandemic Flu Week in Review. January 8, 2010.<br />
http://healthyamericans.org/assets/files/NKYClinicFINAL.pdf<br />
Moran J. Top “10” Problems Encountered by Quality Improvement Teams. PHF Pulse<br />
Blog. 2010.<br />
http://www.phf.org/phfpulse/Pages/Top_Problems_Encountered_By_QI_Teams.aspx<br />
115<br />
________________________________________________________________________<br />
<strong>Modular</strong> <strong>kaizen</strong>: Dealing with Disruptions<br />
Appendix B
________________________________________________________________________<br />
116<br />
<strong>Modular</strong> <strong>kaizen</strong>: Dealing with Disruptions
Appendix C: Templates and Examples<br />
Many <strong>of</strong> the figures and tables that appear in this book can be adapted for use in new<br />
settings and circumstances. With that in mind, this Appendix provides templates and<br />
examples using these tools.<br />
117<br />
________________________________________________________________________<br />
<strong>Modular</strong> <strong>kaizen</strong>: Dealing with Disruptions<br />
Appendix C
Rapid Cycle PDCA/PDSA Pre-Planning Check Sheet 1<br />
A<br />
The following are questions that should help guide you when starting a Quality<br />
Improvement Project using Rapid Cycle PDCA/PDSA. This checklist helps guide you<br />
through the Rapid Cycle planning that needs to take place to ensure a successful<br />
improvement project.<br />
C<br />
The check sheet is constructed to indicate what has been completed (√) and what needs to<br />
be done (TBD and Date) and the expected completion date.<br />
Step Rapid Cycle Questions TBD/<br />
Date<br />
PLAN What is the focus/AIM <strong>of</strong> this improvement project?<br />
What are the improvement goals?<br />
Who is impacted?<br />
What is impacted?<br />
When is it impacted?<br />
Where is it impacted?<br />
Why is it impacted?<br />
How is it impacted?<br />
Who is the customer?<br />
Who is the supplier?<br />
What are the constraints?<br />
What is the rapid cycle time line?<br />
Who should be on the improvement team?<br />
<br />
1 ©2009 G. Duffy, J. Moran, and W. Riley<br />
118<br />
________________________________________________________________________<br />
<strong>Modular</strong> <strong>kaizen</strong>: Dealing with Disruptions<br />
Appendix C
Step Rapid Cycle Questions TBD/<br />
Date<br />
Who are the right people?<br />
What training does the improvement team require?<br />
Who will deliver the required training?<br />
When will the required training be delivered<br />
What do we predict will happen?<br />
Measurement(s) defined /developed to show current performance and<br />
track future improvements?<br />
Action plans developed to detail what will be done by who and when?<br />
Communication plan developed to inform needed parties <strong>of</strong> potential<br />
changes, timing, and status?<br />
What additional information will we need to take action?<br />
Other Plan questions unique to your improvement project?<br />
DO Improvement plan developed?<br />
When will the improvement plan be implemented?<br />
When will the pilot test be carried out?<br />
What did we observe from the pilot test?<br />
Did we get sponsors approval and their support if implementing means<br />
going outside our personal area <strong>of</strong> responsibility?<br />
Did we document the implemented changes so the process can be<br />
duplicated and standardized?<br />
Check/ Did the pilot test results agree with the predictions that we made earlier?<br />
Study If not, why?<br />
What new knowledge was gained through this cycle?<br />
How will we use this new knowledge to make additional improvements?<br />
Are we continually checking the results as the process is initiated and<br />
after it is in place to determine if the changes are meeting requirements?<br />
Did we determine if the measurements used to determine success is<br />
adequate?<br />
Did we remember to automate data gathering if at all possible?<br />
ACT Did we go back to ‘Plan’ if the process still is not meeting requirements<br />
investigate additional process improvement opportunities?<br />
Did we make minor adjustments and document them?<br />
Did we standardize the change and initiate the SDCA Cycle initiated?<br />
If the process changes are meeting requirements have we set up a way<br />
to continue to monitor after we standardize them?<br />
<br />
Add other questions that are applicable to your particular improvement project.<br />
119<br />
________________________________________________________________________<br />
<strong>Modular</strong> <strong>kaizen</strong>: Dealing with Disruptions<br />
Appendix C
120<br />
________________________________________________________________________<br />
<strong>Modular</strong> <strong>kaizen</strong>: Dealing with Disruptions<br />
Appendix C
121<br />
________________________________________________________________________<br />
<strong>Modular</strong> <strong>kaizen</strong>: Dealing with Disruptions<br />
Appendix C
122<br />
________________________________________________________________________<br />
<strong>Modular</strong> <strong>kaizen</strong>: Dealing with Disruptions<br />
Appendix C
123<br />
________________________________________________________________________<br />
<strong>Modular</strong> <strong>kaizen</strong>: Dealing with Disruptions<br />
Appendix C
124<br />
________________________________________________________________________<br />
<strong>Modular</strong> <strong>kaizen</strong>: Dealing with Disruptions<br />
Appendix C
125<br />
________________________________________________________________________<br />
<strong>Modular</strong> <strong>kaizen</strong>: Dealing with Disruptions<br />
Appendix C
126<br />
________________________________________________________________________<br />
<strong>Modular</strong> <strong>kaizen</strong>: Dealing with Disruptions<br />
Appendix C
127<br />
________________________________________________________________________<br />
<strong>Modular</strong> <strong>kaizen</strong>: Dealing with Disruptions<br />
Appendix C
128<br />
________________________________________________________________________<br />
<strong>Modular</strong> <strong>kaizen</strong>: Dealing with Disruptions<br />
Appendix C
RESPONSE TEAM CHARTER<br />
2. Team Name: 3. Version: 4. Subject:<br />
5. Problem / Opportunity Statement:<br />
6. Team Sponsor: 7. Team Leader:<br />
8. Team Members: Area <strong>of</strong> Expertise:<br />
1.<br />
2.<br />
3.<br />
4.<br />
5.<br />
9. Process Improvement aim (Mission):<br />
10. Scope (Boundaries):<br />
11. Customers (primary and other): Customer Needs Addressed:<br />
12. Objectives:<br />
<br />
<br />
<br />
13. Success Metrics (Measures):<br />
14. Considerations (Assumptions / Constraints / Obstacles / Risks):<br />
.<br />
15. Available Resources: 16. Additional Resources Required:<br />
17. Key Milestones: Date:<br />
129<br />
________________________________________________________________________<br />
<strong>Modular</strong> <strong>kaizen</strong>: Dealing with Disruptions<br />
Appendix C
18. Communication Plan (Who, How, and When):<br />
19. Key Stakeholders: Area <strong>of</strong> Concern (as it relates to the<br />
Charter):<br />
130<br />
________________________________________________________________________<br />
<strong>Modular</strong> <strong>kaizen</strong>: Dealing with Disruptions<br />
Appendix C
131<br />
________________________________________________________________________<br />
<strong>Modular</strong> <strong>kaizen</strong>: Dealing with Disruptions<br />
Appendix C
________________________________________________________________________<br />
132<br />
<strong>Modular</strong> <strong>kaizen</strong>: Dealing with Disruptions
Appendix D: <strong>Modular</strong> <strong>kaizen</strong> Author Biographies<br />
Ron Bialek, MPP, CQIA is President and CEO <strong>of</strong> the <strong>Public</strong> <strong>Health</strong> <strong>Foundation</strong> (PHF).<br />
Under his leadership over the past 14 years, PHF has focused its efforts on developing<br />
and implementing innovative strategies for improving performance <strong>of</strong> public health<br />
agencies and systems. Initiatives include developing performance management and<br />
quality improvement tools and training for public health pr<strong>of</strong>essionals; developing the<br />
consensus set <strong>of</strong> Core Competencies for <strong>Public</strong> <strong>Health</strong> Pr<strong>of</strong>essionals through the Council<br />
on Linkages Between Academia and <strong>Public</strong> <strong>Health</strong> Practice; creating the Nation’s most<br />
comprehensive public health learning management system – TRAIN – linking together<br />
23 states, the U.S. Medical Reserve Corps, and the Centers for Disease Control and<br />
Prevention’s Division <strong>of</strong> Global Migration and Quarantine; and developing consumeroriented<br />
county health pr<strong>of</strong>iles – the Community <strong>Health</strong> Status Indicators initiative – for<br />
all counties in the U.S. Mr. Bialek recently served as one <strong>of</strong> the editors for the new<br />
<strong>Public</strong> <strong>Health</strong> Quality Improvement Handbook.<br />
Grace L. Duffy, MBA, CMQ/OE, CQA, CQIA, CLSSMBB provides services in<br />
organizational and process improvement, leadership, quality, customer service, and<br />
teamwork by designing and implementing effective systems for business and<br />
management success. Her clients include: the Library <strong>of</strong> Congress; the Charleston,<br />
South Carolina Veterans Administration Medical Center; the Food and Drug<br />
Administration Center for Food Safety and Nutrition; Florida Department <strong>of</strong> Children<br />
and Families; and the U.S. Department <strong>of</strong> Energy Strategic Petroleum Reserve. During<br />
her 20 years with IBM, Ms. Duffy held positions in technical design, services,<br />
management and process improvement. She helped design and deliver IBM’s Executive<br />
Quality training in the late 1980s. Ms. Duffy worked with Trident Technical College in<br />
Charleston, South Carolina for ten years as department head for Business, curriculum<br />
owner and instructor for Trident’s Quality and Corporate management programs, and as a<br />
Dean for management and performance consulting to private industry. Ms. Duffy holds a<br />
Masters in Business Administration from Georgia State University and a Bachelor’s in<br />
Archaeology and Anthropology from Brigham Young University. Ms. Duffy is an ASQ<br />
Certified Manager <strong>of</strong> Quality-Organizational Excellence, Certified Quality Improvement<br />
Associate, Certified Quality Auditor, Certified Lean Six Sigma Master Black Belt, and<br />
Manager <strong>of</strong> Process Improvement. She is a Senior Research Fellow with Purdue<br />
University and a Lean Six Sigma mentor to the University <strong>of</strong> Central Florida Graduate<br />
Engineering programs. In addition, she is a co-author <strong>of</strong> The <strong>Public</strong> <strong>Health</strong> Quality<br />
Improvement Handbook, The Executive Guide to Improvement and Change, and<br />
Executive Focus: Your Life and Career.<br />
John (Jack) W. Moran, PhD, MBA, CQM, CMC, CQIA is a Senior Quality Advisor<br />
with the <strong>Public</strong> <strong>Health</strong> <strong>Foundation</strong> (PHF). He brings to PHF over 30 years <strong>of</strong> quality<br />
improvement expertise in developing quality improvement tools and training programs,<br />
implementing and evaluating quality improvement programs, and writing articles and<br />
books on quality improvement methods, including The <strong>Public</strong> <strong>Health</strong> Quality<br />
133<br />
________________________________________________________________________<br />
<strong>Modular</strong> <strong>kaizen</strong>: Dealing with Disruptions<br />
Appendix D
Improvement Handbook and Executive Focus: Focusing Your Life and Career. In his<br />
role with PHF, he provides consultation, training, and technical assistance to the public<br />
health field and has conducted several visits to local and state health departments<br />
including Minnesota, New Hampshire, New Jersey, Oklahoma, and Pennsylvania. Dr.<br />
Moran is a retired Senior Vice-President <strong>of</strong> Information Systems, Administrative and<br />
Diagnostic Services at New England Baptist Hospital. He has also served as Chief<br />
Operating Officer <strong>of</strong> Changing <strong>Health</strong>care, Incorporated, specializing in management<br />
consulting and educational support to healthcare organizations. For 21 years, Dr. Moran<br />
was employed at Polaroid Corporation where he worked in various senior management<br />
roles in manufacturing, engineering, and quality. His last position was as the Director <strong>of</strong><br />
Worldwide Quality and Systems. For 20 years, Dr. Moran was an Adjunct Pr<strong>of</strong>essor in<br />
the School <strong>of</strong> Engineering at the University <strong>of</strong> Massachusetts at Lowell. Dr. Moran has<br />
been active in the American Society <strong>of</strong> Quality (ASQ) as a Fellow <strong>of</strong> the Society and as<br />
past Exam Chair <strong>of</strong> the Certified Quality Manager’s Exam. Dr. Moran is an ASQ<br />
Certified Quality Manager (CQM) and a Certified Management Consultant (CMC) by the<br />
Institute <strong>of</strong> Management Consultants. Dr. Moran is a member <strong>of</strong> the Malcolm Baldrige<br />
Board <strong>of</strong> Examiners. He holds a BS, MBA, MS, and PhD in education from Walden<br />
University.<br />
134<br />
________________________________________________________________________<br />
<strong>Modular</strong> <strong>kaizen</strong>: Dealing with Disruptions<br />
Appendix D
Index<br />
A<br />
Accelerate change, 98<br />
Accountable Government Initiative, 2<br />
Association <strong>of</strong> Disruption to Area <strong>of</strong> Concern Form, 59-61, 123<br />
B<br />
Big “Q,” 32, 33<br />
C<br />
Capacity measures, 71<br />
Change agent dimensions, 93<br />
Change commitment spectrum, 96-97<br />
Change management, 13, 15, 17, 43, 55, 91-100<br />
Characteristics <strong>of</strong> an effective team, 51<br />
Check/act repeating improvement cycle, 28<br />
Check sheet, 58, 79-80<br />
Checklist, 81<br />
Circle <strong>of</strong> influence, 48<br />
Common cause variation, 78-79<br />
Control and influence matrix, 103, 106<br />
Control chart, 73, 79, 85-88, 103<br />
Customer needs and wants, 105<br />
D<br />
Daily work management, v, 21, 43, 46, 50, 58, 101, 108<br />
Disruption and Impact Diagram, 65, 120<br />
Disruption and Impact Matrix, 34, 35, 47, 48, 52, 59-62<br />
Disruption Form, 65-66, 122<br />
Disruption identification, 18, 45, 58, 64<br />
Dr. W. Edwards Deming, iii, 103, 111<br />
E<br />
Eight (or 8) lean wastes, iv, 19-20<br />
Effective team building, 50<br />
Error pro<strong>of</strong>ing, 19, 80<br />
F<br />
Fast transition, 21, 58, 64, 89<br />
Fishbone diagram, 108<br />
Five S (or 5S), 16, 17-18<br />
135<br />
________________________________________________________________________<br />
<strong>Modular</strong> <strong>kaizen</strong>: Dealing with Disruptions<br />
Index
Flow chart, 39-41, 102<br />
Force & Effect + c a Chart, 19, 50, 63, 65, 124<br />
G<br />
Gap analysis, 45, 98-99<br />
H<br />
House <strong>of</strong> lean, 15<br />
House <strong>of</strong> modular <strong>kaizen</strong>, iii, 8, 13-15, 17, 21, 58, 89, 101, 125<br />
I<br />
Immunization checklist, 81<br />
K<br />
Kaizen, 24, 100<br />
Kaizen Blitz, v, 19, 24, 25, 37<br />
Key performance indicators, 1, 7, 10, 45-46, 60<br />
Key process indicators, 71, 103, 106<br />
Key processes, 102<br />
L<br />
Lean process, 36<br />
Lean wastes, iv, 26<br />
Limited information collection principle, iv, 26, 69<br />
Little “q,” 32-33<br />
M<br />
Mistake pro<strong>of</strong>ing, 89<br />
<strong>Modular</strong> <strong>kaizen</strong> definition, 23<br />
<strong>Modular</strong> <strong>kaizen</strong> example, 27<br />
<strong>Modular</strong> <strong>kaizen</strong> flow, v, 26, 46, 58<br />
O<br />
Outcome measure, 74-75<br />
Out-<strong>of</strong>-control rules, 86<br />
P<br />
Paynter Chart, 84-85<br />
PDCA or PDSA cycle, iii, iv, vi, 14, 21, 27, 29, 45-46, 55-58, 66, 77-78, 104, 112<br />
Performance management components, 6-8<br />
Performance management framework, 10<br />
Performance management measures, 3<br />
136<br />
________________________________________________________________________<br />
<strong>Modular</strong> <strong>kaizen</strong>: Dealing with Disruptions<br />
Index
Poka-Yoke (or Poka-Yoka), 89<br />
Process control, 16, 19, 21, 58, 64, 67, 79, 111<br />
Process map, 3, 15, 17, 33, 39-42, 66-67<br />
Process measure, 72-73, 103<br />
Project management, 19, 58-59, 64<br />
Pull technology (Kanban), 17, 21<br />
Q<br />
Quality at source, 16, 19, 58<br />
R<br />
Rapid Cycle PDCA, 55-58, 118<br />
Response process map, 67<br />
Run charts, 73, 79, 82, 84, 88, 103, 107<br />
S<br />
Shigeo Shingo, 89<br />
SIPOC+CM, 37-39, 64, 102, 104-105, 128<br />
Signposts, 98<br />
Special cause variation, 78-79, 82<br />
System view, 31<br />
T<br />
Team Charter, 129<br />
Teams, iv, 16, 19, 45-53, 59<br />
Trigger <strong>of</strong> change, 94-96<br />
Tri-metric matrix, 67-72, 74-75, 131<br />
Turning Point Model, 3-8<br />
V<br />
Value (stream) map, 4, 5, 14-17, 39, 41<br />
Variation, 45-46, 72-73, 78-79, 82, 84-87<br />
137<br />
________________________________________________________________________<br />
<strong>Modular</strong> <strong>kaizen</strong>: Dealing with Disruptions<br />
Index