department of revenue tax discovery program action steps to
department of revenue tax discovery program action steps to
department of revenue tax discovery program action steps to

Create successful ePaper yourself
Turn your PDF publications into a flip-book with our unique Google optimized e-Paper software.
Appendix IV: Study on the Underground Economy in Philadelphia<br />
City <strong>of</strong> Philadelphia Office <strong>of</strong> the Controller<br />
The Underground Economy In Philadelphia<br />
An example <strong>of</strong> a more complicated and exact measure is found in the New York City study,<br />
where researchers devised a five-step method <strong>of</strong> estimating costs in which workers were grouped<br />
by wage and compliance status. For each group, per-worker estimates <strong>of</strong> payroll and social<br />
insurance premiums led <strong>to</strong> industry-wide estimates <strong>of</strong> lost <strong>tax</strong>es and insurance premiums for the<br />
non-compliant groups, followed by estimates <strong>of</strong> lost income <strong>tax</strong>es and <strong>of</strong> the costs that are<br />
shifted <strong>to</strong> other entities. Numbers provided by this method will be somewhat more precise than<br />
those <strong>of</strong> the simpler methods.<br />
Concurrent <strong>to</strong> the collection <strong>of</strong> the economic data, researchers have explored policies in other<br />
cities and states <strong>to</strong> identify a set <strong>of</strong> best practice recommendations. Most <strong>of</strong> the research that<br />
has been done on this subject has been performed at the state level, so most <strong>of</strong> the existing<br />
policy recommendations involve state law rather than local ordinances. Given this, the policy<br />
recommendations will involve, at least in part, a call for increased state/local communication and<br />
cooperation and lobbying the state for classification standards.<br />
Findings<br />
Based on existing research <strong>of</strong> the informal construction economies <strong>of</strong> other places, this <strong>of</strong>fice<br />
expects that the local informal construction economy will represent approximately 15-25% <strong>of</strong> the<br />
overall construction sec<strong>to</strong>r. In New York City, the bulk <strong>of</strong> the underground construction economy<br />
is found in residential construction, where most <strong>of</strong> the construction businesses are small, with<br />
only 4-10 full-time employees compared <strong>to</strong> 15-25 for non-residential construction companies.<br />
Approximately 66% <strong>of</strong> the affordable housing sec<strong>to</strong>r in NYC is underground (which represents<br />
about 20% <strong>of</strong> the entire underground construction economy). While Philadelphia is obviously<br />
much smaller than New York, this <strong>of</strong>fice expects <strong>to</strong> find proportionate similarities in our<br />
construction industries. New York, like Philadelphia, has enjoyed a construction boom since<br />
2000, with the “biggest surge in residential construction activity since the 1970s.” Additionally,<br />
both New York and Philadelphia’s real estate markets and their construction economies have<br />
remained fairly strong relative <strong>to</strong> the nation.<br />
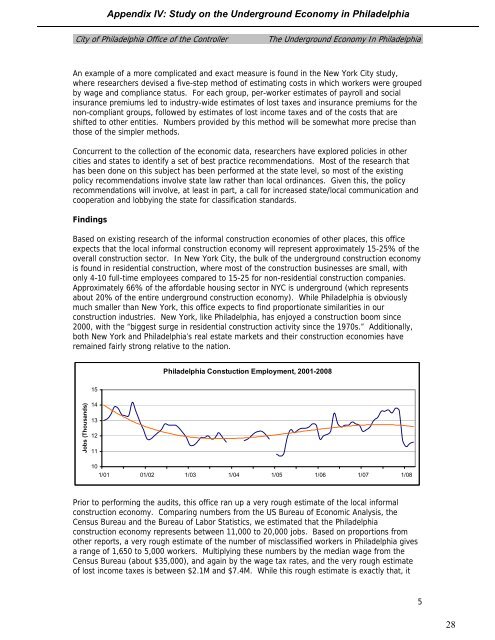
Philadelphia Constuction Employment, 2001-2008<br />
15<br />
Jobs (Thousands)<br />
14<br />
13<br />
12<br />
11<br />
10<br />
1/01 01/02 1/03 1/04 1/05 1/06 1/07 1/08<br />
Prior <strong>to</strong> performing the audits, this <strong>of</strong>fice ran up a very rough estimate <strong>of</strong> the local informal<br />
construction economy. Comparing numbers from the US Bureau <strong>of</strong> Economic Analysis, the<br />
Census Bureau and the Bureau <strong>of</strong> Labor Statistics, we estimated that the Philadelphia<br />
construction economy represents between 11,000 <strong>to</strong> 20,000 jobs. Based on proportions from<br />
other reports, a very rough estimate <strong>of</strong> the number <strong>of</strong> misclassified workers in Philadelphia gives<br />
a range <strong>of</strong> 1,650 <strong>to</strong> 5,000 workers. Multiplying these numbers by the median wage from the<br />
Census Bureau (about $35,000), and again by the wage <strong>tax</strong> rates, and the very rough estimate<br />
<strong>of</strong> lost income <strong>tax</strong>es is between $2.1M and $7.4M. While this rough estimate is exactly that, it<br />
5<br />
28