The $100 billion question - Signal Lake Venture Fund
The $100 billion question - Signal Lake Venture Fund
The $100 billion question - Signal Lake Venture Fund

You also want an ePaper? Increase the reach of your titles
YUMPU automatically turns print PDFs into web optimized ePapers that Google loves.
Table 4: Estimated subsidy for UK banks and building societies (£bn) and global banks ($bn)<br />
2007 2008 2009 Average (2007–09)<br />
Subsidy<br />
Subsidy<br />
/ Total<br />
liabilities<br />
Subsidy<br />
Subsidy<br />
/ Total<br />
liabilities<br />
Subsidy<br />
Subsidy<br />
/ Total<br />
liabilities<br />
Subsidy<br />
Subsidy<br />
/ Total<br />
liabilities<br />
UK<br />
Big 5<br />
Medium<br />
Small<br />
Sample<br />
Total<br />
11 59 107 59<br />
Total 9 52 103 55<br />
Average 2 0 10 1 26 2 13 1<br />
Total 1 7 3 4<br />
Average 0 0 3 3 3 2 2 2<br />
Total 0 1 1 1<br />
Average 0 0 0 1 0 1 0 1<br />
Global<br />
Big 5<br />
Sample<br />
Total<br />
37 220 250 169<br />
Total 18 83 71 57<br />
Average 4 0 17 1 14 1 12 1<br />
See footnotes for tables 2 and 3 for details on sample.<br />
Source: Moody’s, Bank of America Merrill Lynch, Bankscope published by Bureau van Dijk Electronic Publishing and Bank calculations<br />
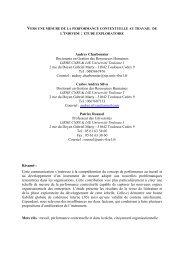
Chart 1: Average assets relative to GDP of US commercial banks (a)<br />
0.014<br />
Average Assets per Commercial Bank as a a<br />
percentage of Nominal GDP<br />
0.012<br />
0.010<br />
0.008<br />
0.006<br />
0.004<br />
0.002<br />
0.000<br />
1934<br />
1938<br />
1942<br />
1946<br />
1950<br />
1954<br />
1958<br />
1962<br />
1966<br />
1970<br />
1974<br />
Year<br />
1978<br />
1982<br />
1986<br />
1990<br />
1994<br />
1998<br />
2002<br />
2006<br />
Average Asset Size of Commercial Banks scaled by Nominal GDP<br />
(a) Blue vertical line represents the 1982 Garn-St Germain Act, green vertical line represents the 1994 Riegle-Neal Act,<br />
red vertical line represents the Riegle-Neal Act coming into effect in 1997.<br />
Source: FDIC and www.measuringworth.org<br />
25