Analysis_Software
Analysis_Software
Analysis_Software

You also want an ePaper? Increase the reach of your titles
YUMPU automatically turns print PDFs into web optimized ePapers that Google loves.
49<br />
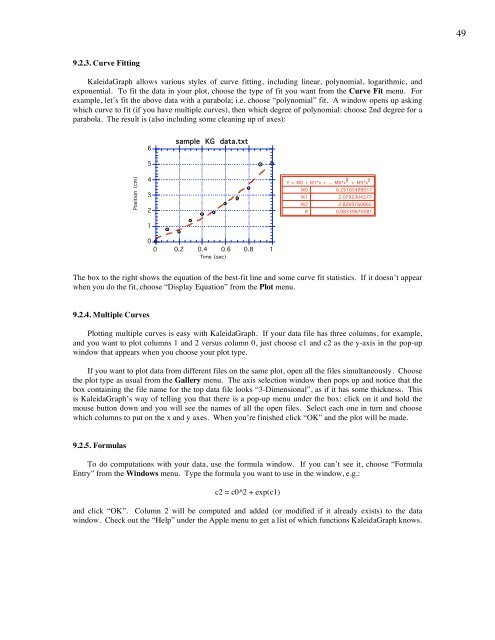
9.2.3. Curve Fitting<br />
KaleidaGraph allows various styles of curve fitting, including linear, polynomial, logarithmic, and<br />
exponential. To fit the data in your plot, choose the type of fit you want from the Curve Fit menu. For<br />
example, let’s fit the above data with a parabola; i.e. choose “polynomial” fit. A window opens up asking<br />
which curve to fit (if you have multiple curves), then which degree of polynomial: choose 2nd degree for a<br />
parabola. The result is (also including some cleaning up of axes):<br />
6<br />
sample KG data.txt<br />
5<br />
Position (cm)<br />
4<br />
3<br />
2<br />
1<br />
Y = M0 + M1*x + ... M8*x 8 + M9*x 9<br />
M0<br />
0.25105499017<br />
M1<br />
2.0792304377<br />
M2<br />
2.8269760865<br />
R<br />
0.98539870081<br />
0<br />
0<br />
0.2 0.4 0.6 0.8 1<br />
Time (sec)<br />
The box to the right shows the equation of the best-fit line and some curve fit statistics. If it doesn’t appear<br />
when you do the fit, choose “Display Equation” from the Plot menu.<br />
9.2.4. Multiple Curves<br />
Plotting multiple curves is easy with KaleidaGraph. If your data file has three columns, for example,<br />
and you want to plot columns 1 and 2 versus column 0, just choose c1 and c2 as the y-axis in the pop-up<br />
window that appears when you choose your plot type.<br />
If you want to plot data from different files on the same plot, open all the files simultaneously. Choose<br />
the plot type as usual from the Gallery menu. The axis selection window then pops up and notice that the<br />
box containing the file name for the top data file looks “3-Dimensional”, as if it has some thickness. This<br />
is KaleidaGraph’s way of telling you that there is a pop-up menu under the box: click on it and hold the<br />
mouse button down and you will see the names of all the open files. Select each one in turn and choose<br />
which columns to put on the x and y axes. When you’re finished click “OK” and the plot will be made.<br />
9.2.5. Formulas<br />
To do computations with your data, use the formula window. If you can’t see it, choose “Formula<br />
Entry” from the Windows menu. Type the formula you want to use in the window, e.g.:<br />
c2 = c0^2 + exp(c1)<br />
and click “OK”. Column 2 will be computed and added (or modified if it already exists) to the data<br />
window. Check out the “Help” under the Apple menu to get a list of which functions KaleidaGraph knows.