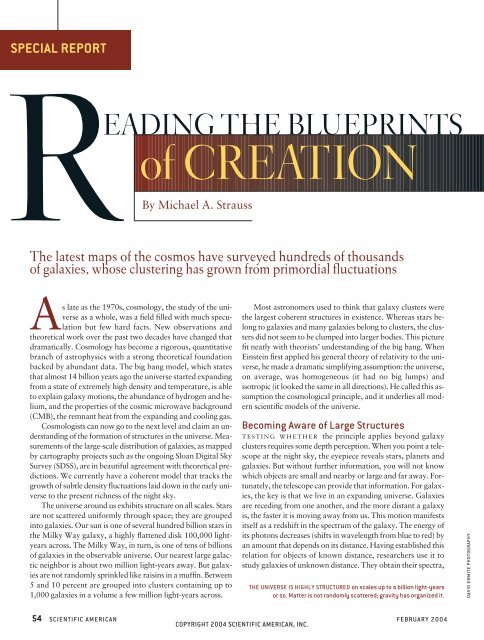
Reading the Blueprints of Creation
Reading the Blueprints of Creation
Reading the Blueprints of Creation
Create successful ePaper yourself
Turn your PDF publications into a flip-book with our unique Google optimized e-Paper software.
SPECIAL REPORT<br />
R<br />
By<br />
EADING THE BLUEPRINTS<br />
<strong>of</strong> CREATION<br />
Michael A. Strauss<br />
The latest maps <strong>of</strong> <strong>the</strong> cosmos have surveyed hundreds <strong>of</strong> thousands<br />
<strong>of</strong> galaxies, whose clustering has grown from primordial fluctuations<br />
As late as <strong>the</strong> 1970s, cosmology, <strong>the</strong> study <strong>of</strong> <strong>the</strong> universe<br />
as a whole, was a field filled with much speculation<br />
but few hard facts. New observations and<br />
<strong>the</strong>oretical work over <strong>the</strong> past two decades have changed that<br />
dramatically. Cosmology has become a rigorous, quantitative<br />
branch <strong>of</strong> astrophysics with a strong <strong>the</strong>oretical foundation<br />
backed by abundant data. The big bang model, which states<br />
that almost 14 billion years ago <strong>the</strong> universe started expanding<br />
from a state <strong>of</strong> extremely high density and temperature, is able<br />
to explain galaxy motions, <strong>the</strong> abundance <strong>of</strong> hydrogen and helium,<br />
and <strong>the</strong> properties <strong>of</strong> <strong>the</strong> cosmic microwave background<br />
(CMB), <strong>the</strong> remnant heat from <strong>the</strong> expanding and cooling gas.<br />
Cosmologists can now go to <strong>the</strong> next level and claim an understanding<br />
<strong>of</strong> <strong>the</strong> formation <strong>of</strong> structures in <strong>the</strong> universe. Measurements<br />
<strong>of</strong> <strong>the</strong> large-scale distribution <strong>of</strong> galaxies, as mapped<br />
by cartography projects such as <strong>the</strong> ongoing Sloan Digital Sky<br />
Survey (SDSS), are in beautiful agreement with <strong>the</strong>oretical predictions.<br />
We currently have a coherent model that tracks <strong>the</strong><br />
growth <strong>of</strong> subtle density fluctuations laid down in <strong>the</strong> early universe<br />
to <strong>the</strong> present richness <strong>of</strong> <strong>the</strong> night sky.<br />
The universe around us exhibits structure on all scales. Stars<br />
are not scattered uniformly through space; <strong>the</strong>y are grouped<br />
into galaxies. Our sun is one <strong>of</strong> several hundred billion stars in<br />
<strong>the</strong> Milky Way galaxy, a highly flattened disk 100,000 lightyears<br />
across. The Milky Way, in turn, is one <strong>of</strong> tens <strong>of</strong> billions<br />
<strong>of</strong> galaxies in <strong>the</strong> observable universe. Our nearest large galactic<br />
neighbor is about two million light-years away. But galaxies<br />
are not randomly sprinkled like raisins in a muffin. Between<br />
5 and 10 percent are grouped into clusters containing up to<br />
1,000 galaxies in a volume a few million light-years across.<br />
Most astronomers used to think that galaxy clusters were<br />
<strong>the</strong> largest coherent structures in existence. Whereas stars belong<br />
to galaxies and many galaxies belong to clusters, <strong>the</strong> clusters<br />
did not seem to be clumped into larger bodies. This picture<br />
fit neatly with <strong>the</strong>orists’ understanding <strong>of</strong> <strong>the</strong> big bang. When<br />
Einstein first applied his general <strong>the</strong>ory <strong>of</strong> relativity to <strong>the</strong> universe,<br />
he made a dramatic simplifying assumption: <strong>the</strong> universe,<br />
on average, was homogeneous (it had no big lumps) and<br />
isotropic (it looked <strong>the</strong> same in all directions). He called this assumption<br />
<strong>the</strong> cosmological principle, and it underlies all modern<br />
scientific models <strong>of</strong> <strong>the</strong> universe.<br />
Becoming Aware <strong>of</strong> Large Structures<br />
T E S T I N G W H E T H E R <strong>the</strong> principle applies beyond galaxy<br />
clusters requires some depth perception. When you point a telescope<br />
at <strong>the</strong> night sky, <strong>the</strong> eyepiece reveals stars, planets and<br />
galaxies. But without fur<strong>the</strong>r information, you will not know<br />
which objects are small and nearby or large and far away. Fortunately,<br />
<strong>the</strong> telescope can provide that information. For galaxies,<br />
<strong>the</strong> key is that we live in an expanding universe. Galaxies<br />
are receding from one ano<strong>the</strong>r, and <strong>the</strong> more distant a galaxy<br />
is, <strong>the</strong> faster it is moving away from us. This motion manifests<br />
itself as a redshift in <strong>the</strong> spectrum <strong>of</strong> <strong>the</strong> galaxy. The energy <strong>of</strong><br />
its photons decreases (shifts in wavelength from blue to red) by<br />
an amount that depends on its distance. Having established this<br />
relation for objects <strong>of</strong> known distance, researchers use it to<br />
study galaxies <strong>of</strong> unknown distance. They obtain <strong>the</strong>ir spectra,<br />
THE UNIVERSE IS HIGHLY STRUCTURED on scales up to a billion light-years<br />
or so. Matter is not randomly scattered; gravity has organized it.<br />
D A V I D E M M I T E P H O T O G R A P H Y<br />
54 S C I E N T I F I C A M E R I C A N F E B R U A R Y 2 0 0 4<br />
COPYRIGHT 2004 SCIENTIFIC AMERICAN, INC.
COPYRIGHT 2004 SCIENTIFIC AMERICAN, INC.
determine <strong>the</strong>ir redshifts and infer how far away <strong>the</strong>y are.<br />
By <strong>the</strong> late 1970s, advances in telescope and detector technology<br />
made it feasible to carry out extensive redshift surveys<br />
<strong>of</strong> galaxies to create three-dimensional maps <strong>of</strong> <strong>the</strong> local cosmos.<br />
As a junior in college, I read a Scientific American article<br />
by Stephen A. Gregory and Laird A. Thompson [“Superclusters<br />
and Voids in <strong>the</strong> Distribution <strong>of</strong> Galaxies,” March 1982]<br />
that detailed some <strong>of</strong> <strong>the</strong>se first 3-D maps. The authors described<br />
hints that Einstein’s cosmological principle might be<br />
wrong: <strong>the</strong> discovery <strong>of</strong> coherent structures that were much<br />
larger than single clusters, and great voids many tens <strong>of</strong> millions<br />
<strong>of</strong> light-years across. I was fascinated. This exercise in cosmography,<br />
in discovering entirely new structures in <strong>the</strong> universe,<br />
struck me as one <strong>of</strong> <strong>the</strong> most exciting things happening<br />
in science, and it led me to my present career.<br />
In 1986 Valérie de Lapparent, Margaret J. Geller and John<br />
P. Huchra <strong>of</strong> <strong>the</strong> Harvard-Smithsonian Center for Astrophysics<br />
(CfA) published a map <strong>of</strong> <strong>the</strong> distribution <strong>of</strong> 1,100 galaxies, out<br />
<strong>of</strong> what eventually would be a survey containing 18,000 galaxies.<br />
This survey confirmed <strong>the</strong> richness and ubiquity <strong>of</strong> large<br />
structures. It revealed an unmistakably frothy appearance to<br />
<strong>the</strong> galaxy distribution; galaxies were located along filaments,<br />
leaving enormous voids. Among <strong>the</strong> map’s most notable features<br />
was a structure dubbed <strong>the</strong> Great Wall, which stretched<br />
700 million light-years from one edge <strong>of</strong> <strong>the</strong> surveyed region to<br />
<strong>the</strong> o<strong>the</strong>r. Given that <strong>the</strong> map did not reveal its end, <strong>the</strong> full extent<br />
<strong>of</strong> <strong>the</strong> wall was unknown.<br />
The presence <strong>of</strong> <strong>the</strong> Great Wall and <strong>the</strong> uncertainty about<br />
its extent added to <strong>the</strong> suspicion that <strong>the</strong> cosmological principle,<br />
and <strong>the</strong>refore our basic <strong>the</strong>oretical underpinning <strong>of</strong> <strong>the</strong> expanding<br />
universe, might be incorrect. Was Einstein wrong?<br />
Was <strong>the</strong> universe not homogeneous on average? It was clear<br />
that we needed to survey larger volumes to find out.<br />
The big bang paradigm holds that <strong>the</strong> structure we see in<br />
galaxy distribution today grew out <strong>of</strong> variations present in <strong>the</strong><br />
almost perfectly smooth early universe. These initial fluctuations<br />
were subtle; <strong>the</strong> density typically varied from one region<br />
Overview/Cosmic Structure<br />
■ Astronomers, acting as cosmic cartographers, are<br />
creating ever more detailed three-dimensional maps <strong>of</strong><br />
<strong>the</strong> locations <strong>of</strong> galaxies and galaxy clusters. The largest<br />
<strong>of</strong> <strong>the</strong>se projects, <strong>the</strong> Sloan Digital Sky Survey, is plotting<br />
a total <strong>of</strong> one million galaxies out to a distance <strong>of</strong> two<br />
billion light-years.<br />
■ The maps show that galaxies are organized into huge<br />
structures, stretching hundreds <strong>of</strong> millions <strong>of</strong> light-years.<br />
These surveys have quantified <strong>the</strong> degree <strong>of</strong> clustering to<br />
high precision. The results agree with <strong>the</strong> clustering<br />
expected from extrapolating <strong>the</strong> cosmic microwave background<br />
(CMB) fluctuations to <strong>the</strong> present. The agreement<br />
indicates that astronomers finally have a consistent<br />
account <strong>of</strong> 14 billion years <strong>of</strong> cosmic evolution.<br />
to ano<strong>the</strong>r by only one part in 100,000, as measured in <strong>the</strong> temperature<br />
<strong>of</strong> <strong>the</strong> cosmic microwave background [see “The Cosmic<br />
Symphony,” by Wayne Hu and Martin White, on page<br />
44]. If a region <strong>of</strong> space had a density higher than <strong>the</strong> average,<br />
it had a greater gravitational pull, and thus matter in its vicinity<br />
was drawn into it. Similarly, a region <strong>of</strong> space that was<br />
slightly less dense than average lost mass with time. Through<br />
this process <strong>of</strong> gravitational instability, <strong>the</strong> denser regions eventually<br />
became <strong>the</strong> huge galactic superclusters we see today; <strong>the</strong><br />
less dense regions became <strong>the</strong> vast empty voids.<br />
Running Hot and Cold<br />
A B O U T T H E T I M E <strong>the</strong> early redshift surveys were completed,<br />
astronomers realized that <strong>the</strong> story had a twist: <strong>the</strong> stars and<br />
gas we see in galaxies represent just a small fraction (about 2<br />
percent) <strong>of</strong> <strong>the</strong> total matter in <strong>the</strong> universe. The rest <strong>of</strong> <strong>the</strong> matter<br />
is revealed indirectly through its gravitational effects. Astronomers<br />
proposed a variety <strong>of</strong> models to describe this dark<br />
matter. These fell into two broad categories, cold and hot, and<br />
<strong>the</strong> difference is crucial to <strong>the</strong> evolution <strong>of</strong> structure.<br />
In <strong>the</strong> cold dark matter scenario, suggested by P. James E.<br />
Peebles <strong>of</strong> Princeton University and o<strong>the</strong>rs, <strong>the</strong> first structures to<br />
form were relatively small objects such as galaxies and pieces<br />
<strong>of</strong> galaxies. As time went on, gravity brought <strong>the</strong>se toge<strong>the</strong>r in<br />
ever larger structures. In this model, <strong>the</strong> Great Wall formed relatively<br />
recently. In <strong>the</strong> hot dark matter scenario, posited by<br />
Yakov B. Zel’dovich and his colleagues at Moscow State University,<br />
dark matter moved sufficiently quickly in <strong>the</strong> early universe<br />
to smooth out any clustering on small scales. The first<br />
things to form were large sheets and filaments tens or hundreds<br />
<strong>of</strong> millions <strong>of</strong> light-years in extent, which only later fragmented<br />
to form galaxies. In o<strong>the</strong>r words, <strong>the</strong> Great Wall is ancient.<br />
Thus, <strong>the</strong> next generation <strong>of</strong> surveys would not just test Einstein’s<br />
cosmological principle and identify <strong>the</strong> largest structures<br />
in <strong>the</strong> universe; it would also probe <strong>the</strong> nature <strong>of</strong> dark matter.<br />
One such survey was conducted from 1988 to 1994 by Stephen<br />
A. Shectman <strong>of</strong> <strong>the</strong> Carnegie Institution <strong>of</strong> Washington and his<br />
collaborators using <strong>the</strong> Las Campanas 2.5-meter telescope in<br />
Chile [see “Mapping <strong>the</strong> Universe,” by Stephen D. Landy; Scientific<br />
American, June 1999]. The survey contained 26,418<br />
galaxy redshifts and covered an appreciably larger volume than<br />
<strong>the</strong> original CfA survey. As team member Robert P. Kirshner<br />
<strong>of</strong> <strong>the</strong> CfA phrased it, <strong>the</strong> Las Campanas survey found “<strong>the</strong> end<br />
<strong>of</strong> greatness.” It revealed a galaxy distribution similar to that<br />
<strong>of</strong> <strong>the</strong> CfA survey but saw no structures much larger than <strong>the</strong><br />
Great Wall. Einstein’s cosmological principle appeared to hold:<br />
<strong>the</strong> cosmos is homogeneous and isotropic over vast distances.<br />
The Las Campanas survey was still not large enough to be<br />
definitive, however. It said nothing about what was happening<br />
in regions <strong>of</strong> space one to two billion light-years across. It<br />
is on <strong>the</strong>se largest scales that clustering is <strong>the</strong> easiest to interpret<br />
<strong>the</strong>oretically yet <strong>the</strong> hardest to measure observationally. The<br />
variations in galaxy numbers over such a volume are subtle, and<br />
it is easy to introduce errors into <strong>the</strong> sample; artifacts <strong>of</strong> <strong>the</strong> selection<br />
procedure might masquerade as clustering.<br />
56 S C I E N T I F I C A M E R I C A N F E B R U A R Y 2 0 0 4<br />
COPYRIGHT 2004 SCIENTIFIC AMERICAN, INC.
HOW TO SURVEY THE COSMOS IN FOUR NOT-SO-EASY STEPS<br />
THE SLOAN DIGITAL SKY SURVEY, <strong>the</strong> most advanced <strong>of</strong> <strong>the</strong> current generation <strong>of</strong> astronomical surveys, is compiling an atlas<br />
<strong>of</strong> a quarter <strong>of</strong> <strong>the</strong> sky. It will take five years, using a dedicated 2.5-meter telescope atop Apache Point in New Mexico.<br />
1<br />
2<br />
THE TELESCOPE operates in camera mode on clear nights, taking<br />
pictures through five color filters at <strong>the</strong> rate <strong>of</strong> 20 square degrees<br />
an hour—netting millions <strong>of</strong> celestial bodies per night.<br />
GALAXIES and o<strong>the</strong>r objects are identified by s<strong>of</strong>tware and<br />
selected for follow-up spectroscopy. The object shown here<br />
is <strong>the</strong> spiral galaxy UGC 03214 in <strong>the</strong> constellation Orion.<br />
3 1.0 4<br />
0.8<br />
Relative Flux<br />
0.6<br />
0.4<br />
0.2<br />
S D S S C O L L A B O R A T I O N<br />
OPTICAL FIBERS are plugged into a metal plate with 640 holes.<br />
Each fiber channels light from a celestial body to a spectrograph,<br />
which operates when <strong>the</strong> sky is not so clear.<br />
0<br />
400 600 800<br />
Wavelength (nanometers)<br />
THE SPECTRA THAT RESULT provide a precise way to classify<br />
objects. From <strong>the</strong>m, astronomers also determine <strong>the</strong><br />
redshifts, hence distances, <strong>of</strong> <strong>the</strong> objects.<br />
w w w . s c i a m . c o m S C I E N T I F I C A M E R I C A N 57<br />
COPYRIGHT 2004 SCIENTIFIC AMERICAN, INC.
COSMIC MAPS<br />
THESE WEDGE-SHAPED FIGURES show <strong>the</strong> distribution <strong>of</strong> galaxies (dots) in two volumes <strong>of</strong> space. The third<br />
dimension, which spans an angle <strong>of</strong> several degrees, has been flattened. The figures reveal two dramatic<br />
“Great Walls” containing thousands <strong>of</strong> galaxies each, as well as filaments and voids at all scales.<br />
Millions <strong>of</strong> Light-Years<br />
600 500 400 300 200 100<br />
MILKY WAY<br />
1,732 Galaxies<br />
REDSHIFT SURVEY by <strong>the</strong><br />
Harvard-Smithsonian Center<br />
for Astrophysics (CfA) in <strong>the</strong><br />
mid-1980s discovered <strong>the</strong> first<br />
Great Wall but was too limited<br />
to apprehend its full extent.<br />
9h<br />
16h<br />
CFA GREAT WALL<br />
1,200 1,100 1,000 900 800 700<br />
9h<br />
Millions <strong>of</strong> Light-Years<br />
10h<br />
10h<br />
SLOAN DIGITAL SKY SURVEY, which is<br />
now under way, covers a much larger<br />
volume. It found ano<strong>the</strong>r Great Wall<br />
more than one billion light-years<br />
long. The region shown above is<br />
about 1 percent <strong>of</strong> <strong>the</strong> full Sloan<br />
volume. The bull’s-eye diagram<br />
(right) covers a volume six times as<br />
large; <strong>the</strong> outline indicates <strong>the</strong><br />
location <strong>of</strong> <strong>the</strong> above wedge. The<br />
concentric circles indicate distance<br />
in millions <strong>of</strong> light-years.<br />
11h<br />
11h<br />
12h<br />
13h<br />
14h<br />
Location in Sky<br />
(right ascension, in hours)<br />
12h<br />
12h<br />
10h<br />
14h<br />
15h<br />
8h<br />
16h<br />
11,246 Galaxies<br />
13h<br />
14h<br />
SLOAN GREAT WALL<br />
6h<br />
4h<br />
2,000<br />
1,500<br />
2h<br />
1,000<br />
500<br />
0h<br />
22h<br />
20h<br />
18h<br />
52,561 Galaxies<br />
B R Y A N C H R I S T I E D E S I G N ; S O U R C E S : J . R I C H A R D G O T T A N D M A R I O J U R I C P r i n c e t o n U n i v e r s i t y ( w e d g e ) ; S D S S C O L L A B O R A T I O N ( b u l l ’ s - e y e )<br />
58 S C I E N T I F I C A M E R I C A N F E B R U A R Y 2 0 0 4<br />
COPYRIGHT 2004 SCIENTIFIC AMERICAN, INC.
OVERALL DISTRIBUTION OF COSMIC STRUCTURE<br />
THE MAPS produced by galaxy<br />
surveys can be boiled down to a<br />
power spectrum, which shows <strong>the</strong><br />
fractional density variation (vertical<br />
axis) from one position to ano<strong>the</strong>r in<br />
regions <strong>of</strong> different sizes (horizontal<br />
axis). O<strong>the</strong>r data—cosmic microwave<br />
background, gravitational lensing,<br />
galaxy-cluster surveys, hydrogen<br />
gas clouds—can be plotted in <strong>the</strong><br />
same way. They follow <strong>the</strong> same<br />
universal curve (solid line).<br />
The relative fluctuations approach<br />
zero, substantiating Einstein’s<br />
cosmological principle. The arrows<br />
represent upper limits.<br />
Relative Strength <strong>of</strong> Density Fluctuations<br />
10<br />
1.0<br />
0.1<br />
0.01<br />
0.001<br />
Gravitational<br />
lensing<br />
Intergalactic gas clumping<br />
Cluster abundance<br />
Galaxy clumping<br />
Cosmic<br />
microwave<br />
background<br />
0.0001<br />
10 100 1,000<br />
10,000 100,000<br />
Scale (millions <strong>of</strong> light-years)<br />
B R Y A N C H R I S T I E D E S I G N ; S O U R C E : S L O A N D I G I T A L S K Y S U R V E Y<br />
Astronomers, for example, typically choose all galaxies<br />
brighter than a certain value to be included in a given redshift<br />
survey. If <strong>the</strong>y overestimate galaxy brightnesses in one part <strong>of</strong><br />
<strong>the</strong> sky, <strong>the</strong> sample will have too many galaxies in that region,<br />
yielding a false measurement <strong>of</strong> clustering. Thus, a definitive<br />
redshift survey must not only cover a huge volume, it must be<br />
exquisitely calibrated.<br />
On a Clear Night. . .<br />
IN THE LATE 1980S James E. Gunn <strong>of</strong> Princeton, Richard<br />
G. Kron and Donald G. York <strong>of</strong> <strong>the</strong> University <strong>of</strong> Chicago and<br />
o<strong>the</strong>rs began a collaboration to do <strong>the</strong> problem right. That is,<br />
<strong>the</strong>y sought to measure <strong>the</strong> distribution <strong>of</strong> galaxies in <strong>the</strong> largest<br />
volume to date, with careful control <strong>of</strong> calibration. About a<br />
decade later <strong>the</strong> Sloan Digital Sky Survey, an $80-million, 200-<br />
astronomer collaboration, started operation. The SDSS features<br />
a special-purpose telescope with a 2.5-meter-wide primary mirror.<br />
The telescope operates in two modes. On <strong>the</strong> most pristine<br />
nights, it uses a wide-field camera to take carefully calibrated<br />
pictures <strong>of</strong> <strong>the</strong> night sky in five broad wavebands. The camera<br />
uses CCDs, highly sensitive electronic detectors whose response<br />
can be calibrated with an accuracy <strong>of</strong> 1 percent.<br />
On nights with moonshine or mild cloud cover, <strong>the</strong> telescope<br />
instead uses a pair <strong>of</strong> spectrographs to obtain spectra, and<br />
<strong>the</strong>refore redshifts, <strong>of</strong> 608 objects at a time. For reference, <strong>the</strong><br />
device also takes spectra <strong>of</strong> 32 blank patches <strong>of</strong> sky. Unlike traditional<br />
telescopes, for which nights are parceled out among<br />
many scientific programs, this telescope is devoted solely to <strong>the</strong><br />
survey, every night for five years. The project is now approaching<br />
<strong>the</strong> halfway point in its goal <strong>of</strong> measuring one million<br />
galaxy and quasar redshifts. As a midterm report, my colleagues<br />
and I recently completed an analysis <strong>of</strong> <strong>the</strong> first 200,000<br />
galaxies with redshifts.<br />
In a parallel effort, a team <strong>of</strong> Australian and British astronomers<br />
built a spectrograph for <strong>the</strong> 3.9-meter Anglo-Australian<br />
Telescope, capable <strong>of</strong> measuring <strong>the</strong> spectra <strong>of</strong> 400 objects<br />
at a time over a field <strong>of</strong> view two degrees on a side (thus<br />
earning <strong>the</strong> name “Two Degree Field,” or 2dF). The 2dF team<br />
worked from galaxy catalogues drawn from carefully calibrated<br />
and electronically scanned photographic atlases that were<br />
already available. Now complete, <strong>the</strong> survey measured <strong>the</strong> redshifts<br />
<strong>of</strong> 221,414 galaxies over a period <strong>of</strong> five years.<br />
Our surveys describe <strong>the</strong> distribution <strong>of</strong> galaxies. They do<br />
not see dark matter, which constitutes <strong>the</strong> bulk <strong>of</strong> <strong>the</strong> mass <strong>of</strong><br />
<strong>the</strong> universe. Researchers have no reason to assume that <strong>the</strong> distribution<br />
<strong>of</strong> galaxies is <strong>the</strong> same as <strong>the</strong> distribution <strong>of</strong> dark matter.<br />
For example, galaxies might tend to form only in regions<br />
that contain an above-average density <strong>of</strong> dark matter—a scenario<br />
astronomers refer to as biasing.<br />
By analyzing previous generations <strong>of</strong> redshift surveys, my<br />
colleagues and I had shown that <strong>the</strong> galaxy and dark matter distributions<br />
were closely related, but we were unable to distinguish<br />
between simple models <strong>of</strong> bias and <strong>the</strong> unbiased case.<br />
More recently Licia Verde <strong>of</strong> <strong>the</strong> University <strong>of</strong> Pennsylvania and<br />
her colleagues used <strong>the</strong> 2dF galaxy redshift survey to measure<br />
triplets <strong>of</strong> galaxies. It turns out that <strong>the</strong> number <strong>of</strong> <strong>the</strong>se trios<br />
T H E A U T H O R<br />
MICHAEL A. STRAUSS is deputy project scientist and project spokesperson<br />
for <strong>the</strong> Sloan Digital Sky Survey, an effort to make a complete<br />
map <strong>of</strong> a quarter <strong>of</strong> <strong>the</strong> sky. He received a Ph.D. in physics from <strong>the</strong><br />
University <strong>of</strong> California, Berkeley, did postdoctoral work at <strong>the</strong> California<br />
Institute <strong>of</strong> Technology and at <strong>the</strong> Institute for Advanced Study<br />
in Princeton, N.J., and now holds a faculty position at Princeton University.<br />
He thanks his Sloan project colleagues for a fabulous data set.<br />
Strauss was featured in <strong>the</strong> September 2002 issue <strong>of</strong> New Jersey<br />
Monthly as having one <strong>of</strong> <strong>the</strong> best jobs in <strong>the</strong> state <strong>of</strong> New Jersey.<br />
w w w . s c i a m . c o m S C I E N T I F I C A M E R I C A N 59<br />
COPYRIGHT 2004 SCIENTIFIC AMERICAN, INC.
BUILDING A UNIVERSE<br />
TO CONNECT THE CLUMPING <strong>of</strong> matter today (revealed by Sloan and o<strong>the</strong>r mapping projects) with <strong>the</strong> clumping <strong>of</strong> matter in <strong>the</strong> early<br />
universe (revealed by observations <strong>of</strong> <strong>the</strong> cosmic microwave background radiation, or CMB), cosmologists run computer<br />
simulations. Each frame is a snapshot at a time after <strong>the</strong> onset <strong>of</strong> <strong>the</strong> big bang expansion. Because <strong>the</strong> universe is expanding, <strong>the</strong><br />
frames are not to scale: <strong>the</strong> first one is about five million light-years across, <strong>the</strong> last one about 140 million light-years across. Dots<br />
represent matter. The simulation was performed at <strong>the</strong> National Center for Supercomputer Applications (<strong>the</strong> full movie is available<br />
at cfcp.uchicago.edu/lss/filaments.html).<br />
120 MILLION YEARS: Early on, matter was spread out in a<br />
nearly uniform sea with subtle undulations.<br />
490 MILLION YEARS: Dense regions gained material at <strong>the</strong><br />
expense <strong>of</strong> less dense ones. The first galaxies formed.<br />
1.2 BILLION YEARS: Over time, gravity pulled matter into vast<br />
filaments and emptied <strong>the</strong> intervening voids.<br />
depends on <strong>the</strong> total mass, dark matter included. The researchers<br />
found that <strong>the</strong> galaxy distribution is essentially unbiased:<br />
<strong>the</strong> density field <strong>of</strong> galaxies is <strong>the</strong> same as that <strong>of</strong> <strong>the</strong><br />
dark matter, which means that <strong>the</strong> galaxy surveys accurately<br />
reflect <strong>the</strong> overall arrangement <strong>of</strong> matter in <strong>the</strong> cosmos.<br />
The Power <strong>of</strong> <strong>the</strong> Power Spectrum<br />
WITH THIS C A V E A T ADDRESSED, cosmologists can interpret<br />
<strong>the</strong> galaxy maps. Among <strong>the</strong> most useful statistical tools<br />
13.7 BILLION YEARS (TODAY): The growth <strong>of</strong> large structures has<br />
ceased because cosmic acceleration counteracts clumping.<br />
to describe galaxy clustering is <strong>the</strong> power spectrum. Imagine<br />
placing a series <strong>of</strong> spheres <strong>of</strong> a given radius (say, 40 million<br />
light-years) at random in <strong>the</strong> universe and counting <strong>the</strong> number<br />
<strong>of</strong> galaxies in each one. Because galaxies are clustered, that<br />
number will vary substantially from one sphere to ano<strong>the</strong>r. The<br />
variation in <strong>the</strong> number <strong>of</strong> galaxies is a measure <strong>of</strong> <strong>the</strong> lumpiness<br />
<strong>of</strong> <strong>the</strong> galaxy distribution on a scale, in this case, <strong>of</strong> 40 million<br />
light-years. Cosmologists repeat <strong>the</strong> exercise with spheres<br />
<strong>of</strong> various radii to measure this lumpiness at different scales.<br />
A N D R E Y K R A V T S O V U n i v e r s i t y o f C h i c a g o A N D A N A T O L Y K L Y P I N N e w M e x i c o S t a t e U n i v e r s i t y<br />
60 S C I E N T I F I C A M E R I C A N F E B R U A R Y 2 0 0 4<br />
COPYRIGHT 2004 SCIENTIFIC AMERICAN, INC.
An analogy is to express a complex sound in terms <strong>of</strong> <strong>the</strong><br />
contributions from sound waves <strong>of</strong> different wavelengths. A<br />
graphic equalizer on a home audio system can perform this<br />
function: it shows how loud <strong>the</strong> deep bass notes (<strong>of</strong> very long<br />
wavelength) are, how loud <strong>the</strong> treble (<strong>of</strong> shorter wavelength)<br />
is, and so on. In a live concert, a person with a musically trained<br />
ear can easily pick out <strong>the</strong> piccolo from <strong>the</strong> bassoon. Cosmologists<br />
do <strong>the</strong> same thing with <strong>the</strong> distribution <strong>of</strong> galaxies. The<br />
relative amount <strong>of</strong> structure on large and small scales is a powerful<br />
cosmological probe.<br />
The power spectrum has been measured by both <strong>the</strong> 2dF<br />
and Sloan teams, with consistent results. The first thing to note<br />
is that <strong>the</strong> fluctuations are weaker as one proceeds to larger<br />
scales [see illustration on page 59]. Weak fluctuations mean<br />
that <strong>the</strong> galaxy distribution is very close to homogeneous, exactly<br />
as Einstein’s cosmological principle requires.<br />
Second, <strong>the</strong> power spectrum, when plotted on a logarithmic<br />
scale, does not follow a straight line. The deviation from<br />
straightness is confirmation that <strong>the</strong> dynamics <strong>of</strong> <strong>the</strong> universe<br />
have changed with time. From o<strong>the</strong>r observations, astronomers<br />
have concluded that <strong>the</strong> energy density <strong>of</strong> <strong>the</strong> universe is dominated<br />
by matter and a mysterious component known as dark<br />
energy. Photons, <strong>the</strong>ir energy sapped by cosmic expansion, are<br />
negligible. Extrapolating backward in time, however, photons<br />
dominated when <strong>the</strong> universe was less than 75,000 years old.<br />
When photons ruled, gravity did not cause fluctuations to grow<br />
with time <strong>the</strong> same way <strong>the</strong>y do today. That, in turn, caused <strong>the</strong><br />
power spectrum to behave differently on <strong>the</strong> largest scales<br />
(more than about 1.2 billion light-years).<br />
The exact scale <strong>of</strong> this deviation provides a measure <strong>of</strong> <strong>the</strong><br />
total density <strong>of</strong> matter in <strong>the</strong> universe, and <strong>the</strong> result—roughly<br />
2.5 × 10 −27 kilogram per cubic meter <strong>of</strong> space—agrees with<br />
<strong>the</strong> value from o<strong>the</strong>r measurements. Finally, <strong>the</strong> combination<br />
<strong>of</strong> <strong>the</strong>se results strongly suggests that <strong>the</strong> dark matter is all <strong>of</strong><br />
<strong>the</strong> cold variety. Hot dark matter would smooth out <strong>the</strong> fluctuations<br />
in <strong>the</strong> galaxy distribution on smaller scales, and that<br />
is not seen.<br />
The fluctuations we observed in <strong>the</strong> galaxy distribution on<br />
large scales should simply be an amplified version <strong>of</strong> those <strong>of</strong><br />
<strong>the</strong> early universe. These early fluctuations are apparent directly<br />
in <strong>the</strong> CMB, so we can directly compare <strong>the</strong> CMB and galaxy<br />
power spectra. Amazingly, we get consistent answers from<br />
<strong>the</strong>se two approaches. On scales approaching one billion lightyears,<br />
<strong>the</strong> galaxy density fluctuates by about one part in 10. The<br />
CMB reveals fluctuations <strong>of</strong> one part in 100,000, which, when<br />
extrapolated to <strong>the</strong> present, are in beautiful agreement. This<br />
gives us confidence that our cosmological picture—big bang,<br />
gravitational instability and all—is actually correct.<br />
The Future <strong>of</strong> Large-Scale Structure Studies<br />
T HE M AIN S D S S G A LAXY S URVEY probes <strong>the</strong> structure <strong>of</strong><br />
<strong>the</strong> cosmos on scales from 100 million to more than one billion<br />
light-years. To probe yet larger scales, SDSS has a second, auxiliary<br />
sample <strong>of</strong> extremely luminous galaxies that extends more<br />
than five billion light-years away. For smaller scales, a third<br />
sample looks at absorption lines in <strong>the</strong> spectra <strong>of</strong> distant<br />
quasars, whose light passes through a dense network <strong>of</strong> clouds<br />
<strong>of</strong> hydrogen gas not yet formed into galaxies.<br />
With <strong>the</strong>se data, cosmologists are working to make an even<br />
tighter connection between cosmic structures (seen today and<br />
<strong>the</strong> not so distant past) and <strong>the</strong> CMB (which probes cosmic<br />
structures in <strong>the</strong> very early universe). In particular, <strong>the</strong> power<br />
spectrum <strong>of</strong> <strong>the</strong> microwave background shows a series <strong>of</strong> distinctive<br />
bumps, which reflect <strong>the</strong> relative amounts <strong>of</strong> dark and<br />
ordinary matter. Researchers hope to find <strong>the</strong> equivalent bumps<br />
in <strong>the</strong> present-day power spectrum. If <strong>the</strong>y do, it will be fur<strong>the</strong>r<br />
confirmation that <strong>the</strong> fluctuations observed today evolved directly<br />
from those seen in <strong>the</strong> early universe.<br />
Ano<strong>the</strong>r way to trace <strong>the</strong> development <strong>of</strong> structures over<br />
time is to probe <strong>the</strong> distribution <strong>of</strong> more distant galaxies—looking<br />
to great distances is looking back in time. The dark matter<br />
at those early times should be weakly clustered because gravitational<br />
instability had not yet had as much time to operate. But<br />
surveys carried out with <strong>the</strong> European Sou<strong>the</strong>rn Observatory’s<br />
Very Large Telescope in Chile and <strong>the</strong> Keck Observatory in<br />
Hawaii show that tremendously distant galaxies are just as clustered<br />
as today and are arranged in <strong>the</strong> same filamentary, bubbly<br />
structures that nearby galaxies are. This is odd. Unlike today’s<br />
galaxies, which follow <strong>the</strong> dark matter, <strong>the</strong>se early galaxies<br />
must be much more strongly clustered than <strong>the</strong> underlying<br />
dark matter is. This pattern is an important clue to how galaxies<br />
formed.<br />
Researchers are close to a complete understanding <strong>of</strong> <strong>the</strong> development<br />
<strong>of</strong> <strong>the</strong> structure <strong>of</strong> <strong>the</strong> cosmos, from undulations in<br />
<strong>the</strong> primordial plasma to <strong>the</strong> bright galaxy clusters <strong>of</strong> <strong>the</strong> modern<br />
universe. That said, <strong>the</strong>ir work is cut out for <strong>the</strong>m in <strong>the</strong><br />
coming years. What exactly is <strong>the</strong> mechanism that gave rise to<br />
<strong>the</strong> initial fluctuations in <strong>the</strong> microwave background? How exactly<br />
did <strong>the</strong> galaxies form? Why do <strong>the</strong>y have <strong>the</strong> properties<br />
that <strong>the</strong>y do? And could it have been any o<strong>the</strong>r way—could one<br />
imagine a universe with fluctuations that started out with much<br />
higher or lower amplitudes? These are among <strong>the</strong> big questions<br />
that perhaps a high school or college student reading this article<br />
will be inspired to tackle.<br />
M O R E T O E X P L O R E<br />
Cosmological Physics. John A. Peacock. Cambridge University Press, 1998.<br />
Cosmology: The Science <strong>of</strong> <strong>the</strong> Universe. Second edition.<br />
Edward Harrison. Cambridge University Press, 2000.<br />
The 2dF Galaxy Redshift Survey: The Power Spectrum and <strong>the</strong> Matter<br />
Content <strong>of</strong> <strong>the</strong> Universe. Will J. Percival et al. in Monthly Notices <strong>of</strong> <strong>the</strong><br />
Royal Astronomical Society, Vol. 327, No. 4, pages 1297–1306;<br />
November 2001. Available online at arXiv.org/abs/astro-ph/0105252<br />
From Here to Eternity. Valerie Jamieson in New Scientist, Vol. 180, No.<br />
2422, pages 36–39; November 22, 2003. The centerfold map is also<br />
available at www.astro.princeton.edu/~mjuric/universe/<br />
The Three-Dimensional Power Spectrum <strong>of</strong> Galaxies from <strong>the</strong> Sloan<br />
Digital Sky Survey. Max Tegmark et al. in Astrophysical Journal<br />
(in press). arXiv.org/abs/astro-ph/0310725<br />
The <strong>of</strong>ficial Web site <strong>of</strong> <strong>the</strong> Sloan Digital Sky Survey is www.sdss.org<br />
The <strong>of</strong>ficial Web site <strong>of</strong> <strong>the</strong> 2d F Galaxy Redshift Survey is<br />
msowww.anu.edu.au/2dFGRS<br />
w w w . s c i a m . c o m S C I E N T I F I C A M E R I C A N 61<br />
COPYRIGHT 2004 SCIENTIFIC AMERICAN, INC.


