Diffuse optical measurement of blood flow in breast tumors
Diffuse optical measurement of blood flow in breast tumors
Diffuse optical measurement of blood flow in breast tumors

You also want an ePaper? Increase the reach of your titles
YUMPU automatically turns print PDFs into web optimized ePapers that Google loves.
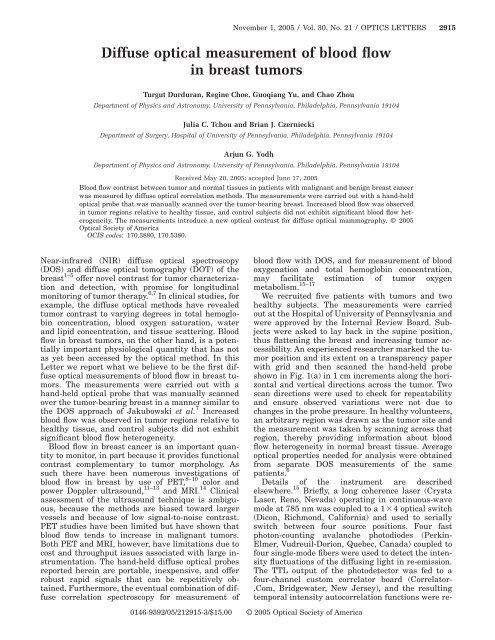
November 1, 2005 / Vol. 30, No. 21 / OPTICS LETTERS 2915<br />
<strong>Diffuse</strong> <strong>optical</strong> <strong>measurement</strong> <strong>of</strong> <strong>blood</strong> <strong>flow</strong><br />
<strong>in</strong> <strong>breast</strong> <strong>tumors</strong><br />
Turgut Durduran, Reg<strong>in</strong>e Choe, Guoqiang Yu, and Chao Zhou<br />
Department <strong>of</strong> Physics and Astronomy, University <strong>of</strong> Pennsylvania, Philadelphia, Pennsylvania 19104<br />
Julia C. Tchou and Brian J. Czerniecki<br />
Department <strong>of</strong> Surgery, Hospital <strong>of</strong> University <strong>of</strong> Pennsylvania, Philadelphia, Pennsylvania 19104<br />
Arjun G. Yodh<br />
Department <strong>of</strong> Physics and Astronomy, University <strong>of</strong> Pennsylvania, Philadelphia, Pennsylvania 19104<br />
Received May 20, 2005; accepted June 17, 2005<br />
Blood <strong>flow</strong> contrast between tumor and normal tissues <strong>in</strong> patients with malignant and benign <strong>breast</strong> cancer<br />
was measured by diffuse <strong>optical</strong> correlation methods. The <strong>measurement</strong>s were carried out with a hand-held<br />
<strong>optical</strong> probe that was manually scanned over the tumor-bear<strong>in</strong>g <strong>breast</strong>. Increased <strong>blood</strong> <strong>flow</strong> was observed<br />
<strong>in</strong> tumor regions relative to healthy tissue, and control subjects did not exhibit significant <strong>blood</strong> <strong>flow</strong> heterogeneity.<br />
The <strong>measurement</strong>s <strong>in</strong>troduce a new <strong>optical</strong> contrast for diffuse <strong>optical</strong> mammography. © 2005<br />
Optical Society <strong>of</strong> America<br />
OCIS codes: 170.3880, 170.5380.<br />
Near-<strong>in</strong>frared (NIR) diffuse <strong>optical</strong> spectroscopy<br />
(DOS) and diffuse <strong>optical</strong> tomography (DOT) <strong>of</strong> the<br />
<strong>breast</strong> 1–5 <strong>of</strong>fer novel contrast for tumor characterization<br />
and detection, with promise for longitud<strong>in</strong>al<br />
monitor<strong>in</strong>g <strong>of</strong> tumor therapy. 6,7 In cl<strong>in</strong>ical studies, for<br />
example, the diffuse <strong>optical</strong> methods have revealed<br />
tumor contrast to vary<strong>in</strong>g degrees <strong>in</strong> total hemoglob<strong>in</strong><br />
concentration, <strong>blood</strong> oxygen saturation, water<br />
and lipid concentration, and tissue scatter<strong>in</strong>g. Blood<br />
<strong>flow</strong> <strong>in</strong> <strong>breast</strong> <strong>tumors</strong>, on the other hand, is a potentially<br />
important physiological quantity that has not<br />
as yet been accessed by the <strong>optical</strong> method. In this<br />
Letter we report what we believe to be the first diffuse<br />
<strong>optical</strong> <strong>measurement</strong>s <strong>of</strong> <strong>blood</strong> <strong>flow</strong> <strong>in</strong> <strong>breast</strong> <strong>tumors</strong>.<br />
The <strong>measurement</strong>s were carried out with a<br />
hand-held <strong>optical</strong> probe that was manually scanned<br />
over the tumor-bear<strong>in</strong>g <strong>breast</strong> <strong>in</strong> a manner similar to<br />
the DOS approach <strong>of</strong> Jakubowski et al. 7 Increased<br />
<strong>blood</strong> <strong>flow</strong> was observed <strong>in</strong> tumor regions relative to<br />
healthy tissue, and control subjects did not exhibit<br />
significant <strong>blood</strong> <strong>flow</strong> heterogeneity.<br />
Blood <strong>flow</strong> <strong>in</strong> <strong>breast</strong> cancer is an important quantity<br />
to monitor, <strong>in</strong> part because it provides functional<br />
contrast complementary to tumor morphology. As<br />
such there have been numerous <strong>in</strong>vestigations <strong>of</strong><br />
<strong>blood</strong> <strong>flow</strong> <strong>in</strong> <strong>breast</strong> by use <strong>of</strong> PET, 8–10 color and<br />
power Doppler ultrasound, 11–13 and MRI. 14 Cl<strong>in</strong>ical<br />
assessment <strong>of</strong> the ultrasound technique is ambiguous,<br />
because the methods are biased toward larger<br />
vessels and because <strong>of</strong> low signal-to-noise contrast.<br />
PET studies have been limited but have shown that<br />
<strong>blood</strong> <strong>flow</strong> tends to <strong>in</strong>crease <strong>in</strong> malignant <strong>tumors</strong>.<br />
Both PET and MRI, however, have limitations due to<br />
cost and throughput issues associated with large <strong>in</strong>strumentation.<br />
The hand-held diffuse <strong>optical</strong> probes<br />
reported here<strong>in</strong> are portable, <strong>in</strong>expensive, and <strong>of</strong>fer<br />
robust rapid signals that can be repetitively obta<strong>in</strong>ed.<br />
Furthermore, the eventual comb<strong>in</strong>ation <strong>of</strong> diffuse<br />
correlation spectroscopy for <strong>measurement</strong> <strong>of</strong><br />
<strong>blood</strong> <strong>flow</strong> with DOS, and for <strong>measurement</strong> <strong>of</strong> <strong>blood</strong><br />
oxygenation and total hemoglob<strong>in</strong> concentration,<br />
may facilitate estimation <strong>of</strong> tumor oxygen<br />
metabolism. 15–17<br />
We recruited five patients with <strong>tumors</strong> and two<br />
healthy subjects. The <strong>measurement</strong>s were carried<br />
out at the Hospital <strong>of</strong> University <strong>of</strong> Pennsylvania and<br />
were approved by the Internal Review Board. Subjects<br />
were asked to lay back <strong>in</strong> the sup<strong>in</strong>e position,<br />
thus flatten<strong>in</strong>g the <strong>breast</strong> and <strong>in</strong>creas<strong>in</strong>g tumor accessibility.<br />
An experienced researcher marked the tumor<br />
position and its extent on a transparency paper<br />
with grid and then scanned the hand-held probe<br />
shown <strong>in</strong> Fig. 1(a) <strong>in</strong> 1 cm <strong>in</strong>crements along the horizontal<br />
and vertical directions across the tumor. Two<br />
scan directions were used to check for repeatability<br />
and ensure observed variations were not due to<br />
changes <strong>in</strong> the probe pressure. In healthy volunteers,<br />
an arbitrary region was drawn as the tumor site and<br />
the <strong>measurement</strong> was taken by scann<strong>in</strong>g across that<br />
region, thereby provid<strong>in</strong>g <strong>in</strong>formation about <strong>blood</strong><br />
<strong>flow</strong> heterogeneity <strong>in</strong> normal <strong>breast</strong> tissue. Average<br />
<strong>optical</strong> properties needed for analysis were obta<strong>in</strong>ed<br />
from separate DOS <strong>measurement</strong>s <strong>of</strong> the same<br />
patients. 6<br />
Details <strong>of</strong> the <strong>in</strong>strument are described<br />
elsewhere. 15 Briefly, a long coherence laser (Crysta<br />
Laser, Reno, Nevada) operat<strong>in</strong>g <strong>in</strong> cont<strong>in</strong>uous-wave<br />
mode at 785 nm was coupled to a 14 <strong>optical</strong> switch<br />
(Dicon, Richmond, California) and used to serially<br />
switch between four source positions. Four fast<br />
photon-count<strong>in</strong>g avalanche photodiodes (Perk<strong>in</strong>-<br />
Elmer, Vudreuil-Dorion, Quebec, Canada) coupled to<br />
four s<strong>in</strong>gle-mode fibers were used to detect the <strong>in</strong>tensity<br />
fluctuations <strong>of</strong> the diffus<strong>in</strong>g light <strong>in</strong> re-emission.<br />
The TTL output <strong>of</strong> the photodetector was fed to a<br />
four-channel custom correlator board (Correlator-<br />
.Com, Bridgewater, New Jersey), and the result<strong>in</strong>g<br />
temporal <strong>in</strong>tensity autocorrelation functions were re-<br />
0146-9592/05/212915-3/$15.00 © 2005 Optical Society <strong>of</strong> America
2916 OPTICS LETTERS / Vol. 30, No. 21 / November 1, 2005<br />
To compare the <strong>blood</strong> <strong>flow</strong> changes across tumor<br />
types, we tabulated the mean (±standard deviation)<br />
rBF with<strong>in</strong> the estimated tumor region. Table 1<br />
shows the distribution <strong>of</strong> rBF values for all subjects.<br />
Three groups are apparent from the data: (1) a group<br />
with very little heterogeneity, i.e., the healthy<br />
<strong>breast</strong>s (2.7% variation); (2) a group where<strong>in</strong> <strong>blood</strong><br />
<strong>flow</strong> <strong>in</strong>creased to 230% <strong>of</strong> healthy tissue, i.e., malignant<br />
<strong>tumors</strong>; and (3) a group where<strong>in</strong> a moderate <strong>in</strong>crease<br />
to 153% over healthy tissue is observed, i.e.,<br />
benign <strong>tumors</strong>. The contributions <strong>of</strong> normal tissue,<br />
located between the tumor and the tissue surface, to<br />
the signals can lead to underestimates <strong>of</strong> the contrast.<br />
In the future it should be possible to separate<br />
the contributions <strong>of</strong> superficial layers from underly<strong>in</strong>g<br />
tumor tissues and thus improve contrast. Although<br />
the power <strong>of</strong> the statistics <strong>of</strong> this study is not<br />
enough to conclusively claim differentiation, we note<br />
that these results are <strong>in</strong> qualitative agreement with<br />
previous Doppler ultrasound and PET results, 8–13<br />
Fig. 1. (a) Hand-held probe with four source–detector<br />
pairs scanned horizontally and vertically <strong>in</strong> 1 cm <strong>in</strong>crements<br />
spann<strong>in</strong>g the estimated tumor region as well as the<br />
surround<strong>in</strong>g healthy tissue. (b) Temporal autocorrelation<br />
curves measured <strong>in</strong> the tumor (dark) and healthy (light)<br />
tissues <strong>of</strong> a patient. Faster decay corresponds to <strong>in</strong>creased<br />
<strong>blood</strong> <strong>flow</strong>.<br />
corded by a computer. A complete set <strong>of</strong> data was acquired<br />
every 6 s, and five such sets were acquired at<br />
each position. For this study, the four source–detector<br />
positions directly across from one another (i.e., with<br />
separation <strong>of</strong> 2.5 cm) were used at each scan position.<br />
The resultant autocorrelation functions were then<br />
fitted to a solution <strong>of</strong> the correlation diffusion<br />
equation 15,18–20 to derive an <strong>in</strong>dex proportional to the<br />
tissue <strong>blood</strong> <strong>flow</strong>. In particular, the temporal decay<br />
rate <strong>of</strong> the autocorrelation function is quantitatively<br />
related to the motions <strong>of</strong> <strong>blood</strong> cells <strong>in</strong> underly<strong>in</strong>g tissues.<br />
Tissue <strong>blood</strong> <strong>flow</strong>, derived from these effective<br />
decay rates were normalized to the mean value <strong>of</strong> the<br />
<strong>measurement</strong>s <strong>of</strong> healthy tissue, and its standard deviation<br />
reported as the error bar. We therefore report<br />
the averaged relative <strong>blood</strong> <strong>flow</strong> (% rBF) at each position.<br />
Figure 1(b) shows two autocorrelation curves from<br />
one patient. When <strong>blood</strong> <strong>flow</strong> <strong>in</strong>creases, the temporal<br />
autocorrelation function decays more rapidly, reflect<strong>in</strong>g<br />
the fact that <strong>blood</strong> <strong>flow</strong> is larger <strong>in</strong> the tumor region.<br />
Figure 2 shows horizontal and vertical pr<strong>of</strong>iles<br />
from one malignant tumor and one healthy <strong>breast</strong>.<br />
Very little variation is observable <strong>in</strong> healthy <strong>breast</strong>.<br />
However, the <strong>blood</strong> <strong>flow</strong> clearly <strong>in</strong>creased <strong>in</strong> both<br />
scan directions as the probe crossed over the tumor.<br />
Furthermore, dur<strong>in</strong>g acquisition, utmost care was<br />
taken to apply pressure evenly at each position on<br />
the tissue m<strong>in</strong>imiz<strong>in</strong>g compression artifacts. Thus,<br />
the observed contrast is very likely due to the tumor<br />
and not the natural heterogeneity <strong>of</strong> the <strong>breast</strong>.<br />
Fig. 2. Relative <strong>blood</strong> <strong>flow</strong> (rBF) scans from one patient<br />
with a malignant tumor and a healthy volunteer are shown<br />
for (a) horizontal and (b) vertical scans. Probe position is<br />
<strong>in</strong>dicated relative to the expected tumor center.<br />
Table 1. Tabulation <strong>of</strong> Relative Blood Flow (rBF)<br />
Measured <strong>in</strong> the Estimated Tumor Regions from all<br />
Subjects a<br />
ID rBF ±std Type<br />
1 100.5±13.4 Healthy<br />
2 105±86 Healthy<br />
3 144±21 Benign, calcification<br />
4 163±26 Benign, calcification<br />
5 184±16 Malignant<br />
6 212±98 Malignant<br />
7 298±51 Malignant<br />
a Subjects are grouped as healthy and with benign or malignant<br />
disease.
November 1, 2005 / Vol. 30, No. 21 / OPTICS LETTERS 2917<br />
where<strong>in</strong> 470–550% <strong>in</strong>creases <strong>in</strong> <strong>blood</strong> <strong>flow</strong> were reported<br />
<strong>in</strong> malignant <strong>tumors</strong> with smaller contrast <strong>in</strong><br />
benign cases. In studies with larger populations,<br />
<strong>blood</strong> <strong>flow</strong> <strong>in</strong>dices were used to differentiate up to<br />
n<strong>in</strong>e different types <strong>of</strong> <strong>breast</strong> diseases. 11<br />
These f<strong>in</strong>d<strong>in</strong>gs clearly demonstrate robust <strong>optical</strong><br />
detection <strong>of</strong> <strong>blood</strong> <strong>flow</strong> changes <strong>in</strong> <strong>tumors</strong>. Further<br />
studies with more source–detector pairs are now underway<br />
to analyze potential partial volume effects<br />
that may <strong>in</strong>fluence our results. The palpable <strong>tumors</strong><br />
are relatively superficial (1 cm deep, 2 cm diameter)<br />
and previous <strong>optical</strong> studies 7 have shown that<br />
source–detector separations <strong>of</strong> 2.5 cm can probe<br />
these <strong>tumors</strong> <strong>in</strong> a repeatable manner. In the future,<br />
we will acquire data with a hybrid <strong>in</strong>strument 15 that<br />
measures changes <strong>in</strong> <strong>blood</strong> oxygenation, total hemoglob<strong>in</strong><br />
concentration and <strong>blood</strong> <strong>flow</strong> simultaneously<br />
and thus provides access to changes <strong>in</strong> tumor oxygen<br />
metabolism. These <strong>in</strong>struments are assembled on<br />
small cl<strong>in</strong>ical carts, and the study time is relatively<br />
short 10 m<strong>in</strong>. Therefore, it is feasible to acquire<br />
data at each patient visit <strong>in</strong> the triage area. We anticipate<br />
these methods will be cl<strong>in</strong>ically useful for<br />
therapy monitor<strong>in</strong>g, for dose adjustment, and potentially<br />
for assess<strong>in</strong>g efficacy <strong>of</strong> therapy.<br />
We acknowledge support from NIH grants<br />
CA75124-04 and HL-077699-01, help from M.<br />
Grosicka-Koptyra for patient recruitment, and useful<br />
discussions with B. Chance and B. J. Tromberg.<br />
T. Durduran’s e-mail address is durduran<br />
@stw<strong>in</strong>g.upenn.edu.<br />
References<br />
1. B. W. Pogue, S. P. Poplack, T. O. McBride, W. A. Wells,<br />
K. S. Osterman, U. L. Osterberg, and K. D. Paulsen,<br />
Radiology 218, 261 (2001).<br />
2. H. B. Jiang, N. V. Iftimia, Y. Xu, J. A. Eggert, L. L.<br />
Fajardo, and K. L. Klove, Acad. Radiol. 9, 186 (2002).<br />
3. Q. I. Zhu, M. M. Huang, N. G. Chen, K. Zarfos, B.<br />
Jagjivan, M. Kane, P. Hedge, and S. H. Kurtzman,<br />
Neoplasia 5, 379 (2003).<br />
4. D. Grosenick, H. Wabnitz, K. T. Moesta, J. Mucke, M.<br />
Moller, C. Stroszczynski, J. Stossel, B. Wassermann, P.<br />
M. Schlag, and H. R<strong>in</strong>neberg, Phys. Med. Biol. 49, 1165<br />
(2004).<br />
5. A. Torricelli, L. Sp<strong>in</strong>elli, A. Pifferi, P. Taroni, R.<br />
Cubeddu, and G. M. Danes<strong>in</strong>i, Opt. Express 11, 853<br />
(2003).<br />
6. R. Choe, A. Corlu, K. Lee, T. Durduran, S. D. Konecky,<br />
M. Grosicka-Koptyra, S. R. Arridge, B. J. Czerniecki,<br />
D. L. Fraker, A. DeMichele, B. Chance, M. A. Rosen,<br />
and A. G. Yodh, Med. Phys. 32, 1128 (2005).<br />
7. D. B. Jakubowski, A. E. Cerussi, F. Bevilacqua, N.<br />
Shah, D. Hsiang, J. Butler, and B. J. Tromberg, J.<br />
Biomed. Opt. 9, 230 (2004).<br />
8. R. P. Beaney, A. A. Lammertsma, T. Jones, C. G.<br />
McKenzie, and K. E. Halnan, Lancet 1, 131 (1984).<br />
9. C. B. Wilson, D. E. Snook, B. Dhokia, C. V. J. Taylor, I.<br />
A. Watson, A. A. Lammertsma, R. Lambrecht, J.<br />
Waxman, T. Jones, and A. A. Epenetos, Int. J. Cancer<br />
47, 344 (1991).<br />
10. B. J. H. Wilson, A. A. Lammertsma, C. G. McKenzie, K.<br />
Sikora, and T. Jones, Cancer Res. 52, 1592 (1992).<br />
11. H. Madjar, W. Sauerbrei, H. J. Prömpeler, R. Wolfarth,<br />
and H. Gufler, Gynecol. Oncol. 64, 392 (1997).<br />
12. D. O. Cosgrove, J. C. Bamber, J. B. Davey, J. A.<br />
McK<strong>in</strong>na, and H. D. S<strong>in</strong>nett, Radiology 176, 175<br />
(1990).<br />
13. R. P. Kedar, D. O. Cosgrove, I. E. Smith, J. L. Mansi,<br />
and J. C. Bamber, Radiology 190, 825 (1994).<br />
14. J. P. Delille, P. J. Slanetz, E. D. Yeh, E. F. Halpern, D.<br />
B. Kopans, and L. Garrido, Radiology 228, 63 (2003).<br />
15. T. Durduran, “Non-<strong>in</strong>vasive <strong>measurement</strong>s <strong>of</strong> tissue<br />
hemodynamics with hybrid diffuse <strong>optical</strong> methods,”<br />
Ph.D. dissertation (University <strong>of</strong> Pennsylvania, 2004).<br />
16. T. Durduran, G. Yu, M. G. Burnett, J. A. Detre, J. H.<br />
Greenberg, J. Wang, C. Zhou, and A. G. Yodh, Opt.<br />
Lett. 29, 1766 (2004).<br />
17. J. P. Culver, T. Durduran, D. Furuya, C. Cheung, J. H.<br />
Greenberg, and A. G. Yodh, J. Cereb. Blood Flow<br />
Metab. 23, 911 (2003).<br />
18. D. J. P<strong>in</strong>e, D. A. Weitz, P. M. Chaik<strong>in</strong>, and E.<br />
Herbolzheimer, Phys. Rev. Lett. 60, 1134–1137 (1988).<br />
19. G. Maret and P. E. Wolf, Z. Phys. B: Condens. Matter<br />
65, 409 (1987).<br />
20. D. A. Boas, L. E. Campbell, and A. G. Yodh, Phys. Rev.<br />
Lett. 75, 1855 (1995).