Child Mortality in the United States, 1935-2007: - HRSA
Child Mortality in the United States, 1935-2007: - HRSA
Child Mortality in the United States, 1935-2007: - HRSA

Create successful ePaper yourself
Turn your PDF publications into a flip-book with our unique Google optimized e-Paper software.
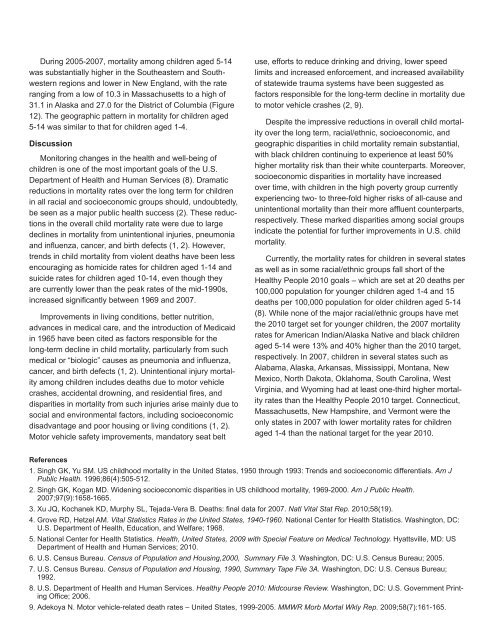
Dur<strong>in</strong>g 2005-<strong>2007</strong>, mortality among children aged 5-14<br />
was substantially higher <strong>in</strong> <strong>the</strong> Sou<strong>the</strong>astern and Southwestern<br />
regions and lower <strong>in</strong> New England, with <strong>the</strong> rate<br />
rang<strong>in</strong>g from a low of 10.3 <strong>in</strong> Massachusetts to a high of<br />
31.1 <strong>in</strong> Alaska and 27.0 for <strong>the</strong> District of Columbia (Figure<br />
12). The geographic pattern <strong>in</strong> mortality for children aged<br />
5-14 was similar to that for children aged 1-4.<br />
Discussion<br />
Monitor<strong>in</strong>g changes <strong>in</strong> <strong>the</strong> health and well-be<strong>in</strong>g of<br />
children is one of <strong>the</strong> most important goals of <strong>the</strong> U.S.<br />
Department of Health and Human Services (8). Dramatic<br />
reductions <strong>in</strong> mortality rates over <strong>the</strong> long term for children<br />
<strong>in</strong> all racial and socioeconomic groups should, undoubtedly,<br />
be seen as a major public health success (2). These reductions<br />
<strong>in</strong> <strong>the</strong> overall child mortality rate were due to large<br />
decl<strong>in</strong>es <strong>in</strong> mortality from un<strong>in</strong>tentional <strong>in</strong>juries, pneumonia<br />
and <strong>in</strong>fluenza, cancer, and birth defects (1, 2). However,<br />
trends <strong>in</strong> child mortality from violent deaths have been less<br />
encourag<strong>in</strong>g as homicide rates for children aged 1-14 and<br />
suicide rates for children aged 10-14, even though <strong>the</strong>y<br />
are currently lower than <strong>the</strong> peak rates of <strong>the</strong> mid-1990s,<br />
<strong>in</strong>creased significantly between 1969 and <strong>2007</strong>.<br />
Improvements <strong>in</strong> liv<strong>in</strong>g conditions, better nutrition,<br />
advances <strong>in</strong> medical care, and <strong>the</strong> <strong>in</strong>troduction of Medicaid<br />
<strong>in</strong> 1965 have been cited as factors responsible for <strong>the</strong><br />
long-term decl<strong>in</strong>e <strong>in</strong> child mortality, particularly from such<br />
medical or “biologic” causes as pneumonia and <strong>in</strong>fluenza,<br />
cancer, and birth defects (1, 2). Un<strong>in</strong>tentional <strong>in</strong>jury mortality<br />
among children <strong>in</strong>cludes deaths due to motor vehicle<br />
crashes, accidental drown<strong>in</strong>g, and residential fires, and<br />
disparities <strong>in</strong> mortality from such <strong>in</strong>juries arise ma<strong>in</strong>ly due to<br />
social and environmental factors, <strong>in</strong>clud<strong>in</strong>g socioeconomic<br />
disadvantage and poor hous<strong>in</strong>g or liv<strong>in</strong>g conditions (1, 2).<br />
Motor vehicle safety improvements, mandatory seat belt<br />
use, efforts to reduce dr<strong>in</strong>k<strong>in</strong>g and driv<strong>in</strong>g, lower speed<br />
limits and <strong>in</strong>creased enforcement, and <strong>in</strong>creased availability<br />
of statewide trauma systems have been suggested as<br />
factors responsible for <strong>the</strong> long-term decl<strong>in</strong>e <strong>in</strong> mortality due<br />
to motor vehicle crashes (2, 9).<br />
Despite <strong>the</strong> impressive reductions <strong>in</strong> overall child mortality<br />
over <strong>the</strong> long term, racial/ethnic, socioeconomic, and<br />
geographic disparities <strong>in</strong> child mortality rema<strong>in</strong> substantial,<br />
with black children cont<strong>in</strong>u<strong>in</strong>g to experience at least 50%<br />
higher mortality risk than <strong>the</strong>ir white counterparts. Moreover,<br />
socioeconomic disparities <strong>in</strong> mortality have <strong>in</strong>creased<br />
over time, with children <strong>in</strong> <strong>the</strong> high poverty group currently<br />
experienc<strong>in</strong>g two- to three-fold higher risks of all-cause and<br />
un<strong>in</strong>tentional mortality than <strong>the</strong>ir more affluent counterparts,<br />
respectively. These marked disparities among social groups<br />
<strong>in</strong>dicate <strong>the</strong> potential for fur<strong>the</strong>r improvements <strong>in</strong> U.S. child<br />
mortality.<br />
Currently, <strong>the</strong> mortality rates for children <strong>in</strong> several states<br />
as well as <strong>in</strong> some racial/ethnic groups fall short of <strong>the</strong><br />
Healthy People 2010 goals – which are set at 20 deaths per<br />
100,000 population for younger children aged 1-4 and 15<br />
deaths per 100,000 population for older children aged 5-14<br />
(8). While none of <strong>the</strong> major racial/ethnic groups have met<br />
<strong>the</strong> 2010 target set for younger children, <strong>the</strong> <strong>2007</strong> mortality<br />
rates for American Indian/Alaska Native and black children<br />
aged 5-14 were 13% and 40% higher than <strong>the</strong> 2010 target,<br />
respectively. In <strong>2007</strong>, children <strong>in</strong> several states such as<br />
Alabama, Alaska, Arkansas, Mississippi, Montana, New<br />
Mexico, North Dakota, Oklahoma, South Carol<strong>in</strong>a, West<br />
Virg<strong>in</strong>ia, and Wyom<strong>in</strong>g had at least one-third higher mortality<br />
rates than <strong>the</strong> Healthy People 2010 target. Connecticut,<br />
Massachusetts, New Hampshire, and Vermont were <strong>the</strong><br />
only states <strong>in</strong> <strong>2007</strong> with lower mortality rates for children<br />
aged 1-4 than <strong>the</strong> national target for <strong>the</strong> year 2010.<br />
References<br />
1. S<strong>in</strong>gh GK, Yu SM. US childhood mortality <strong>in</strong> <strong>the</strong> <strong>United</strong> <strong>States</strong>, 1950 through 1993: Trends and socioeconomic differentials. Am J<br />
Public Health. 1996;86(4):505-512.<br />
2. S<strong>in</strong>gh GK, Kogan MD. Widen<strong>in</strong>g socioeconomic disparities <strong>in</strong> US childhood mortality, 1969-2000. Am J Public Health.<br />
<strong>2007</strong>;97(9):1658-1665.<br />
3. Xu JQ, Kochanek KD, Murphy SL, Tejada-Vera B. Deaths: f<strong>in</strong>al data for <strong>2007</strong>. Natl Vital Stat Rep. 2010;58(19).<br />
4. Grove RD, Hetzel AM. Vital Statistics Rates <strong>in</strong> <strong>the</strong> <strong>United</strong> <strong>States</strong>, 1940-1960. National Center for Health Statistics. Wash<strong>in</strong>gton, DC:<br />
U.S. Department of Health, Education, and Welfare; 1968.<br />
5. National Center for Health Statistics. Health, <strong>United</strong> <strong>States</strong>, 2009 with Special Feature on Medical Technology. Hyattsville, MD: US<br />
Department of Health and Human Services; 2010.<br />
6. U.S. Census Bureau. Census of Population and Hous<strong>in</strong>g,2000, Summary File 3. Wash<strong>in</strong>gton, DC: U.S. Census Bureau; 2005.<br />
7. U.S. Census Bureau. Census of Population and Hous<strong>in</strong>g, 1990, Summary Tape File 3A. Wash<strong>in</strong>gton, DC: U.S. Census Bureau;<br />
1992.<br />
8. U.S. Department of Health and Human Services. Healthy People 2010: Midcourse Review. Wash<strong>in</strong>gton, DC: U.S. Government Pr<strong>in</strong>t<strong>in</strong>g<br />
Office; 2006.<br />
9. Adekoya N. Motor vehicle-related death rates – <strong>United</strong> <strong>States</strong>, 1999-2005. MMWR Morb Mortal Wkly Rep. 2009;58(7):161-165.