Determination of PCBs in Selected Components of a Food Chain by ...
Determination of PCBs in Selected Components of a Food Chain by ...
Determination of PCBs in Selected Components of a Food Chain by ...

Create successful ePaper yourself
Turn your PDF publications into a flip-book with our unique Google optimized e-Paper software.
Polish J. <strong>of</strong> Environ. Stud. Vol. 16, No. 4 (2007), 571-578<br />
Orig<strong>in</strong>al Research<br />
<strong>Determ<strong>in</strong>ation</strong> <strong>of</strong> <strong>PCBs</strong> <strong>in</strong> <strong>Selected</strong> <strong>Components</strong> <strong>of</strong><br />
a <strong>Food</strong> Cha<strong>in</strong> <strong>by</strong> Means <strong>of</strong> SPE and GC/MS<br />
T. Ligor, W. Żebrowski, B. Buszewski*<br />
Chair <strong>of</strong> Environmental Chemistry and Bioanalytics, Faculty <strong>of</strong> Chemistry,<br />
Nicolaus Copernicus University, 7 Gagar<strong>in</strong>a St, 87-100 Toruń, Poland<br />
Received: June 1, 2006<br />
Accepted: February 18, 2007<br />
Abstract<br />
The goal <strong>of</strong> this work was the isolation <strong>of</strong> <strong>PCBs</strong> from different environmental matrices <strong>by</strong> means <strong>of</strong><br />
solid-phase (SPE) extraction and gas chromatography/mass spectrometry (GC/MS). The analyses <strong>in</strong>clude<br />
the determ<strong>in</strong>ation <strong>of</strong> <strong>PCBs</strong> <strong>in</strong> fourteen samples <strong>of</strong> transformer oils and different k<strong>in</strong>ds <strong>of</strong> fodders (for poultry,<br />
pigs, and cattle). The recovery rates for different congeners were on the level <strong>of</strong> 75-85%. The detection<br />
limits <strong>of</strong> five congeners <strong>of</strong> <strong>PCBs</strong> were <strong>in</strong> the range 85 to 130 µg/kg. The RSD was on the level <strong>of</strong> 2.7<br />
– 4.4%. The Ishikawa diagram was used for evaluation <strong>of</strong> uncerta<strong>in</strong>ty.<br />
Keywords: monitor<strong>in</strong>g, <strong>PCBs</strong>, transformers oil, fodder, Ishikawa diagram<br />
Introduction<br />
*Correspond<strong>in</strong>g author; e-mail: bbusz@chem.uni.torun.pl<br />
Polychlor<strong>in</strong>ated biphenyls (<strong>PCBs</strong>) constitute a group<br />
<strong>of</strong> 209 congeners but only fewer than 90 have been detected<br />
at significant concentrations <strong>in</strong> environmental matrices<br />
[1, 2]. Their production on an <strong>in</strong>dustrial scale was<br />
<strong>in</strong>itiated <strong>in</strong> the late 1920s to be applied as dielectric fluid<br />
<strong>in</strong> transformers and condensers.<br />
Despite their wide application <strong>in</strong> different branches <strong>of</strong><br />
<strong>in</strong>dustry, their production was term<strong>in</strong>ated and the study<br />
<strong>of</strong> their properties and <strong>in</strong>fluence on human organism was<br />
<strong>in</strong>itiated. <strong>PCBs</strong> are very persistent chemicals due to thermal<br />
stability and resistance to biodegradation. Polychlor<strong>in</strong>ated<br />
biphenyls are characterized <strong>by</strong> a large aff<strong>in</strong>ity to<br />
fats (K ow<br />
> 3) as well as <strong>by</strong> great durability, which makes<br />
them an easy subject for bioaccumulation [3].These compounds<br />
were widely used <strong>in</strong> almost all branches <strong>of</strong> <strong>in</strong>dustry<br />
because they are characterized <strong>by</strong> good stability <strong>in</strong><br />
various conditions, solubility <strong>in</strong> non-polar solvents, low<br />
pressure <strong>of</strong> vapours, low electric conductivity, high thermal<br />
conductivity and high resistance to chemical factors<br />
[4]. The monitor<strong>in</strong>g <strong>of</strong> these pollutants <strong>in</strong> natural environment<br />
began when <strong>PCBs</strong> <strong>in</strong> environmental samples were<br />
discovered <strong>in</strong> the early 1970s. The materials conta<strong>in</strong><strong>in</strong>g<br />
more than 50 µg/g <strong>of</strong> total <strong>PCBs</strong> are subjected to strict<br />
regulations <strong>in</strong> the USA and other countries [5].<br />
The ma<strong>in</strong> sources <strong>of</strong> emission <strong>in</strong>to the environment are<br />
leakage from capacitors and transformers. Another potential<br />
source <strong>of</strong> <strong>PCBs</strong> can be uncontrolled storage altered or<br />
improper regeneration <strong>of</strong> transformer and motor oil [6, 7].<br />
However, spontaneous chemical reaction from precursors<br />
conta<strong>in</strong><strong>in</strong>g chlor<strong>in</strong>e, burn<strong>in</strong>g waste or whiten<strong>in</strong>g cellulose<br />
pulp <strong>by</strong> chlor<strong>in</strong>e can be expected as a relatively low abundant<br />
source <strong>of</strong> PCB.The <strong>in</strong>vestigation <strong>of</strong> PCB properties<br />
led to their classification to group 2A, namely compounds<br />
that are probably carc<strong>in</strong>ogenic, decrease immune activity<br />
systems, disrupt the development <strong>of</strong> the psychomotor<br />
system, disrupt hormone function and <strong>in</strong>crease tumours,<br />
which decide negative <strong>in</strong>fluences on health and people’s<br />
life [8]. The aforementioned compounds, due to their<br />
possible negative <strong>in</strong>fluence on humans, have found their<br />
place <strong>in</strong> legal regulations concern<strong>in</strong>g their presence <strong>in</strong> different<br />
parts <strong>of</strong> the ecosystem.
572<br />
Waste oils conta<strong>in</strong><strong>in</strong>g <strong>PCBs</strong> have been short listed<br />
as hazardous substances <strong>in</strong> Poland s<strong>in</strong>ce 1993. Available<br />
data have <strong>in</strong>dicated that <strong>in</strong> national power plant <strong>in</strong>stallations<br />
about 1,400 t <strong>of</strong> transformer and capacitor oils are<br />
used [6]. However, well known <strong>in</strong>cidents <strong>in</strong>volv<strong>in</strong>g feed<br />
and food stuff contam<strong>in</strong>ation with organochlor<strong>in</strong>e compounds<br />
have led to an <strong>in</strong>crease <strong>in</strong> the control <strong>of</strong> PCB levels<br />
<strong>in</strong> food and feed products [9]. Legal regulations have<br />
established maximum residue levels <strong>of</strong> seven <strong>in</strong>dicator<br />
isomers. These directives also call for rout<strong>in</strong>e analysis <strong>of</strong><br />
large numbers <strong>of</strong> samples [10]. Therefore, authors can expect<br />
contam<strong>in</strong>ation <strong>of</strong> feeders <strong>by</strong> transformer oils which<br />
still conta<strong>in</strong> <strong>PCBs</strong>. Plant and animal oils are added to fodders<br />
as a carrier for fat-soluble vitam<strong>in</strong>s and also as one<br />
<strong>of</strong> the fundamental component <strong>of</strong> well balanced diet with<br />
prote<strong>in</strong>s and carbohydrates. Other additives like vitam<strong>in</strong>s,<br />
dietary fibers, and microelements <strong>in</strong>clude various <strong>by</strong>products<br />
from nutritional <strong>in</strong>dustry. The fodder contam<strong>in</strong>ation<br />
illustrates the close correlation between the environment<br />
and food production.<br />
An important part <strong>of</strong> any analytical process is sample<br />
preparation, which <strong>in</strong>volves isolation and preconcentration<br />
<strong>of</strong> various analytes <strong>of</strong> <strong>in</strong>terest. Guidel<strong>in</strong>es <strong>of</strong> CEN<br />
(European Committee for Standardization) recommends<br />
different methodologies for extraction, clean up and<br />
analysis [11, 12]. The extraction procedures based on microwave-assisted<br />
extraction (MAE) [13, 14] supercritical<br />
fluid extraction (SFE) [15, 16], and accelerated solvent<br />
extraction (ASE) [17] are widely applied. It is well known<br />
that the clean up step is important before chromatographic<br />
analysis [18]. Additionally, many analytical protocols recommend<br />
clean up procedures. The SPE is a widely used<br />
pre-treatment method which has the property <strong>of</strong> remov<strong>in</strong>g<br />
<strong>in</strong>terferences from a sample matrix. Therefore, this<br />
method based on dual sorbent bed: aryl sulfonic acid and<br />
silica gel (Ar-SO 3<br />
/SiOH) was used for clean<strong>in</strong>g sample<br />
extracts.<br />
The objective <strong>of</strong> the present study was to determ<strong>in</strong>e<br />
the level <strong>of</strong> total <strong>PCBs</strong> <strong>in</strong> fodder and transformer oil samples<br />
collected from different regions <strong>of</strong> Poland. The determ<strong>in</strong>ation<br />
<strong>of</strong> <strong>PCBs</strong> isolated from gett<strong>in</strong>g products, which<br />
are a part <strong>of</strong> human food cha<strong>in</strong> state, is a very important<br />
problem for analytical chemists [19, 20].<br />
Experimental<br />
Materials and Reagents<br />
The fourteen samples <strong>of</strong> transformer oils from the<br />
Factory <strong>of</strong> Transformer and Apparatus Traction <strong>in</strong> Warsaw<br />
and Meat Factory Morl<strong>in</strong>y (Ostróda, Poland) were<br />
collected. The n<strong>in</strong>e samples <strong>of</strong> commercially available<br />
fodder samples have been collected <strong>in</strong> the Polish market.<br />
The n-hexane, methanol and isooctane were purchased<br />
from Fluka (Buchs, Switzerland). The chromatographic<br />
standards <strong>of</strong> PCB (2.4.4’-trichlorobifenyl, IUPAC No. 28;<br />
2,2’,5,5’-tetrachlorobifenyl IUPAC No. 52; 2,2’,4,5,5’-<br />
Ligor T. et al.<br />
pentachlorobifenyl IUPAC No. 101; 2,2’,3,4,4’,5’-heksachlorobifenyl<br />
IUPAC No. 138, 2,2’,3,4,4’,5,5’-heptachlorobifenyl<br />
IUPAC No. 180) were purchased from<br />
Promochem (Wessel, Germany). The technical mixtures<br />
<strong>of</strong> <strong>PCBs</strong>: Aroclor 1242, 1254 and 1260 were obta<strong>in</strong>ed<br />
from Supelco (Bellefonte, PA, USA). The different work<strong>in</strong>g<br />
standard solutions were prepared <strong>by</strong> add<strong>in</strong>g the appropriate<br />
weight primary standard to hexane. The solid phase<br />
cartridges PCB-N with dual sorbents (Ar-SO 3<br />
/SiOH)<br />
1000 mg/3ml were purchased from J.T Baker (S.Witko,<br />
Łódź, Poland). Helium <strong>of</strong> 99.999% purity was purchased<br />
from L<strong>in</strong>de (Gliwice, Poland) and Rtx – 5 (Restek, Bellefonte<br />
PA, USA) column (30 m × 0.25 mm × 0.25 µm).<br />
The ultrasonic bath UM-4 was purchased from Unimasz<br />
(Koszal<strong>in</strong>, Poland).<br />
Apparatus and Analytical Conditions<br />
Chromatographic Investigations<br />
The temperature <strong>of</strong> the GC/MS Turbomass (Perk<strong>in</strong>–<br />
Elmer Co., Norwalk, CT, USA) with split-splitless <strong>in</strong>jector<br />
was 250°C. Splitless time was 0.7 m<strong>in</strong>, split ratio 1:25.<br />
The carrier gas was helium – l<strong>in</strong>ear velocity 35 cm/sec.<br />
Ionisation: EI, 70 eV, MS mode: SIM. Ion source and<br />
transfer l<strong>in</strong>e temperatures: 210 and 200°C, respectively.<br />
The acquisition <strong>of</strong> chromatographic data was performed<br />
<strong>by</strong> Turbomass s<strong>of</strong>tware (Perk<strong>in</strong>–Elmer Co.). Oven temperature<br />
programme for both <strong>in</strong>struments was the follow<strong>in</strong>g:<br />
<strong>in</strong>itial 50°C hold for 1.5 m<strong>in</strong>, then ramp (I) 15°C/m<strong>in</strong><br />
to 150°C (hold 2 m<strong>in</strong>), then ramp (II) 5°C/m<strong>in</strong> to 280°C<br />
(hold 10 m<strong>in</strong>) and ramp (III) 3 o C/m<strong>in</strong>, 295 o C (hold 6<br />
m<strong>in</strong>).<br />
Sample Preparation<br />
A) Fodder samples<br />
ultrasound-assisted solvent extraction with hexane<br />
was used for the preparation <strong>of</strong> fodder. The 10.00 g <strong>of</strong><br />
fodder sample was homogenized with 5 g <strong>of</strong> silica-anhydrous<br />
sodium sulfate (1:1, ww.) mixture loaded <strong>in</strong><br />
a laboratory flask conta<strong>in</strong><strong>in</strong>g 35 ml <strong>of</strong> hexane and extracted<br />
<strong>in</strong> an ultrasonic bath. Extraction was performed<br />
three times for 30 m<strong>in</strong>. Extracts were comb<strong>in</strong>ed, filtered<br />
and evaporated to dryness <strong>in</strong> a vacuum evaporator.<br />
Afterwards, the residue was dissolved <strong>in</strong> a few ml<br />
<strong>of</strong> hexane, transferred <strong>in</strong> 10 ml volumetric flask and<br />
filled up to their volume with hexane. A 250 µl aliquot<br />
<strong>of</strong> this solution was applied to SPE column.<br />
B) The transformer oil samples<br />
The 1.00 g <strong>of</strong> transformer oil was dissolved <strong>in</strong> hexane<br />
and diluted with this solvent to 10 ml <strong>in</strong> a volumetric<br />
flask. The 500 µl <strong>of</strong> this solution was loaded <strong>in</strong> an SPE<br />
column.<br />
C) Clean – up<br />
The solid phase extraction was used for preconcentration<br />
and clean-up <strong>of</strong> both k<strong>in</strong>d <strong>of</strong> extracts. 2 ml <strong>of</strong>
<strong>Determ<strong>in</strong>ation</strong> <strong>of</strong> <strong>PCBs</strong>... 573<br />
hexane was added to elute PCB from SPE column.<br />
The collected extract was evaporated under gentle<br />
stream <strong>of</strong> nitrogen and then residue was dissolved <strong>in</strong><br />
25 µl <strong>of</strong> isooctane. The 1.5 µl <strong>of</strong> f<strong>in</strong>al extract were<br />
<strong>in</strong>jected.<br />
Results and Discussion<br />
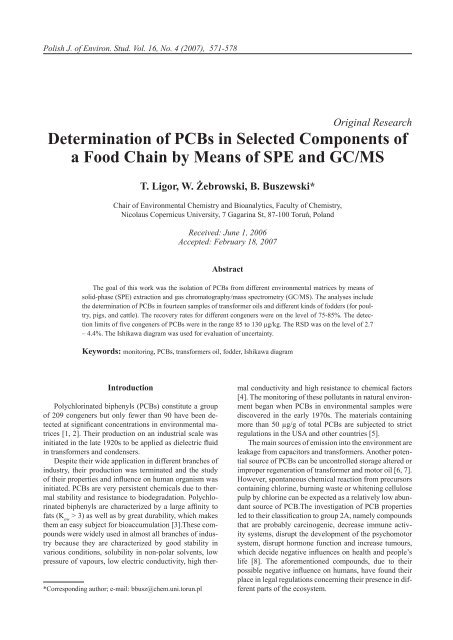
Fig. 1. Recoveries <strong>of</strong> congeners PCB 28, 52, 101, 138, 180 after<br />
SPE clean-up (n=5, spik<strong>in</strong>g level 25 µg/g <strong>of</strong> each congener).<br />
Table 1. <strong>Selected</strong> ions for qualification and quantitation.<br />
PCB<br />
Monitored ions<br />
28 258, 256<br />
52 290, 292<br />
101 324, 326<br />
138 360, 362<br />
180 394, 396<br />
Before PCB analysis, the l<strong>in</strong>ear range <strong>of</strong> MS detector<br />
was determ<strong>in</strong>ed [21]. The detector response was established<br />
for six congeners conta<strong>in</strong><strong>in</strong>g different number <strong>of</strong><br />
chlor<strong>in</strong>e atoms. The clean–up method had been tested with<br />
samples spiked with 25 µg/ml <strong>of</strong> each <strong>in</strong>dividual congener<br />
(PCB 28, 52, 101, 138, 180). The recovery was determ<strong>in</strong>ed<br />
<strong>in</strong> the range from 75 to 85% for all tested congeners (Fig.<br />
1). The precision, calculated as a RSD was less than 13%.<br />
Ten replicate <strong>in</strong>jections <strong>of</strong> standard solutions (at least two<br />
concentration levels) were <strong>in</strong>jected <strong>in</strong>to GC/MS to check<br />
system performance and calibration validity. The RSD<br />
was generally less than 5%. Limit <strong>of</strong> quantitation (LOQ)<br />
<strong>of</strong> each isomer was on the level 65 ng/g.<br />
However, data calculated accord<strong>in</strong>g to the Ishikawa<br />
method <strong>in</strong>dicate that the uncerta<strong>in</strong>ty <strong>in</strong> determ<strong>in</strong><strong>in</strong>g detection<br />
limit can change <strong>in</strong> some ranges.<br />
Identification <strong>of</strong> <strong>PCBs</strong> <strong>in</strong> the samples was performed<br />
<strong>by</strong> comparison <strong>of</strong> chromatograms <strong>of</strong> purified extracts with<br />
those obta<strong>in</strong>ed from standard solutions. This method is<br />
based on simultaneous detection, at correspond<strong>in</strong>g retention<br />
time, <strong>of</strong> chromatographic signals <strong>of</strong> the two selected<br />
ions for each congener (Table 1), which are chosen accord<strong>in</strong>g<br />
to full scan mass spectrum and chromatogram <strong>of</strong><br />
target compounds.<br />
In addition, the isotopic ratio should be ma<strong>in</strong>ta<strong>in</strong>ed<br />
with<strong>in</strong> an appropriate range, i.e. 20% <strong>of</strong> calculated value<br />
for the same ions. F<strong>in</strong>ally, the chromatographic signals <strong>of</strong><br />
two selected ions <strong>of</strong> isotopic cluster should be detected<br />
at the same time as those <strong>of</strong> the correspond<strong>in</strong>g standard<br />
compounds. Peaks were accepted as PCB if they fulfilled<br />
the follow<strong>in</strong>g criteria [22]:<br />
The retention time was with<strong>in</strong> 0.1 m<strong>in</strong> <strong>of</strong> the retention<br />
time <strong>of</strong> the relevant congener <strong>in</strong> the standard.<br />
The ratio between two monitored ions was with<strong>in</strong> satisfactory<br />
level (±0.2) <strong>of</strong> the ratio found for the relevant<br />
congener <strong>in</strong> the standard.<br />
The presence <strong>of</strong> selected Aroclors <strong>in</strong>dicated that the pattern<br />
<strong>of</strong> peaks resembled the observed peak standard. Qualitative<br />
estimation <strong>of</strong> sample extracts was carried out with<br />
Aroclors 1242, 1254, 1260 and selected congeners. Fig.<br />
2 shows exemplary chromatogram <strong>in</strong> SIM mode <strong>of</strong> transformer<br />
oil obta<strong>in</strong>ed after extraction and spe treatment.<br />
The results <strong>of</strong> determ<strong>in</strong>ation demonstrated that two<br />
from fourteen transformer oils conta<strong>in</strong>ed PCB and all<br />
fodder samples were not contam<strong>in</strong>ated (Table 2). The<br />
pr<strong>of</strong>ile <strong>of</strong> peaks on the chromatograms <strong>of</strong> sample No. 6<br />
correspond<strong>in</strong>g to the mixture <strong>of</strong> Aroclor 1254 and 1242<br />
was observed. The second sample probably conta<strong>in</strong>ed<br />
congeners derived from different commercial mixtures.<br />
The total concentration <strong>of</strong> <strong>PCBs</strong> was determ<strong>in</strong>ed <strong>by</strong> visual<br />
pattern match<strong>in</strong>g and summ<strong>in</strong>g selected peaks to obta<strong>in</strong><br />
a total amount. The analyzed samples <strong>of</strong> transformer<br />
oils conta<strong>in</strong>ed a PCB (as a total sum) <strong>in</strong> the concentration<br />
range 760 µg/g and 630 µg/g <strong>in</strong> samples No. 12 and No.<br />
7, respectively. The total concentration <strong>of</strong> <strong>PCBs</strong> was more<br />
than one order <strong>of</strong> magnitude higher than the generally accepted<br />
limit accord<strong>in</strong>g to the US EPA (50 µg/g). Therefore,<br />
these oils could be recognized as dangerous waste.<br />
The concentration <strong>of</strong> <strong>in</strong>dividual congeners was shown<br />
<strong>in</strong> Table 3. The level <strong>of</strong> selected <strong>PCBs</strong> <strong>in</strong> the samples<br />
ranged from 15 to 43 µg/g. The analysis <strong>of</strong> <strong>in</strong>dividual<br />
congeners confirmed the presence <strong>of</strong> Aroclor <strong>in</strong> sample<br />
No. 2 because the sum <strong>of</strong> <strong>PCBs</strong> corresponded to the content<br />
<strong>of</strong> these congeners determ<strong>in</strong>ed <strong>by</strong> other authors <strong>in</strong><br />
the standard solution [22]. In Table 2, apart from the total<br />
concentration <strong>of</strong> <strong>PCBs</strong> <strong>in</strong> oil sample, the electric power<br />
<strong>of</strong> transformers is shown, where oil was used, year <strong>of</strong><br />
production <strong>of</strong> transformer oil and the name <strong>of</strong> the company<br />
where transformer oil was used.<br />
Previously, when the transformers were <strong>in</strong>stalled,<br />
the presence <strong>of</strong> <strong>PCBs</strong> was not taken <strong>in</strong>to consideration.<br />
But now it is an important problem because the large<br />
quantities <strong>of</strong> oils conta<strong>in</strong><strong>in</strong>g <strong>PCBs</strong> for <strong>in</strong>creas<strong>in</strong>g electric<br />
resistance were applied. In general op<strong>in</strong>ion, higher<br />
concentrations <strong>of</strong> <strong>PCBs</strong> <strong>in</strong> transformer oils are connected<br />
with electric power. Our data is not exhaustive but does<br />
not confirm this op<strong>in</strong>ion. It is possible to expect that if a<br />
transformer device is old, the concentration <strong>of</strong> <strong>PCBs</strong> <strong>in</strong><br />
oil is higher than <strong>in</strong> modern devices.
574<br />
Ligor T. et al.<br />
Fig. 2. <strong>Selected</strong> ion mod chromatogram <strong>of</strong> transformer oil sample after clean-up.<br />
Table 2. The total concentration <strong>of</strong> PCB <strong>in</strong> oils a ) I- factory <strong>of</strong> transformers and apparatus traction, II- Morl<strong>in</strong>y meat factory; n.d.- not<br />
detected.<br />
No<br />
Power <strong>of</strong> transformer<br />
[kVA]<br />
Year <strong>of</strong> production<br />
Total concentration<br />
<strong>of</strong> PCB<br />
[µg/g]<br />
1 2000 1984 n.d. I<br />
2 1600 1973 n.d. I<br />
3 1000 1978 n.d. I<br />
4 2000 1973 n.d. I<br />
5 1000 1978 n.d. I<br />
6 1000 1978 n.d. I<br />
7 1000 1974 760.21 ±0.05 I<br />
8 1600 1974 n.d. I<br />
9 1600 1974 n.d. I<br />
10 1600 1974 n.d. I<br />
11 1000 1974 n.d. I<br />
12 1000 1974 630.15 ±0.05 II<br />
13 250 1974 n.d. II<br />
14 250 1974 n.d. II<br />
Orig<strong>in</strong> a
<strong>Determ<strong>in</strong>ation</strong> <strong>of</strong> <strong>PCBs</strong>... 575<br />
Table 3. Concentration <strong>of</strong> <strong>in</strong>dividual congeners <strong>in</strong> transformer<br />
oils (n=4).<br />
PCB<br />
Sample No. 7<br />
Concentration<br />
[µg/g]<br />
Sample No. 12<br />
Concentration<br />
[µg/g]<br />
28 20 20<br />
52 35 15<br />
101 59 43<br />
138 15 20<br />
180 30 21<br />
Fig. 3. Ishikawa Diagram for quantitative analysis <strong>of</strong> <strong>PCBs</strong> <strong>in</strong><br />
transformer oil samples.<br />
Table 4. Composition <strong>of</strong> the selected fodders.<br />
Fodder<br />
Application<br />
Metabolic<br />
energy<br />
[MJ/kg]<br />
General<br />
prote<strong>in</strong><br />
[%]<br />
Lys<strong>in</strong>e<br />
[%]<br />
Methion<strong>in</strong>e<br />
+ cyst<strong>in</strong>e<br />
[%]<br />
Threon<strong>in</strong>e<br />
[%]<br />
Organic<br />
calcium<br />
[%]<br />
Starter Pigs 13 17.1% 1 0.6 0.6 0.89<br />
Prestarter Pigs 12.5 21.4% 1.16 0.67 0.6 0.9<br />
Exo-mlyn Pigs 17 17% 0.9 0.58 0.55 0.9<br />
Next, we take <strong>in</strong>to consideration the monitor<strong>in</strong>g<br />
analyses <strong>of</strong> fodders used <strong>in</strong> animal breed<strong>in</strong>g. Fodder is<br />
the ma<strong>in</strong> component <strong>of</strong> animal food and it may conta<strong>in</strong><br />
various additives such as: vitam<strong>in</strong>s, fats, carbohydrates,<br />
cellulose, and microelements. The research objective was<br />
to assert if selected fodders used <strong>in</strong> Poland are uncontam<strong>in</strong>ated,<br />
and if they are not used for the ‘utilization’<br />
<strong>of</strong> matrices conta<strong>in</strong><strong>in</strong>g dangerous xenobiotics, such as<br />
<strong>PCBs</strong>, diox<strong>in</strong>s and pesticides. The analysis was carried<br />
out on n<strong>in</strong>e fodders used for feed<strong>in</strong>g pigs, chickens, hens<br />
and cattle. The fodders <strong>in</strong>cluded: Starter ® , Exo-mlyn ® ,<br />
Agrocentrum ® , Agrocentrum BG2 ® , Agrocentrum AIB-<br />
1 ® , LKH ® , Prestarter ® , F<strong>in</strong>iszer ® , and Grover ® . The<br />
characteristic <strong>of</strong> selected fodders are showed <strong>in</strong> Table 4.<br />
Results <strong>of</strong> our <strong>in</strong>vestigations confirm the lack <strong>of</strong> contam<strong>in</strong>ation<br />
<strong>of</strong> fodders used. The selected fodders proved not<br />
to be a source <strong>of</strong> PCB compounds <strong>in</strong> human food cha<strong>in</strong><br />
and may be used <strong>in</strong> livestock nutrition. However, only<br />
permanent monitor<strong>in</strong>g <strong>of</strong> PCB <strong>in</strong> environmental matrices<br />
helps us to prevent poison<strong>in</strong>g <strong>of</strong> human health <strong>by</strong> contam<strong>in</strong>ated<br />
food.<br />
Ishikawa Diagram for Quantitative Analysis <strong>of</strong><br />
PCB <strong>in</strong> Transformer Oil Sample<br />
Apart from determ<strong>in</strong>ation <strong>of</strong> different environmental<br />
matrices <strong>by</strong> chromatographic techniques, a very important<br />
role is be<strong>in</strong>g attributed to the evaluation analytic procedure.<br />
For that evaluation the Ishikawa Diagram has been applied.<br />
This diagram shows all factors that <strong>in</strong>fluence the<br />
end result analytical process (Fig. 3). The Ishikawa diagram<br />
is used for total calculation <strong>of</strong> the uncerta<strong>in</strong>ty <strong>of</strong> f<strong>in</strong>al<br />
result – U.<br />
This diagram conta<strong>in</strong>s the <strong>in</strong>fluence <strong>of</strong> the follow<strong>in</strong>g<br />
parameters such as:<br />
– devices used <strong>in</strong> analytic process:<br />
– accuracy <strong>of</strong> balance – (A Bal<br />
)<br />
– standard deviation <strong>of</strong> balance – (s Bal<br />
)<br />
– accuracy <strong>of</strong> pipette – (A Pip<br />
)<br />
– standard deviation <strong>of</strong> pipette – (s Pip<br />
)<br />
– purity <strong>of</strong> standard – (P)<br />
– standard deviation <strong>of</strong> results – (Results)<br />
– limit <strong>of</strong> detection – (LOD) – standard uncerta<strong>in</strong>ty <strong>of</strong><br />
extraction process – (Extraction)<br />
Formulas used to calculate total uncerta<strong>in</strong>ty <strong>of</strong> f<strong>in</strong>al<br />
result (U) are shown <strong>in</strong> the next equation:<br />
U = k * C AV<br />
* [ u(C STANDARD<br />
) 2 + u(M SAMPLE<br />
) 2 + s 2 RF /n 1 +<br />
+ s 2 RESULTS /n 2 + u(C LOD )2 + u(C EXT<br />
) 2 (1)<br />
where:<br />
U- total uncerta<strong>in</strong>ty <strong>of</strong> f<strong>in</strong>al result<br />
k – factor <strong>of</strong> widen<strong>in</strong>g = 2<br />
u(C STANDARD<br />
) 2 – Standard uncerta<strong>in</strong>ty <strong>of</strong> concentration<br />
u(M SAMPLE<br />
) 2 – Standard uncerta<strong>in</strong>ty <strong>of</strong> calculate mass sample<br />
s 2 /n – Standard uncerta<strong>in</strong>ty <strong>of</strong> responsible factor<br />
RF 1<br />
s 2 /n – Standard uncerta<strong>in</strong>ty <strong>of</strong> results<br />
RESULTS 2<br />
u(C LOD<br />
) 2 – Standard uncerta<strong>in</strong>ty <strong>of</strong> limit <strong>of</strong> detection<br />
u(C EXT<br />
) 2 – Standard uncerta<strong>in</strong>ty <strong>of</strong> extraction process<br />
In calculat<strong>in</strong>g the standard uncerta<strong>in</strong>ty <strong>of</strong> standard<br />
concentration – u(C STANDARD<br />
) 2 we must take <strong>in</strong>to consideration<br />
the follow<strong>in</strong>g factors.
576<br />
u(C STANDARD<br />
) 2 = u(P) 2 + u(M standard<br />
) 2 + Σ u(M MSi<br />
) 2 (2)<br />
where:<br />
u(P) 2 – total uncerta<strong>in</strong>ty <strong>of</strong> purity standard =<br />
u(P) 2 = (u/√3/P) 2<br />
u(M STANDARD<br />
) 2 – Standard uncerta<strong>in</strong>ty <strong>of</strong> calculated mass<br />
standard =<br />
u(M STANDARD<br />
) 2 = [(√s 2 Bal +A2 bal )/M Standard )2<br />
u(M MSi<br />
) 2 – Standard uncerta<strong>in</strong>ty <strong>of</strong> calculated mixture standard=<br />
u(M MS<br />
) 2 = [(√s 2 MSi +A2 MSi )/M MSi )2<br />
Standard uncerta<strong>in</strong>ty <strong>of</strong> calculated mass sample –<br />
u(M SAMPLE<br />
) 2 depends on standard deviation <strong>of</strong> balance s Bal<br />
and accuracy <strong>of</strong> balance A bal.<br />
This dependence is shown <strong>in</strong><br />
the next equation:<br />
u(M Sample<br />
) 2 = [(√s 2 Bal +A2 bal )/M Sample )2 (3)<br />
Ligor T. et al.<br />
Other formulas which are used to calculate total uncerta<strong>in</strong>ty<br />
<strong>of</strong> f<strong>in</strong>al result – U are:<br />
s 2 RF /n 1 = (RSD RF )2 (4)<br />
s 2 Results /n 1 = (RSD Results )2 (5)<br />
u(C LOD<br />
) 2 = (LOD/C Av<br />
) 2 (6)<br />
u(C EXT<br />
) 2 = u(C LOD<br />
) 2 (7)<br />
On the basis <strong>of</strong> Ishikawa diagram and all calculations<br />
connected with this diagram we can draw the follow<strong>in</strong>g<br />
conclusions:<br />
Table 5. Tabulation <strong>of</strong> values used to calculate summary uncerta<strong>in</strong>ty <strong>of</strong> f<strong>in</strong>al result – U:<br />
U (C standard)<br />
PCB P u<br />
U(P)%<br />
[%*10 -4 ]<br />
S<br />
(balance)<br />
Pure standard [mg]<br />
A<br />
(balance)<br />
M<br />
standard<br />
u(C STANDARD<br />
)<br />
[%*10 -4 ]<br />
S<br />
(balance)<br />
Basic solution [g]<br />
A<br />
(balance)<br />
M<br />
standard<br />
u(C STANDARD1<br />
)<br />
[%*10 -4 ]<br />
28 0.996 0.005 8.5 0.01 0.01 11 1.6 0.002 0.002 19.75 0.02<br />
52 0.99 0.005 8.5 0.01 0.01 7.6 3.5 0.002 0.002 19.75 0.02<br />
101 0.99 0.005 8.5 0.01 0.01 11.6 1.5 0.002 0.002 19.75 0.02<br />
138 0.996 0.005 8.5 0.01 0.01 23.8 0.35 0.002 0.002 19.75 0.02<br />
180 0.998 0.005 8.4 0.01 0.01 15.6 0.82 0.002 0.002 19.75 0.02<br />
U (M sample)<br />
Sample [g]<br />
U<br />
LOD<br />
S<br />
A<br />
CAv<br />
PCB<br />
Mass sample [ng/kg]<br />
[ng/kg] %<br />
(balance) (balance)<br />
28 0.002 0.002 1.000 120 740 26.12 3.53<br />
52 0.002 0.002 1.000 85 1200 132.72 11.06<br />
101 0.002 0.002 1.000 85 2500 108 4.32<br />
138 0.002 0.002 1.000 97 1900 54.34 2.86<br />
180 0.002 0.002 1.000 130 1800 50.4 2.80<br />
PCB U(Cstandard) U(Msample) RSD (RF) RSD (Results) ∑ U<br />
LOD<br />
[%]<br />
u(C EXT<br />
) 2<br />
[%]<br />
28 0.001 0.00078 1.786 3.5 5.28 16.22 16.22<br />
52 0.0022 0.00078 2.990 4 6.99 7.08 7.08<br />
101 0.001 0.00078 2.542 2.7 5.24 3.40 3.40<br />
138 0.00089 0.00078 0.667 3.2 3.87 5.10 5.10<br />
180 0.0009 0.00078 1.765 4.4 6.16 7.22 7.22
<strong>Determ<strong>in</strong>ation</strong> <strong>of</strong> <strong>PCBs</strong>... 577<br />
– uncerta<strong>in</strong>ty <strong>of</strong> weigh<strong>in</strong>g standards is very low –<br />
0.00016% (PCB 28) to 0.000084% (PCB 180) and has<br />
no <strong>in</strong>fluence on total uncerta<strong>in</strong>ty<br />
– uncerta<strong>in</strong>ty <strong>of</strong> weigh<strong>in</strong>g samples is on the level 2.2%<br />
(PCB 180) ÷ 11.1% (PCB 52).<br />
– uncerta<strong>in</strong>ty <strong>of</strong> RSD results is rather low – 2.7% (PCB<br />
101) to 4.4% (PCB 180)<br />
– uncerta<strong>in</strong>ty <strong>of</strong> LOD is <strong>in</strong> the range 3.7% (PCB 101) ÷<br />
16.2% (PCB 180)<br />
– uncerta<strong>in</strong>ty <strong>of</strong> extraction is average, the same as uncerta<strong>in</strong>ty<br />
<strong>of</strong> LOD because u(C EXT<br />
) 2 = u(C LOD<br />
) 2 – 3.7%<br />
(PCB 101) to 16.2% (PCB 180)<br />
From the aftermentioned data we can affirm that on<br />
uncerta<strong>in</strong>ty <strong>of</strong> analytical procedure the largest <strong>in</strong>fluence<br />
has the uncerta<strong>in</strong>ty connected with calculated LOD and<br />
extraction efficiency. The experimental data, calculated<br />
accord<strong>in</strong>g to the Ishikawa diagram, <strong>in</strong>dicate that it is the<br />
determ<strong>in</strong>ation <strong>of</strong> the detection limit that exerts the greatest<br />
<strong>in</strong>fluence upon the uncerta<strong>in</strong>ty <strong>of</strong> obta<strong>in</strong>ed results (Table<br />
5). The uncerta<strong>in</strong>ty <strong>in</strong> determ<strong>in</strong><strong>in</strong>g the detection limit varies<br />
from 3.7% (PCB 101) to 16.2% (PCB 180). Another factor<br />
<strong>in</strong>fluenc<strong>in</strong>g the uncerta<strong>in</strong>ty <strong>of</strong> obta<strong>in</strong>ed results is the uncerta<strong>in</strong>ty<br />
connected with the course <strong>of</strong> the extraction process.<br />
Conclusions<br />
A sensitive, rapid and robust monitor<strong>in</strong>g method has<br />
been optimized for PCB <strong>in</strong> oils and fodders. The use <strong>of</strong><br />
ultrasonic‐assisted extraction allows for efficacious sample<br />
preparation. The clean-up method based on double layered<br />
SPE column provides a simplified approach for the removal<br />
<strong>of</strong> <strong>in</strong>terferences from the raw sample. The GC/MS<br />
<strong>in</strong> SIM mode was used for f<strong>in</strong>al determ<strong>in</strong>ation <strong>of</strong> target<br />
congeners. This method fits the purpose <strong>of</strong> rapid screen<strong>in</strong>g<br />
<strong>of</strong> fodder and transformer oil samples. The <strong>PCBs</strong> were<br />
found only <strong>in</strong> two transformer oils on the level <strong>of</strong> 760 and<br />
630µg/g. However, PCB was not detected <strong>in</strong> fodders. The<br />
Ishikawa diagram was used to calculate uncerta<strong>in</strong>ty factors<br />
such as: RSD, LOD, extraction. These data play important<br />
roles <strong>in</strong> the uncerta<strong>in</strong>ty <strong>of</strong> the analytic process.<br />
Acknowledgments<br />
This research was supported <strong>by</strong> the M<strong>in</strong>istry <strong>of</strong> Science<br />
and Information Society Technologies (Grant No. 2<br />
P06R 100 29, Warsaw, Poland).<br />
The authors are grateful to Pr<strong>of</strong>essor J. Lulek (University<br />
<strong>of</strong> Medical Science, Poznań) for comments and discussion.<br />
References<br />
1. Gomez J.L., Bujalance M., Giraldez I., Velasco<br />
A., Orales E. M. <strong>Determ<strong>in</strong>ation</strong> <strong>of</strong> PCB <strong>in</strong> biota samples<br />
us<strong>in</strong>g simultaneous pressurized liquid extraction and purification.<br />
J. Chormatogr. A, 946, 209, 2002.<br />
2. Bordajandi L.R., Gomez G., Fernandez M.A.,<br />
Abad E., Rivera J., Gonzalez M. Study on <strong>PCBs</strong>,<br />
PCDD/Fs, organochlor<strong>in</strong>e pesticides, heavy metals and arsenic<br />
content <strong>in</strong> fresh water fish species from the River Turia<br />
(Spa<strong>in</strong>). Chemosphere 53, 163, 2003.<br />
3. Ross G. The public health implications <strong>of</strong> polychlor<strong>in</strong>ated<br />
biphenyls (<strong>PCBs</strong>) <strong>in</strong> the environment. Ecotoxicology and<br />
Environmental Safety, 59, 275, 2004.<br />
4. Voogt P., Wells D.E., Rautergardh L., Br<strong>in</strong>kman<br />
U.A.Th. Biological activity, determ<strong>in</strong>ation and occurence<br />
<strong>of</strong> planar, mono- and di-ortho <strong>PCBs</strong>. Intern. J. Environ.<br />
Anal. Chem., 40, 1, 1990.<br />
5. Sauv<strong>in</strong> J.J., de Alencastro L.F., Tarradellas<br />
J., Camenz<strong>in</strong>d R., Karlaganis G., Vuilleumier<br />
C. Comparison <strong>of</strong> four quantification methods for the determ<strong>in</strong>ation<br />
<strong>of</strong> Pcb <strong>in</strong> transformer oils. Fresenius J. Anal.<br />
Chem., 350, 555, 1994.<br />
6. Lulek J. Levels <strong>of</strong> polychlor<strong>in</strong>ated biphenyls <strong>in</strong> some<br />
waste motor and transformer oil from Poland. Chemosphere,<br />
37, 2021, 1998.<br />
7. Kocan A., Petrik J., Jursa S., Chovancowa J.,<br />
Drobna B. Environmental contam<strong>in</strong>ation with polychlor<strong>in</strong>ated<br />
biphenyls <strong>in</strong> the area <strong>of</strong> their form manufacture <strong>in</strong><br />
Slovakia. Chemosphere, 43, 595, 2001.<br />
8. Schantz S. L. Developmental neurotoxicity <strong>of</strong> <strong>PCBs</strong> <strong>in</strong><br />
humans: What do we know and where do we go from here?<br />
Neurotoxicology and Teratology, 18, 217, 1999.<br />
9. Abad E., Llerena J.J., Saulo J., Caixach J., Rivera<br />
J. Study on PCDDs/PCDFs and co-<strong>PCBs</strong> content<br />
<strong>in</strong> food samples from Catalonia (Spa<strong>in</strong>). Chemosphere, 46,<br />
1435, 2002.<br />
10. Gomara B., Fernandez M.A., Gonzales M.J.,<br />
Ramos L. J. Feasibility <strong>of</strong> gas chromatography-ion trap<br />
tandem mass spectrometry for the determ<strong>in</strong>ation <strong>of</strong> polychlor<strong>in</strong>ated<br />
biphenyls <strong>in</strong> food. Int. J. Sep. Sci., 29, 123,<br />
2006.<br />
11. EN 1528-1, Fatty <strong>Food</strong>. <strong>Determ<strong>in</strong>ation</strong> <strong>of</strong> Pesticides and<br />
PCB. General, Beuth Verlag, Berl<strong>in</strong> 1997.<br />
12. EN 1528-3, Fatty <strong>Food</strong>. <strong>Determ<strong>in</strong>ation</strong> <strong>of</strong> Pesticides and<br />
PCB, Clean-up Methods, Beuth Verlag, Berl<strong>in</strong> 1997.<br />
13. Sparr C., Bjorklund E. Analytical-scale microwaveassisted<br />
extraction. J. Chromatogr. A, 902, 227, 2000.<br />
14. Vetter W., Weichbrodt M., Hummert K., Glotz<br />
D., Luckas B., Comb<strong>in</strong>ed microwave-assisted extraction<br />
and gel permeation chromatography for the determ<strong>in</strong>ation<br />
<strong>of</strong> chlor<strong>in</strong>ated hydrocarbons <strong>in</strong> seal blubber and cod livers.<br />
Chemosphere, 37, 2439, 1998.<br />
15. Hawthorne S.B. Analytical-scale supercritical fluid extraction.<br />
Anal. Chem., 62, 633A, 1990.<br />
16. Smith R.M. Supercritical fluids <strong>in</strong> separation science-the<br />
dreams, the reality and the future. J. Chromatogr. A, 856, 83,<br />
1999.<br />
17. Richter B.E., Jones B.A., Ezelli J. L., Porter N.L.,<br />
Avdalovic N., Pohl C. Accelerated solvent extraction:<br />
a technique for sample preparation. Anal. Chem., 68, 1033,<br />
1996.<br />
18. Majors R.E. An overview <strong>of</strong> sample preparation. LC-GC<br />
Int., 4.10, 1991.
578<br />
19. Juan C.Y., Thomas G.O., Semple K.T., Jones K.C.<br />
Methods for the analysis <strong>of</strong> <strong>PCBs</strong> <strong>in</strong> human food, faeces and<br />
serum. Chemosphere, 39, 1467, 1999<br />
20. Lovett A.A., Foxal C.D., Creaser C.S., Chewe D.<br />
PCB and PCDD/DF congeners <strong>in</strong> locally grown fruit and<br />
vegetable samples <strong>in</strong> wales and England. Chemosphere, 34,<br />
1421, 1997.<br />
21. Wells D.E., Maier B., Griep<strong>in</strong>k B. Calibrants and<br />
Ligor T. et al.<br />
calibration for chlorobiphenyl analysis. Inter. J. Anal. Chem.,<br />
46, 255, 1992.<br />
22. Juan C.Y., Thomas G.O., Semple K.T., Jones K.C.<br />
Methods for determ<strong>in</strong>ation <strong>of</strong> <strong>PCBs</strong> <strong>in</strong> human food, faeces<br />
and serum. Chemosphere, 39, 1467, 1999.<br />
23. Frame G.M. A collaborative study <strong>of</strong> 209 PCB congeners<br />
and 6 Aroclors on 200 different HRGC columns. Fresenius<br />
J. Anal. Chem., 357, 714, 1997.