(1987) Seasonal Variation of Potentially Mineralizable Nitrogen in ...
(1987) Seasonal Variation of Potentially Mineralizable Nitrogen in ...
(1987) Seasonal Variation of Potentially Mineralizable Nitrogen in ...

Create successful ePaper yourself
Turn your PDF publications into a flip-book with our unique Google optimized e-Paper software.
BONDE & ROSSWALL: NITROGEN IN FOUR CROPPING SYSTEMS 1511<br />
Table 1. Total m<strong>in</strong>eral N produced dur<strong>in</strong>g a 13-week <strong>in</strong>cubation<br />
<strong>of</strong> top soil (0-27 cm) collected from four cropp<strong>in</strong>g systems<br />
at four sampl<strong>in</strong>g occasions.<br />
Sampl<strong>in</strong>g<br />
date<br />
21 April<br />
7 June<br />
7 August<br />
22 October<br />
Form <strong>of</strong><br />
m<strong>in</strong>eral N<br />
Total m<strong>in</strong>eral N<br />
(NO, + NOJ-N<br />
NH.-N<br />
Total m<strong>in</strong>eral N<br />
(NO, + NOJ-N<br />
NH.-N<br />
Total m<strong>in</strong>eral N<br />
(NO, + NOJ-N<br />
NH.-N<br />
Total m<strong>in</strong>eral N<br />
(NO, + NOJ-N<br />
NH 4 -N<br />
Cropp<strong>in</strong>g systemf<br />
BO B120 GL LL<br />
321adi<br />
190<br />
(120)§<br />
259ad<br />
117<br />
142<br />
188ae<br />
68<br />
121<br />
269ad<br />
140<br />
129<br />
Kg iia<br />
371abd 483cd<br />
232 338<br />
(139) (145)<br />
354bcde<br />
210<br />
144<br />
268abe<br />
119<br />
150<br />
SOOabde<br />
177<br />
124<br />
405cde<br />
255<br />
150<br />
330be<br />
185<br />
144<br />
364bde<br />
222<br />
141<br />
420bcd<br />
254<br />
(166)<br />
279abde<br />
104<br />
175<br />
255be<br />
89<br />
167<br />
299abde<br />
142<br />
157<br />
t BO = Barley without addition <strong>of</strong> N fertilizer; B120 = barley receiv<strong>in</strong>g<br />
120 kg N ha-' yr 1 ; GL = grass ley receiv<strong>in</strong>g 200 kg N ha' 1 yr 1 ; LL =<br />
lucerne ley receiv<strong>in</strong>g no N fertilization.<br />
t Means that do not differ significantly (p = 0.05) are followed by the same<br />
letter; a, b, c rows; d, e columns;<br />
§ An estimate based on the mean <strong>of</strong> the last three sampl<strong>in</strong>g dates.<br />
culated net m<strong>in</strong>eralization rates <strong>of</strong> 105, 128, 257, and<br />
211 kg ha~' yr- 1 for BO, B120, GL, and LL, respectively<br />
(Rosswall and Paustian, 1984). If N 0 is a def<strong>in</strong>able<br />
quantity and the only major source <strong>of</strong> m<strong>in</strong>eralizable<br />
N, a decrease <strong>in</strong> N 0 dur<strong>in</strong>g the grow<strong>in</strong>g season<br />
should equal the amount <strong>of</strong> N m<strong>in</strong>eralized. On a yearly<br />
basis this will, however, be an underestimation, s<strong>in</strong>ce<br />
autumn m<strong>in</strong>eralization is important despite an <strong>in</strong>crease<br />
<strong>in</strong> A^ due to addition <strong>of</strong> root litter and aboveground<br />
litter plowed under. In addition, our data<br />
probably underestimate net N m<strong>in</strong>eralization dur<strong>in</strong>g<br />
the grow<strong>in</strong>g season, s<strong>in</strong>ce the 13-week <strong>in</strong>cubations were<br />
too short to allow a statistically justifiable determ<strong>in</strong>ation<br />
<strong>of</strong> both N A and N R .<br />
Fertilizer N (120 kg) was applied on 16 May to the<br />
B120 and GL treatments, and the grass ley further<br />
received 80 kg <strong>of</strong> N on 2 July. Application <strong>of</strong> fertilizer<br />
N has been demonstrated to add to the m<strong>in</strong>eralizable<br />
soil N and, <strong>in</strong> particular, to the readily available pool<br />
<strong>of</strong> TV,, (El-Haris et al, 1983). Fertilization would then<br />
tend to prevent a decrease <strong>in</strong> the amount <strong>of</strong> m<strong>in</strong>eralizable<br />
N dur<strong>in</strong>g the grow<strong>in</strong>g season. To estimate net<br />
N m<strong>in</strong>eralization by a substrate disappearance method,<br />
it is thus necessary to take <strong>in</strong>to account possible additions<br />
to the substrate pool dur<strong>in</strong>g the period <strong>in</strong>vestigated.<br />
The amounts <strong>of</strong> organic N added through the system<br />
by root and aboveground litter <strong>in</strong>put have been<br />
estimated to be 40 and 55 kg ha~' yr" 1 for BO and<br />
B120, respectively (A.C. Hansson, 1986, personal<br />
communication). This amount is not sufficient to expla<strong>in</strong><br />
the observed <strong>in</strong>crease <strong>of</strong> the m<strong>in</strong>eralizable N<br />
fraction <strong>in</strong> BO from August to October (81 kg ha" 1 ).<br />
The larger amount might be caused by a period <strong>of</strong><br />
stimulated microbial activity after harvest, due to<br />
added C-rich crop residues, which would result <strong>in</strong><br />
greater immobilization <strong>of</strong> N and thus larger amounts<br />
<strong>of</strong> N <strong>in</strong> live and dead microbial cells and microbial<br />
metabolites (Campbell and Biederbeck, 1982). <strong>Nitrogen</strong><br />
<strong>in</strong> these forms are thought to be a large part <strong>of</strong><br />
the readily m<strong>in</strong>eralizable soil N (7V 0 ). This apparent<br />
5 6 7<br />
TIME (WEEKS)<br />
9 10 11 12 13<br />
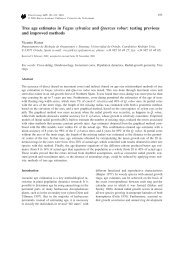
Fig. 2. Accumulated amounts <strong>of</strong> m<strong>in</strong>eralized N dur<strong>in</strong>g 13 weeks <strong>of</strong><br />
<strong>in</strong>cubation <strong>of</strong> soils collected from four cropp<strong>in</strong>g systems on 7 June.<br />
Error brackets denote accumulated standard deviation.<br />
rise <strong>in</strong> the active part <strong>of</strong> soil N took place dur<strong>in</strong>g a<br />
period with net m<strong>in</strong>eralization and total N loss from<br />
the system (Bergstrom, 1986). The net effect <strong>in</strong> the N<br />
transformations dur<strong>in</strong>g this period is thus a decrease<br />
<strong>of</strong> the slow fraction rather than the active one. The<br />
smaller <strong>in</strong>crease <strong>in</strong> the m<strong>in</strong>eralizable fraction <strong>in</strong> B120<br />
(32 kg), <strong>in</strong> spite <strong>of</strong> a larger amount <strong>of</strong> litter added to<br />
the system, is surpris<strong>in</strong>g, but may be caused by a greater<br />
net immobilization <strong>of</strong> m<strong>in</strong>eral N <strong>in</strong> these plots.<br />
Cumulative N M<strong>in</strong>eralization Patterns<br />
Patterns <strong>of</strong> cumulative N m<strong>in</strong>eralization from soil<br />
samples collected on 7 June are shown for all four<br />
treatments <strong>in</strong> Fig. 2. The shapes <strong>of</strong> the m<strong>in</strong>eralization<br />
curves for soil samples collected on the other three<br />
dates were very similar to those <strong>in</strong> Fig. 2 and are not<br />
shown. The <strong>in</strong>itially high rates <strong>of</strong> N m<strong>in</strong>eralization <strong>in</strong><br />
soil samples collected from all four treatments at all<br />
four dates decl<strong>in</strong>ed to low, fairly constant rates by<br />
week 6 (Fig. 1), result<strong>in</strong>g <strong>in</strong> the apparently l<strong>in</strong>ear <strong>in</strong>crease<br />
<strong>in</strong> total cumulative <strong>in</strong>organic N after about week<br />
4 (Fig. 2).<br />
Stanford and Smith (1972) calculated an <strong>in</strong>itial N 0<br />
value and the k value on the basis <strong>of</strong> the curve <strong>of</strong><br />
accumulated m<strong>in</strong>eralized N from week 2 to week 30.<br />
The m<strong>in</strong>eralized N dur<strong>in</strong>g the first 2 weeks was added<br />
to the <strong>in</strong>itially calculated N 0 value, giv<strong>in</strong>g the f<strong>in</strong>al 7V 0 .<br />
This was motivated by a poor model fit to the data<br />
set if the first 2 weeks were <strong>in</strong>cluded, which was probably<br />
a result <strong>of</strong> pretreatment <strong>of</strong> soil samples. Numerous<br />
reports on the effect <strong>of</strong> air dry<strong>in</strong>g, siev<strong>in</strong>g, gr<strong>in</strong>d<strong>in</strong>g,<br />
and rewett<strong>in</strong>g are available (e.g., Birch, 1960;<br />
Agarwal et al., 1970). Soils respond to dry<strong>in</strong>g and rewett<strong>in</strong>g<br />
with a flush <strong>of</strong> C and N m<strong>in</strong>eralization <strong>of</strong> short<br />
duration, the magnitude depend<strong>in</strong>g on soil characteristics.<br />
To overcome the problem <strong>of</strong> an <strong>in</strong>itially rapid<br />
m<strong>in</strong>eralization rate, a two-component model (a sum<br />
<strong>of</strong> two first-order equations; Mol<strong>in</strong>a et al., 1980; Griff<strong>in</strong><br />
and La<strong>in</strong>e, 1983), a three-component model (Richter<br />
et al., 1982), or a modified one-component model<br />
(Marion et al., 1981) have been used. These models