(1987) Seasonal Variation of Potentially Mineralizable Nitrogen in ...
(1987) Seasonal Variation of Potentially Mineralizable Nitrogen in ...
(1987) Seasonal Variation of Potentially Mineralizable Nitrogen in ...

Create successful ePaper yourself
Turn your PDF publications into a flip-book with our unique Google optimized e-Paper software.
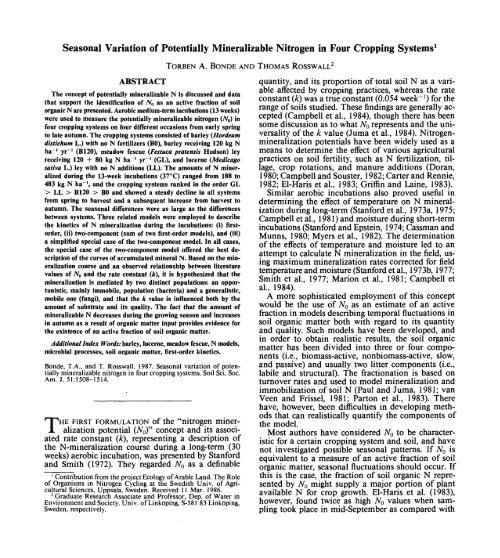
<strong>Seasonal</strong> <strong>Variation</strong> <strong>of</strong> <strong>Potentially</strong> <strong>M<strong>in</strong>eralizable</strong> <strong>Nitrogen</strong> <strong>in</strong> Four Cropp<strong>in</strong>g Systems 1<br />
ABSTRACT<br />
The concept <strong>of</strong> potentially m<strong>in</strong>eralizable N is discussed and data<br />
that support the identification <strong>of</strong> /V () as an active fraction <strong>of</strong> soil<br />
organic N are presented. Aerobic medium-term <strong>in</strong>cubations (13 weeks)<br />
were used to measure the potentially m<strong>in</strong>eralizable nitrogen (N a ) <strong>in</strong><br />
four cropp<strong>in</strong>g systems on four different occasions from early spr<strong>in</strong>g<br />
to late autumn. The cropp<strong>in</strong>g systems consisted <strong>of</strong> barley (Hordeum<br />
distichum L.) with no N fertilizers (BO), barley receiv<strong>in</strong>g 120 kg N<br />
ha~' yr~' (B120), meadow fescue (Festuca pratensis Hudson) ley<br />
receiv<strong>in</strong>g 120 + 80 kg N ha ~' yr~' (GL), and lucerne (Medicago<br />
sativa L.) ley with no N additions (LL). The amounts <strong>of</strong> N m<strong>in</strong>eralized<br />
dur<strong>in</strong>g the 13-week <strong>in</strong>cubations (37 °C) ranged from 188 to<br />
483 kg N ha ', and the cropp<strong>in</strong>g systems ranked <strong>in</strong> the order GL<br />
> LL > B120 > BO and showed a steady decl<strong>in</strong>e <strong>in</strong> all systems<br />
from spr<strong>in</strong>g to harvest and a subsequent <strong>in</strong>crease from harvest to<br />
autumn. The seasonal differences were as large as the differences<br />
between systems. Three related models were employed to describe<br />
the k<strong>in</strong>etics <strong>of</strong> N m<strong>in</strong>eralization dur<strong>in</strong>g the <strong>in</strong>cubations: (i) firstorder,<br />
(ii) two-component (sum <strong>of</strong> two first-order models), and (iii)<br />
a simplified special case <strong>of</strong> the two-component model. In all cases,<br />
the special case <strong>of</strong> the two-component model <strong>of</strong>fered the best description<br />
<strong>of</strong> the curves <strong>of</strong> accumulated m<strong>in</strong>eral N. Based on the m<strong>in</strong>eralization<br />
course and an observed relationship between literature<br />
values <strong>of</strong> /V 0 and the rate constant (k), it is hypothesized that the<br />
m<strong>in</strong>eralization is mediated by two dist<strong>in</strong>ct populations: an opportunistic,<br />
ma<strong>in</strong>ly immobile, population (bacteria) and a generalistic,<br />
mobile one (fungi), and that the k value is <strong>in</strong>fluenced both by the<br />
amount <strong>of</strong> substrate and its quality. The fact that the amount <strong>of</strong><br />
m<strong>in</strong>eralizable N decreases dur<strong>in</strong>g the grow<strong>in</strong>g season and <strong>in</strong>creases<br />
<strong>in</strong> autumn as a result <strong>of</strong> organic matter <strong>in</strong>put provides evidence for<br />
the existence <strong>of</strong> an active fraction <strong>of</strong> soil organic matter.<br />
Additional Index Words: barley, lucerne, meadow fescue, N models,<br />
microbial processes, soil organic matter, first-order k<strong>in</strong>etics.<br />
Bonde, T.A., and T. Rosswall. <strong>1987</strong>. <strong>Seasonal</strong> variation <strong>of</strong> potentially<br />
m<strong>in</strong>eralizable nitrogen <strong>in</strong> four cropp<strong>in</strong>g systems. Soil Sci. Soc.<br />
Am. J. 51:1508-1514.<br />
THE FIRST FORMULATION <strong>of</strong> the "nitrogen m<strong>in</strong>eralization<br />
potential C/V 0 )" concept and its associated<br />
rate constant (k), represent<strong>in</strong>g a description <strong>of</strong><br />
the N-m<strong>in</strong>eralization course dur<strong>in</strong>g a long-term (30<br />
weeks) aerobic <strong>in</strong>cubation, was presented by Stanford<br />
and Smith (1972). They regarded N Q as a def<strong>in</strong>able<br />
1<br />
Contribution from the project Ecology <strong>of</strong> Arable Land. The Role<br />
<strong>of</strong> Organisms <strong>in</strong> <strong>Nitrogen</strong> Cycl<strong>in</strong>g at the Swedish Univ. <strong>of</strong> Agricultural<br />
Sciences, Uppsala, Sweden. Received 11 Mar. 1986.<br />
2 Graduate Research Associate and Pr<strong>of</strong>essor, Dep. <strong>of</strong> Water <strong>in</strong><br />
Environment and Society, Univ. <strong>of</strong> L<strong>in</strong>kop<strong>in</strong>g, S-581 83 L<strong>in</strong>kop<strong>in</strong>g,<br />
Sweden, respectively.<br />
TORBEN A. BONDE AND THOMAS ROSSWALL 2<br />
quantity, and its proportion <strong>of</strong> total soil N as a variable<br />
affected by cropp<strong>in</strong>g practices, whereas the rate<br />
constant (k) was a true constant (0.054 week"') for the<br />
range <strong>of</strong> soils studied. These f<strong>in</strong>d<strong>in</strong>gs are generally accepted<br />
(Campbell et al., 1984), though there has been<br />
some discussion as to what N 0 represents and the universality<br />
<strong>of</strong> the k value (Juma et al., 1984). <strong>Nitrogen</strong>m<strong>in</strong>eralization<br />
potentials have been widely used as a<br />
means to determ<strong>in</strong>e the effect <strong>of</strong> various agricultural<br />
practices on soil fertility, such as N fertilization, tillage,<br />
crop rotations, and manure additions (Doran,<br />
1980; Campbell and Souster, 1982; Carter and Rennie,<br />
1982; El-Haris et al., 1983; Griff<strong>in</strong> and La<strong>in</strong>e, 1983).<br />
Similar aerobic <strong>in</strong>cubations also proved useful <strong>in</strong><br />
determ<strong>in</strong><strong>in</strong>g the effect pf temperature on N m<strong>in</strong>eralization<br />
dur<strong>in</strong>g long-term (Stanford et al., 1973a, 1975;<br />
Campbell et al., 1981) and moisture dur<strong>in</strong>g short-term<br />
<strong>in</strong>cubations (Stanford and Epste<strong>in</strong>, 1974; Cassman and<br />
Munns, 1980; Myers et al., 1982). The determ<strong>in</strong>ation<br />
<strong>of</strong> the effects <strong>of</strong> temperature and moisture led to an<br />
attempt to calculate N m<strong>in</strong>eralization <strong>in</strong> the field, us<strong>in</strong>g<br />
maximum m<strong>in</strong>eralization rates corrected for field<br />
temperature and moisture (Stanford et al., 1973b, 1977;<br />
Smith et al., 1977; Marion et al., 1981; Campbell et<br />
al., 1984).<br />
A more sophisticated employment <strong>of</strong> this concept<br />
would be the use <strong>of</strong> N 0 as an estimate <strong>of</strong> an active<br />
fraction <strong>in</strong> models describ<strong>in</strong>g temporal fluctuations <strong>in</strong><br />
soil organic matter both with regard to its quantity<br />
and quality. Such models have been developed, and<br />
<strong>in</strong> order to obta<strong>in</strong> realistic results, the soil organic<br />
matter has been divided <strong>in</strong>to three or four components<br />
(i.e., biomass-active, nonbiomass-active, slow,<br />
and passive) and usually two litter components (i.e.,<br />
labile and structural). The fractionation is based on<br />
turnover rates and used to model m<strong>in</strong>eralization and<br />
immobilization <strong>of</strong> soil N (Paul and Juma, 1981; van<br />
Veen and Frissel, 1981; Parton et al., 1983). There<br />
have, however, been difficulties <strong>in</strong> develop<strong>in</strong>g methods<br />
that can realistically quantify the components <strong>of</strong><br />
the model.<br />
Most authors have considered N 0 to be characteristic<br />
for a certa<strong>in</strong> cropp<strong>in</strong>g system and soil, and have<br />
not <strong>in</strong>vestigated possible seasonal patterns. If N Q is<br />
equivalent to a measure <strong>of</strong> an active fraction <strong>of</strong> soil<br />
organic matter, seasonal fluctuations should occur. If<br />
this is the case, the fraction <strong>of</strong> soil organic N represented<br />
by N 0 might supply a major portion <strong>of</strong> plant<br />
available N for crop growth. El-Haris et al. (1983),<br />
however, found twice as high N 0 values when sampl<strong>in</strong>g<br />
took place <strong>in</strong> mid-September as compared with
BONDE & ROSSWALL: NITROGEN IN FOUR CROPPING SYSTEMS 1509<br />
sampl<strong>in</strong>g <strong>in</strong> mid-March. The spr<strong>in</strong>g k values were a<br />
factor three higher than those from the autumn. Stanford<br />
et al. (1977) calculated a 20% reduction <strong>in</strong> N 0<br />
from April to September for a number <strong>of</strong> soils, but<br />
neither publication has analyzed the seasonal variation<br />
<strong>in</strong> any detail.<br />
The present study was conducted to (i) <strong>in</strong>vestigate<br />
whether N 0 could be considered a representative <strong>of</strong> an<br />
active fraction <strong>of</strong> soil organic matter, (ii) <strong>in</strong>vestigate<br />
whether the first-order k<strong>in</strong>etics represent a correct description<br />
<strong>of</strong> the m<strong>in</strong>eralization course, and (iii) <strong>in</strong>terpret<br />
the biological implications <strong>of</strong> the NQ concept based<br />
on the m<strong>in</strong>eralization course and published values <strong>of</strong><br />
NQ and k.<br />
MATERIALS AND METHODS<br />
Soils and Sampl<strong>in</strong>g<br />
Soil was collected from field experiments <strong>of</strong> the Ecology<br />
<strong>of</strong> Arable Land project, the research site <strong>of</strong> which is located<br />
at Kjettsl<strong>in</strong>ge, 40-km north <strong>of</strong> Uppsala, Sweden. The field<br />
is situated <strong>in</strong> a flatland area 25-m above sea level. It had<br />
been cropped for ca. 100 yr before <strong>in</strong>itiation <strong>of</strong> the experiment<br />
<strong>in</strong> 1980. The climate is cold-temperate and semihumid.<br />
Mean annual precipitation is 520 mm with the highest<br />
precipitation <strong>in</strong> August (70 mm). Mean annual<br />
temperature is 5.4 °C and monthly mean temperatures are<br />
— 5.3 and 16.7 °C for January and July, respectively (Steen<br />
et al., 1984). The top soil is a loam (Cumulic Haploboroll,<br />
illitic, frigid. USDA, Soil Survey Staff, 1975) with 19% clay,<br />
a pH <strong>of</strong> 6.3, and total C and N contents <strong>of</strong> 22 and 2.3 g<br />
kg~', respectively, at the start <strong>of</strong> the experiment. Detailed<br />
description <strong>of</strong> the experimental site is given by Steen et al.<br />
(1984).<br />
Four cropp<strong>in</strong>g systems were <strong>in</strong>vestigated: barley (Hordeum<br />
distichum L.) with no addition <strong>of</strong> N fertilizers (BO);<br />
barley receiv<strong>in</strong>g 120 kg N ha~' yr~' as Ca(NO 3 ) 2 (B120) on<br />
16 May 1984; meadow fescue (Festuca pratensis L.) ley receiv<strong>in</strong>g<br />
120 and 80 kg N ha -' yr~' (GL) on 16 May and 2<br />
July, respectively; and lucerne (Medicago saliva L.) ley without<br />
N fertilizer additions (LL).<br />
Each treatment had four replicates. From each <strong>in</strong>dividual<br />
plot, two soil cores were taken to a depth <strong>of</strong> 27 cm (plough<br />
layer) on 21 Apr., 7 June, 7 Aug., and 22 Oct. 1984. The<br />
samples were air-dried, mixed, and sieved (2 mm) to produce<br />
a replicate sample from each treatment.<br />
<strong>Nitrogen</strong>-m<strong>in</strong>eralization Procedure<br />
The apparatus employed <strong>in</strong> this study was similar to the<br />
one used by MacKay and Carefoot (1981), i.e., polystyrene<br />
filter units (150 mL; Filter unit 7103, Falcon, Oxnard, CA,<br />
USA) fitted with cellulose based filter membranes <strong>of</strong> 0.22-<br />
jum pore size with a bubbl<strong>in</strong>g po<strong>in</strong>t pressure (380 kPa) well<br />
above the applied suction (80 kPa).<br />
Soil subsamples (15 g) were mixed with equal amounts <strong>of</strong><br />
washed sand (0.6-mm mean gra<strong>in</strong> size) and rewetted with 3<br />
mL <strong>of</strong> distilled water followed by gentle mix<strong>in</strong>g. The mixtures<br />
were transferred to the filter units and covered by two<br />
layers <strong>of</strong> nylon nets (1-mm mesh size), and dur<strong>in</strong>g the leach<strong>in</strong>g<br />
procedure by a 2-cm layer <strong>of</strong> glass-wool pads held together<br />
by two layers <strong>of</strong> nylon net. The glasswool protected<br />
the soil from disaggregation dur<strong>in</strong>g leach<strong>in</strong>g. The leach<strong>in</strong>g<br />
solution consisted <strong>of</strong> 100-mL 0.01 MCaCl 2 , followed by 25-<br />
mL m<strong>in</strong>us-N nutrient solution (Stanford and Smith, 1972).<br />
In an <strong>in</strong>itial experiment, the 5-mL successive additions <strong>of</strong><br />
extractant recommended by Stanford and Smith (1972) dispersed<br />
the soil, and, <strong>in</strong> the end, partly clogged the filters.<br />
Such clogg<strong>in</strong>g would lead to erroneous moisture adjustments.<br />
To prevent this, a simple drip irrigation system was<br />
constructed consist<strong>in</strong>g <strong>of</strong> 150-mL funnels connected with<br />
the top center <strong>of</strong> the filter units. The tub<strong>in</strong>gs were fitted with<br />
clamps for dripp<strong>in</strong>g rate adjustment. A vacuum pump was<br />
connected to a manometer and through manifolds to the<br />
filter units. A leach<strong>in</strong>g rate <strong>of</strong> 250 mL h~' and a consistent<br />
suction <strong>of</strong> 80 kPa (600-mm Hg), extended by 15 m<strong>in</strong> after<br />
the end <strong>of</strong> leach<strong>in</strong>g, conserved soil structure and prevented<br />
filter clogg<strong>in</strong>g. This procedure ensured water contents close<br />
to optimum (20% <strong>of</strong> soil plus sand dry weight; Munro and<br />
MacKay, 1964; Keeney and Bremner, 1966). MacKay and<br />
Carefoot (1981) recommended an "overnight" procedure for<br />
adjust<strong>in</strong>g soil moisture, but a stable water content was<br />
reached almost immediately after leach<strong>in</strong>g, probably due to<br />
the sand amendments. The soil samples were <strong>in</strong>cubated at<br />
37 °C and leached 0, 1, 2, 3, 4, 6, 8, 10, and 13 weeks after<br />
the start <strong>of</strong> the experiment.<br />
Chemical Analyses<br />
M<strong>in</strong>eral N (NH 4 , NO 2 , and NO 3 ) was determ<strong>in</strong>ed by flow<br />
<strong>in</strong>jection analysis us<strong>in</strong>g an automated FIA 06 (Tecator AB,<br />
Hoganas, Sweden). Organic N <strong>in</strong> the leachates was measured<br />
accord<strong>in</strong>g to Jaenicke (1974) after perchlorate digestion.<br />
M<strong>in</strong>eralization Models<br />
The first-order model (Stanford and Smith, 1972) is represented<br />
<strong>in</strong> product-appearance form as follows:<br />
N m = N 0 [l - exp(-M] [1]<br />
where N m is the amount <strong>of</strong> N m<strong>in</strong>eralized at time t, N 0 is<br />
the <strong>in</strong>itial amount <strong>of</strong> potentially m<strong>in</strong>eralizable N, and k^ is<br />
the first-order rate constant. Because different fractions <strong>of</strong><br />
the organic N <strong>in</strong> the soil may be differentially susceptible to<br />
m<strong>in</strong>eralization, the first-order model is sometimes modified<br />
to a two-component model<br />
N m = N A [l - exp(-/2f)] + N R (l - [2]<br />
where Nj and NK are the amounts <strong>of</strong> organic N <strong>in</strong>itially<br />
present <strong>in</strong> the available and resistant fractions, respectively,<br />
and h and k are the first-order rate constants for the two<br />
fractions. The sum <strong>of</strong> N. t plus N R equals N 0 or N A = N&S<br />
where 5 is the fraction <strong>of</strong> N 0 belong<strong>in</strong>g to the available pool<br />
(L<strong>in</strong>deman and Cardenas, 1984). A model <strong>in</strong>termediate <strong>in</strong><br />
complexity between Eq. [1] and [2] can be derived as a special<br />
case, or as a degenerate form, from Eq. [2]<br />
N m = N A [\ - exp(-/zO] + Ct [3]<br />
where C = kN R . Equations [1], [2] and [3] were the models<br />
for N m<strong>in</strong>eralization evaluated <strong>in</strong> this study.<br />
Statistical Analysis<br />
The three models were fit to data on N m<strong>in</strong>eralization by<br />
nonl<strong>in</strong>ear regression us<strong>in</strong>g the method <strong>of</strong> Marquardt <strong>in</strong> the<br />
SAS (SAS Inst., 1982) s<strong>of</strong>tware package. The model <strong>of</strong>fer<strong>in</strong>g<br />
the most appropriate description <strong>of</strong> the data was selected on<br />
the basis <strong>of</strong> the residual sum <strong>of</strong> squares (RSS) left unexpla<strong>in</strong>ed<br />
by the regression. However, the model leav<strong>in</strong>g the<br />
lowest RSS was not always selected as the most justifiable.<br />
Because Eq. [3] is merely a special case <strong>of</strong> the two-component<br />
model (Eq. [2]), the latter will never leave an RSS higher<br />
than that <strong>of</strong> Eq. [3]. The first-order model can also be regarded<br />
as an approximation <strong>of</strong> Eq. [2], applicable <strong>in</strong> situations<br />
when either N R or k are effectively zero. Consequently,<br />
the first-order model could not be expected to leave a lower<br />
RSS than Eq. [3]. Therefore, the significance <strong>of</strong> the difference<br />
<strong>of</strong> the RSS left by the three models was subjected to an F<br />
test as described by Rob<strong>in</strong>son (1985).
1510 SOIL SCI. SOC. AM. J., VOL 51, <strong>1987</strong><br />
25-i<br />
_20-<br />
1 2 3 4 5 6 7<br />
TIME (WEEKS)<br />
1 2 3 4 5 6 7<br />
TIME (WEEKS)<br />
9 10 11 12 13<br />
10 11 12 13<br />
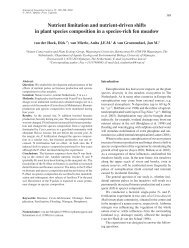
Fig. 1. Rate <strong>of</strong> N m<strong>in</strong>eralization dur<strong>in</strong>g 13 weeks <strong>of</strong> <strong>in</strong>cubation <strong>of</strong><br />
soils sampled from the grass ley (GL) cropp<strong>in</strong>g system on 7 June<br />
and 7 August. The horizontal bars represent the time period for<br />
which rates were calculated. The solid l<strong>in</strong>e represents GL 7 June<br />
and the broken l<strong>in</strong>e represents GL 7 August.<br />
RESULTS AND DISCUSSION<br />
M<strong>in</strong>eralization Rates<br />
An example <strong>of</strong> the weekly m<strong>in</strong>eral-N production rate<br />
dur<strong>in</strong>g the actual <strong>in</strong>cubation period is presented <strong>in</strong><br />
Fig. 1. In all cases, the (NO 3 + NO 2 )-N production<br />
rate decl<strong>in</strong>ed rapidly to about 10% <strong>of</strong> the <strong>in</strong>itial rate<br />
dur<strong>in</strong>g weeks 10 to 13, but <strong>in</strong> some cases there was<br />
no decl<strong>in</strong>e between weeks 3 and 4. The NH 4 -N production<br />
rate showed a sharp decl<strong>in</strong>e from week 1 (4<br />
mg kg" 1 week" 1 ) to very low levels dur<strong>in</strong>g weeks 2<br />
and 3 (1 mg kg~' week^ ')> then a rapid <strong>in</strong>crease dur<strong>in</strong>g<br />
week 4, followed by a level<strong>in</strong>g <strong>of</strong>f throughout the rest<br />
<strong>of</strong> the <strong>in</strong>cubation period. Standard error <strong>of</strong> means<br />
amounted to 8 to 12% <strong>of</strong> total m<strong>in</strong>eralized N on leach<strong>in</strong>gs<br />
performed at weeks 1 to 2, but decl<strong>in</strong>ed to 2 to<br />
5% on subsequent leach<strong>in</strong>gs, result<strong>in</strong>g <strong>in</strong> a cumulated<br />
standard error <strong>of</strong> 3 to 6% <strong>of</strong> cumulated m<strong>in</strong>eralized<br />
N. The error was ma<strong>in</strong>ly caused by low amounts <strong>of</strong><br />
m<strong>in</strong>eral N <strong>in</strong> a few replicates. The amounts <strong>of</strong> organic-<br />
N <strong>in</strong> the leachates were 10 to 20% <strong>of</strong> <strong>in</strong>organic N as<br />
measured on the <strong>in</strong>itial leach<strong>in</strong>gs. This was not further<br />
analyzed and excluded from the follow<strong>in</strong>g calculations.<br />
Future studies us<strong>in</strong>g this methodology should,<br />
however, <strong>in</strong>clude analyses <strong>of</strong> organic N s<strong>in</strong>ce we do<br />
not know if its proportion to total N <strong>in</strong> the leachate<br />
rema<strong>in</strong>s constant over time.<br />
Nitrate plus NO 2 -N constituted 80% <strong>of</strong> the total<br />
m<strong>in</strong>eral N <strong>in</strong> week 1, <strong>in</strong>creas<strong>in</strong>g to 90% <strong>in</strong> week 2,<br />
followed by a gradual decrease to 15 to 20% <strong>in</strong> week<br />
13 (Fig. 1). The reason for this shift from NO 3 as the<br />
major form <strong>of</strong> <strong>in</strong>organic N may be related to the general<br />
f<strong>in</strong>d<strong>in</strong>g that the temperature optimum for nitrification<br />
is very close to 35 °C (Bremner, 1965). Lower<br />
optima (20 °C) have been reported (Malhi and McGill,<br />
1982). In a number <strong>of</strong> temperate soils, Keeney and<br />
Bremner (1966) found a complete shift <strong>in</strong> the appearance<br />
<strong>of</strong> m<strong>in</strong>eral N <strong>in</strong> favor <strong>of</strong> NH 4 when the <strong>in</strong>cubation<br />
temperature was changed from 35 to 40 °C. P.<br />
Berg (1986, personal communication) did not, however,<br />
f<strong>in</strong>d 37 °C to be suboptimal for nitrification rates<br />
on the same soil as we used. The <strong>in</strong>cubation temperature<br />
<strong>of</strong> 37 °C could be slightly above optimum for<br />
nitrification and cause the <strong>in</strong>complete conversion <strong>of</strong><br />
NH 4 to NO 3 . This temperature was, however, preferred<br />
to decrease length <strong>of</strong> <strong>in</strong>cubation time. Temperature<br />
optima for m<strong>in</strong>eralization is not likely to be <<br />
37 °C (Myers, 1975). Therefore, m<strong>in</strong>eralization rates<br />
were probably not affected negatively by the <strong>in</strong>cubation<br />
conditions.<br />
As the aggregate size did not exceed 2 mm and the<br />
size <strong>of</strong> the <strong>in</strong>dividual sample was small, it did not<br />
seem likely that anaerobic conditions <strong>in</strong>hibited m<strong>in</strong>eralization<br />
or nitrification due to restricted O 2 diffusion<br />
<strong>in</strong>to aggregates (Sexstone et al., 1985) or that it<br />
caused significant denitrification.<br />
The Amount <strong>of</strong> M<strong>in</strong>eral N Produced dur<strong>in</strong>g a 13-<br />
week Incubation<br />
The amounts <strong>of</strong> N m<strong>in</strong>eralized from the samples<br />
collected <strong>in</strong> April were equal to 321, 371, 483, and 420<br />
kg ha" 1 for BO, B120, GL, and LL, respectively (Table<br />
1). The percentage <strong>of</strong> m<strong>in</strong>eralized N to total organic<br />
N was 4.2, 3.6, 5.0, and 4.8%. This can be compared<br />
with the estimate by Paul (1984), that the microbial<br />
biomass accounts for 4 to 6% <strong>of</strong> total organic N,<br />
whereas the active nonbiomass fraction accounts for<br />
6 to 10% <strong>of</strong> total organic N.<br />
The highest amount <strong>of</strong> m<strong>in</strong>eral N was produced <strong>in</strong><br />
soils from the grass ley irrespective <strong>of</strong> sampl<strong>in</strong>g date<br />
(Table 1). The lucerne ley, which fixed 291 kg N ha~'<br />
<strong>in</strong> 1983 (Wivstad et al., 1986), suffered from an unusually<br />
cold w<strong>in</strong>ter <strong>in</strong> 1983 to 1984 and only managed<br />
to partially recover dur<strong>in</strong>g the grow<strong>in</strong>g season, which<br />
is probably the cause for the relatively low m<strong>in</strong>eralization<br />
<strong>in</strong> samples collected <strong>in</strong> June and August. The<br />
results, thus, cannot be considered representative <strong>of</strong><br />
legume leys.<br />
The <strong>in</strong>fluence <strong>of</strong> fertilization and cropp<strong>in</strong>g practices<br />
on the amounts <strong>of</strong> m<strong>in</strong>eralizable N is <strong>in</strong> accordance<br />
with the f<strong>in</strong>d<strong>in</strong>gs <strong>of</strong> Stanford and Smith (1972), Doran<br />
(1980), and El-Haris et al. (1983). Increas<strong>in</strong>g additions<br />
<strong>of</strong> organic matter and N fertilizer <strong>in</strong>creases the m<strong>in</strong>eralization<br />
potentials and the proportion <strong>of</strong> total N<br />
present <strong>in</strong> the more available form <strong>of</strong> soil N.<br />
The decrease <strong>in</strong> m<strong>in</strong>eralized N from April to August<br />
was 133, 103, 153, and 165 kg ha~' for BO, B120, GL,<br />
and LL, respectively (Table 1), which is similar to cal-
BONDE & ROSSWALL: NITROGEN IN FOUR CROPPING SYSTEMS 1511<br />
Table 1. Total m<strong>in</strong>eral N produced dur<strong>in</strong>g a 13-week <strong>in</strong>cubation<br />
<strong>of</strong> top soil (0-27 cm) collected from four cropp<strong>in</strong>g systems<br />
at four sampl<strong>in</strong>g occasions.<br />
Sampl<strong>in</strong>g<br />
date<br />
21 April<br />
7 June<br />
7 August<br />
22 October<br />
Form <strong>of</strong><br />
m<strong>in</strong>eral N<br />
Total m<strong>in</strong>eral N<br />
(NO, + NOJ-N<br />
NH.-N<br />
Total m<strong>in</strong>eral N<br />
(NO, + NOJ-N<br />
NH.-N<br />
Total m<strong>in</strong>eral N<br />
(NO, + NOJ-N<br />
NH.-N<br />
Total m<strong>in</strong>eral N<br />
(NO, + NOJ-N<br />
NH 4 -N<br />
Cropp<strong>in</strong>g systemf<br />
BO B120 GL LL<br />
321adi<br />
190<br />
(120)§<br />
259ad<br />
117<br />
142<br />
188ae<br />
68<br />
121<br />
269ad<br />
140<br />
129<br />
Kg iia<br />
371abd 483cd<br />
232 338<br />
(139) (145)<br />
354bcde<br />
210<br />
144<br />
268abe<br />
119<br />
150<br />
SOOabde<br />
177<br />
124<br />
405cde<br />
255<br />
150<br />
330be<br />
185<br />
144<br />
364bde<br />
222<br />
141<br />
420bcd<br />
254<br />
(166)<br />
279abde<br />
104<br />
175<br />
255be<br />
89<br />
167<br />
299abde<br />
142<br />
157<br />
t BO = Barley without addition <strong>of</strong> N fertilizer; B120 = barley receiv<strong>in</strong>g<br />
120 kg N ha-' yr 1 ; GL = grass ley receiv<strong>in</strong>g 200 kg N ha' 1 yr 1 ; LL =<br />
lucerne ley receiv<strong>in</strong>g no N fertilization.<br />
t Means that do not differ significantly (p = 0.05) are followed by the same<br />
letter; a, b, c rows; d, e columns;<br />
§ An estimate based on the mean <strong>of</strong> the last three sampl<strong>in</strong>g dates.<br />
culated net m<strong>in</strong>eralization rates <strong>of</strong> 105, 128, 257, and<br />
211 kg ha~' yr- 1 for BO, B120, GL, and LL, respectively<br />
(Rosswall and Paustian, 1984). If N 0 is a def<strong>in</strong>able<br />
quantity and the only major source <strong>of</strong> m<strong>in</strong>eralizable<br />
N, a decrease <strong>in</strong> N 0 dur<strong>in</strong>g the grow<strong>in</strong>g season<br />
should equal the amount <strong>of</strong> N m<strong>in</strong>eralized. On a yearly<br />
basis this will, however, be an underestimation, s<strong>in</strong>ce<br />
autumn m<strong>in</strong>eralization is important despite an <strong>in</strong>crease<br />
<strong>in</strong> A^ due to addition <strong>of</strong> root litter and aboveground<br />
litter plowed under. In addition, our data<br />
probably underestimate net N m<strong>in</strong>eralization dur<strong>in</strong>g<br />
the grow<strong>in</strong>g season, s<strong>in</strong>ce the 13-week <strong>in</strong>cubations were<br />
too short to allow a statistically justifiable determ<strong>in</strong>ation<br />
<strong>of</strong> both N A and N R .<br />
Fertilizer N (120 kg) was applied on 16 May to the<br />
B120 and GL treatments, and the grass ley further<br />
received 80 kg <strong>of</strong> N on 2 July. Application <strong>of</strong> fertilizer<br />
N has been demonstrated to add to the m<strong>in</strong>eralizable<br />
soil N and, <strong>in</strong> particular, to the readily available pool<br />
<strong>of</strong> TV,, (El-Haris et al, 1983). Fertilization would then<br />
tend to prevent a decrease <strong>in</strong> the amount <strong>of</strong> m<strong>in</strong>eralizable<br />
N dur<strong>in</strong>g the grow<strong>in</strong>g season. To estimate net<br />
N m<strong>in</strong>eralization by a substrate disappearance method,<br />
it is thus necessary to take <strong>in</strong>to account possible additions<br />
to the substrate pool dur<strong>in</strong>g the period <strong>in</strong>vestigated.<br />
The amounts <strong>of</strong> organic N added through the system<br />
by root and aboveground litter <strong>in</strong>put have been<br />
estimated to be 40 and 55 kg ha~' yr" 1 for BO and<br />
B120, respectively (A.C. Hansson, 1986, personal<br />
communication). This amount is not sufficient to expla<strong>in</strong><br />
the observed <strong>in</strong>crease <strong>of</strong> the m<strong>in</strong>eralizable N<br />
fraction <strong>in</strong> BO from August to October (81 kg ha" 1 ).<br />
The larger amount might be caused by a period <strong>of</strong><br />
stimulated microbial activity after harvest, due to<br />
added C-rich crop residues, which would result <strong>in</strong><br />
greater immobilization <strong>of</strong> N and thus larger amounts<br />
<strong>of</strong> N <strong>in</strong> live and dead microbial cells and microbial<br />
metabolites (Campbell and Biederbeck, 1982). <strong>Nitrogen</strong><br />
<strong>in</strong> these forms are thought to be a large part <strong>of</strong><br />
the readily m<strong>in</strong>eralizable soil N (7V 0 ). This apparent<br />
5 6 7<br />
TIME (WEEKS)<br />
9 10 11 12 13<br />
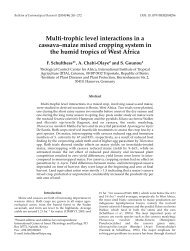
Fig. 2. Accumulated amounts <strong>of</strong> m<strong>in</strong>eralized N dur<strong>in</strong>g 13 weeks <strong>of</strong><br />
<strong>in</strong>cubation <strong>of</strong> soils collected from four cropp<strong>in</strong>g systems on 7 June.<br />
Error brackets denote accumulated standard deviation.<br />
rise <strong>in</strong> the active part <strong>of</strong> soil N took place dur<strong>in</strong>g a<br />
period with net m<strong>in</strong>eralization and total N loss from<br />
the system (Bergstrom, 1986). The net effect <strong>in</strong> the N<br />
transformations dur<strong>in</strong>g this period is thus a decrease<br />
<strong>of</strong> the slow fraction rather than the active one. The<br />
smaller <strong>in</strong>crease <strong>in</strong> the m<strong>in</strong>eralizable fraction <strong>in</strong> B120<br />
(32 kg), <strong>in</strong> spite <strong>of</strong> a larger amount <strong>of</strong> litter added to<br />
the system, is surpris<strong>in</strong>g, but may be caused by a greater<br />
net immobilization <strong>of</strong> m<strong>in</strong>eral N <strong>in</strong> these plots.<br />
Cumulative N M<strong>in</strong>eralization Patterns<br />
Patterns <strong>of</strong> cumulative N m<strong>in</strong>eralization from soil<br />
samples collected on 7 June are shown for all four<br />
treatments <strong>in</strong> Fig. 2. The shapes <strong>of</strong> the m<strong>in</strong>eralization<br />
curves for soil samples collected on the other three<br />
dates were very similar to those <strong>in</strong> Fig. 2 and are not<br />
shown. The <strong>in</strong>itially high rates <strong>of</strong> N m<strong>in</strong>eralization <strong>in</strong><br />
soil samples collected from all four treatments at all<br />
four dates decl<strong>in</strong>ed to low, fairly constant rates by<br />
week 6 (Fig. 1), result<strong>in</strong>g <strong>in</strong> the apparently l<strong>in</strong>ear <strong>in</strong>crease<br />
<strong>in</strong> total cumulative <strong>in</strong>organic N after about week<br />
4 (Fig. 2).<br />
Stanford and Smith (1972) calculated an <strong>in</strong>itial N 0<br />
value and the k value on the basis <strong>of</strong> the curve <strong>of</strong><br />
accumulated m<strong>in</strong>eralized N from week 2 to week 30.<br />
The m<strong>in</strong>eralized N dur<strong>in</strong>g the first 2 weeks was added<br />
to the <strong>in</strong>itially calculated N 0 value, giv<strong>in</strong>g the f<strong>in</strong>al 7V 0 .<br />
This was motivated by a poor model fit to the data<br />
set if the first 2 weeks were <strong>in</strong>cluded, which was probably<br />
a result <strong>of</strong> pretreatment <strong>of</strong> soil samples. Numerous<br />
reports on the effect <strong>of</strong> air dry<strong>in</strong>g, siev<strong>in</strong>g, gr<strong>in</strong>d<strong>in</strong>g,<br />
and rewett<strong>in</strong>g are available (e.g., Birch, 1960;<br />
Agarwal et al., 1970). Soils respond to dry<strong>in</strong>g and rewett<strong>in</strong>g<br />
with a flush <strong>of</strong> C and N m<strong>in</strong>eralization <strong>of</strong> short<br />
duration, the magnitude depend<strong>in</strong>g on soil characteristics.<br />
To overcome the problem <strong>of</strong> an <strong>in</strong>itially rapid<br />
m<strong>in</strong>eralization rate, a two-component model (a sum<br />
<strong>of</strong> two first-order equations; Mol<strong>in</strong>a et al., 1980; Griff<strong>in</strong><br />
and La<strong>in</strong>e, 1983), a three-component model (Richter<br />
et al., 1982), or a modified one-component model<br />
(Marion et al., 1981) have been used. These models
1512 SOIL SCI. SOC. AM. J., VOL 51, <strong>1987</strong><br />
give good data fit, but are <strong>of</strong>ten not based on attempts<br />
to understand the underly<strong>in</strong>g biological mechanisms.<br />
The first-order and two-component models, <strong>in</strong>clud<strong>in</strong>g<br />
the simplified special case <strong>of</strong> the latter, were fit by<br />
nonl<strong>in</strong>ear regression to the data on soils from all four<br />
treatments on three <strong>of</strong> the four collection dates. The<br />
first sampl<strong>in</strong>g date was omitted due to difficulties <strong>in</strong><br />
NH 4 analyses (Table 1), and the data from this set <strong>of</strong><br />
samples were not used <strong>in</strong> the statistical analyses. The<br />
first-order model (Eq. [1]) never <strong>of</strong>fered as close a fit<br />
to the data as the special case <strong>of</strong> the two-component<br />
model (Eq. [3]). The latter always gave a statistically<br />
significant reduction <strong>in</strong> RSS over the variance left<br />
unexpla<strong>in</strong>ed by the first-order model. Moreover, the<br />
residuals left by fits <strong>of</strong> the first-order model were highly<br />
nonrandom. Nonrandom residuals are produced when<br />
data are fitted to a wrong model (Rob<strong>in</strong>son, 1985).<br />
The values <strong>of</strong> N,,, predicted us<strong>in</strong>g the first-order model<br />
were always lower than the first two or three data po<strong>in</strong>ts<br />
and the last two or four po<strong>in</strong>ts, and predicted values<br />
for <strong>in</strong>termediate sampl<strong>in</strong>g times were almost always<br />
higher than those observed. Therefore, the first-order<br />
model was judged to be an <strong>in</strong>adequate description <strong>of</strong><br />
the k<strong>in</strong>etics <strong>of</strong> N m<strong>in</strong>eralization observed <strong>in</strong> these experiments.<br />
Nonl<strong>in</strong>ear regression us<strong>in</strong>g the two-component<br />
model (Eq. [2]) <strong>in</strong>variably left unexpla<strong>in</strong>ed variance<br />
slightly lower than that <strong>of</strong> the special case (Eq. [3]),<br />
but the improvement <strong>in</strong> fit achieved by the two-component<br />
model was never statistically significant by the<br />
F test. The residuals left by the regressions us<strong>in</strong>g both<br />
models appeared to be random.<br />
At least two reasons can be <strong>of</strong>fered to account for<br />
the <strong>in</strong>ability <strong>of</strong> the two-component model to provide<br />
a significant improvement <strong>in</strong> fit over that <strong>of</strong>fered by<br />
its special case. The special case is a good approximation<br />
to the more complex two-component model<br />
when the length <strong>of</strong> time, over which data were collected,<br />
is short compared to the half-life <strong>of</strong> the resistant<br />
fraction <strong>of</strong> soil organic N. That is, the <strong>in</strong>itial N<br />
m<strong>in</strong>eralization from a large resistant fraction <strong>of</strong> soil<br />
N could appear to be l<strong>in</strong>ear rather than gradually decl<strong>in</strong><strong>in</strong>g.<br />
It is therefore possible that if the duration <strong>of</strong><br />
the <strong>in</strong>cubations had been doubled or tripled, the special<br />
case would no longer have closely approximated<br />
the two-component model and the latter would have<br />
proved statistically superior. Alternatively, if the<br />
number <strong>of</strong> sampl<strong>in</strong>g times dur<strong>in</strong>g the <strong>in</strong>cubations had<br />
been greatly <strong>in</strong>creased, the difference <strong>in</strong> RSS left by<br />
the two models might have become statistically significant,<br />
and, aga<strong>in</strong>, the two-component model could<br />
have emerged as the more justifiable description <strong>of</strong><br />
the observed patterns <strong>of</strong> N m<strong>in</strong>eralization. Therefore,<br />
the special case <strong>of</strong> the two-component model was<br />
judged to <strong>of</strong>fer the most statistically justifiable description<br />
<strong>of</strong> the k<strong>in</strong>etics <strong>of</strong> N m<strong>in</strong>eralization <strong>in</strong> these experiments.<br />
Accord<strong>in</strong>gly, the smooth curves <strong>in</strong> Fig. 2<br />
were calculated us<strong>in</strong>g the special case.<br />
It is also possible that the model, which has hitherto<br />
been considered merely a special case <strong>of</strong> the two-component<br />
model, may actually reflect more accurately<br />
the biological determ<strong>in</strong>ants <strong>of</strong> N-m<strong>in</strong>eralization k<strong>in</strong>etics<br />
<strong>in</strong> these experiments. A constant m<strong>in</strong>eralization<br />
rate may be due to a constant amount <strong>of</strong> enzymes (or<br />
no limitation due to enzymes) work<strong>in</strong>g on a constant<br />
amount <strong>of</strong> substrate. Filamentous fungi are able to<br />
grow on nutrient poor substrate, but hyphal outgrowth<br />
is then ma<strong>in</strong>ly accounted for by an <strong>in</strong>crease <strong>in</strong> amounts<br />
<strong>of</strong> ghost hyphae (hyphae without cytoplasm; Paustian<br />
and Schniirer, <strong>1987</strong>). An on-go<strong>in</strong>g colonization <strong>of</strong> new<br />
substrate by extension <strong>of</strong> fungal hyphae through the<br />
soil aggregates, result<strong>in</strong>g <strong>in</strong> ma<strong>in</strong>tenance <strong>of</strong> the active<br />
fungal population (i.e., no growth <strong>in</strong> terms <strong>of</strong> cytoplasmic<br />
content) would result <strong>in</strong> a constant m<strong>in</strong>eralization<br />
rate.<br />
An alternative explanation <strong>of</strong> the straight l<strong>in</strong>e phase<br />
would be the existence <strong>of</strong> an upper limit <strong>of</strong> the active<br />
microbial biomass due to, for example, protozoan<br />
graz<strong>in</strong>g rather than limitations to growth caused by<br />
substrate. Protozoa have been proposed to serve as<br />
m<strong>in</strong>eraliz<strong>in</strong>g agents by consum<strong>in</strong>g bacteria with concomitant<br />
release <strong>of</strong> NH 4 (Clarholm, 1984). Under certa<strong>in</strong><br />
circumstances they could prevent a given bacterial<br />
population to expand, e.g., out <strong>of</strong> protected<br />
microsites (van Veen et al, 1984), and thus limit the<br />
number to a constant level. An abiotic factor, such as<br />
clay fixation, might <strong>in</strong>terfere with the method employed<br />
for the study <strong>of</strong> m<strong>in</strong>eralization k<strong>in</strong>etics and<br />
should be taken <strong>in</strong>to account on NH 4 -fix<strong>in</strong>g soils.<br />
The size <strong>of</strong> the available soil organic matter (SOM)<br />
fraction (N A ) could be affected by air-dry<strong>in</strong>g and siev<strong>in</strong>g<br />
(thus partial gr<strong>in</strong>d<strong>in</strong>g) <strong>of</strong> the soil samples. In addition<br />
to particular available SOM, the N A fraction<br />
probably consists <strong>of</strong> killed microbial biomass and SOM<br />
rendered decomposable by the pretreatment (Jenk<strong>in</strong>son<br />
and Powlson, 1976; Powlson, 1980). However,<br />
Bottner (1985) identified a dormant (or protected) part<br />
<strong>of</strong> the microbial biomass, which survived dry<strong>in</strong>g,<br />
whereas an active (or exposed) part correspond<strong>in</strong>g to<br />
25% <strong>of</strong> total biomass suffered from dry<strong>in</strong>g but was able<br />
to recover. The surviv<strong>in</strong>g population probably consists<br />
ma<strong>in</strong>ly <strong>of</strong> bacteria and the killed population primarily<br />
<strong>of</strong> fungi. Based on these observations and the<br />
m<strong>in</strong>eralization pattern observed <strong>in</strong> this study we suggest<br />
the N A fraction to be decomposed by a surviv<strong>in</strong>g<br />
opportunistic group <strong>of</strong> organisms (r strategists; Andrews,<br />
1984). The ma<strong>in</strong> part <strong>of</strong> the protected biomass<br />
with limited access to organic matter will probably die<br />
dur<strong>in</strong>g the <strong>in</strong>cubation due to energy limitations and<br />
<strong>in</strong>crease the amount <strong>of</strong> easily decomposable organic<br />
matter. Hence, it is likely that a large part <strong>of</strong> the microbial<br />
biomass will decompose <strong>in</strong> a few weeks <strong>in</strong> a<br />
Stanford <strong>in</strong>cubation and that the composition <strong>of</strong> the<br />
microbial biomass will change <strong>in</strong> favor <strong>of</strong> the fungi.<br />
The fungal dom<strong>in</strong>ated biomass will be constant over<br />
a long period.<br />
Relationships between 7V 0 and k 0 Values<br />
The first-order equation was orig<strong>in</strong>ally used to describe<br />
the effect <strong>of</strong> cultivation <strong>of</strong> virg<strong>in</strong> soil on total<br />
soil N levels (Stevenson, 1965). This assumes that "the<br />
biological or biochemical potential to decompose organic<br />
matter is not limited" and that "the organic N-<br />
pool is <strong>in</strong>itially k<strong>in</strong>etically homogenous and rema<strong>in</strong>s<br />
so" (van Veen et al., 1981). Jansson (1958), among<br />
others, showed that the latter assumption is wrong,<br />
and proposed the existence <strong>of</strong> an active fraction <strong>of</strong> soil<br />
N, which is probably equivalent to the potentially mi-
BONDE & ROSSWALL: NITROGEN IN FOUR CROPPING SYSTEMS 1513<br />
neralizable pool. "Limited" <strong>in</strong> the former assumption<br />
implies that the biomass is at a maximum <strong>in</strong> relation<br />
to the amount <strong>of</strong> substrate, so that no <strong>in</strong>crease <strong>in</strong> biomass<br />
occurs at the start <strong>of</strong> the experiment.<br />
To <strong>in</strong>vestigate whether m<strong>in</strong>eralization rates are limited<br />
dur<strong>in</strong>g <strong>in</strong>cubation accord<strong>in</strong>g to Stanford and Smith<br />
(1972), literature values (Stanford and Smith 1972,<br />
Campbell et al., 1984) <strong>of</strong> A^ vs. k 0 for long-term (30<br />
weeks) <strong>in</strong>cubations have been plotted, but no significant<br />
correlation was found.<br />
An <strong>in</strong>verse relationship between A^ and k 0 values<br />
was evident when data from El-Haris et al. (1983) medium-term<br />
<strong>in</strong>cubations (12 weeks), were plotted. Small<br />
N 0 values were always associated with large k 0 values<br />
when sampl<strong>in</strong>g took place <strong>in</strong> spr<strong>in</strong>g as compared with<br />
values obta<strong>in</strong>ed when sampl<strong>in</strong>g took place <strong>in</strong> autumn.<br />
As the half-lives <strong>of</strong> the micrpbial biomass and the active<br />
nonbiomass soil organic matter have been estimated<br />
to be 0.5 and 1.5 yr, respectively (Paul, 1984),<br />
a relatively large amount <strong>of</strong> biomass N compared to<br />
nonbiomass active N would affect the k 0 value positively.<br />
An <strong>in</strong>verse relation between N 0 and ko values<br />
can thus be accomplished if the microbial biomass<br />
susta<strong>in</strong>s itself through w<strong>in</strong>ter and early spr<strong>in</strong>g at the<br />
expense <strong>of</strong> active nonbiomass soil organic matter.<br />
Schnurer et al. (1986) have not observed any marked<br />
seasonal dynamics <strong>of</strong> the microorganisms at the Kjettsl<strong>in</strong>ge<br />
field, and the variation <strong>in</strong> N 0 would then be<br />
caused ma<strong>in</strong>ly by changes <strong>in</strong> the amount <strong>of</strong> nonbiomass<br />
substrate.<br />
Carter and Rennie (1982) compared the flush <strong>of</strong> C<br />
and N after CHC1 3 fumigation concomitant with a determ<strong>in</strong>ation<br />
<strong>of</strong> A^o and t\ j2 (the "half-life" <strong>of</strong> N 0 ) on<br />
tilled and nontilled soils. This provides an experimental<br />
test <strong>of</strong> the proportionality between the biomass<br />
N/./VO ratio and k 0 . Biomass N can be calculated<br />
based on C and N flushes (Voroney, 1983), and the<br />
rate constant ko from the formula t\ /2 = In2/k 0 . Analysis<br />
<strong>of</strong> the data <strong>of</strong> Carter and Rennie (1982) showed<br />
no significant correlation between the biomass N/A'o<br />
ratio and k 0 , but did show a positive one for conventionally<br />
tilled soils. If one data po<strong>in</strong>t, represent<strong>in</strong>g a<br />
topsoil <strong>of</strong> a no-till treatment, was excluded, the correlation<br />
became significant (r = 0.530, p = 0.05, « =<br />
15) for the total data set. These data suggest that a<br />
major part <strong>of</strong> the microbial biomass is easily m<strong>in</strong>eralizable<br />
and provides some explanation for the observed<br />
relation between N 0 and ko values.<br />
A two- or multicomponent model, however, would<br />
be a better description <strong>of</strong> the m<strong>in</strong>eralization course,<br />
s<strong>in</strong>ce several fractions <strong>of</strong> organic matter are present<br />
<strong>in</strong> the soil. The s<strong>in</strong>gle k 0 value associated with the firstorder<br />
model is therefore proposed to be a mixture <strong>of</strong><br />
h and k values belong<strong>in</strong>g to a two-component model,<br />
as is NO a mixture <strong>of</strong> N A and N R . The m<strong>in</strong>eralization<br />
course <strong>in</strong> this study was well fitted by a simplified twocomponent<br />
model, mak<strong>in</strong>g it fallacious to determ<strong>in</strong>e<br />
a traditional N 0 and fc 0 value. However, the same tendency<br />
<strong>of</strong> hav<strong>in</strong>g a small ko value whenever a large N 0<br />
value occurs, is recognizable <strong>in</strong> the N A and h values.<br />
These parameters are comparable to the N 2 , k 2 values<br />
<strong>in</strong> the two-component model <strong>of</strong> Richter et al. (1982),<br />
<strong>in</strong> the data set <strong>of</strong> which the same pattern occurred<br />
(Fig. 3). Because the simplified two-component model<br />
was the most justifiable for the data presented <strong>in</strong> this<br />
4-1<br />
3-<br />
2-<br />
1-<br />
0^<br />
•- DATA FROM THIS PAPER<br />
x-DATA FROM RICHTER ET AL.I1982 )<br />
50 100 150<br />
N 2 or N A (kg ha ,-1i<br />
Fig. 3. Plot <strong>of</strong> the rate constant h vs. N A for the data from this paper,<br />
and * 2 and N, from Richter et al. (1982).<br />
paper, N A and h values should not suffer from errors<br />
caused by fitt<strong>in</strong>g <strong>of</strong> an <strong>in</strong>appropriate model. Thus, there<br />
may be a real biological mechanism generat<strong>in</strong>g the<br />
observed relationship.<br />
The f<strong>in</strong>d<strong>in</strong>gs <strong>of</strong> Paris et al. (1981), that first-order<br />
rate constants were proportional to bacterial numbers,<br />
might expla<strong>in</strong> the relationship between h and N A values<br />
presented <strong>in</strong> Fig. 3, if bacterial density varied between<br />
treatments and sampl<strong>in</strong>g dates. Based on their<br />
f<strong>in</strong>d<strong>in</strong>gs, a high bacterial density would be associated<br />
with a high measured value for h. In addition, a high<br />
bacterial density could develop at the expense <strong>of</strong> available<br />
soil organic matter, and therefore be associated<br />
with low N A values. However, an <strong>in</strong>verse relationship<br />
between bacterial density and available soil organic<br />
matter is not <strong>in</strong>evitable. Alternatively, a biological<br />
limitation on m<strong>in</strong>eralization imposed by the growth<br />
<strong>of</strong> active organisms <strong>in</strong> the early stages <strong>of</strong> <strong>in</strong>cubation<br />
would account for the relationship between h and N A ,<br />
even if a lag phase did not occur.<br />
ACKNOWLEDGMENT<br />
We are greatly <strong>in</strong>debted to Dr. S. Simk<strong>in</strong>s for many valuable<br />
discussions regard<strong>in</strong>g the statistical treatment. T.A.<br />
Bonde received f<strong>in</strong>ancial support from the Inst. <strong>of</strong> Genetics<br />
and Ecology, Univ. <strong>of</strong> Aarhus, Denmark. The <strong>in</strong>vestigation<br />
formed part <strong>of</strong> the project, Ecology <strong>of</strong> Arable Land. The<br />
Role <strong>of</strong> Organisms <strong>in</strong> <strong>Nitrogen</strong> Cycl<strong>in</strong>g, supported by the<br />
Swedish Council for Plann<strong>in</strong>g and Coord<strong>in</strong>ation <strong>of</strong> Res., the<br />
Swedish Council for Forestry and Agric. Res., the Swedish<br />
Natural Science Res. Council, and the Swedish Environment<br />
Protection Board.
1514 SOIL SCI. SOC. AM. J., VOL. 51, <strong>1987</strong>