Download Supporting Information (PDF)
Download Supporting Information (PDF)
Download Supporting Information (PDF)

Create successful ePaper yourself
Turn your PDF publications into a flip-book with our unique Google optimized e-Paper software.
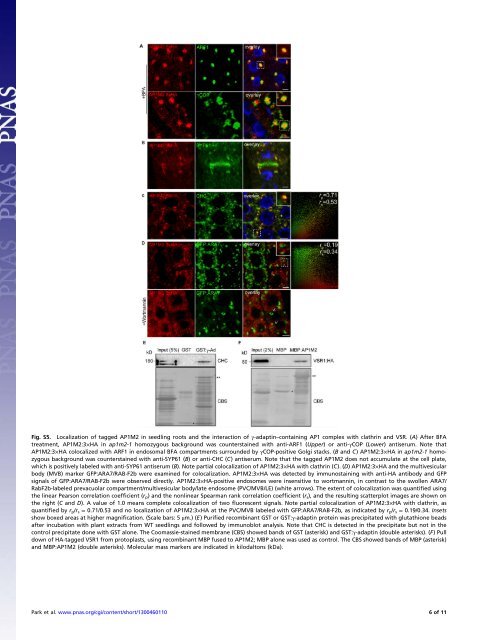
Fig. S5. Localization of tagged AP1M2 in seedling roots and the interaction of γ-adaptin–containing AP1 complex with clathrin and VSR. (A) After BFA<br />
treatment, AP1M2:3×HA in ap1m2-1 homozygous background was counterstained with anti-ARF1 (Upper) or anti-γCOP (Lower) antiserum. Note that<br />
AP1M2:3×HA colocalized with ARF1 in endosomal BFA compartments surrounded by γCOP-positive Golgi stacks. (B and C) AP1M2:3×HA in ap1m2-1 homozygous<br />
background was counterstained with anti-SYP61 (B) or anti-CHC (C) antiserum. Note that the tagged AP1M2 does not accumulate at the cell plate,<br />
which is positively labeled with anti-SYP61 antiserum (B). Note partial colocalization of AP1M2:3×HA with clathrin (C). (D) AP1M2:3×HA and the multivesicular<br />
body (MVB) marker GFP:ARA7/RAB-F2b were examined for colocalization. AP1M2:3×HA was detected by immunostaining with anti-HA antibody and GFP<br />
signals of GFP:ARA7/RAB-F2b were observed directly. AP1M2:3×HA-positive endosomes were insensitive to wortmannin, in contrast to the swollen ARA7/<br />
RabF2b-labeled prevacuolar compartment/multivesicular body/late endosome (PVC/MVB/LE) (white arrows). The extent of colocalization was quantified using<br />
the linear Pearson correlation coefficient (r p ) and the nonlinear Spearman rank correlation coefficient (r s ), and the resulting scatterplot images are shown on<br />
the right (C and D). A value of 1.0 means complete colocalization of two fluorescent signals. Note partial colocalization of AP1M2:3×HA with clathrin, as<br />
quantified by r p /r s = 0.71/0.53 and no localization of AP1M2:3×HA at the PVC/MVB labeled with GFP:ARA7/RAB-F2b, as indicated by r p /r s = 0.19/0.34. Insets<br />
show boxed areas at higher magnification. (Scale bars: 5 μm.) (E) Purified recombinant GST or GST:γ-adaptin protein was precipitated with glutathione beads<br />
after incubation with plant extracts from WT seedlings and followed by immunoblot analysis. Note that CHC is detected in the precipitate but not in the<br />
control precipitate done with GST alone. The Coomassie-stained membrane (CBS) showed bands of GST (asterisk) and GST:γ-adaptin (double asterisks). (F) Pull<br />
down of HA-tagged VSR1 from protoplasts, using recombinant MBP fused to AP1M2; MBP alone was used as control. The CBS showed bands of MBP (asterisk)<br />
and MBP:AP1M2 (double asterisks). Molecular mass markers are indicated in kilodaltons (kDa).<br />
Park et al. www.pnas.org/cgi/content/short/1300460110<br />
6of11