PCDD/F, PCB, DIOXIN-LIKE PCB, AND PBDE IN FISH OIL USED ...
PCDD/F, PCB, DIOXIN-LIKE PCB, AND PBDE IN FISH OIL USED ...
PCDD/F, PCB, DIOXIN-LIKE PCB, AND PBDE IN FISH OIL USED ...

Create successful ePaper yourself
Turn your PDF publications into a flip-book with our unique Google optimized e-Paper software.
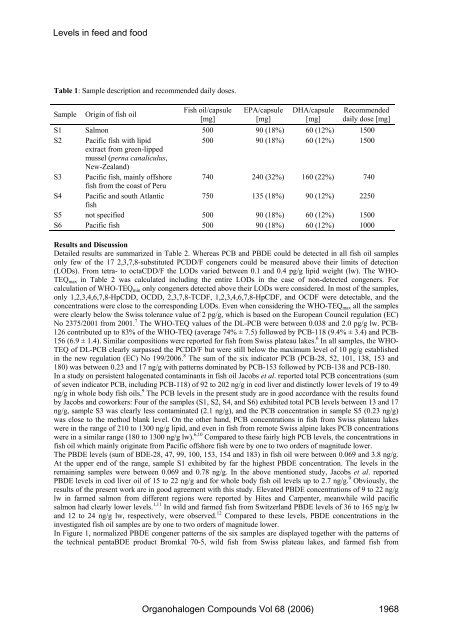
Levels in feed and food<br />
Table 1: Sample description and recommended daily doses.<br />
Sample<br />
Origin of fish oil<br />
Fish oil/capsule<br />
[mg]<br />
EPA/capsule<br />
[mg]<br />
DHA/capsule<br />
[mg]<br />
Recommended<br />
daily dose [mg]<br />
S1 Salmon 500 90 (18%) 60 (12%) 1500<br />
S2 Pacific fish with lipid<br />
500 90 (18%) 60 (12%) 1500<br />
extract from green-lipped<br />
mussel (perna canaliculus,<br />
New-Zealand)<br />
S3 Pacific fish, mainly offshore 740 240 (32%) 160 (22%) 740<br />
fish from the coast of Peru<br />
S4 Pacific and south Atlantic 750 135 (18%) 90 (12%) 2250<br />
fish<br />
S5 not specified 500 90 (18%) 60 (12%) 1500<br />
S6 Pacific fish 500 90 (18%) 60 (12%) 1000<br />
Results and Discussion<br />
Detailed results are summarized in Table 2. Whereas <strong>PCB</strong> and <strong>PBDE</strong> could be detected in all fish oil samples<br />
only few of the 17 2,3,7,8-substituted <strong>PCDD</strong>/F congeners could be measured above their limits of detection<br />
(LODs). From tetra- to octaCDD/F the LODs varied between 0.1 and 0.4 pg/g lipid weight (lw). The WHO-<br />
TEQ max in Table 2 was calculated including the entire LODs in the case of non-detected congeners. For<br />
calculation of WHO-TEQ min only congeners detected above their LODs were considered. In most of the samples,<br />
only 1,2,3,4,6,7,8-HpCDD, OCDD, 2,3,7,8-TCDF, 1,2,3,4,6,7,8-HpCDF, and OCDF were detectable, and the<br />
concentrations were close to the corresponding LODs. Even when considering the WHO-TEQ max all the samples<br />
were clearly below the Swiss tolerance value of 2 pg/g, which is based on the European Council regulation (EC)<br />
No 2375/2001 from 2001. 7 The WHO-TEQ values of the DL-<strong>PCB</strong> were between 0.038 and 2.0 pg/g lw. <strong>PCB</strong>-<br />
126 contributed up to 83% of the WHO-TEQ (average 74% ± 7.5) followed by <strong>PCB</strong>-118 (9.4% ± 3.4) and <strong>PCB</strong>-<br />
156 (6.9 ± 1.4). Similar compositions were reported for fish from Swiss plateau lakes. 6 In all samples, the WHO-<br />
TEQ of DL-<strong>PCB</strong> clearly surpassed the <strong>PCDD</strong>/F but were still below the maximum level of 10 pg/g established<br />
in the new regulation (EC) No 199/2006. 8 The sum of the six indicator <strong>PCB</strong> (<strong>PCB</strong>-28, 52, 101, 138, 153 and<br />
180) was between 0.23 and 17 ng/g with patterns dominated by <strong>PCB</strong>-153 followed by <strong>PCB</strong>-138 and <strong>PCB</strong>-180.<br />
In a study on persistent halogenated contaminants in fish oil Jacobs et al. reported total <strong>PCB</strong> concentrations (sum<br />
of seven indicator <strong>PCB</strong>, including <strong>PCB</strong>-118) of 92 to 202 ng/g in cod liver and distinctly lower levels of 19 to 49<br />
ng/g in whole body fish oils. 9 The <strong>PCB</strong> levels in the present study are in good accordance with the results found<br />
by Jacobs and coworkers: Four of the samples (S1, S2, S4, and S6) exhibited total <strong>PCB</strong> levels between 13 and 17<br />
ng/g, sample S3 was clearly less contaminated (2.1 ng/g), and the <strong>PCB</strong> concentration in sample S5 (0.23 ng/g)<br />
was close to the method blank level. On the other hand, <strong>PCB</strong> concentrations in fish from Swiss plateau lakes<br />
were in the range of 210 to 1300 ng/g lipid, and even in fish from remote Swiss alpine lakes <strong>PCB</strong> concentrations<br />
were in a similar range (180 to 1300 ng/g lw). 6,10 Compared to these fairly high <strong>PCB</strong> levels, the concentrations in<br />
fish oil which mainly originate from Pacific offshore fish were by one to two orders of magnitude lower.<br />
The <strong>PBDE</strong> levels (sum of BDE-28, 47, 99, 100, 153, 154 and 183) in fish oil were between 0.069 and 3.8 ng/g.<br />
At the upper end of the range, sample S1 exhibited by far the highest <strong>PBDE</strong> concentration. The levels in the<br />
remaining samples were between 0.069 and 0.78 ng/g. In the above mentioned study, Jacobs et al. reported<br />
<strong>PBDE</strong> levels in cod liver oil of 15 to 22 ng/g and for whole body fish oil levels up to 2.7 ng/g. 9 Obviously, the<br />
results of the present work are in good agreement with this study. Elevated <strong>PBDE</strong> concentrations of 9 to 22 ng/g<br />
lw in farmed salmon from different regions were reported by Hites and Carpenter, meanwhile wild pacific<br />
salmon had clearly lower levels. 1,11 In wild and farmed fish from Switzerland <strong>PBDE</strong> levels of 36 to 165 ng/g lw<br />
and 12 to 24 ng/g lw, respectively, were observed. 12 Compared to these levels, <strong>PBDE</strong> concentrations in the<br />
investigated fish oil samples are by one to two orders of magnitude lower.<br />
In Figure 1, normalized <strong>PBDE</strong> congener patterns of the six samples are displayed together with the patterns of<br />
the technical pentaBDE product Bromkal 70-5, wild fish from Swiss plateau lakes, and farmed fish from<br />
Organohalogen Compounds Vol 68 (2006)<br />
1968