Feeding the Gestating Sow - National Pork Board
Feeding the Gestating Sow - National Pork Board
Feeding the Gestating Sow - National Pork Board

You also want an ePaper? Increase the reach of your titles
YUMPU automatically turns print PDFs into web optimized ePapers that Google loves.
<strong>Feeding</strong> <strong>the</strong> <strong>Gestating</strong> <strong>Sow</strong><br />
Introduction<br />
Author<br />
Frank Aherne, Professor Emeritus, University of Alberta<br />
Reviewers<br />
Rob Knox, University of Illinois<br />
Bob Goodband, Kansas State University<br />
George Libal, South Dakota State University<br />
The purpose of <strong>the</strong> breeding herd is to consistently produce a targeted number of high quality weaned<br />
pigs in an efficient manner and at low cost. Feed costs in <strong>the</strong> breeding herd constitute about 12% of<br />
<strong>the</strong> cost of producing a market hog. More importantly, <strong>the</strong> feeding program in <strong>the</strong> breeding herd can<br />
significantly influence sow productivity and longevity in <strong>the</strong> herd. Most costs, including feeding costs,<br />
in <strong>the</strong> breeding herd are fixed costs and <strong>the</strong>refore, increased breeding herd efficiency will reduce overall<br />
production costs. Therefore, <strong>the</strong>re is considerable scope to reduce input costs and increase production<br />
efficiency through improvement in <strong>the</strong> feeding of <strong>the</strong> gestating and lactating sow.<br />
Objectives<br />
The objective of <strong>the</strong> feeding program for gestating sows is to achieve an appropriate, targeted sow weight<br />
gain during gestation that will allow optimum litter development and prepare <strong>the</strong> sow for lactation.<br />
<strong>Feeding</strong> for lifetime productivity<br />
All phases of <strong>the</strong> reproductive cycle are interrelated. Therefore, <strong>the</strong> feeding and management of <strong>the</strong><br />
gestating sow can influence feed intake and sow performance during subsequent phases of her life. High<br />
feeding levels in gestation that result in backfat levels at time of farrowing of 0.83in. or more will reduce<br />
feed intake during lactation, especially in early lactation of most genotypes (Weldon et al., 1994; Revell<br />
et al., 1998). On <strong>the</strong> o<strong>the</strong>r hand, if sows are underfed during gestation and have low levels of backfat at<br />
farrowing, <strong>the</strong>y may have reduced milk production and poor reproductive performance after weaning.<br />
Average sow replacement rates in <strong>the</strong> USA were about 60% in 2003 with a range of 33-86% (Deen, 2003).<br />
Reproductive and feet and leg problems continue to be <strong>the</strong> major causes of culling. The main factors<br />
contributing to such high replacement rates are:<br />
• Genetics: leaner, faster growing, more prolific animals<br />
• Disease e.g. PRRS<br />
• Increase in farm size: less time devoted to individual animal care<br />
• Lack of a skilled, motivated, knowledgeable labor force<br />
• Management practices adopted in an effort to increase profit margins e.g. early weaning, early<br />
breeding, reduced labor input<br />
• Inadequate feeding programs for gestating and lactating sows<br />
Therefore, <strong>the</strong> aim is to nei<strong>the</strong>r under- or over feed <strong>the</strong> sow at any stage of her life cycle.<br />
PAGE <br />
PIG 07-01-06
Guides to determining feeding allowances<br />
During gestation <strong>the</strong> pregnant sow requires nutrients and energy to maintain her bodily functions,<br />
for weight gain and to supply <strong>the</strong> developing litter (NRC 1998). Maintenance represents 75-85% of <strong>the</strong><br />
total energy requirement of <strong>the</strong> pregnant sow (Noblet et al., 1990). Maternal weight gain represents<br />
approximately 15-25% of <strong>the</strong> energy requirement of <strong>the</strong> sow. The composition of <strong>the</strong> maternal bodyweight<br />
gain will vary with parity, <strong>the</strong> amount of weight gained and <strong>the</strong> composition of <strong>the</strong> diet fed. Therefore, <strong>the</strong><br />
energy cost per lb of maternal gain can vary from 1.4-2.3 Mcal ME/lb (Noblet et al., 1990).<br />
The developing litter and its supporting tissues (products of conception) will account for about 45lb of<br />
<strong>the</strong> total weight gained during pregnancy (Aherne et al., 1999). But <strong>the</strong>se tissues are very high in water<br />
content and <strong>the</strong>refore only require about 3-5% of <strong>the</strong> sow’s energy requirement, usually 0.2–0.3 Mcal<br />
ME per day. Because <strong>the</strong> developing litter has a very high priority for nutrients, feeding levels during<br />
gestation have to be very low before <strong>the</strong>y will reduce litters size or birth weight of sows that are in normal<br />
body condition.<br />
The actual feed allowance to meet <strong>the</strong>se energy requirements will obviously in influenced by:<br />
• The energy density of <strong>the</strong> diet<br />
• The weight of <strong>the</strong> sow<br />
• The amount of weight gained and <strong>the</strong> ratio of fat to lean in that weight<br />
• Health status<br />
• Environmental conditions in which <strong>the</strong> sow is kept<br />
• Method of feeding<br />
Because so many factors influence <strong>the</strong> actual feed requirements of sows a successful feeding strategy<br />
should be based on individual sow needs. The feeding program should be based on some estimate of sow<br />
weight, backfat and/or body condition at <strong>the</strong> time of breeding. This program should be designed to:<br />
• Allow all sows to gain sufficient weight during gestation to achieve a backfat level at farrowing of<br />
0.7-0.8in (backfat is measured 2.5in. from <strong>the</strong> midline of <strong>the</strong> sow’s back at <strong>the</strong> 10 th rib)<br />
• Allow optimum litter development<br />
• Minimize variation in sow body condition (backfat at farrowing).<br />
Estimating sow feed allowance<br />
In many herds condition scoring is used to determine <strong>the</strong> feeding level of <strong>the</strong> pregnant sow. It is assumed<br />
that condition score reflects <strong>the</strong> level of fatness of <strong>the</strong> sow. Usually sows are assigned a condition score<br />
of 1-5 based on visual assessment and palpation of <strong>the</strong> sows back at <strong>the</strong> position of <strong>the</strong> hip bones. A score<br />
of 1 is given to very thin sows and a 5 would be a very fat sow, with a score of 3-3.5 considered optimal.<br />
A feed allowance based on experience is <strong>the</strong>n assigned to <strong>the</strong> sows. However, condition scoring does not<br />
accurately reflect <strong>the</strong> backfat level of sows. In numerous trials and field tests sows with condition scores<br />
of 3.0 had a range in backfat of 0.4-1.1in. A similar range in backfat was found for all condition scores<br />
also, different evaluators assign different scores to <strong>the</strong> same sows and <strong>the</strong>y are inconsistent over time.<br />
Regardless, of <strong>the</strong> overall condition of <strong>the</strong> sows in <strong>the</strong> herd, <strong>the</strong> condition scores always tend to range<br />
from 1.5-4.0. A fur<strong>the</strong>r limitation of condition scoring is that even if it’s done well <strong>the</strong>re is no scientific basis<br />
for <strong>the</strong> assignment of a feeding level to any particular score.<br />
A feeding strategy based on an estimate of sow weight and backfat level<br />
<strong>Sow</strong> weight<br />
The maintenance energy requirement of <strong>the</strong> sow will depend on <strong>the</strong> weight of <strong>the</strong> sow. For every 100lb<br />
increase in sow body weight her maintenance requirement will need to increase by about 1/3 of a pound<br />
of feed per day. Therefore, any feeding system that ignores sow weight will be unsatisfactory. But most<br />
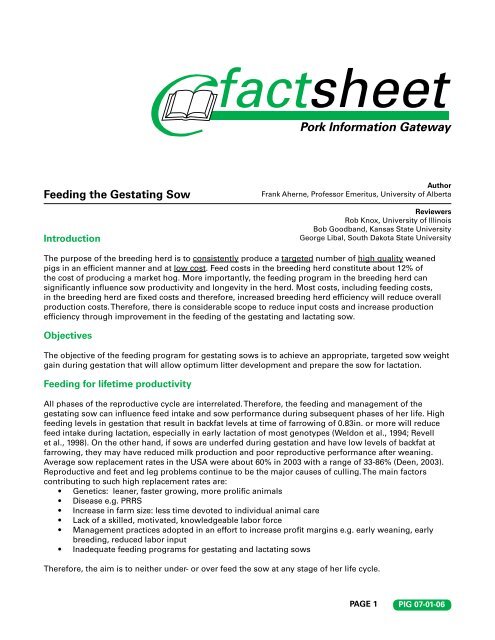
farms are not equipped or prepared to spend <strong>the</strong> time, effort or expense of weighing sows. Therefore,<br />
feeding tables must be developed on visual estimates of sow weight or from regression equation<br />
developed at Kansas State University using flank to flank measurements obtained by use of a cloth tape<br />
(Figure 1; Young et al 2004) The regression equation developed was:<br />
<strong>Sow</strong> weight, lb = 26.85 x (Flank measurement in inches) – 628<br />
PAGE <br />
PIG 07-01-06
This equation was <strong>the</strong>n used to<br />
develop <strong>the</strong> estimates of sow<br />
weight shown in Table 1.<br />
Backfat measurement<br />
There is no convincing evidence<br />
that backfat thickness, by or of<br />
itself, has an influence on sow<br />
reproductive performance.<br />
In many studies and on most<br />
farms <strong>the</strong>re are sows that perform well even<br />
though <strong>the</strong>y have low levels of backfat. In a<br />
recent study at Kansas State University, sows<br />
with relatively low levels of backfat (0.49in.)<br />
at breeding had reproductive performance<br />
as good as sows with high levels of backfat<br />
(0.73in.; Young et al., 2004).Therefore,<br />
backfat by itself is not a reliable predictor of<br />
subsequent sow reproductive performance.<br />
It is likely that a thin sow that is gaining<br />
weight and putting on backfat will be more<br />
productive than a fatter sow that is losing<br />
weight or backfat. However, backfat level is a<br />
good indicator of <strong>the</strong> sow’s body reserves. The<br />
less backfat she has, <strong>the</strong> less reserves she has<br />
and so <strong>the</strong> margin for error in underfeeding<br />
<strong>the</strong> sow is very small. If a thin sow has to<br />
draw on body reserves during lactation to<br />
support milk production and has little backfat,<br />
she will mobilize her protein tissues as an<br />
energy source to meet her needs. It has been<br />
shown that if a sow mobilizes more than 12%<br />
of her protein stores during lactation, litter<br />
growth rate will be reduced and subsequent<br />
reproductive efficiency will be compromised<br />
(Clowes et al., 2003). Backfat can be measured<br />
electronically. These machines are durable,<br />
relatively inexpensive and are easy to use<br />
after some training.<br />
Measuring backfat<br />
Flank to<br />
flank, cm<br />
Suggested target backfat levels for sows might<br />
be :<br />
<strong>Sow</strong><br />
appearance<br />
Estimated<br />
<strong>Sow</strong> wt., lb<br />
Backfat at breeding, mm<br />
< 12 12-14.9 15-18 > 18<br />
83 to 90 Very light 250 to 330 5.3 4.6 4.2 3.5<br />
91 to 97 Light 330 to 395 5.7 5.3 4.6 4.2<br />
98 to 104 Medium 395 to 475 6.2 5.7 5.3 4.6<br />
105 to 112 Heavy 475 to 550 6.8 6.2 5.7 5.3<br />
113 to 127 Very heavy 550 to 650 7.3 6.8 6.2 5.7<br />
Table 1. <strong>Feeding</strong> allowances (lb/d) based on backfat (condition score) and a<br />
“guesstimate” of sow weight (day 0 to 100) Adapted from Young et al., (2004)<br />
Figure 1. Pictorial illustrating flank to flank measurement.<br />
Backfat level, in.*<br />
Figure 2. Illustration of Renco Lean Meater being used to<br />
At breeding 0.60-0.65<br />
measure backfat thickness<br />
At farrowing 0.75-0.80<br />
At weaning 0.60-0.65<br />
*backfat measured at <strong>the</strong> last rib, 2.5-3.0in. off <strong>the</strong> midline of <strong>the</strong> sows back (Figure 2).<br />
It is important to note that <strong>the</strong> target backfat levels are not average herd values but are targets to be<br />
reached by every sow. A target of 0.7-0.8 in backfat at farrowing allows sows to lose 0.15-0.20in of backfat.<br />
It has been shown that sows with backfat levels of less than 0.55in at weaning have lower reproductive<br />
performance and are more difficult to get back in condition (Tantasuparuk et al, 2001; Young et al, 2004).<br />
Thin sows (
some by as much as 1.25lb, feed per day (Young et al., 2004). In<br />
contrast sows with greater than 0.8in. BF at farrowing tend to have<br />
lower lactation feed intake, leading to poorer subsequent reproductive<br />
performance.<br />
Suggested feeding allowances for gestating sows<br />
Using data from published reviews (NRC 1998; Young et al., 2004b). A<br />
spreadsheet can be developed to determine <strong>the</strong> daily feeding levels<br />
for each sow based on her weight and backfat level at breeding. These<br />
feeding allowances also take into account <strong>the</strong> sow weight gain needed<br />
to attain <strong>the</strong> targeted increase in backfat required for each sow. The<br />
maintenance requirement is <strong>the</strong>n calculated on <strong>the</strong> predicted midgestation<br />
sow weight. Therefore, <strong>the</strong>se feeding levels can be fed from<br />
breeding to day 100 of gestation.<br />
For those reluctant to use <strong>the</strong> cloth tape to take flank to flank<br />
measurement, <strong>the</strong> sows should be assigned to weight classes as<br />
shown in Table 1 based on visual appraisal. For farms not using<br />
backfat measurement <strong>the</strong>y could replace <strong>the</strong> four backfat classes with<br />
condition scores of 1-2, 2-3, 3-4, >4. Thus this same feeding allowance<br />
table could be used with visual estimates of sow weight and condition<br />
scores.<br />
Kansas State researchers have shown that adoption of a feeding<br />
system based on sow weight<br />
and backfat will:<br />
• Lower feed cost per sow per year by approximately $10<br />
• A higher proportion of sows in <strong>the</strong> target backfat range of 17-<br />
21mm.<br />
For this feeding program <strong>the</strong> diet fed should have a nutrient and<br />
energy content similar to that shown in Table 2. The suggested nutrient<br />
levels are based on NRC (1998) recommendations with an added<br />
margin of safety which is influenced by <strong>the</strong> price of <strong>the</strong> ingredient and<br />
on-farm experience.<br />
A suggested amino acid pattern based on total amino acid levels is<br />
presented in Table 3.<br />
It is assumed that <strong>the</strong> sows are individually fed and that <strong>the</strong> automatic<br />
feeding systems (drop boxes or electronic sow feeder) are accurate.<br />
Because gestation lasts for 113-116 days, small differences in<br />
daily feed intake can lead to large differences in sow weight<br />
gain and backfat levels at farrowing.<br />
Barn temp should be kept at 68-70°F for sows in stalls with<br />
concrete slated floors. Below <strong>the</strong>se temperatures a daily<br />
increase of 2-3oz. feed per day is required for each 2°F below<br />
<strong>the</strong>se temperatures if <strong>the</strong> cold persists for long periods of <strong>the</strong><br />
day. This feeding program could also be used for loose housed<br />
sows on electronic sow feeding systems. In such group housed<br />
sows kept on concrete or straw <strong>the</strong> lower critical temperature<br />
would be 60°F and 50°F, respectively.<br />
Because gestating sows are usually fed once daily, it is not<br />
recommended that syn<strong>the</strong>tic lysine be used to meet <strong>the</strong> lysine<br />
requirements.<br />
Nutrient<br />
Amino acid<br />
Unit<br />
ME, Mcal/lb 1.5<br />
Total lysine, % 0.55<br />
Digestible lysine, % 0.45<br />
Crude protein 13.5<br />
Fat, % 2.5<br />
Calcium, % 0.90<br />
Phosphorous, % 0.75<br />
Av. Phosphorous, % 0.40<br />
Salt, % 0.40<br />
Zinc, ppm 100<br />
Iorn, ppm 80<br />
Manganese, ppm 40<br />
Copper, ppm 10<br />
Iodine, ppm 0.60<br />
Selenium, ppm 0.20<br />
Vitamin A, IU/kg 4500<br />
Vitamin D, IU/kg 800<br />
Vitamin E, IU/kg 30<br />
Menadione, Mg/kg 2<br />
Choline, Mg/kg 300<br />
Niacan, Mg/kg 20<br />
Riboflavin, Mg/kg 4.5<br />
D-panthonenate, Mg/kg 15<br />
Vitamin B12, Mcg/kg 17<br />
Folic acid, Mcg/kg 600<br />
d-biotin, Mcg/kg 100*<br />
Table 2. Nutrient allowances for<br />
gestating sows. * Increase to 250<br />
Mcg/kg if high wheat diets are fed.<br />
Ratio relative<br />
to lysine<br />
Lysine 100<br />
Methionine + Cystine 64<br />
Threonine 72<br />
Tryptophan 20<br />
Valine 65<br />
Isoleucine 55<br />
Table 3. Suggested amino acid pattern based<br />
on total or true illeal digestible amino acid<br />
formulations for gestation sows<br />
PAGE <br />
PIG 07-01-06
Pattern of feeding<br />
It is recommended that gilts be fed 4.5–5.0lb/day for <strong>the</strong> 2-3 days around <strong>the</strong> time of mating. All o<strong>the</strong>r<br />
sows can be assigned a regular feeding schedule (Table 1). On <strong>the</strong> majority of farms <strong>the</strong>re is no advantage<br />
of feeding o<strong>the</strong>r than a constant daily intake from day 3 to 100 of gestation.<br />
Late gestation<br />
The energy and nutrient requirements of sows increase with advancing pregnancy especially in <strong>the</strong> last<br />
10 days of gestation. Therefore, it is recommended that sows be fed 2.0lb extra feed from day 100 of<br />
gestation until farrowing. This higher level of feeding will prevent loss of sow condition (body stores) and<br />
prepare sows for increased feeding levels in lactation without any deleterious effects on <strong>the</strong> sow.<br />
Summary<br />
An essential part of any strategy to optimize sow reproductive performance, increase efficiency of feed<br />
usage and lower culling rate, is to control weight and backfat gain during gestation and weight and backfat<br />
loss in lactation. This is best achieved by individually feeding each sow a well balanced diet, and basing<br />
daily feed allowances according to an estimate of sow bodyweight and backfat thickness.<br />
References<br />
Aherne and Williams (1992). Aherne, F.X. and I. H. Williams, 1992. Nutrition for optimizing breeding herd performance. Veterinary Clinics of North<br />
America: Food Animal Practice. 8 (3): 589-608.<br />
Aherne et al., (1999) Aherne, F.X., G.R. Foxcroft and J.E. Pettigrew, 1999. Nutrition of <strong>the</strong> <strong>Sow</strong>. Chapter 68, pp 1029-1043. Diseases of Swine. 8<strong>the</strong> Ed.,<br />
Ames, Iowa, Iowa State University Press.<br />
Clowes et al (2003). Clowes, E.J., F.X. Aherne, A.L. Schaefer, G.R. Foxcroft, and V.E. Baracos, 2003. Parturition body size and body protein loss during<br />
lactation influence performance during lactation and ovarian function at weaning in first-parity sows. J. Anim. Sci. 81: 1517-1528.<br />
Deen, (2003). Deen, J., 2003. The challenge of benchmarking. International Pig letter. Vol. 23, No. 6a. 2003.<br />
NRC (1998). <strong>National</strong> Research Council, 1998. Nutrient requirements of swine. 10 th revised Ed., Washington, DC, <strong>National</strong> Academy Press.<br />
Noblet et al., (1990) Noblet, J., J.Y. Dourmad, and M. Etienne, 1990. Energy utilization in pregnancy and lactating sow: modeling of energy requirements.<br />
J. Anim. Sci., 68: 262-272.<br />
Revell et al, (1998). Revell, D.K., I.H. Williams, B.P. Mullan, J.L. Ranford and R.J. Smits, 1998. Body composition at farrowing and nutrition during lactation<br />
affect <strong>the</strong> performance of primiparous sows: 1. Voluntary feed intake, weight loss and plasma mtabolites. J. Anim. Sci. 76: 1729-1737.<br />
Tantasuparuk et al., (2001). Tantasuparuk, W., N. Lundeheim, A.M. Dalen, A. Kunaongkrit, and S. Einarsson, 2001. Weaning-to-service interval in primiparous<br />
sows and its relationship with longevity and piglet production. Livest. Prod. Sci. 69: 155-162.<br />
Weldon et al., (1994). Weldon, W.C., A.J. Lewis, G.F. Louis, J.L. Kovar, M.A. Giesemann and P.S. Miller, 1994. Post partum hypophagia in primiparous sows:<br />
1. Effects of gestation feeding level on feed intake, feeding behaviour and plasma metabolite concentrations during lactation. J. Anim. Sci. 72: 387-394.<br />
Young et al., (2004). Young, M.G., M.D. Tokach, F.X. Aherne, R.G. Main, S. S. Dritz, R.D. Goodband, and J.L. Nelssen, 2004. Comparison of three methods<br />
of feeding sows in gestation and subsequent effects on lactation performance. J. Animal. Sci. 82: 3058-3070.<br />
Reference to products in this publication is not intended to be an endorsement to <strong>the</strong> exclusion of o<strong>the</strong>rs which may be similar. Persons using such products assume responsibility for <strong>the</strong>ir use in accordance<br />
with current directions of <strong>the</strong> manufacturer. The information represented herein is believed to be accurate but is in no way guaranteed. The authors, reviewers, and publishers assume no liability in connection<br />
with any use for <strong>the</strong> products discussed and make no warranty, expressed or implied, in that respect, nor can it be assumed that all safety measures are indicated herein or that additional measures may<br />
be required. The user <strong>the</strong>refore, must assume full responsibility, both as to persons and as to property, for <strong>the</strong> use of <strong>the</strong>se materials including any which might be covered by patent.<br />
This material may be available in alternative formats.<br />
PAGE <br />
PIG 07-01-06