2011 Annual Report - Presbyterian Homes & Services
2011 Annual Report - Presbyterian Homes & Services
2011 Annual Report - Presbyterian Homes & Services

You also want an ePaper? Increase the reach of your titles
YUMPU automatically turns print PDFs into web optimized ePapers that Google loves.
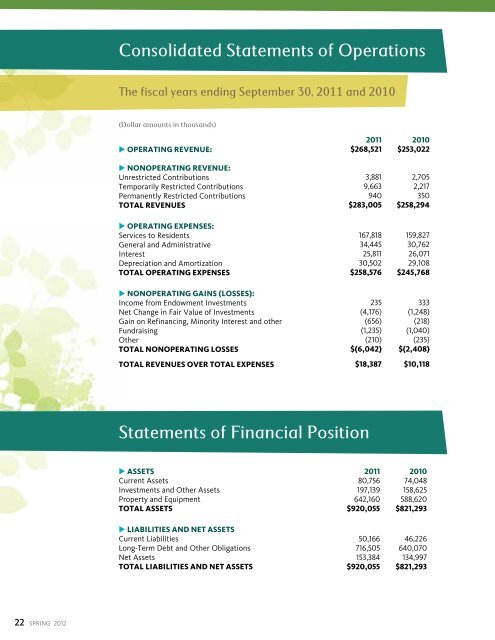
Consolidated Statements of Operations<br />
The fiscal years ending September 30, <strong>2011</strong> and 2010<br />
(Dollar amounts in thousands)<br />
u OPERATING REVENUE:<br />
u NONOPERATING REVENUE:<br />
Unrestricted Contributions<br />
Temporarily Restricted Contributions<br />
Permanently Restricted Contributions<br />
TOTAL REVENUES<br />
u OPERATING EXPENSES:<br />
<strong>Services</strong> to Residents<br />
General and Administrative<br />
Interest<br />
Depreciation and Amortization<br />
TOTAL OPERATING EXPENSES<br />
u NONOPERATING GAINS (LOSSES):<br />
Income from Endowment Investments<br />
Net Change in Fair Value of Investments<br />
Gain on Refinancing, Minority Interest and other<br />
Fundraising<br />
Other<br />
TOTAL NONOPERATING LOSSES<br />
TOTAL REVENUES OVER TOTAL EXPENSES<br />
<strong>2011</strong> 2010<br />
$268,521 $253,022<br />
3,881 2,705<br />
9,663 2,217<br />
940 350<br />
$283,005 $258,294<br />
167,818 159,827<br />
34,445 30,762<br />
25,811 26,071<br />
30,502 29,108<br />
$258,576 $245,768<br />
235 333<br />
(4,176) (1,248)<br />
(656) (218)<br />
(1,235) (1,040)<br />
(210) (235)<br />
$(6,042) $(2,408)<br />
$18,387 $10,118<br />
Statements of Financial Position<br />
u ASSETS<br />
Current Assets<br />
Investments and Other Assets<br />
Property and Equipment<br />
TOTAL ASSETS<br />
u LIABILITIES AND NET ASSETS<br />
Current Liabilities<br />
Long-Term Debt and Other Obligations<br />
Net Assets<br />
TOTAL LIABILITIES AND NET ASSETS<br />
<strong>2011</strong> 2010<br />
80,756 74,048<br />
197,139 158,625<br />
642,160 588,620<br />
$920,055 $821,293<br />
50,166 46,226<br />
716,505 640,070<br />
153,384 134,997<br />
$920,055 $821,293<br />
22<br />
SPRING 2012