Combining the U.S. Dietary Guidelines and Physical Activity
Combining the U.S. Dietary Guidelines and Physical Activity
Combining the U.S. Dietary Guidelines and Physical Activity

You also want an ePaper? Increase the reach of your titles
YUMPU automatically turns print PDFs into web optimized ePapers that Google loves.
systematic review of <strong>the</strong> evidence regarding <strong>the</strong> role of physical<br />
activity <strong>and</strong> health across different age, gender, <strong>and</strong> special needs<br />
groups. The DGAC report noted that <strong>the</strong> PAGAC report<br />
highlighted four distinct points that were especially relevant<br />
to underst<strong>and</strong>ing physical activity <strong>and</strong> energy balance.<br />
1. Achieving energy balance <strong>and</strong> a healthy weight depend on both<br />
energy intake <strong>and</strong> expenditure.<br />
2. The effect of caloric deficit on weight does not depend upon<br />
whe<strong>the</strong>r <strong>the</strong> deficit is produced by reducing intake, increasing<br />
expenditure, or both; however, research studies that include <strong>the</strong><br />
proportion of caloric deficit due to physical activity are rare.<br />
3. Bouts of moderate- to vigorous-intensity aerobic physical<br />
activity that contribute to meeting physical activity guidelines<br />
are not <strong>the</strong> only source of physical activity energy expenditure.<br />
Any movement throughout <strong>the</strong> day that replaces seated activity<br />
contributes to <strong>the</strong> totality of energy expenditure.<br />
4. Even among people at a healthy body weight, regular physical<br />
activity is required to maintain health <strong>and</strong> prevent disease.<br />
Regarding <strong>the</strong> last point, accumulating data document <strong>the</strong> fact<br />
that sedentary behavior is, in itself, a risk factor for all individuals<br />
[14, 15].<br />
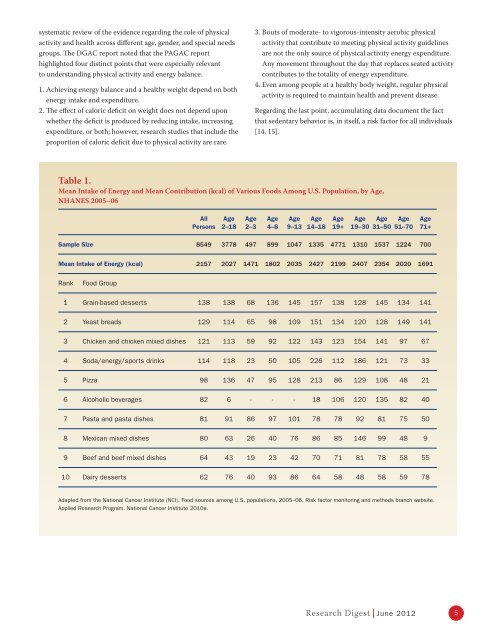
Table 1.<br />
Mean Intake of Energy <strong>and</strong> Mean Contribution (kcal) of Various Foods Among U.S. Population, by Age,<br />
NHANES 2005–06<br />
All Age Age Age Age Age Age Age Age Age Age<br />
Persons 2–18 2–3 4–8 9–13 14–18 19+ 19–30 31–50 51–70 71+<br />
Sample Size 8549 3778 497 899 1047 1335 4771 1310 1537 1224 700<br />
Mean Intake of Energy (kcal) 2157 2027 1471 1802 2035 2427 2199 2407 2354 2020 1691<br />
Rank<br />
Food Group<br />
1 Grain-based desserts 138 138 68 136 145 157 138 128 145 134 141<br />
2 Yeast breads 129 114 65 98 109 151 134 120 128 149 141<br />
3 Chicken <strong>and</strong> chicken mixed dishes 121 113 59 92 122 143 123 154 141 97 67<br />
4 Soda/energy/sports drinks 114 118 23 50 105 226 112 186 121 73 33<br />
5 Pizza 98 136 47 95 128 213 86 129 108 48 21<br />
6 Alcoholic beverages 82 6 - - - 18 106 120 135 82 40<br />
7 Pasta <strong>and</strong> pasta dishes 81 91 86 97 101 78 78 92 81 75 50<br />
8 Mexican mixed dishes 80 63 26 40 76 86 85 146 99 48 9<br />
9 Beef <strong>and</strong> beef mixed dishes 64 43 19 23 42 70 71 81 78 58 55<br />
10 Dairy desserts 62 76 40 93 86 64 58 48 58 59 78<br />
Adapted from <strong>the</strong> National Cancer Institute (NCI). Food sources among U.S. populations, 2005–06. Risk factor monitoring <strong>and</strong> methods branch website.<br />
Applied Research Program. National Cancer Institute 2010a.<br />
Research Digest June 2012<br />
5