o_18pa8brpqmdfnd14g916311spvo.pdf

Create successful ePaper yourself
Turn your PDF publications into a flip-book with our unique Google optimized e-Paper software.
The International Journal Of Engineering And Science (IJES)<br />
|| Volume || 3 || Issue || 5 || Pages || 45-55 || 2014 ||<br />
ISSN (e): 2319 – 1813 ISSN (p): 2319 – 1805<br />
Geophysical and Hydrochemical Evaluation of Springwater<br />
Potential and Quality within the Basement Complex Of<br />
Southwestern Nigeria<br />
1<br />
Ogundana, A.K, 2 Aladejana, J.A.,<br />
1, Department of Geology, Afe Babalola University, Ado-Ekiti.<br />
2, Department of Geology, University of Ibadan.<br />
--------------------------------------ABSTRACT-----------------------------------------<br />
Groundwater in the basement complex terrain is known to be restricted to the weathered overburden and<br />
fractured rocks. Consequent upon this, groundwater availability becomes a challenge in any geological<br />
environment with low rock fracture and shallow overburden thickness. High history of borehole failure in this<br />
area necessitates search for alternative sources of water to complement the water demand. Geophysical and<br />
hydrochemical evaluation of spring water located on a basement complex was conducted to investigate its<br />
potential and quality for possible development.Combination of vertical electrical sounding and profiling<br />
methods were employed using Schlumberger and dipole dipole configurations respectively. Seven points were<br />
sounded along two traverses and two profiles were occupied around the main spring. Four (4) water samples<br />
were collected and analysed for physicochemical parameters. Flow rate was measured using flow-meter at six<br />
(6) different times from which the average was determined.Four different subsurface lithologic units were<br />
established namely; lateritic clay topsoil, clayey-sand, weathered basement and, fresh basement. The curve<br />
types range between simple H and HA. The topsoil thickness is relatively thin along these traverses. The<br />
average resistivity and thickness values for the topsoil are 181Ωm and 2.0m respectively, which is<br />
predominantly lateritic clay. Clayey-sand was encountered at shallow depths of 2.0meters on the average in all<br />
locations and the average resistivity and thickness values for the Clayey-sand are, 24Ωm and 9.0m respectively.<br />
The overburden is assumed to include all materials above the presumably fresh basement. The depth to the<br />
bedrock varies from 7.0 to 19.0m and the average depth to the bedrock is 13.0m. The Clayey-sand with an<br />
average thickness of 9.0m is the aquifer which responsible for the accumulation of the water with the lateritic<br />
clay top soil of 2.0m on an average acts as a protective layer. Shallow overburden thickness (1.0m) which<br />
intercept with the surface is responsible for the spring water at this spot. The impermeable crystalline basement<br />
rock underline the area prevents further percolation of the water. Hence, the accumulation and flow as spring<br />
becomes necessary. Hydrochemical analysis of water samples from the spring and other points at the<br />
downstream revealed that the spring water fall well within the acceptable limit of both World Health<br />
Organisation (WHO) and Nigerian Standard for Drinking Water Quality (NSDWQ). This result also revealed<br />
higher value of Mn and Fe as the water flows away from the spring spot indication an anthropogenic influence.<br />
The flow rate estimated at 0.16L/Sec which is equivalent to 14,400L/day is significant if sustained throughout<br />
the year. So far, hydrochemical results suggest the fresh spring water is of good quality; however, there is need<br />
for the bacteriological analysis to be carried out to eliminate any doubt of probable bacteriological<br />
contamination.<br />
KEY WORDS: Spring Water, Evaluation, Quality, Potential and Development.<br />
---------------------------------------------------------------------------------------------------------------------------------------<br />
Date of Submission: 20 March 2014 Date of Publication: 25 May 2014<br />
---------------------------------------------------------------------------------------------------------------------------------------<br />
I. INTRODUCTION<br />
Access to clean water is a human right and a basic requirement for economic development. The safest<br />
kind of water supply is groundwater. Since groundwater normally has a natural protection against pollution by<br />
the covering layers, only minor water treatment is required (Reinhard 2006). The challenges of erratic<br />
groundwater resources are understood to be associated with any community underlying by basement complex<br />
around the word. This is due to the crystalline nature and mineralogical complexity in the rocks associated with<br />
this type of geological environment. Groundwater occurrence in this zone is found within the pore spaces of the<br />
www.theijes.com The IJES Page 45
Geophysical And Hydrochemical Evaluation Of Springwater…<br />
weathered overburden and also the fractures or other structural discontinuities such as joint or displacement<br />
related to intrusion or tectonic activities. These units serve as the aquifer for groundwater accumulation which<br />
largely depends on the nature/thickness of weathered overburden and structural spacing. This challenge<br />
becomes more complicated if the rocks underlying the zones are not fractured.<br />
Spring catchments are frequently dominated by hard rocks comprising intact rock bodies separated by<br />
discontinuities termed fractures. Depending on the type of rock, the porosity of intact rock bodies ranges from<br />
nearly zero to values much higher than the porosity created by fractures (Rehrl and Birk, 2010). The<br />
permeability of intact rock bodies is often relatively low though. Thus, discontinuities provide the major flow<br />
paths in fractured rocks. Groundwater exploration reports around Ado-Ekiti suggest low fracture in most part<br />
of this state capital. This results in low yield in most of the boreholes own by private individual and public. In<br />
the light of the above, it is not a gain saying to describe any area with spring water as a blessed zone. It is<br />
therefore encouraged that this spring should be investigated and assessed for its sustainability in terms of yield,<br />
quality and possibility to enhance its recharge rate to complement the available erratic source of water supply to<br />
meet ever increasing water demand for various purposes.<br />
Afe Babalola University located in Ado Ekiti is not exempted from the challenge of low groundwater<br />
availability resulting from complex geology of this area. Hence, the Management is faced with the need to<br />
source for alternative means to complement the existing water supply for the ever-increasing population of the<br />
University community. Thus, the need to investigate and evaluate the springwater potential and assess the<br />
quality of the existing spring within the campus for improved water supply. Several workers such as Dutcher<br />
and Garret (1965), Clerk (1985), Olorunfemi and Olorunniwo (1985), Olorunfemi (1990), Olayinka and<br />
Olorunfemi (1992)Olorunfemi and Olayinka (1992), Olorunfemi and Fasuyi (1993), Oladipo et al, (2005)<br />
Olayinka and Weller (1993), Rehil and Birk (2010), Ojo et al, (2011), Talabi (2013) have carried research in<br />
various aspect of groundwater exploration/investigation, evaluation and structural delineation using geophysical<br />
methods in several location within the basement complex terrain around the world.<br />
II. LOCATION AND GEOLOGY OF THE STUDY AREA<br />
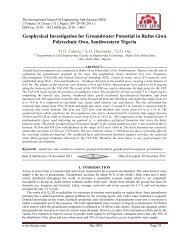
The study spring is located at the southwestern part of the University campus just at the back of the<br />
power house and adjacent of the University guest house under construction. It lies at longitudes 5 0 18’05.78”E<br />
and latitudes 7 0 36'09.59"N (Figure 1). The terrain in the study area is gently undulating, with topographic<br />
elevation ranging from 345m to 370m above sea level. Ado Ekiti is underlain by crystalline rocks made of<br />
Older granite, Migmatite and Charnockites which are of little or no fracture in most location with<br />
accompanied shallow overburden.<br />
Figure.1: Aerial Photo of the Study Location<br />
Climate, Geology and Hydrogeology of The Area<br />
The area is situated within the tropical rain forest region, with a climate characterized by dry and wet<br />
seasons. Average annual rainfall in this area is 1300 mm, with average wet days of about 100. The annual<br />
temperature varies between 18 0 C to 34 0 C. The study area lies within the basement complex of south-western<br />
Nigeria and is older granite, Migmatite and Charnockites which are of little or no fracture in most location<br />
with accompanied shallow overburden. The overburden is relatively shallow within the study area with<br />
average of 13m. The groundwater is found within the overburden and fractured basement while the area is<br />
drained by the river Ogbese which flow SW-NE direction.<br />
www.theijes.com The IJES Page 46
Geophysical And Hydrochemical Evaluation Of Springwater…<br />
III. METHODOLOGY, DATA ACQUISITION AND INTERPRETATION<br />
A reconnaissance survey of study spring was carried out for site familiarization and planning.This was<br />
followed with geophysical investigation of the spring site and environs. Geophysical methods are indirect site<br />
investigation techniques and predominantly non-intrusive. Two methods namely; Resistivity Sounding and<br />
Resistivity Profiling were adopted. Soil resistivity meter (PASI) was used for the geophysical tests. It is highly<br />
reliable and reproducible.Resistivity sounding was adopted in resolving resistivity variation with depth, thus<br />
sounding helped in delineating the various subsurface lithological units, hydrogeological significance and the<br />
protective capacity or vulnerability of the subsurface layers to possible pollution.Resistivity profiling was<br />
adopted in resolving horizontal resistivity variation in this study, hence profiling helped in establishing the<br />
lateral continuity of the various subsurface lithological units.The local geology of the area was studied and the<br />
existing hydrogeology pattern was observed. Other existing water bodies around the spring were also monitored.<br />
Physico-chemical parameters such as pH, temperature, electrical conductivity (EC), total dissolved (TDS) solids<br />
were determined on the field using portable multitestre meter. Water samples were taken for physiochemical<br />
analysis. Hydrochemical studies was conducted on the water sampled from the spring and three other points<br />
from within 200meters downstream at an average of 50m intervals were collected for both major ions and<br />
heavy/trace metals analysis. Major cations and heavy/trace metals were analysed using Atomic Absorption<br />
Spectrophotometer while Major anions were analysed using spectrophotometer and ion<br />
chromatography.Hydrological approach was adopted to determine the flow rate of the spring. This was carriedout<br />
using flow meter.<br />
IV. RESULTS AND DISCUSSIONS<br />
Vertical Electrical Sounding<br />
A total of 7 VES locations across 2 traverses were spread over the study area (Figure 1). The processed<br />
data were interpreted, resulting curve types were assessed, existing subsurface lithologic units were established,<br />
and the geoelectric properties of the various subsurface layers were used in delineating the aquiferous units<br />
responsible for the spring in the study area. The results are presented in the form of table (Table 1), geoelectric<br />
curves (Figure3) and sections (Figure 4a & b).<br />
Figure.2a and b: Picture showing Geophysical field data acquisition and Physico-chemical measurements<br />
Four different subsurface lithologic sequences were established namely; lateritic topsoil, clayey-sand, weathered<br />
basement and, basement. The curve types range between simple H and HA. The topsoil, clayey-sand and<br />
weathered basement materials are characterised with relatively low resistivity values while the basement<br />
materials are typified with high resistivity values.<br />
A summary of the results of interpretation, on which the following findings were hinged, is shown in Table 1.<br />
www.theijes.com The IJES Page 47
Geophysical And Hydrochemical Evaluation Of Springwater…<br />
Figure.3: Typical Geoelectric curves from data interpretations<br />
Table 1: Correlation Table<br />
VES POINT 1 2 3 4 5 6 7<br />
CURVE TYPE H HA HA HA H HA H<br />
LITHOLOGY<br />
TOP SOIL TOP 0 0 0 0 0 0 0<br />
BASE 2 1 3 1 2 4 1<br />
THICKNESS 2 1 3 1 2 4 1<br />
Ωm 133 163 103 207 249 272 139<br />
CLAYEYSAND TOP 2 1 3 1 2 4 1<br />
BASE 9 8 8 7 19 11 15<br />
THICKNESS 7 7 5 6 17 7 14<br />
Ωm 27 36 16 23 29 10 29<br />
WEATHERED<br />
BASEMENT<br />
TOP 9 8 8 - - 15<br />
BASE - 16 - - - -<br />
THICKNESS - 6 - - - -<br />
Ωm 98 139 126 - - 156<br />
BASEMENT TOP - 16 - 7 19 11 -<br />
Ωm - 367 - 279 249 277 -<br />
Geoelectric Units<br />
The geoelectric sections (Figures 4) show the variations of resistivity and thickness values of layers<br />
within the depth penetrated in the study area at the indicated VES stations. The two traverses were taken along<br />
the N-S directions. Generally, the traverses revealed four subsurface layers: Lateritic Top-soil, Clayey- sand,<br />
Weathered basement and the presumed Fresh basement.<br />
Topsoil<br />
The topsoil thickness is relatively thin along these traverses. The average resistivity and thickness<br />
values for the topsoil are 181Ωm and 2m respectively, which indicated that the predominant composition of the<br />
topsoil is lateritic clay.<br />
Clayey-sand<br />
Clayey-sand was encountered at shallow depths of 2meters on the average in all locations and the<br />
average resistivity and thickness values for the Clayey-sand are, 24Ωm and 9m respectively.<br />
Weathered-basement<br />
Weathered-basement was encountered in four locations and the average resistivity value and depth to<br />
the top of the weathered-basement are, 130Ωm and 10m respectively thus indicating that the material<br />
composition is largely clay, sandy-clay and clayey-sand or high degree of water saturation. The thickness values<br />
were not established in some of the locations.<br />
www.theijes.com The IJES Page 48
Geophysical And Hydrochemical Evaluation Of Springwater…<br />
Basement<br />
The basement is the fresh bedrock and is the last layer. It is relatively shallow in the study area, it was<br />
encountered in four locations and the average resistivity and depth values to the top of basement are, 293Ωm,<br />
and 13m respectively. The resistivity values are high because of its crystalline nature.<br />
Overburden<br />
The overburden in assumed to include all materials above the presumably fresh basement. The depth to<br />
the bedrock varies from 7.0 to 19.0m and the average depth to the bedrock is 13.0m (Table 1 and Figure 4).<br />
Overburden thickness was established in four locations and the average thickness value is 13.0m. The relatively<br />
moderate overburden thickness has potentials for groundwater saturation, however, the clayey nature and poor<br />
permeability of the materials will pose a challenge for water abstraction.<br />
Horizontal Profiling<br />
Result of the profiling carried out across two traverse sections in E-W direction is presented in the<br />
following section. The first traverse is 55meters long and is located 50meters before the spring while the second<br />
traverse is 60meters long and is located right on the spring. Four continuous subsurface lithologic units namely;<br />
Lateritic topsoil (blue), clayey-sand (green), weathered basement (yellowish-brown) and fresh basement<br />
(reddish purple) were established by the two profile sections.The results are presented in form of field data<br />
pseudosections and 2-D resistivity structures (Figure 5 & 6). The pseodosection and 2-D resistivity plot<br />
revealed a relatively thin overburden and shallow basement at the spring spot (Station 4 on figure 5 & 6) which<br />
invariably responsible for the discharge at that point.<br />
www.theijes.com The IJES Page 49
Geophysical And Hydrochemical Evaluation Of Springwater…<br />
Figure. 5a Field Data Pseudosection of Profile 1<br />
www.theijes.com The IJES Page 50
Geophysical And Hydrochemical Evaluation Of Springwater…<br />
Figure. 5b 2-D resistivity structures of Profile 1<br />
Figure. 6a Field Data Pseudosection of Profile 2<br />
Figure. 6b 2-D resistivity structures of Profile 2<br />
www.theijes.com The IJES Page 51
Geophysical And Hydrochemical Evaluation Of Springwater…<br />
V. RESULTS OF HYDROCHEMICAL ANALYSIS<br />
Results of the hydrochemical analysis of the water samples are as presented in the Table 2 above.<br />
Results of physico-chemical parameter revealed temperature ranges from 23.6 to 26.8 with average value of<br />
25.35 0 C while pH, TDS and EC revealed range of 6.0-7.2, 52.5-301mg/l, and 74.5-426µS/cm with their<br />
respective average values of 6.75, 126.05mg/l and 178.375µS/cm.Major cations Ca 2+ , Mg 2+ , K + , and Na +<br />
revealed ranges of (2.43-20.24), (2.56-13.36), (0.51-1.34) and (3.02-21.35mg/l), with respective average of 7.52,<br />
5.72, 0.97 and 8.14mg/l. Anions HCO 3 Cl - , SO 4 2- and NO 3 - ranges from 57.6-108, 172-61, 0.79-2.52 and 25.64-<br />
28.93mg/ with respective average of 82.8, 31.75, 1.3 and 17.14mg/l respectively Table 3. Fe and Mn range from<br />
0-6.15 and 0.32-16.23mg/l with their respective average values of 1.62 and 4.4mg/l. Metals such as Cu, Zn, Co,<br />
Cr, Cd, Pb and Ni all showed concentrations below the detectable limit of the analytical instrument used.<br />
The hydrochemical results were compared with both WHO and NSDWQ standards to further establish its<br />
quality. All the ions and metals in the fresh spring water sample fell well within the permissible limit of both<br />
standards. Increase in groundwater composition was observed as the water flow away from the spring spot, this<br />
could be attributed to anthropogenic influence from the surrounding.<br />
Hydrochemical Characterisation<br />
In a bit to further understand the hydrochemical characteristics of the study spring water Schoeller<br />
semi-logarithmic diagram (Schoeller, 1967) was employed. This allows the major ions of many samples to be<br />
represented on a single graph, in which samples with similar patterns can be easily discriminated. The Schoeller<br />
diagram shows the total concentration of major ions in log-scale. Results of the Schoeller plots (Figure 7)<br />
revealed Ca 2+ as dominant cation and HCO 3 - Cl - as dominant anions with fingerprint of Ca 2+ > Na + > Mg 2+ > K +<br />
and HCO 3<br />
-<br />
> Cl-> NO 3 - > SO 4 2- for both anions and cations. The relative ionic composition of the studied spring<br />
waters were plotted on a Piper Trilinear diagram as presented in Figure 6 (Piper, 1944). This diagram provides a<br />
convenient method to classify and compare water types based on the ionic composition of different water<br />
samples (Hem, 1985). Cation and anion concentrations for the spring waters were converted to meq/l and<br />
plotted as percentages of their respective totals in two triangles (Figure 8). Subsequently, the cation and anion<br />
relative percentages in each triangle were then projected into a quadrilateral polygon that describes the water<br />
type or hydrochemical facies. The values obtained from the analyzed spring waters samples and their plot on the<br />
Piper's diagram (Piper, 1944), revealed Ca 2+ as the dominant cation while HCO 3 - is the dominant anion. In the<br />
study area, the major spring water type is Ca-HCO 3 with Ca-(Cl)-HCO 3 characterised (Figure 8) based on (Back<br />
and Hanshaw, 1965). The plausible explanation as to the evolved water type was from weathering induced<br />
through high precipitation that characterized the study area. However, anthropogenic contributions cannot be<br />
ruled out in view of increase in the number of tourists visiting the spring site.<br />
Hydrological/Flow Characteristics of the Study Spring<br />
The present flow rate was estimated at 0.16L/Sec from which the relevant calculation was done to<br />
generate its equivalence as 14,400L/day. The average daily water requirement per person in Nigeria is 30L/Day<br />
(UNDP 2008), hence, the spring in its present state has the capacity to meet the average daily water requirement<br />
of about 480 people.<br />
Table. 2: Results of the Hydrochemical Analysis<br />
PARAMETER ABSP-1 ABSP-2 ABSP-3 ABSP-4 MIN MAX AVER STDEV WHO[2004] NSDWQ[2007]<br />
Temp(C) 26.8 25.8 25.2 23.6 23.6 26.8 25.35 1.34 27 27<br />
pH 6.0 6.7 7.1 7.2 6 7.2 6.75 0.54 6.5-8.5 6.5-8.5<br />
TDS (Mg/l) 52.5 67.7 83.0 301.0 52.5 301 126.05 117.296 500 500<br />
EC (µS/cm) 74.5 95.0 118.0 426.0 74.5 426 178.375 166.037 900-1200 1000<br />
Mn (Mg/l) 0 0.1 0.22 6.15 0 6.15 1.6175 3.023 0.3 0.2<br />
Fe (Mg/l) 0.32 0.81 0.53 16.23 0.32 16.23 4.4725 7.8409 0.3 0.3<br />
Cu (Mg/l) 0 0 0 0 0 0 0 0 1 1<br />
Zn (Mg/l) 0 0 0 0 0 0 0 0 3 3<br />
Co (Mg/l) 0 0 0 0 0 0 0 0 0.01 0.01<br />
Cr (Mg/l) 0 0 0 0 0 0 0 0 0.01 0.05<br />
Cd (Mg/l) 0 0 0 0 0 0 0 0 0.01 0.03<br />
Pb (Mg/l) 0 0 0 0 0 0 0 0 0.3 0.01<br />
Ni (Mg/l) 0 0 0 0 0 0 0 0 0.02 0.02<br />
www.theijes.com The IJES Page 52
Concentration (Meq/L)<br />
Geophysical And Hydrochemical Evaluation Of Springwater…<br />
10<br />
10<br />
1<br />
1<br />
0.1<br />
0.1<br />
SPRING<br />
STREAM-1<br />
STREAM-2<br />
STREAM-3<br />
0.01<br />
0.01<br />
Ca Mg Na K HCO3 Cl SO4 NO3<br />
Parameters<br />
Figure 7. Schoeller diagram of the Major oxides in the spring water.<br />
Figure 8. Piper Trilinear diagram of the spring water.<br />
Table 3. Results and Statistical Summary of Major Oxides of the Water Samples<br />
Parameters Ca Mg K Na HCO3 CL SO4 NO3<br />
Sample ID Mg/l Mg/l Mg/l Mg/l Mg/l Mg/l Mg/l Mg/l<br />
ABSP-1 2.43 2.56 0.51 3.02 79.2 17.2 0.89 27.88<br />
ABSP-2 3.44 3.42 0.93 4.13 86.4 24.4 1 25.64<br />
ABSP-3 3.95 3.55 1.11 4.06 57.6 24.4 0.79 26.11<br />
ABSP-4 20.24 13.36 1.34 21.35 108 61 2.52 28.93<br />
MIN 2.43 2.56 0.51 3.02 57.6 17.2 0.79 25.64<br />
MAX 20.24 13.36 1.34 21.35 108 61 2.52 28.93<br />
AVER 7.515 5.7225 0.9725 8.14 82.8 31.75 1.3 27.14<br />
STDEV 8.50681 5.11058 0.35103 8.82128 20.7846 19.7932 0.81784 1.53434<br />
WHO[<br />
2004]<br />
75 50 10 50 100 250<br />
250 50<br />
NS[ 2007] 75 50 10 50<br />
100<br />
250<br />
100 50<br />
www.theijes.com The IJES Page 53
Geophysical And Hydrochemical Evaluation Of Springwater…<br />
This figure can be improved with further enhancement of the discharge of the spring. This is contrary<br />
to an earlier estimate quoted at 2.0L/Sec which is equivalent to 172,800L/day in the previous investigation.<br />
However, the current estimated flow rate is significant if sustained throughout the year.<br />
VI. CONCLUSION AND RECOMMENDATIONS<br />
Geophysical and hydrochemical evaluation of the spring water located within the campus of Afe<br />
Babalola University, Ado-Ekiti has been undertaken. Four subsurface layers namely; Lateritic Top-soil, Clayeysand,<br />
Weathered basement and the presumed Fresh basement were delineated and the aquiferous layer<br />
responsible for the accumulation of the spring water was identified to be the Clayey-sand unit. The thin (1.0m)<br />
lateritic overburden thickness and the shallow basement depth at the spring spot is responsible for the discharge<br />
at this point. The lateritic clay topsoil serves as the protective unit for the aquifer against possible surface<br />
contaminant infiltration. Hydrochemical analysis of water samples from the spring and other points at the<br />
downstream revealed that the spring water fall well within the acceptable limit of both World Health<br />
Organisation (WHO) and Nigerian Standard for Drinking Water Quality (NSDWQ). Hydrochemical<br />
characterization of the water using Piper trilinear diagram suggested Ca-HCO 3 water type which indicates a<br />
product of rock-water interaction. The present flow rate was estimated at 14,400L/day and average daily water<br />
requirement per person in Nigeria is 30L/Day (UNDP 2008), hence, the spring in its present state has the<br />
capacity to meet the average daily water requirement of about 480 people. This figure can be improved with<br />
further enhancement of the discharge of the spring. However, the current estimated flow rate is significant if<br />
sustained throughout the year.<br />
Finally, the following recommendations are made;<br />
[1] The flow rate of the spring should be monitored during dry season.<br />
[2] Bacteriological analysis should be carried out to eliminate any doubt of probable bacteriological<br />
contamination.<br />
[3] Geotechnical reinforcement of the spring discharge area should be undertaken to enhance and optimise the<br />
discharge from the spring.<br />
[4] Channels and Subsurface storage facility should be constructed after detail geotechnical and geophysical<br />
investigation to evaluate the embankment requirement of the study area.<br />
REFERENCE<br />
[1] Pearce, A. J., Stewart M. K. and Sklash, M. D. 1998, Storm runoff generation. Water resources research. Vol. 22. No 8. P1263-<br />
1272.<br />
[2] Back, W. and Hanshaw, B (eds), Chemical geohydrology advances in hydroscience; (Academic Press), 1965, pp. 49-109.<br />
[3] Birk S, Liedl R, Sauter M (2004) Identification of localized recharge and conduit flow by combined analysis of hydraulic and<br />
physiochemical spring responses(Urenbrunne, SW-Germany). J Hydrology 286: 179-193<br />
[4] Rehrl, C. and Birk, S. 2010, Hydrogeological Characterisation and Modelling of Spring Catchments in a Changing Environment.<br />
Austrian Journal of Earth Sciences Volume 103 Issue 2, p106-117 Vienna.<br />
[5] Clerk L (1985). Groundwater Abstraction from Basement Complex Areas of Africa. J. Eng. Geol., London 18: 25-34.<br />
[6] Dutcher, L.C. and Garrett. A.A., 1963, Geologic and hydrologic features of the San Bernardino area , Califonia: U.S.Geological<br />
survey Water-Supply Paper 1419, 114p.<br />
[7] Grant, F. S., West, G. F, (1965). Interpretation theory in Applied Geophysics. New York, McGraw-Hill<br />
[8] Hem, J. D, Study and interpretation of the chemical characteristics of natural water. US Geological Survey Water-supply Paper,<br />
1985, 2254, 3rd ed., p263.<br />
[9] Nigerian Standard for Drinking Water Quality, NSDWQ. Published by Nigerian Industrial Standard 2007, 554, 1-14.<br />
[10] Ojo, J.S., Olorunfemi, M.O. and Falebita, D.E, An Appraisal of the Geologic Structure beneath the Ikogosi Warm Spring in South-<br />
Western Nigeria Using Integrated Surface Geophysical Methods. Earth Sciences Research Journal. 2011, 15(1):27-34.<br />
[11] Oladipo, A. A., Oluyemi, E. A., Tubosun, I. A., Fasisi, M. K. and Ibitoye, F. I, Chemical Examination of Ikogosi Warm Spring in<br />
South Western Nigeria. Journal of Applied Sciences, 2005, 5 (1): 75-79<br />
[12] Olayinka A. I. and Weller A. 1997. The inversion of geoelectrical data for hydrogeological applications in crystalline basement<br />
areas of Nigeria. Journ. of Applied Geosciences, Vol. 37, Issue 2, June 1997, pp 103 – 105.<br />
[13] Olayinka A. I, and Olorunfemi M. O. (1992). Determination of geoelectrical Characteristic in Okene Area and implication for<br />
boreholes setting. J. Min. Geol., 28: 403 - 412.<br />
[14] Olorunfemi M. O. & Olayinka A. I. (1992): Alteration of Geoelectric in Okene are and Implication for Borehole Sitting. Journal of<br />
Mining and Geology, pp. 403-411.<br />
[15] Olorunfemi M. O. & Oloruniwo M. A. (1985): Geoelectric Parameters and Aquifer Characteristics of Some Part of South Western<br />
Nigeria. Journal of Mining and Geology. Part 1, pp. 99-109.<br />
[16] Olorunfemi M. O. (1990): The Hydrogeological Implication of Topographic Variation with Overburden Thickness in Basement<br />
Complex. Area of South Western Nigeria. Journal of Mining and Geology. Vol 26, No. 1.<br />
[17] Olorunfemi M. O. and Fasuyi S. A. (1993). Aqufier types and geoelectric/hydrogeologic characteristics of part of central basement<br />
terrain of Nigeria (Niger State). J. Africa Earth Sci., 16(3): 309-317.<br />
[18] Oyawoye, M. O, 1964. The Geology of the Nigerian Basement Complex. Journ. Nigerian Min. Geol. and Metall. Soc. Vol 1. pp 108<br />
- 117<br />
[19] Piper, A. M, A graphic procedure in the geochemical interpretation of water analyses. Trans. Am.Geophy. Union 1944, 25: 914-<br />
928.<br />
www.theijes.com The IJES Page 54
Geophysical And Hydrochemical Evaluation Of Springwater…<br />
[20] Rahaman MA (1989). Review of the basement geology of southwestern Nigeria: In Geology of Nigeria (Kogbe CA Ed.). Elizabeth<br />
Publishing.Co. Nigeria. pp. 41-58.<br />
[21] Rahaman, M. A. 1988. Recent advances in the study of the basement complex of Nigeria, Precambrian Geology of Nigeria, Pub. of<br />
the Geol. Surv. Of Nigeria, Kaduna pp. 11 – 41<br />
[22] Rahaman, M. N. 1976. Review of the basement geology of southwestern Nigeria, in geology of Nigeria, edited by C. A. Kogbe,<br />
Elizabethan pub. Co. Lagos. pp. 41 - 58<br />
[23] Schoeller, H, Geochemistry of groundwater. An international guide for research and practice. UNESCO, 1967, chap 15, pp 1-18.<br />
[24] Talabi, A. O., 2013, Hydrogeochemistry and Stable Isotopes (δ18O and δ2H) Assessment of Ikogosi Spring Waters. American<br />
Journal of Water Resources, 2013, Vol. 1, No. 3, 25-33.<br />
[25] Tunbosun , I. A., Lancelot, J. R., Rahaman , M. A., Ocan, O. (1984) . U/Pb Pan-African ages of two charnockite-granite<br />
associations from Southwestern Nigeria.Contr. Min. Petrol. Pp 88, 188-195.<br />
[26] UN, 1988. Ground Water in North and West Africa. Natural Resources/Water Series No. 18,United Nations, New York<br />
[27] US EPA (2003) National primary drinking water regulations. US EPA, Washington. DC<br />
[28] World Health Organization (WHO), “Guidelines for Drinking Water Quality”, 2004, Vol.1: Recommendations (3rd edn). WHO,<br />
Geneva.<br />
www.theijes.com The IJES Page 55