Endowment & Similar Funds - Penn State University
Endowment & Similar Funds - Penn State University
Endowment & Similar Funds - Penn State University

You also want an ePaper? Increase the reach of your titles
YUMPU automatically turns print PDFs into web optimized ePapers that Google loves.
<strong>Endowment</strong> & <strong>Similar</strong> <strong>Funds</strong><br />
Investment Review for Calendar 2010 Submitted March 2011<br />
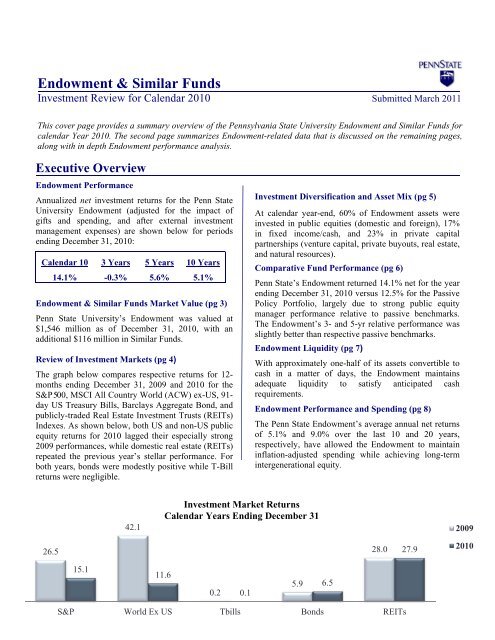
This cover page provides a summary overview of the <strong>Penn</strong>sylvania <strong>State</strong> <strong>University</strong> <strong>Endowment</strong> and <strong>Similar</strong> <strong>Funds</strong> for<br />
calendar Year 2010. The second page summarizes <strong>Endowment</strong>-related data that is discussed on the remaining pages,<br />
along with in depth <strong>Endowment</strong> performance analysis.<br />
Executive Overview<br />
<strong>Endowment</strong> Performance<br />
Annualized net investment returns for the <strong>Penn</strong> <strong>State</strong><br />
<strong>University</strong> <strong>Endowment</strong> (adjusted for the impact of<br />
gifts and spending, and after external investment<br />
management expenses) are shown below for periods<br />
ending December 31, 2010:<br />
Calendar 10 3 Years 5 Years 10 Years<br />
14.1% -0.3% 5.6% 5.1%<br />
<strong>Endowment</strong> & <strong>Similar</strong> <strong>Funds</strong> Market Value (pg 3)<br />
<strong>Penn</strong> <strong>State</strong> <strong>University</strong>’s <strong>Endowment</strong> was valued at<br />
$1,546 million as of December 31, 2010, with an<br />
additional $116 million in <strong>Similar</strong> <strong>Funds</strong>.<br />
Review of Investment Markets (pg 4)<br />
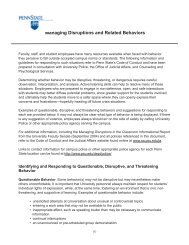
The graph below compares respective returns for 12-<br />
months ending December 31, 2009 and 2010 for the<br />
S&P 500, MSCI All Country World (ACW) ex-US, 91-<br />
day US Treasury Bills, Barclays Aggregate Bond, and<br />
publicly-traded Real Estate Investment Trusts (REITs)<br />
Indexes. As shown below, both US and non-US public<br />
equity returns for 2010 lagged their especially strong<br />
2009 performances, while domestic real estate (REITs)<br />
repeated the previous year’s stellar performance. For<br />
both years, bonds were modestly positive while T-Bill<br />
returns were negligible.<br />
Investment Diversification and Asset Mix (pg 5)<br />
At calendar year-end, 60% of <strong>Endowment</strong> assets were<br />
invested in public equities (domestic and foreign), 17%<br />
in fixed income/cash, and 23% in private capital<br />
partnerships (venture capital, private buyouts, real estate,<br />
and natural resources).<br />
Comparative Fund Performance (pg 6)<br />
<strong>Penn</strong> <strong>State</strong>’s <strong>Endowment</strong> returned 14.1% net for the year<br />
ending December 31, 2010 versus 12.5% for the Passive<br />
Policy Portfolio, largely due to strong public equity<br />
manager performance relative to passive benchmarks.<br />
The <strong>Endowment</strong>’s 3- and 5-yr relative performance was<br />
slightly better than respective passive benchmarks.<br />
<strong>Endowment</strong> Liquidity (pg 7)<br />
With approximately one-half of its assets convertible to<br />
cash in a matter of days, the <strong>Endowment</strong> maintains<br />
adequate liquidity to satisfy anticipated cash<br />
requirements.<br />
<strong>Endowment</strong> Performance and Spending (pg 8)<br />
The <strong>Penn</strong> <strong>State</strong> <strong>Endowment</strong>’s average annual net returns<br />
of 5.1% and 9.0% over the last 10 and 20 years,<br />
respectively, have allowed the <strong>Endowment</strong> to maintain<br />
inflation-adjusted spending while achieving long-term<br />
intergenerational equity.<br />
42.1<br />
Investment Market Returns<br />
Calendar Years Ending December 31<br />
2009<br />
26.5<br />
28.0<br />
27.9<br />
2010<br />
15.1<br />
11.6<br />
5.9 6.5<br />
0.2 0.1<br />
S&P World Ex US Tbills Bonds REITs<br />
1
5-Year <strong>Endowment</strong> Facts and Figures<br />
----———-—— Annual Periods Ending December 31 —————----<br />
2010 2009 2008 2007 2006<br />
Investment Performance<br />
<strong>Endowment</strong> 1 14.1% 13.0% -22.7% 13.9% 16.2%<br />
(annualized net returns)<br />
Market Values ($ millions)<br />
<strong>Endowment</strong> 1 1,545.8 1,356.5 1,216.4 1,579.9 1,397.9<br />
<strong>Similar</strong> <strong>Funds</strong> 2 116.5 103.2 90.4 116.9 109.9<br />
<strong>Endowment</strong> and <strong>Similar</strong> <strong>Funds</strong> 1,662.3 1,459.7 1,306.8 1,696.8 1,507.8<br />
Gifts & Other Additions ($ mils) 71.4 63.4 63.6 42.8 59.7<br />
Current Spending ($ mils) 62.5 64.3 62.4 60.6 56.0<br />
1) <strong>Endowment</strong> assets over which <strong>Penn</strong> <strong>State</strong>’s Office of Investment Management (OIM) has investment<br />
responsibility, as approved by the <strong>Penn</strong> <strong>State</strong> Investment Council (PSIC).<br />
2) <strong>Similar</strong> <strong>Funds</strong> — includes donor-restricted and deferred gifts, plus funds in transit to <strong>Endowment</strong>.<br />
<strong>Penn</strong> <strong>State</strong> Investment Council (PSIC) Meetings<br />
February 26:<br />
Investing $50 million with JKMilne Asset Management in Core Fixed Income.<br />
June 25:<br />
Investing $25 million with Chilton Investment Company in Global Natural Resources Long-Short Strategy.<br />
Committing $10 million each to Oaktree Capital Management Power Opportunities Fund III L.P. and<br />
Commonfund Capital Venture Partners IX L.P.<br />
August 13:<br />
<br />
Committing $15 million to Wellspring Capital Partners V, L.P.<br />
October 29:<br />
<br />
<br />
<br />
December 12:<br />
<br />
Maintain <strong>Penn</strong> <strong>State</strong>’s <strong>Endowment</strong> spending at a 4.5% annual rate.<br />
Committing $10 million to Yorktown Energy IX, L.P.<br />
Committing $15 million to EnCap Energy VIII, L.P.<br />
Committing $15 million to Oaktree Real Estate Opportunities Fund V, L.P.<br />
Please note that commitments made to Limited Partnerships (LPs) are not immediately invested and are called (paid<br />
in) over several years until commitment is satisfied, except as noted.<br />
2
<strong>Endowment</strong> and <strong>Similar</strong> <strong>Funds</strong> Market Value<br />
As of December 31, 2010, <strong>Penn</strong> <strong>State</strong>’s <strong>Endowment</strong> was valued at $1,545.8 million. Non-pooled assets — charitable<br />
remainder trusts, charitable gift annuities, and other life income funds in addition to some donor restricted funds, as<br />
well as cash in transit to the <strong>Endowment</strong> — accounted for an additional $116.5 million, bringing <strong>Penn</strong> <strong>State</strong>’s<br />
<strong>Endowment</strong> and <strong>Similar</strong> <strong>Funds</strong> to $1,662.3 million. The annual market values for the <strong>University</strong>’s <strong>Endowment</strong> and<br />
<strong>Similar</strong> <strong>Funds</strong> for each of the last five calendar years ending December 31 are shown below:<br />
<strong>Endowment</strong> and <strong>Similar</strong> <strong>Funds</strong> Market Value<br />
Calendar Years Ending December 31<br />
($ millions)<br />
1,508<br />
110<br />
1,697<br />
117<br />
1,306<br />
90<br />
1,459<br />
103<br />
1,663<br />
117<br />
1,398<br />
1,580<br />
1,216<br />
1,356<br />
1,546<br />
<strong>Similar</strong> <strong>Funds</strong><br />
<strong>Endowment</strong><br />
2006 2007 2008 2009 2010<br />
From the graph above:<br />
The <strong>Endowment</strong> and <strong>Similar</strong> <strong>Funds</strong>’ total value<br />
increased by $203.6 million during calendar 2010. As<br />
seen in the table on page 2, new gifts added to the Pool<br />
over the last 12 months totaled $71.4 million, while<br />
<strong>Endowment</strong> program support (spending) amounted to<br />
$62.5 million.<br />
The total <strong>Endowment</strong>’s $154.3 million increase since<br />
December 31, 2006 reflects new gift contributions and<br />
reinvested investment earnings, after providing<br />
cumulative program support of $305.8 million.<br />
Inflows of new gifts, along with positive investment returns, have resulted in a cumulative 10.23% increase in the<br />
<strong>Endowment</strong>’s value, net of spending, from December 31, 2006 to December 31, 2010.<br />
3
Review of Investment Markets in Calendar 2010<br />
Following a year of strong double-digit gains, equities in calendar 2010 again handily outperformed fixed income<br />
returns, while non-US indexes generally lagged domestic equity markets. The performance of investment markets that<br />
directly impact <strong>Penn</strong> <strong>State</strong> <strong>University</strong>’s <strong>Endowment</strong> is discussed below.<br />
US Equities<br />
The S&P 500 returned 15.1% for the 12 months<br />
ending December 31, 2010, compared to 26.5% for<br />
calendar 2009, while the large-cap biased Dow Jones<br />
Industrial Index returned 14.1% and 22.7%,<br />
respectively. Small-capitalization stocks, as measured<br />
by the Russell 2000 Index, returned 26.9% versus<br />
27.2% last year. The Nasdaq Index’s 16.9% return was<br />
comparable to the broad domestic indexes in calendar<br />
2010, but much less than its 2009 return of 43.9%.<br />
Non-US Equities<br />
Equities outside the United <strong>State</strong>s generally<br />
underperformed those in the US as the Morgan Stanley<br />
All Country World (ACW) Index ex-US returned<br />
11.6% for the 12-month period ending December 31,<br />
2010. This was well below its calendar 2009 return of<br />
42.1%. Emerging market equities in less developed<br />
countries returned 19.2% over the last 12 months, well<br />
below their 79.0% return in calendar 2009.<br />
Fixed Income<br />
Barclays Capital Aggregate Bond Index (various<br />
maturities of US Government and non-government<br />
domestic bonds) returned 6.5% in calendar 2010<br />
versus 5.9% in 2009. US Treasury Bonds returned<br />
9.4% in calendar 2010 versus -3.6% a year earlier.<br />
For calendar 2010, 91-day Treasury Bills earned 0.1%<br />
versus 0.2% one year ago and Treasury Inflation<br />
Protected Securities (TIPS) returned 6.3% in calendar<br />
2010 compared to 11.4% in calendar 2009.<br />
Real Estate<br />
Publicly-traded Real Estate Investment Trusts (REITs)<br />
returned 27.9% for the calendar year ended December<br />
2010 compared to 28.0% in 2009. Privately-held real<br />
estate investment partnerships, as measured by the<br />
largely commercial property NCREIF Index, returned<br />
5.8% in calendar 2010 compared to -22.1% in 2009.<br />
Alternatives<br />
Private Equity Buyouts and Venture Capital increased<br />
as well, averaging returns of 18.0% and 8.3%,<br />
respectively, for the 12 months ending September 30,<br />
2010 (private capital partnerships are reported on a 3-<br />
month lag). In the previous 12-month period ending<br />
September 30, 2009, Private Equity returned -9.9%,<br />
while Venture Capital lost -12.9%. By comparison, the<br />
Russell 2000 Index of small-capitalization stocks<br />
returned 13.3% for the 12 months ending September<br />
30, 2010 and -9.5% for the year ending September 30,<br />
2009.<br />
Economic and Market Outlook<br />
In the 12 months ending December 31, 2010, global equity markets continued the rally that began in March of 2008.<br />
However, unlike 2009, US equities lead the world indexes. Fixed income markets provided a fourth consecutive year<br />
of positive returns, as the Federal Reserve continued to hold down interest rates to alleviate credit market distress<br />
brought on by the decline in housing prices and the accompanying deleveraging. Looking ahead, expectations for<br />
domestic corporate profits have brightened in the face of improving credit concerns and a recovering economy.<br />
<strong>Penn</strong> <strong>State</strong>’s well-diversified endowment portfolio — consisting of public equities, private partnerships, bonds, and<br />
hedge funds in addition to inflation-sensitive “real assets” — continues to be the most appropriate investment<br />
approach for long-term growth and sustainable spending.<br />
4
Investment Diversification and Asset Mix<br />
Asset allocation is a primary determinant of investment performance and risk control. The <strong>Endowment</strong>’s asset mix<br />
combines three very broad asset categories - public equities, private capital, and fixed income - to maximize potential<br />
returns, while tempering volatility. Reflecting a desire to support generous spending and the need to preserve<br />
purchasing power in light of changing market conditions, the <strong>Penn</strong> <strong>State</strong> Investment Council (PSIC) regularly reviews<br />
the <strong>Endowment</strong>’s investment policy.<br />
In the graph below, the three macro categories – public equities, fixed income, and private capital – are shown in the<br />
outermost ring with their December 31, 2010 allocations of 60%, 17%, and 23%, respectively.<br />
Private Capital<br />
VC/LBO<br />
14%<br />
REITs<br />
2%<br />
TIPS<br />
3%<br />
REAL<br />
7%<br />
NOMINAL<br />
BONDS<br />
13%<br />
GLOBAL<br />
EQUITIES<br />
52%<br />
Public Equities<br />
Fixed Income<br />
FI HF<br />
1%<br />
EQ HF<br />
8%<br />
At a more granular level, the <strong>Endowment</strong>’s diversified portfolio includes a variety of asset classes that comprise the<br />
three macro categories, as shown by the slices within the inner pie (percentages are rounded):<br />
<br />
<br />
60% in Public Equities includes publicly-traded US (37%) and non-US (15%) common stocks, and equityoriented<br />
hedge funds (8%).<br />
17% in Fixed Income includes 13% in nominal bonds (largely US government bonds), 3% in Treasury<br />
Inflation Protected Securities (TIPS), and 1% in an absolute-return hedge fund.<br />
23% in Private Capital includes the following private partnerships: 14% private equity (venture capital,<br />
leveraged buy-outs, distressed-debt), and 9% in real assets (private and public real estate, and energy).<br />
The individual asset classes above represent market values as of December 31, 2010; however, the percentages<br />
fluctuate over time depending on market trends and allocations approved by the <strong>Penn</strong> <strong>State</strong> Investment Council.<br />
The approximately 83% currently allocated to public equities and private capital is intended to take advantage of<br />
capital growth and purchasing power protection offered by equity-type investments. On the other hand, the 17%<br />
invested in fixed income is intended to provide diversification and stability during times of market turbulence.<br />
5
<strong>Endowment</strong> Performance Compared to Passive Portfolio<br />
The <strong>Endowment</strong>’s investment performance is measured against a hypothetical Passive Portfolio, comprised of three<br />
broad asset categories: Public Equities, Private Capital, and Fixed Income. This passive portfolio serves as a blended<br />
benchmark against which the performance of the actual, actively-managed <strong>Endowment</strong> is monitored. In the table<br />
below, the respective static weightings of the three major asset categories, along with respective sub categories, are<br />
associated with corresponding market benchmarks to generate Passive Portfolio returns over 1-, 3-, and 5-year<br />
horizons:<br />
- Annualized Benchmark Returns -<br />
Asset Class Benchmark Weighting 1 Year 3 Years 5 Years<br />
Public Equities (listed on stock exchanges)<br />
US Equities S&P 500 Index 40% 15.1 -2.9 2.3<br />
Non-US Equities All Country World ex US Index 15 11.6 -4.6 5.3<br />
Private Capital (non-marketable alternatives)<br />
Private Equity CA Private Equity Composite 15% 18.0 0.9 10.4<br />
Venture Capital CA Venture Capital Composite 5 8.3 -2.1 4.6<br />
Private Real Estate NCREIF Index 5 5.8 -4.6 3.7<br />
Fixed Income/Cash<br />
Total US Bonds Barclays Aggregate Bonds 20% 6.5 5.9 5.8<br />
Total Passive Portfolio (net) 100% 12.5% -0.9% 4.8%<br />
Note: the above categories / sub-categories are very broad and are assumed to be constant over the entire 5-yr period,<br />
much like a traditional balanced portfolio. As shown on the previous page, the actual endowment portfolio is<br />
comprised of several separate portfolios whose periodic weights vary as a result of fluctuating market returns.<br />
12.5%<br />
14.1%<br />
<strong>Penn</strong> <strong>State</strong> <strong>Endowment</strong> vs Passive Portfolio<br />
4.8%<br />
5.6%<br />
Passive Portfolio<br />
PSU <strong>Endowment</strong><br />
-0.9%<br />
-0.3%<br />
1 Year 3 Year 5 Year<br />
As shown above, <strong>Penn</strong> <strong>State</strong>’s <strong>Endowment</strong> returned<br />
14.1% net for calendar 2010, surpassing the 12.5%<br />
return of the Passive Portfolio. For the trailing 3- and<br />
5-years, the Passive Portfolio would have realized<br />
annualized returns of -0.9% and 4.8%, respectively.<br />
By comparison, the <strong>Endowment</strong>’s actual 3- and 5-year<br />
returns outperformed in each period, netting -0.3% and<br />
5.6%, respectively. Overall, this shows that the<br />
<strong>Endowment</strong>’s investment managers augmented the<br />
performance relative to passive benchmarks.<br />
The Passive Portfolio provides a guidepost to help achieve long-term results that are consistent with the twin<br />
objectives of purchasing-power preservation, along with stable endowment spending. The <strong>Endowment</strong>’s performance<br />
varies from the static Passive Portfolio as a consequence of several factors, including but not limited to the following:<br />
timing of cash-flows into and out of the <strong>Endowment</strong>, tactical shifts in asset mix, and individual investment manager<br />
performance.<br />
6
<strong>Endowment</strong> Liquidity<br />
The financial crisis that erupted in 2008 was characterized, among other considerations, by lack of liquidity. Many<br />
institutions were unable to meet current obligations due to lack of available cash. This was exacerbated by their<br />
inability to readily convert some assets to cash because of reduced trading volumes in some financial instruments.<br />
In the graph below, <strong>Endowment</strong> assets are classified according to how quickly they can be converted to cash. Most<br />
securities listed on exchanges or traded over-the-counter, and held at our custodian bank in separately managed<br />
accounts, can be liquidated on a daily basis (typically 1- and 3-day settlement for bonds and stocks, respectively).<br />
Commingled portfolios, i.e., collectively-managed investment pools of publicly-traded securities, are eligible for<br />
purchase or sale once a month. Hedge fund partnerships are typically open for at least partial liquidation once a year,<br />
with some having more and/or less frequent liquidity “windows.” Non-marketable partnerships are considered illiquid<br />
primarily because of the inability to determine with certainty future cash flows.<br />
Observations from the blue (left) bars of each of the four pairs above for the period ending December 31, 2010:<br />
<br />
<br />
<br />
50% percent of <strong>Endowment</strong> assets are invested in stocks and bonds that can be converted to cash in a matter<br />
of days. Of this, 1% to 2% is held in money market accounts, along with another 4% to 5% in “securitized<br />
cash” (i.e., fully collaterized equities/treasuries futures), making it less likely other assets will need to be<br />
liquidated to satisfy day-to-day cash requirements.<br />
Commingled portfolios, primarily non-US public equity portfolios, comprise 17% of <strong>Endowment</strong> assets and<br />
can be converted to cash monthly or less.<br />
10% of <strong>Endowment</strong> assets are invested in six hedge fund partnerships and can be at least partially converted<br />
to cash annually or in some cases quarterly.<br />
24% percent of <strong>Endowment</strong> assets are invested in 90 different partnerships whose assets are conservatively<br />
considered illiquid because of uncertain timing of future cash flows.<br />
The foregoing indicates that the <strong>Endowment</strong> maintains sufficient liquidity to satisfy anticipated cash requirements.<br />
Increased Liquidity and Investment Performance<br />
As shown above, the liquidity profile of <strong>Penn</strong> <strong>State</strong>’s <strong>Endowment</strong> changed slightly from the end of calendar 2009 (tan<br />
bars) to the end of calendar 2010 (blue bars). Daily liquidity decreased from 52% to 50%. Meanwhile, monthly and<br />
yearly liquidity increased from 14% to 17% and from 9% to 10%, respectively. Illiquid non-marketable alternative<br />
assets remained the same at 24% of <strong>Endowment</strong> assets. Overall, this decreased current liquidity helped the<br />
<strong>Endowment</strong> take advantage improving equity markets worldwide.<br />
7
Long-Term <strong>Endowment</strong> Growth and Spending<br />
In the chart below, the top line represents the cumulative net investment return of the <strong>Penn</strong> <strong>State</strong> <strong>Endowment</strong> over the<br />
last 20 years. The layers illustrate investment return apportioned to program support (spending) and inflation (as<br />
measured by the Higher Education Price Index [HEPI]), with the remaining residual representing net, real (inflationadjusted)<br />
growth.<br />
<strong>Endowment</strong> Investment<br />
Return (9.0% per yr)<br />
Program Support<br />
Inflation (HEPI)<br />
Real Growth<br />
Cumulative 20-year Returns<br />
The <strong>Endowment</strong>’s primary investment goal is to earn a long-term rate of return sufficient to support current spending<br />
and to preserve future purchasing power. This two-pronged objective is illustrated by apportioning total nominal (i.e.,<br />
before adjusting for inflation) investment return (top line above) into layers, representing program support and<br />
inflation, along with a residual layer corresponding to net real growth. Because investment returns periodically<br />
fluctuate (illustrated by the jagged lines above), real growth, which nets out program support and inflation from total<br />
endowment return, oscillates across the horizontal “intergenerational equity” line. While market fluctuations have<br />
caused the growth layer to swing positive and negative, “intergenerational equity” has been achieved on balance.<br />
Two Very Different Decades of Market Performance<br />
The variable nature of investment returns is characterized in the below table which bifurcates the last 20 years into<br />
two consecutive 10-year periods, whose respective investment returns differed widely. The 10 years ending June 2000<br />
(second row) benefitted from an extended equity bull market, while the 10 years ending June 2010 (first row) suffered<br />
two large sell-offs in equities, as shown by the S&P 500’s significant return disparities (left column, last row) below:<br />
10-Year Periods ----------- Annual Nominal Returns ----------- ------ Annual Real Returns ------<br />
Ending December 31 S&P 500 Bond Index <strong>Endowment</strong> HEPI S&P Bonds <strong>Endowment</strong><br />
2000 to 2010 1.4% 5.8% 5.1% 3.4% -2.0% 2.4% 1.7%<br />
1990 to 2000 17.5 8.0 9.0 3.4 14.1 4.6 5.6<br />
Diff (percentage points) -16.1%p -2.2%p -4.0%p 0.0%p -16.1%p -2.2%p -3.9%p<br />
As shown by the negative differentials in the last row above, investment returns for the most recent 10 years lagged<br />
those for the previous 10 years in every instance. Owing to the severity of two bear markets, the S&P 500’s 1.4%<br />
annualized nominal return for the 10-year period ending December 2010 trailed its 17.5% pace for the 10-year period<br />
ending December 2000 by a remarkable 16.1%p (percentage points). Over the same two periods, the respective return<br />
difference for bonds (Barclays Aggregate Bond Index) was -2.2%p and for the <strong>Endowment</strong> was -4.0%p, net of fees.<br />
On an inflation-adjusted basis relative to HEPI (boxed column in above table), the <strong>Endowment</strong>’s net real return<br />
difference was -3.9%p, compared to real differences of -16.1%p for stocks and -2.2%p for bonds (last row of the right<br />
three columns above). Over the past decade, decreased public equity exposure along with increased “alternative<br />
investments” has enabled the <strong>Endowment</strong> to outperform stocks (both nominal and real) for the 10 years ending<br />
December 2010, when overall investment returns were substantially lower than the prior 10-year period.<br />
8