Hand-eye coordination for rapid pointing movements - ResearchGate
Hand-eye coordination for rapid pointing movements - ResearchGate
Hand-eye coordination for rapid pointing movements - ResearchGate

Create successful ePaper yourself
Turn your PDF publications into a flip-book with our unique Google optimized e-Paper software.
379<br />
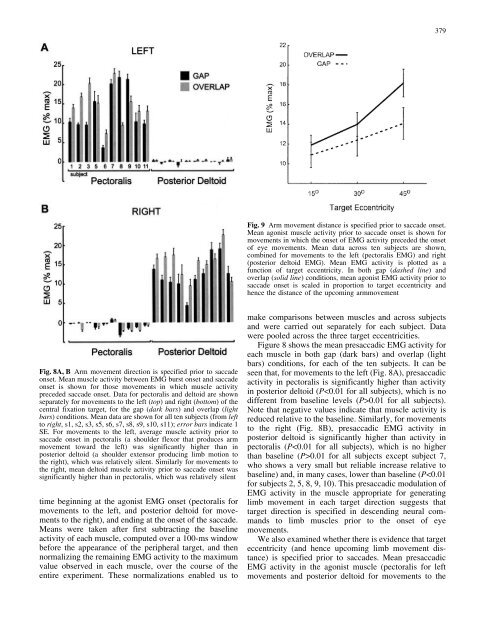
Fig. 9 Arm movement distance is specified prior to saccade onset.<br />
Mean agonist muscle activity prior to saccade onset is shown <strong>for</strong><br />
<strong>movements</strong> in which the onset of EMG activity preceded the onset<br />
of <strong>eye</strong> <strong>movements</strong>. Mean data across ten subjects are shown,<br />
combined <strong>for</strong> <strong>movements</strong> to the left (pectoralis EMG) and right<br />
(posterior deltoid EMG). Mean EMG activity is plotted as a<br />
function of target eccentricity. In both gap (dashed line) and<br />
overlap (solid line) conditions, mean agonist EMG activity prior to<br />
saccade onset is scaled in proportion to target eccentricity and<br />
hence the distance of the upcoming armmovement<br />
Fig. 8A, B Arm movement direction is specified prior to saccade<br />
onset. Mean muscle activity between EMG burst onset and saccade<br />
onset is shown <strong>for</strong> those <strong>movements</strong> in which muscle activity<br />
preceded saccade onset. Data <strong>for</strong> pectoralis and deltoid are shown<br />
separately <strong>for</strong> <strong>movements</strong> to the left (top) and right (bottom) of the<br />
central fixation target, <strong>for</strong> the gap (dark bars) and overlap (light<br />
bars) conditions. Mean data are shown <strong>for</strong> all ten subjects (from left<br />
to right, s1, s2, s3, s5, s6, s7, s8, s9, s10, s11); error bars indicate 1<br />
SE. For <strong>movements</strong> to the left, average muscle activity prior to<br />
saccade onset in pectoralis (a shoulder flexor that produces arm<br />
movement toward the left) was significantly higher than in<br />
posterior deltoid (a shoulder extensor producing limb motion to<br />
the right), which was relatively silent. Similarly <strong>for</strong> <strong>movements</strong> to<br />
the right, mean deltoid muscle activity prior to saccade onset was<br />
significantly higher than in pectoralis, which was relatively silent<br />
time beginning at the agonist EMG onset (pectoralis <strong>for</strong><br />
<strong>movements</strong> to the left, and posterior deltoid <strong>for</strong> <strong>movements</strong><br />
to the right), and ending at the onset of the saccade.<br />
Means were taken after first subtracting the baseline<br />
activity of each muscle, computed over a 100-ms window<br />
be<strong>for</strong>e the appearance of the peripheral target, and then<br />
normalizing the remaining EMG activity to the maximum<br />
value observed in each muscle, over the course of the<br />
entire experiment. These normalizations enabled us to<br />
make comparisons between muscles and across subjects<br />
and were carried out separately <strong>for</strong> each subject. Data<br />
were pooled across the three target eccentricities.<br />
Figure 8 shows the mean presaccadic EMG activity <strong>for</strong><br />
each muscle in both gap (dark bars) and overlap (light<br />
bars) conditions, <strong>for</strong> each of the ten subjects. It can be<br />
seen that, <strong>for</strong> <strong>movements</strong> to the left (Fig. 8A), presaccadic<br />
activity in pectoralis is significantly higher than activity<br />
in posterior deltoid (P0.01 <strong>for</strong> all subjects).<br />
Note that negative values indicate that muscle activity is<br />
reduced relative to the baseline. Similarly, <strong>for</strong> <strong>movements</strong><br />
to the right (Fig. 8B), presaccadic EMG activity in<br />
posterior deltoid is significantly higher than activity in<br />
pectoralis (P0.01 <strong>for</strong> all subjects except subject 7,<br />
who shows a very small but reliable increase relative to<br />
baseline) and, in many cases, lower than baseline (P