
You also want an ePaper? Increase the reach of your titles
YUMPU automatically turns print PDFs into web optimized ePapers that Google loves.
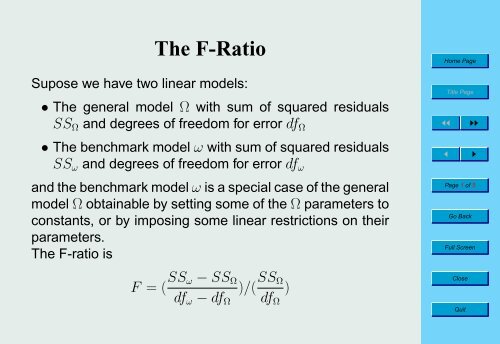
<strong>The</strong> F-<strong>Ratio</strong><br />
Supose we have two linear models:<br />
• <strong>The</strong> general model Ω with sum of squared residuals<br />
SS Ω and degrees of freedom for error df Ω<br />
• <strong>The</strong> benchmark model ω with sum of squared residuals<br />
SS ω and degrees of freedom for error df ω<br />
and the benchmark model ω is a special case of the general<br />
model Ω obtainable by setting some of the Ω parameters to<br />
constants, or by imposing some linear restrictions on their<br />
parameters.<br />
<strong>The</strong> F-ratio is<br />
Home Page<br />
Title Page<br />
◭◭ ◮◮<br />
◭ ◮<br />
Page 1 of 5<br />
Go Back<br />
Full Screen<br />
F = ( SS ω − SS Ω<br />
)/( SS Ω<br />
)<br />
df ω − df Ω df Ω<br />
Close<br />
Quit
Interpreting the F-ratio<br />
Home Page<br />
Title Page<br />
• <strong>The</strong> numerator of the F-ratio is the decrease in error<br />
sum of squares per degree of freedom spent by moving<br />
from the more specific and less powerful model ω to the<br />
more general and powerful model Ω.<br />
• <strong>The</strong> denominator of the F-ratio is the remaining error<br />
sum of squares per parameter left to spend to drive it to<br />
0.<br />
• Each ratio can be considered as a “return on investment”,<br />
degrees of freedom being invested, and decrease<br />
in error sum of squares being returned.<br />
◭◭ ◮◮<br />
◭ ◮<br />
Page 2 of 5<br />
Go Back<br />
Full Screen<br />
Close<br />
Quit
Home Page<br />
Title Page<br />
• We want to keep the move from the benchmark model<br />
ω to the general model Ω if its “return on investment” is<br />
large relative to what remains to be achieved.<br />
• We prefer the benchmark model ω if the “return on investment”<br />
ratio represented by F is near one.<br />
◭◭ ◮◮<br />
◭ ◮<br />
Page 3 of 5<br />
Go Back<br />
Full Screen<br />
Close<br />
Quit
F-ratio and the F-distribution<br />
<strong>The</strong> F-ratio has an F-distribution over repeated samples if,<br />
for any combination of independent variable values, the distribution<br />
of the residuals have<br />
• mean 0 (i. e. the benchmark model is correct)<br />
• standard deviation σ (i. e. is constant)<br />
• a normal distribution<br />
• and are independent of the residuals for any other set<br />
of independent variable values<br />
Home Page<br />
Title Page<br />
◭◭ ◮◮<br />
◭ ◮<br />
Page 4 of 5<br />
Go Back<br />
Full Screen<br />
Close<br />
Quit
Home Page<br />
• If the F-ratio turns out to be surprisingly large relative<br />
to tabled critical values, we should conclude that something<br />
is wrong with one or more of the above assumptions.<br />
• It may not necessarily be the benchmark model that is<br />
wrong.<br />
• Also, in accepting the general model Ω, we only take it<br />
as being better than the benchmark model ω, and not<br />
as necessarily the right model.<br />
Title Page<br />
◭◭ ◮◮<br />
◭ ◮<br />
Page 5 of 5<br />
Go Back<br />
Full Screen<br />
Close<br />
Quit