Competence and performance in causal learning
Competence and performance in causal learning
Competence and performance in causal learning

Create successful ePaper yourself
Turn your PDF publications into a flip-book with our unique Google optimized e-Paper software.
226 WALDMANN AND WALKER<br />
In Phase 2 of the learn<strong>in</strong>g procedure, four different trial types<br />
were presented <strong>in</strong> which <strong>in</strong>formation about two lights was given<br />
while the states of the other two lights were masked with question<br />
marks. Two trial types consisted of pair<strong>in</strong>g the predictive light from<br />
Phase 1 with a new redundant light. Either both lights were off or<br />
both lights were on (e.g., “RED: ON GREEN: ???? WHITE: ON<br />
BLUE: ????”). The other two trial types presented the two other<br />
lights either both on or both off (e.g., “RED: ???? GREEN: ON<br />
WHITE: ???? BLUE: ON”). Whenever the lights <strong>in</strong> either of the<br />
two trial types were on, the light on the back side also was on<br />
(“yes”); otherwise it was off (“no”). These patterns were presented<br />
three times each <strong>in</strong> a r<strong>and</strong>om order. The assignment of the redundant<br />
cue to one of the three lights that were uncovered <strong>in</strong> Phase 2<br />
was counterbalanced. After the learn<strong>in</strong>g phase, participants aga<strong>in</strong><br />
rated the predictiveness of the four lights. The order of the rat<strong>in</strong>g<br />
questions corresponded to the left-to-right sequence of the four<br />
lights <strong>in</strong> the particular counterbalanc<strong>in</strong>g condition to which the participant<br />
was assigned.<br />
Results <strong>and</strong> Discussion<br />
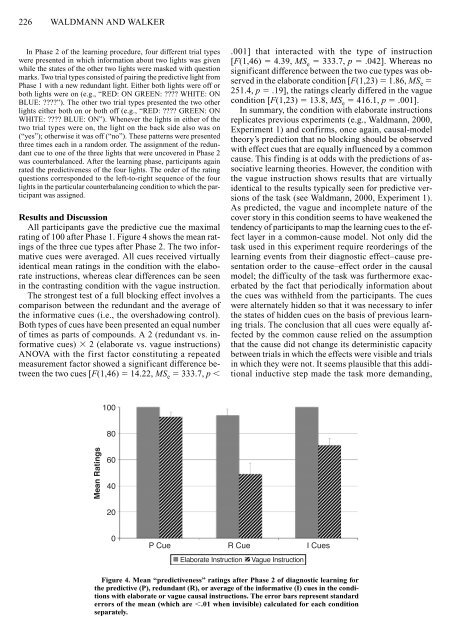
All participants gave the predictive cue the maximal<br />
rat<strong>in</strong>g of 100 after Phase 1. Figure 4 shows the mean rat<strong>in</strong>gs<br />
of the three cue types after Phase 2. The two <strong>in</strong>formative<br />
cues were averaged. All cues received virtually<br />
identical mean rat<strong>in</strong>gs <strong>in</strong> the condition with the elaborate<br />
<strong>in</strong>structions, whereas clear differences can be seen<br />
<strong>in</strong> the contrast<strong>in</strong>g condition with the vague <strong>in</strong>struction.<br />
The strongest test of a full block<strong>in</strong>g effect <strong>in</strong>volves a<br />
comparison between the redundant <strong>and</strong> the average of<br />
the <strong>in</strong>formative cues (i.e., the overshadow<strong>in</strong>g control).<br />
Both types of cues have been presented an equal number<br />
of times as parts of compounds. A 2 (redundant vs. <strong>in</strong>formative<br />
cues) 2 (elaborate vs. vague <strong>in</strong>structions)<br />
ANOVA with the first factor constitut<strong>in</strong>g a repeated<br />
measurement factor showed a significant difference between<br />
the two cues [F(1,46) 14.22, MS e 333.7, p <br />
.001] that <strong>in</strong>teracted with the type of <strong>in</strong>struction<br />
[F(1,46) 4.39, MS e 333.7, p .042]. Whereas no<br />
significant difference between the two cue types was observed<br />
<strong>in</strong> the elaborate condition [F(1,23) 1.86, MS e <br />
251.4, p .19], the rat<strong>in</strong>gs clearly differed <strong>in</strong> the vague<br />
condition [F(1,23) 13.8, MS e 416.1, p .001].<br />
In summary, the condition with elaborate <strong>in</strong>structions<br />
replicates previous experiments (e.g., Waldmann, 2000,<br />
Experiment 1) <strong>and</strong> confirms, once aga<strong>in</strong>, <strong>causal</strong>-model<br />
theory’s prediction that no block<strong>in</strong>g should be observed<br />
with effect cues that are equally <strong>in</strong>fluenced by a common<br />
cause. This f<strong>in</strong>d<strong>in</strong>g is at odds with the predictions of associative<br />
learn<strong>in</strong>g theories. However, the condition with<br />
the vague <strong>in</strong>struction shows results that are virtually<br />
identical to the results typically seen for predictive versions<br />
of the task (see Waldmann, 2000, Experiment 1).<br />
As predicted, the vague <strong>and</strong> <strong>in</strong>complete nature of the<br />
cover story <strong>in</strong> this condition seems to have weakened the<br />
tendency of participants to map the learn<strong>in</strong>g cues to the effect<br />
layer <strong>in</strong> a common-cause model. Not only did the<br />
task used <strong>in</strong> this experiment require reorder<strong>in</strong>gs of the<br />
learn<strong>in</strong>g events from their diagnostic effect–cause presentation<br />
order to the cause–effect order <strong>in</strong> the <strong>causal</strong><br />
model; the difficulty of the task was furthermore exacerbated<br />
by the fact that periodically <strong>in</strong>formation about<br />
the cues was withheld from the participants. The cues<br />
were alternately hidden so that it was necessary to <strong>in</strong>fer<br />
the states of hidden cues on the basis of previous learn<strong>in</strong>g<br />
trials. The conclusion that all cues were equally affected<br />
by the common cause relied on the assumption<br />
that the cause did not change its determ<strong>in</strong>istic capacity<br />
between trials <strong>in</strong> which the effects were visible <strong>and</strong> trials<br />
<strong>in</strong> which they were not. It seems plausible that this additional<br />
<strong>in</strong>ductive step made the task more dem<strong>and</strong><strong>in</strong>g,<br />
100<br />
80<br />
Mean Rat<strong>in</strong>gs<br />
60<br />
40<br />
20<br />
0<br />
P Cue<br />
R Cue<br />
I Cues<br />
Elaborate Instruction Vague Instruction<br />
Figure 4. Mean “predictiveness” rat<strong>in</strong>gs after Phase 2 of diagnostic learn<strong>in</strong>g for<br />
the predictive (P), redundant (R), or average of the <strong>in</strong>formative (I) cues <strong>in</strong> the conditions<br />
with elaborate or vague <strong>causal</strong> <strong>in</strong>structions. The error bars represent st<strong>and</strong>ard<br />
errors of the mean (which are .01 when <strong>in</strong>visible) calculated for each condition<br />
separately.