Imaging the Long-Term Effects of Drug Exposure in Utero - Emory ...
Imaging the Long-Term Effects of Drug Exposure in Utero - Emory ...
Imaging the Long-Term Effects of Drug Exposure in Utero - Emory ...

You also want an ePaper? Increase the reach of your titles
YUMPU automatically turns print PDFs into web optimized ePapers that Google loves.
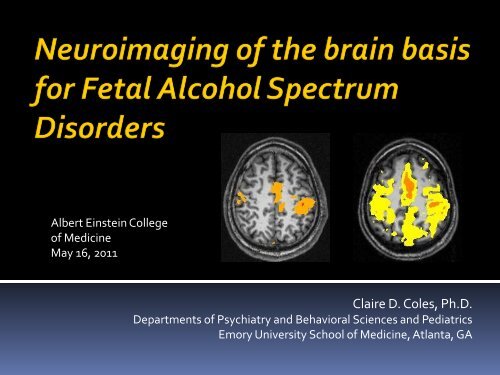
Albert E<strong>in</strong>ste<strong>in</strong> College<br />
<strong>of</strong> Medic<strong>in</strong>e<br />
May 16, 2011<br />
Claire D. Coles, Ph.D.<br />
Departments <strong>of</strong> Psychiatry and Behavioral Sciences and Pediatrics<br />
<strong>Emory</strong> University School <strong>of</strong> Medic<strong>in</strong>e, Atlanta, GA
• Departments <strong>of</strong> Psychiatry<br />
and Behavioral Sciences<br />
and Pediatrics, <strong>Emory</strong><br />
University School <strong>of</strong><br />
Medic<strong>in</strong>e<br />
• Fetal Alcohol and <strong>Drug</strong><br />
<strong>Exposure</strong> Center, at <strong>the</strong><br />
Marcus Autism Center <strong>of</strong><br />
Children’s Health Care <strong>of</strong><br />
Atlanta
• Biomedical <strong>Imag<strong>in</strong>g</strong><br />
Technology Center, Wallace H.<br />
Coulter Center<br />
<strong>Emory</strong> University & Georgia Institute <strong>of</strong><br />
Technology<br />
• Xiaop<strong>in</strong>g P. Hu, Ph.D.<br />
(Director)<br />
• Zhihao Li, Ph.D.<br />
• <strong>Long</strong>chaun Li, Ph.D.<br />
• Xiangchuan Chen, PhD.<br />
• Priya Santhanam, PhD<br />
• Gopikrishna Deshpande, PhD<br />
(Auburn University)<br />
• Maternal Substance Use and<br />
Child Development Laboratory<br />
<strong>Emory</strong> University School <strong>of</strong> Medic<strong>in</strong>e<br />
• Mary Ellen Lynch, Ph.D.<br />
• Julie A. Kable, Ph.D.<br />
• Department <strong>of</strong> Neurology<br />
• Felicia Goldste<strong>in</strong>, PhD.<br />
• Department <strong>of</strong> Psychology<br />
• Stephan Hamann, Ph.D.
Some <strong>of</strong> <strong>the</strong> Research discussed today was supported by:<br />
National Institute on Alcoholism and Alcohol Abuse, R01<br />
AA014373<br />
National Institute on <strong>Drug</strong> Abuse, R01-DA 07362<br />
Georgia Department <strong>of</strong> Human Resources
%<br />
30<br />
25<br />
20<br />
15<br />
10<br />
5<br />
0<br />
Marijuana Coca<strong>in</strong>e O<strong>the</strong>r Alcohol Cigarettes<br />
Ebrahim, SH, & Gfroerer, J (2003) Obstetrics and Gynecology, 101, p374-378
State-Specific Weighted Prevalence Estimates <strong>of</strong> Alcohol Use<br />
(Percentage <strong>of</strong> Any Use/B<strong>in</strong>ge Dr<strong>in</strong>k<strong>in</strong>g)<br />
Among Women Aged 18 – 44 Years — BRFSS, 2008<br />
CA<br />
Guam<br />
28.6<br />
7.1<br />
OR<br />
WA<br />
43.3<br />
12.8<br />
53.1<br />
14.8<br />
53.0<br />
12.9<br />
AK<br />
51.7<br />
18.0<br />
46.1<br />
12.0<br />
NV<br />
MT<br />
ID<br />
45.0<br />
12.9<br />
UT<br />
20.4<br />
6.5<br />
51.6<br />
15.5<br />
AZ<br />
WY<br />
54.4<br />
19.3<br />
NM<br />
49.1<br />
15.0<br />
CO<br />
56.6<br />
14.7<br />
42.6<br />
10.0<br />
44.7<br />
15.5<br />
TX<br />
HI<br />
ND<br />
SD<br />
NE<br />
54.0<br />
23.0<br />
57.0<br />
19.4<br />
53.2<br />
18.9<br />
KS<br />
49.2<br />
12.8<br />
OK<br />
40.9<br />
11.3<br />
43.6<br />
11.6<br />
MN<br />
56.9<br />
19.3<br />
IA<br />
58.2<br />
22.9<br />
49.2<br />
16.0<br />
MO<br />
WI<br />
39.8<br />
11.1<br />
68.4<br />
23.9<br />
AR<br />
55.4<br />
19.4<br />
35.3<br />
45.6<br />
8.9<br />
10.7<br />
LA<br />
41.7<br />
6.1<br />
IL<br />
MS<br />
51.1<br />
MI<br />
NY 12.8<br />
58.8<br />
18.7<br />
PA<br />
52.5<br />
OH<br />
47.6<br />
54.5<br />
18.9<br />
16.3<br />
12.3<br />
WV<br />
28.8<br />
IN<br />
49.5<br />
38.0<br />
6.9<br />
14.7<br />
9.9<br />
VA<br />
KY<br />
40.4<br />
31.7<br />
NC<br />
TN<br />
11.8<br />
8.0<br />
SC<br />
40.8<br />
AL GA<br />
11.4<br />
38.1<br />
47.1<br />
9.5<br />
12.5<br />
U.S. Virg<strong>in</strong> Islands<br />
25.2<br />
7.7<br />
Puerto Rico<br />
FL<br />
64.0<br />
17.9<br />
NJ<br />
VT<br />
ME<br />
58.7<br />
18.2<br />
61.2<br />
NH 12.5<br />
63.1<br />
MA<br />
19.5<br />
CT 58.0<br />
63.9<br />
18.1<br />
RI<br />
52.3<br />
16.0<br />
14.9<br />
55.2<br />
DE<br />
53.8<br />
17.1<br />
MD<br />
14.9<br />
Wash<strong>in</strong>gton, D.C. 62.1<br />
21.9<br />
Any Use<br />
47.7<br />
10.9<br />
B<strong>in</strong>ge<br />
TM
Alcohol is a TERATOGEN:
FAS<br />
• Prenatal<br />
Alcohol<br />
<strong>Exposure</strong><br />
• Face<br />
• Growth<br />
• Bra<strong>in</strong>
• General Cognitive/Learn<strong>in</strong>g Skills (IQ)<br />
• Executive Function<strong>in</strong>g Skills<br />
• Attentional regulation<br />
• Memory,Plann<strong>in</strong>g and organization<br />
• Motor skills<br />
• Visual/spatial skills<br />
• Academic Achievement<br />
• Adaptive Behavior<br />
• Social Behavior<br />
• Mental Health/Behavioral Disorders
• Adult Follow-up <strong>of</strong> Prenatally Identified Cohort-M<br />
age 22.5 Years<br />
• Predom<strong>in</strong>antly African-American, Born 1980 to<br />
1986<br />
• Documented exposure to EtOH and o<strong>the</strong>r drugs<br />
• High levels <strong>of</strong> exposure (M=10+ AAoz/wk= 20+<br />
dr<strong>in</strong>ks)<br />
• <strong>Long</strong>itud<strong>in</strong>al vs Cl<strong>in</strong>ical sample; not biased by<br />
behavior problems, etc<br />
• Developmental and social history known
• Controls- Recruited prenatally, same hospital and<br />
SES, no alcohol exposure.<br />
• Dysmorphic -Recruited prenatally, alcohol<br />
exposed, Dysmorphic Checklist score 1 SD above<br />
group mean.<br />
• ARND - Recruited prenatally, alcohol exposed, no<br />
dysmorphia, IQ
Control<br />
ARND<br />
DYSM<br />
(n = 26)<br />
(n = 36)<br />
(n = 30)<br />
% Males 46.2 27.8 46.7<br />
% A-A 1 100 97.2 100<br />
Age (yrs) 22.7 (1.7) 23.1 (1.6) 23.1 (2.2)<br />
Ed (yrs) 12.3 (1.6) 11.7 (1.5) 11.8 (1.3)<br />
Dysm Score<br />
3.62 (3.3) 4.7 (3.8) 9.43 (7.8)*<br />
FSIQ 2 84.0 (8.6) 80.5 (12.1) 76.0 (12.0)*<br />
AA/oz/wk 0 (0) 7.7 (13.1)* 13.5 (13.6)*<br />
1<br />
. African-American; 2 . Full Scale IQ * Indicates a significant difference
• Structure-Identify structural<br />
changes associated with<br />
prenatal alcohol exposure<br />
(PAE)-sMRI<br />
• White matter <strong>in</strong>tegrity-Us<strong>in</strong>g<br />
Diffusion Tensor <strong>Imag<strong>in</strong>g</strong> (DTI),<br />
identify effects <strong>of</strong> PAE on<br />
structural connectivity<br />
• Activation-Us<strong>in</strong>g fMRI, exam<strong>in</strong>e<br />
differences <strong>in</strong> activation <strong>of</strong><br />
candidate ROIs-Math and<br />
Attention Tasks<br />
3T Siemens<br />
Magnetom Trio<br />
Scanner
• PAE is associated with structural changes <strong>in</strong><br />
bra<strong>in</strong><br />
• PAE affects white matter <strong>in</strong>tegrity<br />
• PAE is associated with alterations <strong>in</strong> BOLD<br />
activation <strong>in</strong> areas responsible for Math<br />
performance<br />
• PAE affects bra<strong>in</strong> networks responsible for<br />
structural and functional connectivity
• 96 separate measurements <strong>of</strong> bra<strong>in</strong> volume, rang<strong>in</strong>g<br />
from total Intracranial volume to subcortical structures<br />
(e.g., hippocampus)us<strong>in</strong>g Free surfer<br />
• Exam<strong>in</strong>ed:<br />
▪ Cortical regions<br />
▪ Subcortical<br />
▪ Corpus Callosum<br />
• Compared:<br />
• Alcohol exposure vs Nonexposed Controls<br />
• Alcohol “affected” vs “non-affected” vs Controls
SFr: Superiorfrontal<br />
RMF: Rostralmiddlefrontal<br />
CMF: Caudalmiddlefrontal<br />
PTr: Parstriangularis<br />
POr: Parsorbitalis<br />
LOF: Lateralorbit<strong>of</strong>rontal<br />
PrC: Precentral<br />
PoC: Postcentral<br />
SuM: Supramarg<strong>in</strong>al<br />
SPa: Superiorparietal<br />
STe: Superiortemporal<br />
ITe: Inferiortemporal<br />
LOc: Lateraloccipital,<br />
CAC: Caudalanteriorc<strong>in</strong>gulate<br />
PCu: Precuneus<br />
Cun: Cuneus<br />
PCa: Pericalcar<strong>in</strong>e<br />
L<strong>in</strong>: L<strong>in</strong>gual<br />
Fus: Fusiform<br />
PHi: Parahippocampal<br />
RAC: Rostralanteriorc<strong>in</strong>gulate<br />
IPa: Inferiorparietal<br />
POp: Parsopercularis.<br />
Cortical regions exhibit<strong>in</strong>g PAE effects (N=92)<br />
Chen, et al., (2011) ) Understand<strong>in</strong>g Specific <strong>Effects</strong> <strong>of</strong> Prenatal Alcohol<br />
<strong>Exposure</strong> on Bra<strong>in</strong> Structure <strong>in</strong> Young Adults, Human Bra<strong>in</strong> Mapp<strong>in</strong>g
Cbr: Cerebral Cortex<br />
Cbe: Cerebellum<br />
Cortex<br />
Tha: Thalamus Proper<br />
Hip: Hippocampus<br />
Put: Putamen<br />
Pal: Pallidum<br />
Amy: Amygdala<br />
Cau: Caudate<br />
Acu: Accumbens<br />
Area.<br />
R: Right Hemisphere,<br />
L: Left Hemisphere.<br />
Sub-cortical regions exhibit<strong>in</strong>g PAE effects, (N=92)
<strong>Effects</strong> <strong>of</strong> Prenatal Alcohol <strong>Exposure</strong> on Corpus Callosum Volume<br />
. Segmentation <strong>of</strong> <strong>the</strong> corpus callosum (A), <strong>in</strong> which some<br />
portions (1, 4 and 5) exhibited <strong>the</strong> general PAE effect (B). 1:<br />
Anterior, 2: Mid-Anterior, 3: Central, 4: Mid-Posterior, 5:<br />
Posterior.<br />
•Chen, X., C.D. Coles, M.E. Lynch, X. Hu (2011, <strong>in</strong> Pre ) Understand<strong>in</strong>g Specific <strong>Effects</strong> <strong>of</strong><br />
Prenatal Alcohol <strong>Exposure</strong> on Bra<strong>in</strong> Structure <strong>in</strong> Young Adults, Human Bra<strong>in</strong> Mapp<strong>in</strong>g ss
250000<br />
200000<br />
150000<br />
100000<br />
50000<br />
Control<br />
EtOH<br />
DYSM<br />
SpecED<br />
In Cerebral<br />
Cortex,<br />
Dysm
250000<br />
200000<br />
150000<br />
100000<br />
50000<br />
Control<br />
EtOH<br />
DYSM<br />
SpecED<br />
0<br />
Lcerebral Rcerebral Lc'bellum Rc'bellum<br />
p
• White matter <strong>in</strong>tegrity-Us<strong>in</strong>g Diffusion<br />
Tensor <strong>Imag<strong>in</strong>g</strong> (DTI), identify effects <strong>of</strong> PAE<br />
<strong>in</strong> corpus callosum<br />
• Assumption, <strong>the</strong>re are specific effects on<br />
White Matter <strong>in</strong>tegrity <strong>in</strong> bra<strong>in</strong>
• Diffusion Tensor <strong>Imag<strong>in</strong>g</strong> exam<strong>in</strong>es white<br />
matter <strong>in</strong>tegrity and white matter tracts.<br />
• Behavioral data <strong>in</strong> alcohol-affected<br />
<strong>in</strong>dividuals suggests a effect on white<br />
matter <strong>in</strong>tegrity.<br />
• Structural neuroimag<strong>in</strong>g studies <strong>in</strong>dicate<br />
differences <strong>in</strong> white matter, particularly<br />
loss <strong>of</strong> white matter <strong>in</strong> alcohol-affected<br />
<strong>in</strong>dividuals.
• FA-Fractional Anistropy-How strongly directional local<br />
tract structure is. Responsive to conditions that affect<br />
axon development or damage axons reflected <strong>in</strong> low FA<br />
and Hi MD.<br />
• MD-Mean diffusivity. Average Diffusion <strong>in</strong> all 3 directions.<br />
• AD-Axial Diffusivity- Mean magnitude <strong>of</strong> water diffusion<br />
parallel to axon direction with<strong>in</strong> <strong>the</strong> voxel <strong>of</strong> axon tractsmeasures<br />
axonal <strong>in</strong>tegrity<br />
• RD-Radial Diffusivity-Mean magnitude <strong>of</strong> water diffusion<br />
perpendicular to axon tracts-measures demylenization
LI, Coles, Lynch, & Hu, Human Bra<strong>in</strong> Mapp<strong>in</strong>g, 2009
Us<strong>in</strong>g TBSS for DTI analysis, voxel-wise statistics on <strong>the</strong> skeletonized FA data reveal<br />
subregions <strong>of</strong> <strong>the</strong> c<strong>in</strong>gulum with significantly lower FA values <strong>in</strong> both PAE groups<br />
versus control subjects.<br />
Skeletonized FA difference between Control and Non-Dysmorphic PAE groups<br />
(green=skeleton, purple=anatomically def<strong>in</strong>ed ROI, p<strong>in</strong>k=region <strong>of</strong> significant<br />
difference). Similar differences were seen between control and dysmorphic PAE<br />
groups.<br />
Santhanam, et al, 2011, <strong>in</strong> press
TBSS results for bilateral<br />
c<strong>in</strong>gulum. ROI shows<br />
significant differences<br />
between<br />
(a) Control and Non<br />
Dysmorphic PAE groups<br />
(b) Control and Dysmorphic<br />
PAE groups <strong>in</strong> FA.<br />
Green <strong>in</strong>dicates mean FA skeleton<br />
and red <strong>in</strong>dicates regions <strong>of</strong><br />
significant difference between<br />
groups, with thickened red-yellow<br />
for <strong>the</strong> bilateral c<strong>in</strong>gulum ROI.<br />
Axial slices shown are z=107 to<br />
z=112.
Controls Non-Dys PAE Dys PAE<br />
Left hand<br />
response to<br />
Opposite side<br />
stimulation (LO)<br />
*Significant difference between Dys-PAE and Control groups <strong>in</strong> premotor area<br />
Controls Non-Dys PAE Dys PAE<br />
Right hand<br />
response to<br />
Opposite side<br />
stimulation (RO)<br />
*Significant difference between Dys-PAE and Control groups <strong>in</strong><br />
primary motor (arrows) and premotor areas
Group maps <strong>of</strong><br />
task-related activation<br />
Difference maps <strong>of</strong><br />
task-related activation<br />
Control-NonDys<br />
Control<br />
Non-dys<br />
PAE<br />
Dys PAE<br />
+<br />
_<br />
Control-Dys<br />
29
Regions <strong>of</strong> default mode deactivation dur<strong>in</strong>g arithmetic task (us<strong>in</strong>g<br />
letter-match<strong>in</strong>g task as basel<strong>in</strong>e). MPFC and PCC clusters from <strong>the</strong>se<br />
group average activation maps were used for subsequent rest<strong>in</strong>g-state<br />
analysis. Color bar <strong>in</strong>dicates <strong>the</strong>se regions are negatively activated.<br />
Figure 1
Rest<strong>in</strong>g-state functional<br />
connectivity (correlation)<br />
group maps (a) with and (b)<br />
without global signal<br />
regression. At threshold<br />
p
FIGURE 3: Difference correlation<br />
maps <strong>of</strong>:<br />
(a) Control-Non Dysmorphic PAE<br />
(b) Control-Dysmorphic PAE<br />
groups seeded at <strong>the</strong> PCC region<br />
and masked at MPFC region<br />
identified <strong>in</strong> Figure 1.<br />
Control groups had more<br />
correlation with <strong>the</strong> MPFC than<br />
ei<strong>the</strong>r exposure group (red-yellow<br />
<strong>in</strong>dicates positive difference).<br />
Threshold used was p
• Task related reactivity <strong>in</strong> DMN affected by<br />
PAE<br />
• Structural Connectivity lower (DTI)<br />
• Functional Connectivity affected (fMRI)<br />
• Implies that structural connectivity deficit<br />
affects functional network <strong>in</strong> system that<br />
modulates attention and cognition
• Genetic differences that characterize women<br />
who use drugs/alcohol dur<strong>in</strong>g pregnancy<br />
• Social factors, like nutrition, post natal<br />
environment, social class, ethnic group…<br />
• Polydrug exposure prenatally and postnatally<br />
• Experimental characteristics-sample<br />
selection, research design, and so forth
• Evidence for persistent, global deficits even<br />
when SES and postnatal environment<br />
accounted for.<br />
• In addition to global deficits, <strong>the</strong>re may be<br />
specific cognitive problems <strong>in</strong> <strong>the</strong> follow<strong>in</strong>g<br />
areas: Motor function<strong>in</strong>g, visual spatial skills,<br />
math, memory.<br />
• MRI (and fMRI) suggest neurological basis for<br />
behavioral f<strong>in</strong>d<strong>in</strong>gs.
• Coles CD; Li Z (2011) Functional neuroimag<strong>in</strong>g <strong>in</strong><br />
<strong>the</strong> exam<strong>in</strong>ation <strong>of</strong> effects <strong>of</strong> prenatal alcohol<br />
exposure.<br />
• Lebel C; Roussotte F; Sowell ER (2011) <strong>Imag<strong>in</strong>g</strong><br />
<strong>the</strong> impact <strong>of</strong> prenatal alcohol expsure on <strong>the</strong><br />
structure <strong>of</strong> <strong>the</strong> develop<strong>in</strong>g human bra<strong>in</strong>.<br />
• Wozniak JR; Muetzel RL (2011) What does<br />
diffusion tensor imag<strong>in</strong>g reveal about <strong>the</strong> bra<strong>in</strong><br />
and cognition <strong>in</strong> fetal alcohol spectrum disorders?
• 20 years <strong>of</strong> research<br />
• Bra<strong>in</strong> Volume -Smaller <strong>in</strong> Diagnosed cases<br />
and prenatal exposure<br />
• With total BV controlled, specific effects<br />
noted <strong>in</strong> corpus callosum, caudate,<br />
hippocampus, cerebellum. O<strong>the</strong>r areas also<br />
noted.<br />
• Both white and grey matter affected but<br />
white more affected.<br />
• Sowell and colleagues-cortical thicken<strong>in</strong>g<br />
• Reductions found more <strong>of</strong>ten <strong>in</strong> frontal,<br />
parietal. O<strong>the</strong>r areas less studied.
• 7 Studies, 2 with adults, 5 with older children<br />
and adolescents.<br />
• Microstructural anomalies found <strong>in</strong> many<br />
regions studied, but particularly, Corpus<br />
Callosum<br />
• Structural and functional deficits appear related<br />
• DTI seems sensitive to teratogenic effects <strong>of</strong><br />
alcohol; however, effects are not specific but<br />
similar to those <strong>in</strong> o<strong>the</strong>r disorders<br />
• Lack <strong>of</strong> developmental norms makes<br />
<strong>in</strong>terpretation difficult.