2001 Qantas Financial Report
2001 Qantas Financial Report
2001 Qantas Financial Report

You also want an ePaper? Increase the reach of your titles
YUMPU automatically turns print PDFs into web optimized ePapers that Google loves.
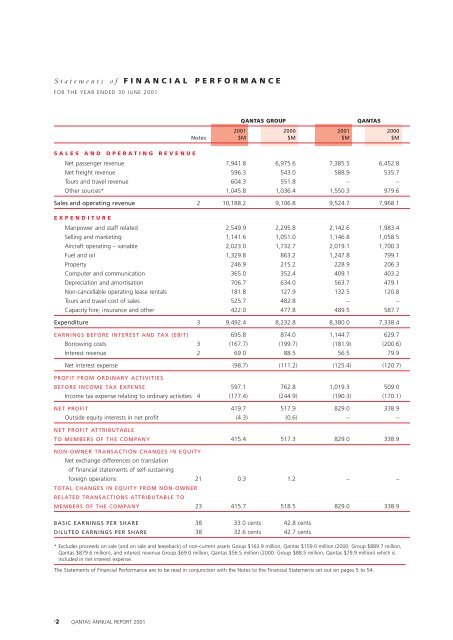
Statements of FINANCIAL PERFORMANCE<br />
FOR THE YEAR ENDED 30 JUNE <strong>2001</strong><br />
QANTAS GROUP<br />
QANTAS<br />
<strong>2001</strong> 2000 <strong>2001</strong> 2000<br />
Notes $M $M $M $M<br />
SALES AND OPERATING REVENUE<br />
Net passenger revenue 7,941.8 6,975.6 7,385.5 6,452.8<br />
Net freight revenue 596.3 543.0 588.9 535.7<br />
Tours and travel revenue 604.3 551.8 – –<br />
Other sources* 1,045.8 1,036.4 1,550.3 979.6<br />
Sales and operating revenue 2 10,188.2 9,106.8 9,524.7 7,968.1<br />
EXPENDITURE<br />
Manpower and staff related 2,549.9 2,295.8 2,142.6 1,983.4<br />
Selling and marketing 1,141.6 1,051.0 1,146.8 1,058.5<br />
Aircraft operating – variable 2,023.0 1,732.7 2,019.1 1,700.3<br />
Fuel and oil 1,329.8 863.2 1,247.8 799.1<br />
Property 246.9 215.2 228.9 206.3<br />
Computer and communication 365.0 352.4 409.1 403.2<br />
Depreciation and amortisation 706.7 634.0 563.7 479.1<br />
Non-cancellable operating lease rentals 181.8 127.9 132.5 120.8<br />
Tours and travel cost of sales 525.7 482.8 – –<br />
Capacity hire, insurance and other 422.0 477.8 489.5 587.7<br />
Expenditure 3 9,492.4 8,232.8 8,380.0 7,338.4<br />
EARNINGS BEFORE INTEREST AND TAX (EBIT) 695.8 874.0 1,144.7 629.7<br />
Borrowing costs 3 (167.7) (199.7) (181.9) (200.6)<br />
Interest revenue 2 69.0 88.5 56.5 79.9<br />
Net interest expense (98.7) (111.2) (125.4) (120.7)<br />
PROFIT FROM ORDINARY ACTIVITIES<br />
BEFORE INCOME TAX EXPENSE 597.1 762.8 1,019.3 509.0<br />
Income tax expense relating to ordinary activities 4 (177.4) (244.9) (190.3) (170.1)<br />
NET PROFIT 419.7 517.9 829.0 338.9<br />
Outside equity interests in net profit (4.3) (0.6) – –<br />
NET PROFIT ATTRIBUTABLE<br />
TO MEMBERS OF THE COMPANY 415.4 517.3 829.0 338.9<br />
NON-OWNER TRANSACTION CHANGES IN EQUITY<br />
Net exchange differences on translation<br />
of financial statements of self-sustaining<br />
foreign operations 21 0.3 1.2 – –<br />
TOTAL CHANGES IN EQUITY FROM NON-OWNER<br />
RELATED TRANSACTIONS ATTRIBUTABLE TO<br />
MEMBERS OF THE COMPANY 23 415.7 518.5 829.0 338.9<br />
BASIC EARNINGS PER SHARE 38 33.0 cents 42.8 cents<br />
DILUTED EARNINGS PER SHARE 38 32.6 cents 42.7 cents<br />
* Excludes proceeds on sale (and on sale and leaseback) of non-current assets Group $163.9 million, <strong>Qantas</strong> $159.0 million (2000: Group $889.7 million,<br />
<strong>Qantas</strong> $879.6 million), and interest revenue Group $69.0 million, <strong>Qantas</strong> $56.5 million (2000: Group $88.5 million, <strong>Qantas</strong> $79.9 million) which is<br />
included in net interest expense.<br />
The Statements of <strong>Financial</strong> Performance are to be read in conjunction with the Notes to the <strong>Financial</strong> Statements set out on pages 5 to 54.<br />
p<br />
2 QANTAS ANNUAL REPORT <strong>2001</strong>