Qatar: Solid Waste Management Phase 1 Assessment
Qatar: Solid Waste Management Phase 1 Assessment
Qatar: Solid Waste Management Phase 1 Assessment

Create successful ePaper yourself
Turn your PDF publications into a flip-book with our unique Google optimized e-Paper software.
<strong>Qatar</strong>: <strong>Solid</strong> <strong>Waste</strong> <strong>Management</strong><br />
<strong>Phase</strong> 1 <strong>Assessment</strong>
<strong>Solid</strong> waste market dynamics based on waste sources and<br />
their movement across the value chain<br />
<strong>Solid</strong> <strong>Waste</strong> Value Chain<br />
Market<br />
Collection<br />
Sorting<br />
Treatment/<br />
Valorization<br />
Disposal<br />
Household<br />
Landfill<br />
Commercial<br />
<strong>Waste</strong><br />
sources<br />
Industrial<br />
Construction<br />
& Demolition<br />
Incinerator<br />
Hazardous<br />
Flow of waste<br />
Source: BCG experience
Six key stakeholders currently in <strong>Qatar</strong>'s waste management<br />
regulatory framework<br />
Stakeholder<br />
Ministry of Environment<br />
Ministry of Municipality &<br />
Urban Planning<br />
Ministry of Business & Trade<br />
Responsible for...<br />
• Writing and enforcing environmental regulations and standards across<br />
the waste streams along the value chain<br />
• Also responsible for operations of household and commercial treatment<br />
and disposal<br />
• Operations of waste collection of household and commercial waste<br />
• Licensing (granting registration certificate) new businesses across all<br />
industries in <strong>Qatar</strong><br />
<strong>Qatar</strong> Petroleum<br />
• Overlooking all waste management activities for hazardous and nonhazardous<br />
waste in all concession areas across <strong>Qatar</strong><br />
Supreme Council of Health<br />
• Enforcement of MoE designed regulations for managing medical<br />
hazardous waste across the country<br />
Ministry of Energy &<br />
Industry<br />
• Licensing new businesses with a manufacturing/industrial nature
Eight private sector players in the solid waste management market<br />
Company<br />
interviewed<br />
Seashore<br />
Averda<br />
Venture Golf<br />
Power WM &<br />
Transport Co.<br />
Lucky Group<br />
Al Haya<br />
Al Able Trading &<br />
Contracting Co<br />
Presence along the<br />
value chain<br />
Company highlights<br />
• Focuses on large industrial and commercial clients<br />
• Actively probing opportunities to enter into hazardous waste management<br />
• Aspires to be present across the solid waste management value chain in <strong>Qatar</strong><br />
• Considers <strong>Qatar</strong> to be a strategic country in the region<br />
• Operates in the steel recycling and treatment space<br />
• Has been the single source of Shredded Steel Scrap to Qasco for the last 30 years<br />
• Focuses entirely on servicing multinational projects, malls, residential and industrial<br />
areas<br />
• Focuses on construction and demolition waste<br />
• Plans to double capacity - from 1000 T/month to 2000 T/month for non-ferrous waste<br />
treatment<br />
• Provides solutions for hazardous waste, e-waste<br />
• Focuses on collecting and disposing off domestic, industrial, and construction waste as<br />
well as liquid waste<br />
Source: BCG interview with private players
Most solid waste related assets located in the Mesaieed Industrial City<br />
Does not include treatment capacity provided by private sector<br />
Sorting 1 /<br />
Transfer<br />
Treatment/<br />
Valorization<br />
Disposal<br />
Ras Laffan<br />
2<br />
3b<br />
Household<br />
Domestic<br />
Bulky<br />
1<br />
1<br />
NA<br />
2<br />
1<br />
3<br />
3a<br />
1<br />
Commercial<br />
Domestic<br />
Bulky<br />
1 1<br />
2<br />
NA<br />
1 3a<br />
3a<br />
Dukhan<br />
1<br />
3<br />
1<br />
Industrial<br />
Construction & Demolition<br />
Industrial<br />
NA<br />
NA<br />
TBD<br />
2<br />
Not shown on<br />
map<br />
2<br />
3a 3b<br />
3b<br />
NA<br />
3b<br />
1<br />
1<br />
3a 3a<br />
2<br />
2<br />
3a<br />
1<br />
Mesaieed<br />
Haz<br />
Medical<br />
<strong>Waste</strong><br />
Not shown on map<br />
Tires<br />
NA<br />
3b<br />
Industrial<br />
areas<br />
Domestic waste<br />
treatment center<br />
Non haz waste<br />
treatment facility<br />
Haz waste<br />
treatment center<br />
Landfill open<br />
for govt only<br />
Landfill owned by<br />
industrial city<br />
Landfill open for<br />
private collections<br />
Open for<br />
DSWMC<br />
T.S. operated<br />
by Public Works<br />
T.S. Operated<br />
by MoE<br />
1. Sorting currently does not take place as a unique step. Note: 3: Um Al Afai landfill. 3a (purple): Mesaieed landfill. 3b: (purple): Rawdat Rashid landfill. Source: MMUP, QP, MoE, DSWMC, BCG analysis
Introduction<br />
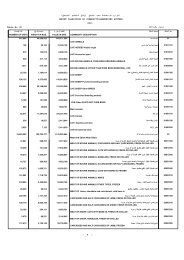
•<strong>Qatar</strong> is generating a total of 28,000 Tones per day of solid waste, of which only 3% is recycled, 4% is<br />
incinerated while the remaining is disposed off into landfills<br />
• Household waste generated = 4,040T; recycling=3%<br />
• Commercial waste generated = 4,040T; recycling=1%<br />
• Construction & Demolition waste generated = 20,000T; recycling=4%<br />
• Hazardous 1 waste generated = 150T; treated=17%; Landfilled=83%<br />
Total solid waste generated in 2032 is expected 1 to be ~19,000 Tones/day , growing at an average<br />
annual growth rate of ~4.2%<br />
•Revenue potential for the solid waste value chain in <strong>Qatar</strong> is estimated 2 to be ~ USD 663M. Significant<br />
opportunities include<br />
• Construction & Demolition Recycling (~USD 105M)<br />
• Household: Recycling (~USD 100M)<br />
• Commercial: Collection (~USD 76M) and Recycling (~USD 100M)<br />
• <strong>Waste</strong> to Energy (WtE): ~USD 135M<br />
1.. Does not include C&D waste 2. Based on pricing benchmarks in "best in class" countries<br />
Source: BCG
28K T/day of waste generated in <strong>Qatar</strong> in 2012, 92% goes to<br />
landfill
75% of household waste is landfilled, while the remainder is mostly<br />
incinerated at Domestic <strong>Solid</strong> <strong>Waste</strong> <strong>Management</strong> Center (DSWMC)<br />
All figures in T/day<br />
Household<br />
Transfer Station: Located<br />
around Doha and industrial<br />
areas, see backup<br />
DSWMC operated by<br />
MoE<br />
Disposal<br />
Domestic<br />
MMUP<br />
collected<br />
Transportation from TS<br />
to DSWMC and landfill<br />
done by MoE<br />
1,570 1,015 2 555<br />
891<br />
51<br />
Incinerator 1<br />
73<br />
Compost<br />
Recyclables<br />
Electricity<br />
22%<br />
Market<br />
3%<br />
Privately<br />
collected<br />
670<br />
Mesaieed<br />
Landfill<br />
Bulky<br />
MRF for plastics, metals, and<br />
aluminum<br />
75%<br />
MMUP<br />
collected<br />
1,800<br />
Um Al Afai<br />
Landfill<br />
Landfill owned<br />
by MoE, is not engineered<br />
1. ~5% of this figure ends as ash in landfill. 2. Total domestic collected by MMUP taken to DSWMC is 1,400.<br />
Source: DSWMC, MoE, MMUP, BCG analysis
91% of commercial waste is landfilled, remainder is treated<br />
at Domestic <strong>Solid</strong> <strong>Waste</strong> <strong>Management</strong> Center (DSWMC)<br />
All figures inT/day<br />
Commercial<br />
Transfer Station: Located<br />
around Doha and industrial<br />
areas, see backup<br />
Disposal<br />
Domestic<br />
MMUP<br />
collected<br />
Transportation from TS<br />
to DSWMC and landfill<br />
done by MoE<br />
590 380 2 210<br />
334 1<br />
27<br />
19<br />
Incinerator 1<br />
Compost<br />
Recyclables<br />
Electricity<br />
8%<br />
Market<br />
1%<br />
Privately<br />
collected<br />
250<br />
91%<br />
Bulky<br />
Mesaieed<br />
Landfill<br />
Privately<br />
collected<br />
3,200<br />
Landfill owned<br />
by MoE, is not engineered<br />
1. ~5% of this figure ends as ash in landfill. 2. Total domestic collected by MMUP taken to DSWMC is 1400 .<br />
Source: DSWMC, MoE, MMUP, BCG analysis
Mesaieed Industrial City: Non-hazardous waste taken to engineered<br />
MIC landfill<br />
All figures in m 3 /day<br />
Industrial<br />
Disposal 2<br />
Domestic<br />
166 3<br />
Contract for local recycling<br />
company to collect paper<br />
at source<br />
Collected and transported<br />
by private company 1<br />
100%<br />
Plans for non hazardous<br />
waste treatment center<br />
in Ras Laffan<br />
MIC landfill<br />
Industrial<br />
46 3<br />
Generators are encouraged to sort at<br />
source by collection companies,<br />
however it is not govt mandated.<br />
Sorting facility for non hazardous<br />
industrial owned by private sector 3<br />
Engineered landfill owned and<br />
operated by QP, only open to preapproved<br />
collectors<br />
1. Private sector player from Kuwait. 2. Landfills are open to private players (with monitoring) for collection of waste. 3. Average volume/day based on QP estimates.<br />
Source: DSWMC, MoE, MMUP, BCG analysis
92% of construction and demolition waste taken to landfill,<br />
large potential for recycling<br />
All figures in T/day<br />
Costruaction<br />
& Demolition<br />
Soil from excavation<br />
activities<br />
C&D waste in Rawdat Rashid to<br />
be auctioned off for treatment<br />
Disposal<br />
All collection is<br />
done by<br />
private sector<br />
800<br />
More valuable waste such as<br />
metal, wood, and certain glass is<br />
pre-sorted at source and is<br />
treated by private players<br />
12,000<br />
Assumption that 90% of noninert<br />
waste is recycled,<br />
remaining 10% is disposed in<br />
landfill<br />
Note: Numbers are based on estimates given at interviews with MoE, MMUP, private sector players, and Rawdat Rashid landfill managers. 1. Assumption that metals, plastics are recycled . Source: MoE, expert<br />
interviews, BCG analysis<br />
720<br />
Treatment by<br />
private players 1<br />
Concrete, sand, cement,<br />
gravel, asphalt<br />
80<br />
720<br />
Rawdat<br />
Rashid<br />
Landfill<br />
96%<br />
92%<br />
72%<br />
Market<br />
4%
Recycling and domestic waste collection perceived by private<br />
players to have the greatest untapped value<br />
High<br />
Non-Hazardous<br />
recycling<br />
Domestic and<br />
commercial collection<br />
Perceived<br />
value in sector<br />
EfW<br />
<strong>Waste</strong> sorting<br />
Hazardous<br />
disposal<br />
Hazardous collection<br />
Biological<br />
treatment<br />
C&D recycling<br />
Non-Hazardous disposal<br />
Tyres recycling<br />
Low<br />
Low<br />
Perceived regulatory attractiveness<br />
High<br />
Source: BCG workshop with private sector players, BCG analysis
<strong>Qatar</strong>'s solid waste management market has ~$663M in<br />
revenue potential
Household, commercial and recycling constitutes largest potential<br />
market size by revenue
<strong>Qatar</strong> has high municipal waste per capita generation<br />
compared to GCC and EU averages ...<br />
MSW per capita per year (2009)<br />
1.000<br />
986<br />
750<br />
664<br />
127<br />
814<br />
500<br />
511<br />
511<br />
438<br />
537<br />
515<br />
250<br />
256<br />
0<br />
Bahrain<br />
<strong>Qatar</strong><br />
Kuwait Saudi Arabia<br />
UAE<br />
Oman<br />
GCC<br />
EU27<br />
United<br />
States<br />
1. <strong>Qatar</strong> data based on QNMP and Oriental Consultants data (1.65 kg/cap/day X 365 days)<br />
Source: EPA, Eurostat, EIU, Frost and Sullivan, <strong>Solid</strong> <strong>Waste</strong> <strong>Management</strong> in GCC: Challenges & Opportunities, Dec 2009
... and <strong>Qatar</strong> does not optimizes its solid waste management when<br />
compared to best in class countries
<strong>Qatar</strong> could be heading for much higher waste generation given<br />
current GDP levels<br />
Municipal waste and real GDP per capita for selected EU countries and US<br />
Real GDP / capita ($k) 1<br />
80<br />
70<br />
R² = 0.59<br />
QT<br />
Trend suggests waste<br />
generation could be<br />
+1,000kg/capita<br />
60<br />
50<br />
40<br />
30<br />
20<br />
BE<br />
GB<br />
SE<br />
GR<br />
XZ<br />
PT<br />
IT<br />
AU<br />
FR<br />
ES<br />
AT<br />
DE<br />
NL<br />
IE<br />
CH<br />
US<br />
400<br />
500<br />
600<br />
700<br />
800<br />
900<br />
Municipal waste / capita (kg)<br />
Source: Eurostat, EPA, EIU
Household waste to reach 5.6k T/day<br />
in 2032 with a peak at 5.7k T/day in 2020<br />
Tons/day<br />
6,000<br />
Forecast of household waste generated 1 (T/day) based on population 2 forecast<br />
Temporary increase due to World Cup<br />
5,724 3<br />
CAGR 1.7 %<br />
Population (M)<br />
5,614<br />
6<br />
5,000<br />
4,000<br />
3,000<br />
2,000<br />
4,065 3<br />
Additional expatriate labor<br />
driven by World Cup 2022<br />
for construction activities<br />
4<br />
Population = Driver for<br />
Household waste<br />
generated<br />
2<br />
1,000<br />
2012<br />
2020<br />
0<br />
2032<br />
Forecasted waste<br />
QNMP forecasts<br />
World Cup increase<br />
Population<br />
Note: Household waste assumed to be driven by population growth at 2% growth; Additional expatriate labor driven by World Cup 2022 for construction activities: <strong>Waste</strong> generation by additional labor estimated to be<br />
50% of per capita generation<br />
1. Based on regression of historic household waste (domestic and bulky) generated as given by MMUP and QNMP, and EIU population figures. 2 Forecast based on population figures provided by QNMP, adjusted<br />
upwards for World Cup 2022. 3. 25 t/day domestic waste generated by MIC included . Source: QNMP, MoE, MMUP, QSA, QP, BCG analysis
Commercial waste to reach 13k T/day in 2032<br />
Tons/day<br />
16,000<br />
12,000<br />
8,000<br />
Forecast of commercial waste generated 1 (t/day) based on services GDP forecast 2<br />
Temporary increase due to World Cup<br />
CAGR 5.7%<br />
Services GDP (M QR)<br />
150,000<br />
Additional waste from<br />
13,083<br />
0.5M tourists estimated at<br />
600 t/day 3 10,946<br />
100,000<br />
GDP services 2 = Driver for<br />
commercial waste<br />
generated<br />
4,000<br />
4,040<br />
50,000<br />
0<br />
2012<br />
2020<br />
0<br />
2032<br />
Forecasted waste<br />
QNMP forecasts<br />
World Cup increase<br />
GDP services<br />
1. Based on regression of historic commercial waste (domestic .and bulky) generated as given by MMUP and QNMP, and GDP estimates from GSDP. 2 . Forecast based on adjusted figures from <strong>Qatar</strong> Statistics Authority<br />
and BCG estimates for trade, restaurants, hotels, agriculture, fishing under "Moving Beyond Carbon" scenario, CAGR for 2012-2023 at 6% CAGR for 2024-2032 at 1.5%. 3. "Market Study on Sub-Services sector in<br />
<strong>Qatar</strong>," Jan 2012.<br />
Note: Commercial waste assumed to be driven by GDP growth of trade, restaurants, hotels and agriculture and fishing growth at 6%<br />
Source: QNMP, MoE, MMUP, QSA, BCG analysis
Medical waste to reach 7K T/day in 2032<br />
Tons/day<br />
20<br />
Forecast of medical waste generated 1 (t/day) based on population forecast 2<br />
Population (M)<br />
CAGR 2%<br />
5<br />
4<br />
10<br />
7<br />
3<br />
2<br />
4<br />
1<br />
0<br />
2012<br />
2020<br />
Forecasted waste QNMP forecasts Population<br />
0<br />
2032<br />
1. Based on the ratio of waste generated from SCH 2011 for public and private sector to total population of 2011. 2. Using GSDP population forecasts, but not including increase for World Cup 2022.<br />
Note: Medical waste driven by increase in population at 2% ; Assumption of steady increase in medical waste, based on 2011 figures. Assumption that increase in population due to World Cup activities will result in an<br />
increase of waste generated equal to 20% of status quo per capita.<br />
Source: Supreme Council of Health, BCG analysis
Successful countries have used 3 key levers to evolve waste<br />
management<br />
Lever Common form of lever Impact<br />
Private investment<br />
• PPP<br />
• Service contracts<br />
• <strong>Management</strong> contracts<br />
• Leasing agreements<br />
25-35%<br />
reduction in waste management costs<br />
in US, EU and Asia<br />
Policy incentives<br />
• Taxes and fees<br />
• Recycling credits/deposit-refunds<br />
• Performance bonds or funds<br />
• Extended Producer Responsibility<br />
25-30%<br />
increase in recycling rates in EU, Japan,<br />
Korea and Singapore<br />
Regulations<br />
• Mandates or targets for<br />
recycling/disposal<br />
• Permitting and licensing<br />
• Bans on improper disposal<br />
1-10%<br />
of waste disposed in landfills in EU,<br />
Singapore and Japan<br />
Source: UNEP
Typical contractual PPP structure around special purpose vehicle<br />
(SPV) or consortium<br />
Government<br />
(Central, regional or local authority)<br />
Private sector consortium<br />
• Defined risk transfer<br />
• Functional output specification<br />
Insurance<br />
(constr. & maint. risks)<br />
SPV—Special purpose vehicle company<br />
consortium<br />
(Equity (5–30%) & debt (> 70%) financed)<br />
Financial<br />
providers<br />
Commercial loans<br />
or bonds<br />
Financial investor<br />
(e.g. banks,<br />
insurances etc.)<br />
Construction<br />
contract<br />
Facility services<br />
agreement<br />
Building<br />
contractor<br />
Facility<br />
management<br />
provider<br />
Operational/contractual<br />
relations<br />
Shareholder/financing<br />
relations<br />
possible<br />
Source: Partnerships UK; Interview NAO Finlay/Ratcliffe