View sample - Report Buyer
View sample - Report Buyer
View sample - Report Buyer
Create successful ePaper yourself
Turn your PDF publications into a flip-book with our unique Google optimized e-Paper software.
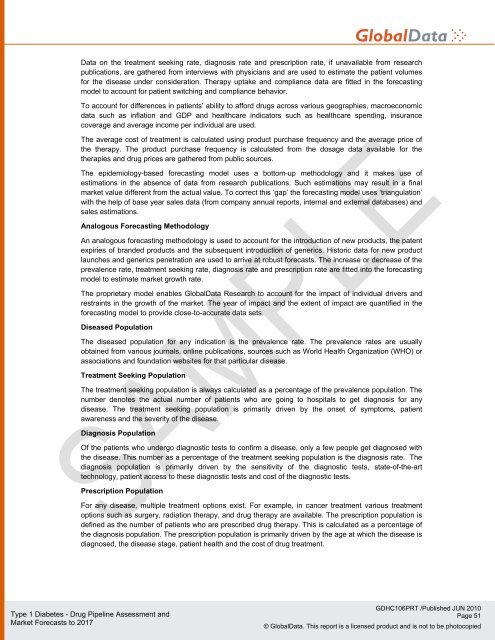
Data on the treatment seeking rate, diagnosis rate and prescription rate, if unavailable from research<br />
publications, are gathered from interviews with physicians and are used to estimate the patient volumes<br />
for the disease under consideration. Therapy uptake and compliance data are fitted in the forecasting<br />
model to account for patient switching and compliance behavior.<br />
To account for differences in patients’ ability to afford drugs across various geographies, macroeconomic<br />
data such as inflation and GDP and healthcare indicators such as healthcare spending, insurance<br />
coverage and average income per individual are used.<br />
The average cost of treatment is calculated using product purchase frequency and the average price of<br />
the therapy. The product purchase frequency is calculated from the dosage data available for the<br />
therapies and drug prices are gathered from public sources.<br />
The epidemiology-based forecasting model uses a bottom-up methodology and it makes use of<br />
estimations in the absence of data from research publications. Such estimations may result in a final<br />
market value different from the actual value. To correct this ‘gap’ the forecasting model uses ‘triangulation’<br />
with the help of base year sales data (from company annual reports, internal and external databases) and<br />
sales estimations.<br />
Analogous Forecasting Methodology<br />
An analogous forecasting methodology is used to account for the introduction of new products, the patent<br />
expiries of branded products and the subsequent introduction of generics. Historic data for new product<br />
launches and generics penetration are used to arrive at robust forecasts. The increase or decrease of the<br />
prevalence rate, treatment seeking rate, diagnosis rate and prescription rate are fitted into the forecasting<br />
model to estimate market growth rate.<br />
The proprietary model enables GlobalData Research to account for the impact of individual drivers and<br />
restraints in the growth of the market. The year of impact and the extent of impact are quantified in the<br />
forecasting model to provide close-to-accurate data sets.<br />
Diseased Population<br />
The diseased population for any indication is the prevalence rate. The prevalence rates are usually<br />
obtained from various journals, online publications, sources such as World Health Organization (WHO) or<br />
associations and foundation websites for that particular disease.<br />
Treatment Seeking Population<br />
The treatment seeking population is always calculated as a percentage of the prevalence population. The<br />
number denotes the actual number of patients who are going to hospitals to get diagnosis for any<br />
disease. The treatment seeking population is primarily driven by the onset of symptoms, patient<br />
awareness and the severity of the disease.<br />
Diagnosis Population<br />
Of the patients who undergo diagnostic tests to confirm a disease, only a few people get diagnosed with<br />
the disease. This number as a percentage of the treatment seeking population is the diagnosis rate. The<br />
diagnosis population is primarily driven by the sensitivity of the diagnostic tests, state-of-the-art<br />
technology, patient access to these diagnostic tests and cost of the diagnostic tests.<br />
Prescription Population<br />
For any disease, multiple treatment options exist. For example, in cancer treatment various treatment<br />
options such as surgery, radiation therapy, and drug therapy are available. The prescription population is<br />
defined as the number of patients who are prescribed drug therapy. This is calculated as a percentage of<br />
the diagnosis population. The prescription population is primarily driven by the age at which the disease is<br />
diagnosed, the disease stage, patient health and the cost of drug treatment.<br />
Type 1 Diabetes - Drug Pipeline Assessment and<br />
Market Forecasts to 2017<br />
GDHC106PRT /Published JUN 2010<br />
Page 51<br />
© GlobalData. This report is a licensed product and is not to be photocopied


