View sample - Report Buyer
View sample - Report Buyer
View sample - Report Buyer

You also want an ePaper? Increase the reach of your titles
YUMPU automatically turns print PDFs into web optimized ePapers that Google loves.
Type 1 Diabetes - Drug Pipeline Assessment and<br />
Market Forecasts to 2017<br />
Reference Code: GDHC106PRT Publication Date: June 2010<br />
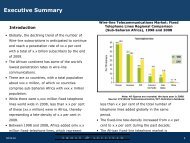
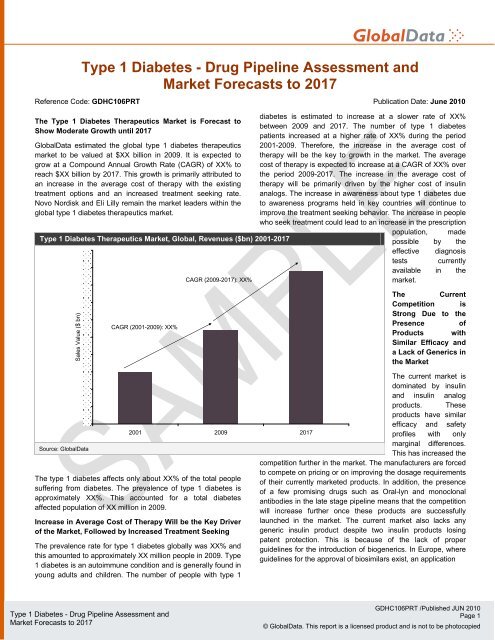
The Type 1 Diabetes Therapeutics Market is Forecast to<br />
Show Moderate Growth until 2017<br />
GlobalData estimated the global type 1 diabetes therapeutics<br />
market to be valued at $XX billion in 2009. It is expected to<br />
grow at a Compound Annual Growth Rate (CAGR) of XX% to<br />
reach $XX billion by 2017. This growth is primarily attributed to<br />
an increase in the average cost of therapy with the existing<br />
treatment options and an increased treatment seeking rate.<br />
Novo Nordisk and Eli Lilly remain the market leaders within the<br />
global type 1 diabetes therapeutics market.<br />
Type 1 Diabetes Therapeutics Market, Global, Revenues ($bn) 2001-2017<br />
CAGR (2009-2017): XX%<br />
diabetes is estimated to increase at a slower rate of XX%<br />
between 2009 and 2017. The number of type 1 diabetes<br />
patients increased at a higher rate of XX% during the period<br />
2001-2009. Therefore, the increase in the average cost of<br />
therapy will be the key to growth in the market. The average<br />
cost of therapy is expected to increase at a CAGR of XX% over<br />
the period 2009-2017. The increase in the average cost of<br />
therapy will be primarily driven by the higher cost of insulin<br />
analogs. The increase in awareness about type 1 diabetes due<br />
to awareness programs held in key countries will continue to<br />
improve the treatment seeking behavior. The increase in people<br />
who seek treatment could lead to an increase in the prescription<br />
population, made<br />
possible by the<br />
effective diagnosis<br />
tests currently<br />
available in the<br />
market.<br />
Sales Value ($ bn)<br />
CAGR (2001-2009): XX%<br />
The Current<br />
Competition is<br />
Strong Due to the<br />
Presence of<br />
Products with<br />
Similar Efficacy and<br />
a Lack of Generics in<br />
the Market<br />
Source: GlobalData<br />
2001 2009 2017<br />
The type 1 diabetes affects only about XX% of the total people<br />
suffering from diabetes. The prevalence of type 1 diabetes is<br />
approximately XX%. This accounted for a total diabetes<br />
affected population of XX million in 2009.<br />
Increase in Average Cost of Therapy Will be the Key Driver<br />
of the Market, Followed by Increased Treatment Seeking<br />
The prevalence rate for type 1 diabetes globally was XX% and<br />
this amounted to approximately XX million people in 2009. Type<br />
1 diabetes is an autoimmune condition and is generally found in<br />
young adults and children. The number of people with type 1<br />
The current market is<br />
dominated by insulin<br />
and insulin analog<br />
products. These<br />
products have similar<br />
efficacy and safety<br />
profiles with only<br />
marginal differences.<br />
This has increased the<br />
competition further in the market. The manufacturers are forced<br />
to compete on pricing or on improving the dosage requirements<br />
of their currently marketed products. In addition, the presence<br />
of a few promising drugs such as Oral-lyn and monoclonal<br />
antibodies in the late stage pipeline means that the competition<br />
will increase further once these products are successfully<br />
launched in the market. The current market also lacks any<br />
generic insulin product despite two insulin products losing<br />
patent protection. This is because of the lack of proper<br />
guidelines for the introduction of biogenerics. In Europe, where<br />
guidelines for the approval of biosimilars exist, an application<br />
Type 1 Diabetes - Drug Pipeline Assessment and<br />
Market Forecasts to 2017<br />
GDHC106PRT /Published JUN 2010<br />
Page 1<br />
© GlobalData. This report is a licensed product and is not to be photocopied
1 Table of contents<br />
1 Table of contents................................................................................................................................... 3<br />
1.1 List of Tables .................................................................................................................................. 5<br />
1.2 List of Figures ................................................................................................................................. 5<br />
2 Type 1 Diabetes Therapeutics Market: Market Characterization........................................................... 6<br />
2.1 Overview......................................................................................................................................... 6<br />
2.2 Type 1 Diabetes Market Size.......................................................................................................... 6<br />
2.3 Type 1 Diabetes Therapeutics Market Forecast and CAGR........................................................... 7<br />
2.4 Drivers and Barriers for the Type 1 Diabetes Therapeutics Market ................................................ 8<br />
2.4.1 Drivers for the Type 1 Diabetes Therapeutics Market ........................................................... 8<br />
2.4.2 Restraints for the Type 1 Diabetes Therapeutics Market....................................................... 9<br />
2.5 Opportunity and Unmet Need ........................................................................................................10<br />
2.6 Key Takeaway ...............................................................................................................................11<br />
3 Type 1 Diabetes Therapeutics Market: Competitive Assessment ........................................................12<br />
3.1 Overview........................................................................................................................................12<br />
3.2 Strategic Competitor Assessment..................................................................................................12<br />
3.3 Product Profile for the Major Marketed Products in the Type 1 Diabetes Disease Market.............13<br />
3.3.1 Lantus (Insulin Glargine) ......................................................................................................13<br />
3.3.2 Humulin (Human Insulin) ......................................................................................................16<br />
3.3.3 Humalog (Insulin Lispro).......................................................................................................17<br />
3.3.4 Novolog (Insulin Aspart) .......................................................................................................19<br />
3.3.5 Novolin (Human Insulin) .......................................................................................................20<br />
3.3.6 Apidra (Insulin Glulisine).......................................................................................................21<br />
3.3.7 Levemir (Insulin Detemir)......................................................................................................23<br />
3.4 Key Takeaway ...............................................................................................................................25<br />
4 Type 1 Diabetes Therapeutics Market: Pipeline Assessment ..............................................................26<br />
4.1 Overview........................................................................................................................................26<br />
4.2 Strategic Pipeline Assessment ......................................................................................................26<br />
4.2.1 Technology Trends Analytic Framework ..............................................................................26<br />
4.3 Type 1 Diabetes Therapeutics – Promising Drugs under Clinical Development............................27<br />
4.4 Molecule Profile for Promising Drugs under Clinical Development................................................28<br />
4.4.1 rhGAD65 (Diamyd) ...............................................................................................................28<br />
4.4.2 DiaPep277............................................................................................................................28<br />
4.4.3 Otelixizumab.........................................................................................................................29<br />
4.4.4 Oral-lyn.................................................................................................................................30<br />
4.5 Type 1 Diabetes Therapeutics Market – Clinical Pipeline by Mechanism of Action.......................31<br />
4.6 Type 1 Diabetes Pipeline – Pipeline by Clinical Phases of Development ......................................32<br />
4.6.1 Type 1 Diabetes Therapeutics – Filed and Approved Drugs ................................................32<br />
4.6.2 Type 1 Diabetes Therapeutics – Phase III Clinical Pipeline .................................................33<br />
4.6.3 Type 1 Diabetes Therapeutics – Phase II Clinical Pipeline ..................................................33<br />
4.6.4 Type 1 Diabetes Therapeutics – Phase I Clinical Pipeline ...................................................35<br />
4.6.5 Type 1 Diabetes Therapeutics – Preclinical-Discovery Pipeline...........................................35<br />
4.7 Key Takeaway ...............................................................................................................................36<br />
5 Type 1 Diabetes Market: Implications for Future Market Competition..................................................37<br />
6 Type Diabetes Therapeutics Market: Future Players in the Type 1 Diabetes Therapeutics Market .....39<br />
6.1 Introduction....................................................................................................................................39<br />
6.2 Novo Nordisk .................................................................................................................................39<br />
6.2.1 Business Description ............................................................................................................39<br />
6.2.2 Metabolic Disorders Portfolio................................................................................................40<br />
6.2.3 Type 1 Diabetes Pipeline Portfolio........................................................................................41<br />
6.3 GlaxoSmithKline ............................................................................................................................42<br />
6.3.1 Business Description ............................................................................................................42<br />
6.3.2 Metabolic Disorders Portfolio................................................................................................43<br />
6.3.3 Type 1 Diabetes Pipeline Portfolio........................................................................................43<br />
6.4 Eli Lilly ...........................................................................................................................................44<br />
6.4.1 Business Description ............................................................................................................44<br />
6.4.2 Metabolic Disorders Portfolio................................................................................................45<br />
6.4.3 Type 1 Diabetes Pipeline Portfolio........................................................................................45<br />
6.5 Sanofi-Aventis................................................................................................................................46<br />
6.5.1 Business Description ............................................................................................................46<br />
Type 1 Diabetes - Drug Pipeline Assessment and<br />
Market Forecasts to 2017<br />
GDHC106PRT /Published JUN 2010<br />
Page 3<br />
© GlobalData. This report is a licensed product and is not to be photocopied
6.5.2 Metabolic Disorders Portfolio................................................................................................47<br />
6.5.3 Type 1 Diabetes Pipeline Portfolio........................................................................................47<br />
7 Type 1 Diabetes Therapeutics Market: Appendix.................................................................................48<br />
7.1 Definitions......................................................................................................................................48<br />
7.2 Scope of Pipeline Research ..........................................................................................................48<br />
7.3 Abbreviations.................................................................................................................................48<br />
7.4 Research Methodology..................................................................................................................49<br />
7.4.1 Coverage..............................................................................................................................50<br />
7.4.2 Secondary Research ............................................................................................................50<br />
7.4.3 Forecasting...........................................................................................................................50<br />
7.4.4 Primary Research.................................................................................................................52<br />
7.4.5 Expert Panel Validation ........................................................................................................53<br />
7.5 Contact Us.....................................................................................................................................53<br />
7.6 Disclaimer......................................................................................................................................53<br />
7.7 Sources .........................................................................................................................................54<br />
Type 1 Diabetes - Drug Pipeline Assessment and<br />
Market Forecasts to 2017<br />
GDHC106PRT /Published JUN 2010<br />
Page 4<br />
© GlobalData. This report is a licensed product and is not to be photocopied
1.1 List of Tables<br />
Table 1: Type 1 Diabetes Therapeutics Market, Global, Revenues ($bn), 2001-2009 ............................ 7<br />
Table 2: Type 1 Diabetes Therapeutics Market, Global, Revenue Forecasts ($bn), 2009-2017 ............. 8<br />
Table 3: Type 1 Diabetes Therapeutics Market, Lantus, Clinical Studies Outcome for Efficacy, 2010...14<br />
Table 4:<br />
Type 1 Diabetes Therapeutics Market, Lantus, Adverse Events in 28-Week Clinical Trials of<br />
Adults and Children With Type 1 Diabetes, 2010 .....................................................................14<br />
Table 5: Type 1 Diabetes Therapeutics Market, Lantus, Clinical Studies Outcome for Safety, 2010 .....15<br />
Table 6: Humulin - Glycemic Parameters at the End of Treatment Period in Randomized Patients in<br />
Three Months Cross-Over Studies for Type 1 Diabetes, 2010 .................................................16<br />
Table 7: Humulin – Results of Three Month Cross-Over Studies Comparing Humulin with Humalog in<br />
Type 1 Diabetes, 2010..............................................................................................................17<br />
Table 8: Type 1 Diabetes Therapeutics Market, Humalog, Glycemic Parameters at the End of<br />
Treatment Period in Randomized Patients in Three Months Cross-Over Studies, 2010 ..........18<br />
Table 9: Humalog – Results of a Two Month Study Comparing the Use of Humalog and Humulin With<br />
Sulfonyluria (SU) Therapy, 2010...............................................................................................19<br />
Table 10: Type 1 Diabetes Therapeutics Market, Novolog, Glycemic Parameters at the End of 24 Week<br />
Study, 2010...............................................................................................................................20<br />
Table 11: Apidra – Efficacy Result of 26-Week Study Comparing Apidra with Insulin Lispro, 2010 .........22<br />
Table 12: Apidra – Efficacy Result of 26-Week Study Comparing Apidra with Regular Insulin ................22<br />
Table 13: Apidra – Adverse Reactions Observed in Pooled Studies in Type 1 Diabetic Adults, 2010......22<br />
Table 14: Levemir – Efficacy Result in 16-Week Non Blinded Study, 2010..............................................23<br />
Table 15: Major Marketed Products Comparison in the Type 1 Diabetes Therapeutics Market, 2010.....24<br />
Table 16: Type 1 Diabetes Therapeutics – Most Promising Drugs Under Clinical Development, 2010....27<br />
Table 17: Type 1 Diabetes Therapeutics – Filed and Approved Drugs, 2010...........................................32<br />
Table 18: Type 1 Diabetes Therapeutics – Phase III Clinical Pipeline, 2010............................................33<br />
Table 19: Type 1 Diabetes Therapeutics – Phase II Clinical Pipeline, 2010.............................................33<br />
Table 20: Type 1 Diabetes Therapeutics – Phase I Clinical Pipeline, 2010..............................................35<br />
Table 21: Type 1 Diabetes Therapeutics – Preclinical-Discovery Pipeline, 2010 .....................................35<br />
Table 22: Genzyme – Metabolic Disorders Marketed Products, 2010 ......................................................40<br />
Table 23: Novo Nordisk - Metabolic Disorders Pipeline Products, 2010...................................................41<br />
Table 24: GlaxoSmithKline – Metabolic Disorders Marketed Products, 2010...........................................43<br />
Table 25: GlaxoSmithKline - Metabolic Disorders Pipeline Products, 2010..............................................43<br />
Table 26: Eli Lilly – Metabolic Disorders Marketed Products, 2010 ..........................................................45<br />
Table 27: Eli Lilly – Metabolic Disorders Pipeline Products, 2010 ............................................................45<br />
Table 28: Sanofi-Aventis – Metabolic Disorders Marketed Products, 2010 ..............................................47<br />
Table 29: Sanofi-Aventis – Metabolic Disorders Pipeline Products, 2010 ................................................47<br />
1.2 List of Figures<br />
Figure 1: Type 1 Diabetes Therapeutics Market, Global, Revenues ($bn), 2001-2009 ............................ 7<br />
Figure 2: Type 1 Diabetes Therapeutics Market, Global, Revenue Forecasts ($bn), 2009-2017 ............. 8<br />
Figure 3: Opportunity and Unmet Need in the Type 1 Diabetes Therapeutics Market, 2010 ...................10<br />
Figure 4: Strategic Competitor Assessment of the Major Marketed Products in Type 1 Diabetes<br />
Therapeutics, 2010 ...................................................................................................................13<br />
Figure 5: Technology Trends Analytic Framework of the Type 1 Diabetes Therapeutics Pipeline, 2010.26<br />
Figure 6: Technology Trends Analytic Framework of the Type 1 Diabetes Therapeutics<br />
Pipeline – Description, 2010 .....................................................................................................27<br />
Figure 7: Type 1 Diabetes Therapeutics Market – Clinical Pipeline by Mechanism of Action, 2010 ........31<br />
Figure 8: Type 1 Diabetes Therapeutics Pipeline by Phase of Clinical Development, 2010 ....................32<br />
Figure 9: Implications for Future Market Competition in the Type 1 Diabetes Market, 2010....................37<br />
Figure 10: Type 1 Diabetes Therapeutics Market – Clinical Pipeline by Company, 2010 ..........................39<br />
Figure 11: GlobalData Methodology, 2010 ................................................................................................49<br />
Figure 12: GlobalData Market Forecasting Model, 2010............................................................................52<br />
Type 1 Diabetes - Drug Pipeline Assessment and<br />
Market Forecasts to 2017<br />
GDHC106PRT /Published JUN 2010<br />
Page 5<br />
© GlobalData. This report is a licensed product and is not to be photocopied
2.3 Type 1 Diabetes Therapeutics Market Forecast and CAGR<br />
GlobalData expects the type-1 diabetes therapeutics market to grow at a CAGR of XX% from $XXX billion<br />
in 2009 to $XX billion in 2017.<br />
Figure 1: Type 1 Diabetes Therapeutics Market, Global, Revenues ($bn), 2001-2009<br />
CAGR (2001-2009): XX%<br />
Sales Value ($ bn)<br />
2001 2002 2003 2004 2005 2006 2007 2008 2009<br />
Source: GlobalData<br />
Table 1: Type 1 Diabetes Therapeutics Market, Global, Revenues ($bn), 2001-2009<br />
Year 2001 2002 2003 2004 2005 2006 2007 2008 2009<br />
Sales Value ($bn)<br />
Growth Rate (%)<br />
Source: GlobalData<br />
CAGR 2001-2009<br />
(%)<br />
Type 1 Diabetes - Drug Pipeline Assessment and<br />
Market Forecasts to 2017<br />
GDHC106PRT /Published JUN 2010<br />
Page 7<br />
© GlobalData. This report is a licensed product and is not to be photocopied
4.5 Type 1 Diabetes Therapeutics Market – Clinical Pipeline by Mechanism of<br />
Action<br />
In terms of the drugs currently under development, insulin products dominated the type 1 diabetes<br />
therapeutics pipeline. This is because type 1 diabetes is dependent on insulin intake due to the body’s<br />
inability to produce insulin. Insulin acts in the body to help in glucose metabolism. Insulin attaches to<br />
insulin receptors in cells to enable the absorption of glucose in cells. Insulin analogs accounted for XX%<br />
of the total number of pipeline products. Together insulin and insulin analogs account for XX% of the total<br />
number of pipeline products. Together, anti-CD3 monoclonal antibodies was the second largest category<br />
and accounted for XX% of the total type 1 diabetes pipeline. Interleukin-1 (IL-1) receptor antagonists, antiinflammatories<br />
and islet implants formed XX% of the total number of pipeline products.<br />
Figure 7: Type 1 Diabetes Therapeutics Market – Clinical Pipeline by Mechanism of Action, 2010<br />
Insulin<br />
Anti-CD3 mABs<br />
Islet Implant<br />
Antigen-Specific Immune Modulators<br />
T-lymphocyte Inhibitors<br />
New Islet Formation Inducers<br />
Miscellaneous<br />
Interleukin-1 (IL-1) Receptor Antagonist<br />
Anti-Inflammatory<br />
Insulin Analog<br />
IL12 and STAT 4 Activators<br />
Stem Cell Therapy<br />
SGLT 2 Inhibitor<br />
Source: GlobalData<br />
Type 1 diabetes is an autoimmune disorder and anti-CD3 monoclonal antibodies aim to work by<br />
protecting the insulin-producing pancreatic cells from autoimmune attacks. The drugs in development for<br />
type 1 diabetes can be divided into three major categories of mechanism of action. First, some drugs help<br />
the body’s glucose metabolism by supplying the body with the required insulin. Second, some drugs help<br />
in the generation of new islet cells. Islet cells in the pancreas are primarily responsible for the generation<br />
of insulin. A third category protects the insulin producing islets from autoimmune attacks. The therapies<br />
related to islet implants accounted for XX% of the total products in the pipeline. Antigen-specific immune<br />
modulators, IL12 and STAT 4 activators, t-lymphocyte inhibitors, stem cell therapies, sodium-glucose cotransporter<br />
(SGLT 2) inhibitors and new islet formation inducers each accounted for XX% of the total<br />
pipeline. The rest of the pipeline has products that help to reduce blood glucose level by targeting the<br />
glucose metabolism at different steps, to reduce the destruction of beta cells in the pancreas or induce the<br />
production of healthy insulin producing cells. These products are under the miscellaneous category. It<br />
includes amylinomimetic agents, anti-CD20, anti-IL-1β monoclonal antibodies, products that destructs β<br />
cell and increase insulin levels, granulocyte colony-stimulating factor (G-CSF) receptor inhibitors,<br />
products that convert hepatic glycogen to glucose, DPP-4 inhibitors, enzyme transketolase activators,<br />
GLP1-analogs, glucagon receptors, human LFA-3/IGG1 fusion proteins, CD4+CD25+foxp3+ regulatory T<br />
cells inducers, NF-kB inhibitors, PPAR agonists, products that preserve beta cell functioning, selective costimulation<br />
modulators, CD80 and CD86 blockers, combination products that inhibits 3-hydroxy-3-<br />
methylglutaryl-coenzyme A (HMG-CoA) reductase and reduce LDL cholesterol, Syk kinase inhibitors, and<br />
tumor necrosis factor inhibitors. Some products stimulate intestinal calcium and phosphorus absorption<br />
and bone mineralization and target disease-specific autoagressive T-cells. All these products form part of<br />
the miscellaneous category of mechanisms of action and account for XX% of the total products in the<br />
pipeline.<br />
Type 1 Diabetes - Drug Pipeline Assessment and<br />
Market Forecasts to 2017<br />
GDHC106PRT /Published JUN 2010<br />
Page 31<br />
© GlobalData. This report is a licensed product and is not to be photocopied
7 Type 1 Diabetes Therapeutics Market: Appendix<br />
7.1 Definitions<br />
Type 1 Diabetes Disorders Market: The type 1 diabetes disorders market is primarily formed of ten<br />
products – Lantus, Symlin, Levemir, CDM1103, NovoMix, Apidra, Humalog, Humulin, Novolin and<br />
Novolog. These products come under the category of insulin, insulin analogs and amylinomimetic agents.<br />
Pipeline analysis: The pipeline candidates fall in the major therapeutic categories such as insulin, anti-<br />
CD3 mABs, interleukin-1 (IL-1) receptor antagonists, anti-inflammatories, islet implants, insulin analogs,<br />
antigen-specific immune modulators, IL12 and STAT 4 activators, T-lymphocyte inhibitors, stem cell<br />
therapies, new islet formation inducers and SGLT 2 inhibitors.<br />
7.2 Scope of Pipeline Research<br />
Pipeline products covered within the report are sourced from;<br />
<br />
<br />
<br />
<br />
Top 200 companies (by number of molecules in pipeline)<br />
Clinical trial.gov<br />
WHO registry, which is covering around 6 different registries such as<br />
India, Australia, Germany and Japan<br />
7.3 Abbreviations<br />
CAGR: Compound Annual Growth Rate<br />
CDC:<br />
CNS:<br />
EBV:<br />
Centers for Disease Control and Prevention<br />
Central Nervous System<br />
Epstein-Barr virus<br />
EMEA: Europe by European Medicines Agency<br />
FPG:<br />
GAD:<br />
Fasting Plasma Glucose<br />
Glutamic Acid Decarboxylase<br />
G-CSF: Granulocyte Colony-Stimulating Factor<br />
GHb:<br />
GSK:<br />
Glycated Hemoglobin<br />
GlaxoSmithKline<br />
HbA1c: Glycosylated Haemoglobin<br />
HMG-CoA: 3-Hydroxy-3-Methylglutaryl-Coenzyme A<br />
Hsp60: Human Heat Shock Protein 60<br />
IDMC:<br />
IL:<br />
Independent Data Monitoring Committee<br />
Interleukin<br />
LADA: Latent Autoimmune Diabetes in Adults<br />
OAD:<br />
NAID:<br />
Oral Anti-Diabetic products<br />
National Institute of Allergy and Infectious Diseases<br />
NCRR: National Center for Research Resources<br />
NIAID: National Institute of Allergy and Infectious Diseases<br />
NICHD: Eunice Kennedy Shriver National Institute of Child Health and Human Development<br />
NIDDK: National Institute of Diabetes and Digestive and Kidney Diseases<br />
Type 1 Diabetes - Drug Pipeline Assessment and<br />
Market Forecasts to 2017<br />
GDHC106PRT /Published JUN 2010<br />
Page 48<br />
© GlobalData. This report is a licensed product and is not to be photocopied
NIH:<br />
NPH:<br />
National Institutes of Health<br />
Neutral Protamine Hagedorn<br />
mABs: Monoclonal Antiobodies<br />
R&D:<br />
rDNA:<br />
Research and Development<br />
recombinant DNA<br />
rhGAD65: Recombinant Human Glutamic Acid Decarboxylase<br />
SGLT 2: Sodium-Glucose Co-Transporter<br />
SIBA:<br />
SU:<br />
VLD:<br />
WHO:<br />
Soluble Insulin Basal Analog<br />
Sulfonyluria<br />
Very Low Dose<br />
World Health Organization<br />
7.4 Research Methodology<br />
GlobalData’s dedicated Research and Analysis Teams consist of experienced professionals with a<br />
pedigree in marketing, market research, consulting backgrounds in the pharmaceutical industry and<br />
advanced statistical expertise.<br />
GlobalData adheres to the Codes of Practice of the Market Research Society (www.mrs.org.uk) and the<br />
Society of Competitive Intelligence Professionals (www.scip.org).<br />
All GlobalData databases are continuously updated and revised. The following research methodology is<br />
followed for all databases and reports.<br />
Figure 11: GlobalData Methodology, 2010<br />
Data Update<br />
Taxonomy<br />
Update<br />
Expert<br />
Panel<br />
Validation<br />
Secondary<br />
Research<br />
Forecasts<br />
Primary<br />
Research<br />
Source: GlobalData<br />
Modeling and<br />
benchmarking<br />
Type 1 Diabetes - Drug Pipeline Assessment and<br />
Market Forecasts to 2017<br />
GDHC106PRT /Published JUN 2010<br />
Page 49<br />
© GlobalData. This report is a licensed product and is not to be photocopied
7.4.1 Coverage<br />
The objective of updating GlobalData’s coverage is to ensure that it represents the most up to date vision<br />
of the industry possible.<br />
Changes to the industry taxonomy are built on the basis of extensive research of company, association<br />
and competitor sources.<br />
Company coverage is based on three key factors: Revenues, products and media attention/innovation/<br />
market potential.<br />
<br />
<br />
The estimated revenues of all major companies, including private and governmental, are gathered<br />
and used to prioritize coverage; and<br />
Companies which are making the news, or which are of particular interest due to their innovative<br />
approach are prioritized.<br />
GlobalData aims to cover all major news events and deals in the pharmaceutical industry, updated on a<br />
daily basis.<br />
The coverage is further streamlined and strengthened with additional inputs from GlobalData’s Expert<br />
Panel (see below).<br />
7.4.2 Secondary Research<br />
The research process begins with exhaustive secondary research on internal and external sources being<br />
carried out to source qualitative and quantitative information relating to each market.<br />
The secondary research sources that are typically referred to include, but are not limited to:<br />
<br />
<br />
<br />
<br />
<br />
<br />
<br />
Company websites, annual reports, financial reports, broker reports, investor presentations and SEC<br />
filings;<br />
Industry trade journals, scientific journals and other technical literature;<br />
Internal and external proprietary databases;<br />
Relevant patent and regulatory databases;<br />
National government documents, statistical databases and market reports;<br />
Procedure registries; and<br />
News articles, press releases and web-casts specific to the companies operating in the market.<br />
7.4.3 Forecasting<br />
GlobalData uses an epidemiology-based treatment flow model to forecast the market size for therapeutic<br />
indications. GlobalData reports cover seven major geographies namely the US, the UK, Germany,<br />
France, Spain, Italy and Japan.<br />
7.4.3.1 Epidemiology-based Forecasting<br />
The forecasting model used at GlobalData makes use of epidemiology data gathered from research<br />
publications and primary interviews with physicians to represent the treatment flow patterns for individual<br />
diseases and therapies. The market for any disease segment is directly proportional to the volume of units<br />
sold and the price per unit.<br />
Sales = Volume of Units sold X Price per Unit<br />
The volume of units sold is calculated on the average dosage regimen for that disease, the duration of<br />
treatment and the number of patients who are prescribed drug treatment (prescription population). The<br />
prescription population is calculated as a percentage of the population diagnosed with a disease<br />
(diagnosis population). The diagnosis population is the population diagnosed with a disease expressed as<br />
a percentage of the population that is seeking treatment (treatment seeking population). The prevalence<br />
of a disease (disease population) is the percentage of the total population who suffer from a<br />
disease/condition.<br />
Type 1 Diabetes - Drug Pipeline Assessment and<br />
Market Forecasts to 2017<br />
GDHC106PRT /Published JUN 2010<br />
Page 50<br />
© GlobalData. This report is a licensed product and is not to be photocopied
Data on the treatment seeking rate, diagnosis rate and prescription rate, if unavailable from research<br />
publications, are gathered from interviews with physicians and are used to estimate the patient volumes<br />
for the disease under consideration. Therapy uptake and compliance data are fitted in the forecasting<br />
model to account for patient switching and compliance behavior.<br />
To account for differences in patients’ ability to afford drugs across various geographies, macroeconomic<br />
data such as inflation and GDP and healthcare indicators such as healthcare spending, insurance<br />
coverage and average income per individual are used.<br />
The average cost of treatment is calculated using product purchase frequency and the average price of<br />
the therapy. The product purchase frequency is calculated from the dosage data available for the<br />
therapies and drug prices are gathered from public sources.<br />
The epidemiology-based forecasting model uses a bottom-up methodology and it makes use of<br />
estimations in the absence of data from research publications. Such estimations may result in a final<br />
market value different from the actual value. To correct this ‘gap’ the forecasting model uses ‘triangulation’<br />
with the help of base year sales data (from company annual reports, internal and external databases) and<br />
sales estimations.<br />
Analogous Forecasting Methodology<br />
An analogous forecasting methodology is used to account for the introduction of new products, the patent<br />
expiries of branded products and the subsequent introduction of generics. Historic data for new product<br />
launches and generics penetration are used to arrive at robust forecasts. The increase or decrease of the<br />
prevalence rate, treatment seeking rate, diagnosis rate and prescription rate are fitted into the forecasting<br />
model to estimate market growth rate.<br />
The proprietary model enables GlobalData Research to account for the impact of individual drivers and<br />
restraints in the growth of the market. The year of impact and the extent of impact are quantified in the<br />
forecasting model to provide close-to-accurate data sets.<br />
Diseased Population<br />
The diseased population for any indication is the prevalence rate. The prevalence rates are usually<br />
obtained from various journals, online publications, sources such as World Health Organization (WHO) or<br />
associations and foundation websites for that particular disease.<br />
Treatment Seeking Population<br />
The treatment seeking population is always calculated as a percentage of the prevalence population. The<br />
number denotes the actual number of patients who are going to hospitals to get diagnosis for any<br />
disease. The treatment seeking population is primarily driven by the onset of symptoms, patient<br />
awareness and the severity of the disease.<br />
Diagnosis Population<br />
Of the patients who undergo diagnostic tests to confirm a disease, only a few people get diagnosed with<br />
the disease. This number as a percentage of the treatment seeking population is the diagnosis rate. The<br />
diagnosis population is primarily driven by the sensitivity of the diagnostic tests, state-of-the-art<br />
technology, patient access to these diagnostic tests and cost of the diagnostic tests.<br />
Prescription Population<br />
For any disease, multiple treatment options exist. For example, in cancer treatment various treatment<br />
options such as surgery, radiation therapy, and drug therapy are available. The prescription population is<br />
defined as the number of patients who are prescribed drug therapy. This is calculated as a percentage of<br />
the diagnosis population. The prescription population is primarily driven by the age at which the disease is<br />
diagnosed, the disease stage, patient health and the cost of drug treatment.<br />
Type 1 Diabetes - Drug Pipeline Assessment and<br />
Market Forecasts to 2017<br />
GDHC106PRT /Published JUN 2010<br />
Page 51<br />
© GlobalData. This report is a licensed product and is not to be photocopied
Forecasting Model for Therapeutic Areas<br />
Figure 12: GlobalData Market Forecasting Model, 2010<br />
GlobalData Market Sizing Model<br />
Disease Population<br />
General Population 743,535,048<br />
Qualifying condition 1<br />
Qualifying condition 2<br />
Prevalence neuropathic pain 2.7% 19,926,739<br />
Qualifying condition (complication, severity)<br />
DISEASED POPULATION 19,926,739<br />
Treatment Flow Patterns<br />
Treatment Seeking Rate (Symptoms/Dis Awareness) 90%<br />
Diagnosis Rate (Clinical and Diagnostic Tests)<br />
Prescription Rate (Physician Perception, Treatment Effectiveness)<br />
CVS Disease 78%<br />
Other Treatments for Valve (Surg/Med/None)<br />
Fulfillment<br />
Availability<br />
NA<br />
Willingness to Use (Patient Perceptions)<br />
NA<br />
Ready to Use (Surgery eligibility, Reuse etc)<br />
NA<br />
Affordability at Price<br />
HE as % of GDP spend<br />
Average US Income (per capita)<br />
Patient Out-of-pocket Budget (Annual)<br />
Budget allocation to one-time surgery<br />
Budget allocation to other health needs<br />
Average Payor Coverage<br />
Patient Liability<br />
Target Price (@20% pat liab)<br />
ASP for Cost of Therapy<br />
TOTAL PATIENT VOLUMES<br />
Product Purchase Frequency<br />
TOTAL UNIT VOLUMES<br />
Pricing per Unit<br />
Inflation<br />
Price Decrease due to competition<br />
Market Value<br />
Source: GlobalData<br />
7.4.4 Primary Research<br />
GlobalData conducts hundreds of primary interviews a year with industry participants and commentators<br />
in order to validate its data and analysis. A typical research interview fulfills the following functions:<br />
<br />
<br />
<br />
It provides first-hand information on the market size, market trends, growth trends, competitive<br />
landscape, future outlook etc;<br />
Helps in validating and strengthening the secondary research findings; and<br />
Further develops the Analysis Team’s expertise and market understanding.<br />
Primary research involves E-mail correspondence, telephone interviews as well as face-to-face interviews<br />
for each market, category, segment and sub-segment across geographies.<br />
Type 1 Diabetes - Drug Pipeline Assessment and<br />
Market Forecasts to 2017<br />
GDHC106PRT /Published JUN 2010<br />
Page 52<br />
© GlobalData. This report is a licensed product and is not to be photocopied
The participants who typically take part in such a process include, but are not limited to:<br />
<br />
<br />
<br />
<br />
Industry participants: CEOs, VPs, marketing/product managers, market intelligence managers and<br />
national sales managers;<br />
Hospital stores, laboratories, pharmacies, distributors and paramedics;<br />
Outside experts: investment bankers, valuation experts, research analysts specializing in specific<br />
pharmaceutical markets; and<br />
Key opinion leaders: physicians and surgeons specializing in different therapeutic areas<br />
corresponding to different kinds of pharmaceuticals.<br />
7.4.5 Expert Panel Validation<br />
GlobalData uses a panel of experts to cross verify its databases and forecasts.<br />
GlobalData expert panel comprises marketing managers, product specialists, international sales<br />
managers from pharmaceutical companies; academics from research universities, KOLs from hospitals,<br />
consultants from venture capital funds and distributors/suppliers of pharmaceuticals and supplies.<br />
Historic data and forecasts are relayed to GlobalData’s Expert Panel for feedback and adjusted in<br />
accordance with their feedback.<br />
7.5 Contact Us<br />
If you have any queries about this report or would like further information, please contact at the below<br />
given telephone numbers or email address.<br />
North America: +1 646 395 5460<br />
Europe: +44 207 753 4298 (OR) +44 161 227 0666<br />
Asia Pacific: +91 40 6616 6700<br />
Email: info@globaldata.com<br />
7.6 Disclaimer<br />
All Rights Reserved.<br />
No part of this publication may be reproduced, stored in a retrieval system or transmitted in any form by<br />
any means, electronic, mechanical, photocopying, recording or otherwise, without the prior permission of<br />
the publisher, GlobalData.<br />
The facts of this report are believed to be correct at the time of publication but cannot be guaranteed.<br />
Please note that the findings, conclusions and recommendations that GlobalData delivers will be based<br />
on information gathered in good faith from both primary and secondary sources, whose accuracy we are<br />
not always in a position to guarantee. As such GlobalData can accept no liability whatever for actions<br />
taken based on any information that may subsequently prove to be incorrect.<br />
Type 1 Diabetes - Drug Pipeline Assessment and<br />
Market Forecasts to 2017<br />
GDHC106PRT /Published JUN 2010<br />
Page 53<br />
© GlobalData. This report is a licensed product and is not to be photocopied
7.7 Sources<br />
http://dialogpro.dialog.com/<br />
www.who.com<br />
http://www.rxlist.com/script/main/hp.asp<br />
www.pharmacychecker.com<br />
www.drugstore.com<br />
http://www.medicinpricer.dk/Default.aspk?Ing=2<br />
http:/www.ic.nhs.uk/statistics-and-data-collections/primary-care/prescriptions<br />
www.medicalnewstoday.com<br />
http://www.accessdata.fda.gov/scripts/cder/ob/default.cfm<br />
www.drugs.com<br />
http://www.fiercepharma.com/<br />
http://www.nice.org.uk/<br />
Type 1 Diabetes - Drug Pipeline Assessment and<br />
Market Forecasts to 2017<br />
GDHC106PRT /Published JUN 2010<br />
Page 54<br />
© GlobalData. This report is a licensed product and is not to be photocopied