selection of bread wheat varieties for organic farming, baking quality ...
selection of bread wheat varieties for organic farming, baking quality ...
selection of bread wheat varieties for organic farming, baking quality ...

You also want an ePaper? Increase the reach of your titles
YUMPU automatically turns print PDFs into web optimized ePapers that Google loves.
Lucrări Ştiinţifice – vol. 51, seria Agronomie<br />
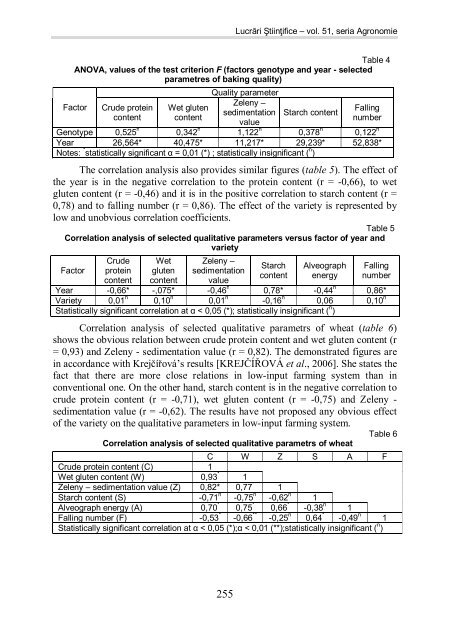
Table 4<br />
ANOVA, values <strong>of</strong> the test criterion F (factors genotype and year - selected<br />
parametres <strong>of</strong> <strong>baking</strong> <strong>quality</strong>)<br />
Quality parameter<br />
Zeleny –<br />
Factor Crude protein Wet gluten<br />
Falling<br />
sedimentation Starch content<br />
content content<br />
number<br />
value<br />
Genotype 0,525 n 0,342 n 1,122 n 0,378 n 0,122 n<br />
Year 26,564* 40,475* 11,217* 29,239* 52,838*<br />
Notes: * statistically significant α = 0,01 (*) ; statistically insignificant ( n )<br />
The correlation analysis also provides similar figures (table 5). The effect <strong>of</strong><br />
the year is in the negative correlation to the protein content (r = -0,66), to wet<br />
gluten content (r = -0,46) and it is in the positive correlation to starch content (r =<br />
0,78) and to falling number (r = 0,86). The effect <strong>of</strong> the variety is represented by<br />
low and unobvious correlation coefficients.<br />
Table 5<br />
Correlation analysis <strong>of</strong> selected qualitative parameters versus factor <strong>of</strong> year and<br />
variety<br />
Factor<br />
Crude<br />
protein<br />
content<br />
Wet<br />
gluten<br />
content<br />
Zeleny –<br />
sedimentation<br />
value<br />
Starch<br />
content<br />
Alveograph<br />
energy<br />
Falling<br />
number<br />
Year -0,66* -,075* -0,46 n 0,78* -0,44 n 0,86*<br />
Variety 0,01 n 0,10 n 0,01 n -0,16 n 0,06 0,10 n<br />
Statistically significant correlation at α < 0,05 (*); statistically insignificant ( n )<br />
Correlation analysis <strong>of</strong> selected qualitative parametrs <strong>of</strong> <strong>wheat</strong> (table 6)<br />
shows the obvious relation between crude protein content and wet gluten content (r<br />
= 0,93) and Zeleny - sedimentation value (r = 0,82). The demonstrated figures are<br />
in accordance with Krejčířová’s results [KREJČÍŘOVÁ et al., 2006]. She states the<br />
fact that there are more close relations in low-input <strong>farming</strong> system than in<br />
conventional one. On the other hand, starch content is in the negative correlation to<br />
crude protein content (r = -0,71), wet gluten content (r = -0,75) and Zeleny -<br />
sedimentation value (r = -0,62). The results have not proposed any obvious effect<br />
<strong>of</strong> the variety on the qualitative parameters in low-input <strong>farming</strong> system.<br />
Table 6<br />
Correlation analysis <strong>of</strong> selected qualitative parametrs <strong>of</strong> <strong>wheat</strong><br />
C W Z S A F<br />
Crude protein content (C) 1<br />
Wet gluten content (W) 0,93 * 1<br />
Zeleny – sedimentation value (Z) 0,82* 0,77 * 1<br />
Starch content (S) -0,71 n -0,75 n -0,62 n 1<br />
Alveograph energy (A) 0,70 * 0,75 * 0,66 * -0,38 n 1<br />
Falling number (F) -0,53 * -0,66 ** -0,25 n 0,64 * -0,49 n 1<br />
Statistically significant correlation at α < 0,05 (*);α < 0,01 (**);statistically insignificant ( n )<br />
255