dov-ethnic4 - Kent County Council
dov-ethnic4 - Kent County Council
dov-ethnic4 - Kent County Council

Create successful ePaper yourself
Turn your PDF publications into a flip-book with our unique Google optimized e-Paper software.
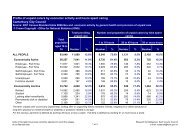
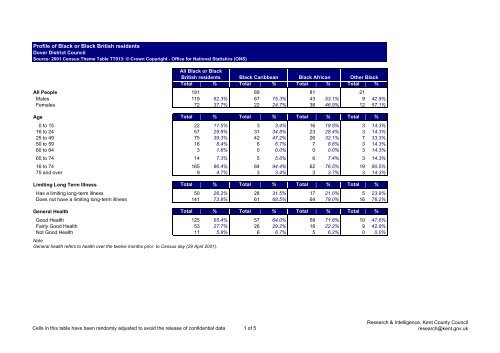
Profile of Black or Black British residents<br />
Dover District <strong>Council</strong><br />
Source: 2001 Census:Theme Table TT013: © Crown Copyright - Office for National Statistics (ONS)<br />
All Black or Black<br />
British residents Black Caribbean Black African Other Black<br />
Total % Total % Total % Total %<br />
All People 191 89 81 21<br />
Males 119 62.3% 67 75.3% 43 53.1% 9 42.9%<br />
Females 72 37.7% 22 24.7% 38 46.9% 12 57.1%<br />
Age Total % Total % Total % Total %<br />
0 to 15 22 11.5% 3 3.4% 16 19.8% 3 14.3%<br />
16 to 24 57 29.8% 31 34.8% 23 28.4% 3 14.3%<br />
25 to 49 75 39.3% 42 47.2% 26 32.1% 7 33.3%<br />
50 to 59 16 8.4% 6 6.7% 7 8.6% 3 14.3%<br />
60 to 64 3 1.6% 0 0.0% 0 0.0% 3 14.3%<br />
65 to 74 14 7.3% 5 5.6% 6 7.4% 3 14.3%<br />
16 to 74 165 86.4% 84 94.4% 62 76.5% 19 90.5%<br />
75 and over 9 4.7% 3 3.4% 3 3.7% 3 14.3%<br />
Limiting Long Term Illness Total % Total % Total % Total %<br />
Has a limiting long-term illness 50 26.2% 28 31.5% 17 21.0% 5 23.8%<br />
Does not have a limiting long-term illness 141 73.8% 61 68.5% 64 79.0% 16 76.2%<br />
General Health Total % Total % Total % Total %<br />
Good Health 125 65.4% 57 64.0% 58 71.6% 10 47.6%<br />
Fairly Good Health 53 27.7% 26 29.2% 18 22.2% 9 42.9%<br />
Not Good Health 11 5.8% 6 6.7% 5 6.2% 0 0.0%<br />
Note<br />
General health refers to health over the twelve months prior to Census day (29 April 2001).<br />
Cells in this table have been randomly adjusted to avoid the release of confidential data 1 of 5<br />
Research & Intelligence, <strong>Kent</strong> <strong>County</strong> <strong>Council</strong><br />
research@kent.gov.uk
Profile of Black or Black British residents<br />
Dover District <strong>Council</strong><br />
Source: 2001 Census:Theme Table TT013: © Crown Copyright - Office for National Statistics (ONS)<br />
All Black or Black<br />
British residents Black Caribbean Black African Other Black<br />
Tenure Total % Total % Total % Total %<br />
Owns outright 32 16.8% 13 14.6% 15 18.5% 4 19.0%<br />
Owns with a mortgage or loan 53 27.7% 28 31.5% 19 23.5% 6 28.6%<br />
Shared ownership 0 0.0% 0 0.0% 0 0.0% 0 0.0%<br />
Rented from council 4 2.1% 0 0.0% 4 4.9% 0 0.0%<br />
Other social rented 13 6.8% 3 3.4% 7 8.6% 3 14.3%<br />
Private rented 21 11.0% 8 9.0% 10 12.3% 3 14.3%<br />
Living rent free 3 1.6% 0 0.0% 0 0.0% 3 14.3%<br />
Living in a Communal Establishment 65 34.0% 36 40.4% 25 30.9% 4 19.0%<br />
Note<br />
the terms used to describe tenure are defined as:<br />
Other social rented includes rented from Registered Social Landlords; Housing Association; Housing Co-operative and Charitable Trust.<br />
Private rented: renting from a private landlord or letting agency; employer of a household member; or relative or friend of a<br />
household member or other person<br />
Accomodation Type Total % Total % Total % Total %<br />
Household in unshared accommodation 127 66.5% 53 59.6% 56 69.1% 18 85.7%<br />
House or bungalow 113 59.2% 48 53.9% 50 61.7% 15 71.4%<br />
Flat; maisonette or apartment 14 7.3% 5 5.6% 6 7.4% 3 14.3%<br />
Caravan or other mobile or temporary structure 0 0.0% 0 0.0% 0 0.0% 0 0.0%<br />
Household in shared accommodation 0 0.0% 0 0.0% 0 0.0% 0 0.0%<br />
Communal Establishment 61 31.9% 36 40.4% 25 30.9% 0 0.0%<br />
Medical and care establishment 19 9.9% 12 13.5% 7 8.6% 0 0.0%<br />
Other type of establishment 42 22.0% 24 27.0% 18 22.2% 0 0.0%<br />
Cells in this table have been randomly adjusted to avoid the release of confidential data 2 of 5<br />
Research & Intelligence, <strong>Kent</strong> <strong>County</strong> <strong>Council</strong><br />
research@kent.gov.uk
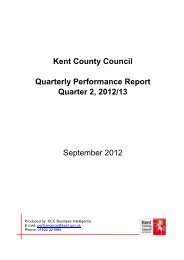
Profile of Black or Black British residents<br />
Dover District <strong>Council</strong><br />
Source: 2001 Census:Theme Table TT013: © Crown Copyright - Office for National Statistics (ONS)<br />
All Black or Black<br />
British residents Black Caribbean Black African Other Black<br />
Qualifications Total % Total % Total % Total %<br />
Population aged 16 to 74 165 84 62 19<br />
No qualifications or level unknown 63 38.2% 34 40.5% 23 37.1% 6 31.6%<br />
Lower level qualifications 65 39.4% 36 42.9% 22 35.5% 7 36.8%<br />
Higher level qualifications 36 21.8% 15 17.9% 17 27.4% 4 21.1%<br />
Not aged 16 to 74 27 14.1% 4 4.5% 19 23.5% 4 19.0%<br />
Note<br />
The term 'no qualifications' describes people without any academic; vocational or professional qualifications.<br />
The term 'lower level' qualifications is used to describe qualifications equivilent to levels 1 to 3 of the National Key Learning Targets<br />
i.e. GCSE's ; 'O' levels; NVQ levels 1-3).<br />
The term 'Higher level' refers to qualifications of levels 4 and above (i.e. first degrees; higher degrees; NVQ levels 4 and 5;<br />
HND; HNC; and certain professional qualifications).<br />
Economic Activity Total % Total % Total % Total %<br />
Population aged 16 to 74 165 84 62 19<br />
Economically active 90 54.5% 42 50.0% 35 56.5% 13 68.4%<br />
Employee/Full-time 52 57.8% 25 59.5% 23 65.7% 4 30.8%<br />
Employee/Part-time 9 10.0% 3 7.1% 3 8.6% 3 23.1%<br />
Self-employed/Full-time 9 10.0% 3 7.1% 3 8.6% 3 23.1%<br />
Self-employed/Part-time 3 3.3% 3 7.1% 0 0.0% 0 0.0%<br />
Unemployed 11 12.2% 5 11.9% 3 8.6% 3 23.1%<br />
Full-time student 6 6.7% 3 7.1% 3 8.6% 0 0.0%<br />
Economically inactive 92 55.8% 50 59.5% 32 51.6% 10 52.6%<br />
Retired 15 16.3% 6 12.0% 5 15.6% 4 40.0%<br />
Student 11 12.0% 4 8.0% 7 21.9% 0 0.0%<br />
Looking after home/family 9 9.8% 3 6.0% 3 9.4% 3 30.0%<br />
Permanently sick or disabled 26 28.3% 16 32.0% 7 21.9% 3 30.0%<br />
Other 31 33.7% 21 42.0% 10 31.3% 0 0.0%<br />
Not aged 16 to 74 27 14.1% 4 4.5% 19 23.5% 4 19.0%<br />
Cells in this table have been randomly adjusted to avoid the release of confidential data 3 of 5<br />
Research & Intelligence, <strong>Kent</strong> <strong>County</strong> <strong>Council</strong><br />
research@kent.gov.uk
Profile of Black or Black British residents<br />
Dover District <strong>Council</strong><br />
Source: 2001 Census:Theme Table TT013: © Crown Copyright - Office for National Statistics (ONS)<br />
All Black or Black<br />
British residents Black Caribbean Black African Other Black<br />
NS-SeC Total % Total % Total % Total %<br />
Population aged 16 to 74 165 84 62 19<br />
1. Higher managerial & professional occupations 20 12.1% 7 8.3% 13 21.0% 0 0.0%<br />
1.1 Large employers and higher managerial occupations 7 4.2% 4 4.8% 3 4.8% 0 0.0%<br />
1.2 Higher professional occupations 13 7.9% 3 3.6% 10 16.1% 0 0.0%<br />
2. Lower managerial & professional occupations 18 10.9% 9 10.7% 6 9.7% 3 15.8%<br />
3. Intermediate occupations 8 4.8% 5 6.0% 3 4.8% 0 0.0%<br />
4. Small employers and own account workers 7 4.2% 4 4.8% 0 0.0% 3 15.8%<br />
5. Lower supervisory and technical occupations 12 7.3% 4 4.8% 5 8.1% 3 15.8%<br />
6. Semi-routine occupations 18 10.9% 11 13.1% 7 11.3% 0 0.0%<br />
7. Routine occupations 15 9.1% 10 11.9% 5 8.1% 0 0.0%<br />
8. Never worked or long-term unemployed 35 21.2% 22 26.2% 9 14.5% 4 21.1%<br />
L14.1 Never worked 31 18.8% 18 21.4% 9 14.5% 4 21.1%<br />
L14.2 Long-term unemployed 4 2.4% 4 4.8% 0 0.0% 0 0.0%<br />
Not classified 35 21.2% 14 16.7% 18 29.0% 3 15.8%<br />
L15. Full-time student 14 8.5% 5 6.0% 9 14.5% 0 0.0%<br />
L17. Not classifiable for other reasons 21 12.7% 9 10.7% 9 14.5% 3 15.8%<br />
Under 16 22 11.5% 3 3.4% 16 19.8% 3 14.3%<br />
Note<br />
In the NS-SeC classification; all full-time students are recorded in the full-time student category regardless of if they are<br />
economically active or not.<br />
Not classifiable for other reasons includes people who have not been coded and those who cannot be allocated to an NS-SeC category.<br />
Cells in this table have been randomly adjusted to avoid the release of confidential data 4 of 5<br />
Research & Intelligence, <strong>Kent</strong> <strong>County</strong> <strong>Council</strong><br />
research@kent.gov.uk
Profile of Black or Black British residents<br />
Dover District <strong>Council</strong><br />
Source: 2001 Census:Theme Table TT013: © Crown Copyright - Office for National Statistics (ONS)<br />
All Black or Black<br />
British residents Black Caribbean Black African Other Black<br />
Occupation Total % Total % Total % Total %<br />
Population aged 16 to 74 165 84 62 19<br />
1. Managers and Senior Officials 6 3.6% 6 7.1% 0 0.0% 0 0.0%<br />
2. Professional Occupations 13 7.9% 3 3.6% 10 16.1% 0 0.0%<br />
3. Associate Professionals and Technical Occupations 12 7.3% 5 6.0% 4 6.5% 3 15.8%<br />
4. Administrative and Secretarial Occupations 6 3.6% 3 3.6% 3 4.8% 0 0.0%<br />
5. Skilled Trades Occupations 3 1.8% 3 3.6% 0 0.0% 0 0.0%<br />
6. Personal Service Occupations 6 3.6% 3 3.6% 3 4.8% 0 0.0%<br />
7. Sales and Customer Service Occupations 3 1.8% 0 0.0% 3 4.8% 0 0.0%<br />
8. Process; Plant and Machine Operatives 6 3.6% 3 3.6% 3 4.8% 0 0.0%<br />
9. Elementary Occupations 9 5.5% 5 6.0% 4 6.5% 0 0.0%<br />
Not currently working 99 60.0% 55 65.5% 34 54.8% 10 52.6%<br />
Not aged 16 to 74 27 14.1% 4 4.5% 19 23.5% 4 19.0%<br />
Industry Total % Total % Total % Total %<br />
A. Agriculture; Hunting and Forestry 0 0.0% 0 0.0% 0 0.0% 0 0.0%<br />
B. Fishing 0 0.0% 0 0.0% 0 0.0% 0 0.0%<br />
C. Mining and Quarrying 3 1.8% 0 0.0% 3 4.8% 0 0.0%<br />
D. Manufacturing 11 6.7% 7 8.3% 4 6.5% 0 0.0%<br />
E. Electricity; Gas and Water Supply 0 0.0% 0 0.0% 0 0.0% 0 0.0%<br />
F. Construction 0 0.0% 0 0.0% 0 0.0% 0 0.0%<br />
G. Wholesale and Retail Trade 8 4.8% 3 3.6% 5 8.1% 0 0.0%<br />
H. Hotels and Catering; Repairs 0 0.0% 0 0.0% 0 0.0% 0 0.0%<br />
I. Transport; Storage and Communication 11 6.7% 7 8.3% 4 6.5% 0 0.0%<br />
J. Financial Intermediation 0 0.0% 0 0.0% 0 0.0% 0 0.0%<br />
K. Real Estate; Renting and Business Activities 9 5.5% 3 3.6% 3 4.8% 3 15.8%<br />
L. Public Administration and Defence; Social Security 6 3.6% 3 3.6% 3 4.8% 0 0.0%<br />
M. Education 0 0.0% 0 0.0% 0 0.0% 0 0.0%<br />
N. Health and Social Work 16 9.7% 5 6.0% 7 11.3% 4 21.1%<br />
O; P; Q Other 0 0.0% 0 0.0% 0 0.0% 0 0.0%<br />
Not currently working 99 60.0% 55 65.5% 34 54.8% 10 52.6%<br />
Not aged 16 to 74 27 14.1% 4 4.5% 19 23.5% 4 19.0%<br />
Note<br />
Other* in industry includes other community; social and personal service activities; private households with employed persons;<br />
extra territorial organisations and bodies.<br />
Cells in this table have been randomly adjusted to avoid the release of confidential data 5 of 5<br />
Research & Intelligence, <strong>Kent</strong> <strong>County</strong> <strong>Council</strong><br />
research@kent.gov.uk