
Create successful ePaper yourself
Turn your PDF publications into a flip-book with our unique Google optimized e-Paper software.
Illustration: Galia Bernstein, nbillustration
cover s<strong>to</strong>ry<br />
Runaway<br />
adjustments<br />
Harnessing credit and debit valuation adjustments <strong>to</strong> credit default swaps may have<br />
seemed a good idea a few years ago, but as that market shrinks, it is eroding their<br />
foundations. Laurie Carver reports<br />
Ian Harris, Credit Suisse<br />
In the space <strong>of</strong><br />
three trading days, starting on November 30, 2012, the credit<br />
default swap (CDS) spread for Natixis fell 7.4%. During that<br />
period, a single trade was executed. In the three prior weeks, the CDS had not traded at all.<br />
That shows how jumpy and illiquid the CDS market can be, even for relatively large banks,<br />
and the same kind <strong>of</strong> results pop up time and again when trade frequencies – compiled by risk<br />
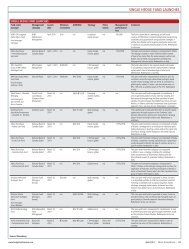
s<strong>of</strong>tware vendor Kamakura – are overlaid with spread his<strong>to</strong>ries (see figure 1). The CDS price<br />
appears <strong>to</strong> evolve in a fairly fluid fashion, but in many cases it goes for long periods without<br />
any trading <strong>to</strong> support it. The spread is essentially a composite <strong>of</strong> dealer estimates – and<br />
Kamakura’s chief executive compares it <strong>to</strong> another composite <strong>of</strong> bank estimates.<br />
“It’s like Libor – when vital numbers are tied <strong>to</strong> quotes that are disconnected from<br />
trades, there will be an incentive for manipulation. If I were a chief financial <strong>of</strong>ficer <strong>of</strong> a<br />
major company and I wanted my spread <strong>to</strong> be x rather than y, I don’t think it would take<br />
more than a couple <strong>of</strong> phone calls,” says Donald van Deventer, who is also founder <strong>of</strong> the<br />
Honolulu-based firm.<br />
That’s an extreme <strong>view</strong> – and dealers would no doubt disagree – but there is far more at<br />
stake than the credibility <strong>of</strong> the CDS market. Banks that want <strong>to</strong> model the credit<br />
valuation adjustment (CVA) capital charge contained in Basel III – which measures derivatives<br />
counterparty risk – are required by the regula<strong>to</strong>rs <strong>to</strong> use CDS spreads as the input.<br />
And CVA’s sibling – the debit valuation adjustment (DVA) that measures the impact <strong>of</strong><br />
changes in a bank’s creditworthiness on the value <strong>of</strong> its own derivatives liabilities – should<br />
also be based on market data according <strong>to</strong> International Financial Reporting Standard<br />
(IFRS) 13, which came in<strong>to</strong> force at the start <strong>of</strong> <strong>this</strong> year. As a bank becomes less robust,<br />
its liabilities drop in value, which is reported as a pr<strong>of</strong>it. When credit improves, the<br />
opposite happens. A survey published by Ernst & Young last Oc<strong>to</strong>ber found 12 <strong>of</strong> 13<br />
banks voluntarily reporting DVA based it on their own CDS spreads.<br />
That may work when a bank’s own CDS is trading regularly, but – as the Natixis example<br />
shows – there are cases when it is not. If the French bank had been using its CDSs as an<br />
own-credit metric, last December’s sliding spreads would – in theory – have forced it <strong>to</strong> mark<br />
down its derivatives liabilities, worth €122 billion as <strong>of</strong> the end <strong>of</strong> 2011, even though only<br />
one trade went through at the time. Similar problems apply <strong>to</strong> CVA, from both a capital and<br />
accounting perspective – IFRS 13 requires it <strong>to</strong> be reported alongside DVA.<br />
Put crudely, instead <strong>of</strong> hitching the CVA and DVA wagons <strong>to</strong> something steady, precise<br />
and reliable, fears are growing that these hugely important new values have been tied <strong>to</strong> a<br />
market that is sometimes volatile, sometimes stubbornly inactive, but always temperamental<br />
– a mule rather than a carthorse.<br />
“We were surprised that regula<strong>to</strong>rs made CVA and DVA so dependent on <strong>this</strong> market<br />
because we know it can be illiquid – I think it puts <strong>to</strong>o much pressure on our book, on our<br />
business. It’s a big issue,” says the head <strong>of</strong> fixed income at one UK bank.<br />
When individual CDSs are illiquid, Basel III and IFRS 13 allow banks <strong>to</strong> use proxy<br />
measures <strong>of</strong> credit risk, but the guidance provided by bank regula<strong>to</strong>rs and accountants is thin.<br />
risk.<strong>net</strong>/risk-magazine 15
cover s<strong>to</strong>ry<br />
For CVA, <strong>to</strong> which both sets <strong>of</strong> rules apply,<br />
the guidance is also conflicting. As a result,<br />
a proxying approach that would make sense<br />
from a capital perspective would leave a<br />
bank with additional pr<strong>of</strong>it-and-loss<br />
volatility – and vice versa.<br />
Adding <strong>to</strong> <strong>this</strong> litany <strong>of</strong> woes, the CDS<br />
market – for single names, as opposed <strong>to</strong><br />
indexes – is shrinking, both in terms <strong>of</strong><br />
volume and coverage. And <strong>this</strong> trend may<br />
be accelerated by proxying guidance from<br />
the Basel Committee on Banking<br />
Supervision, published in December, that<br />
prevents banks gaining any CVA capital<br />
relief when using a single-name CDS<br />
proxy as a hedge. An index containing the<br />
proxy is acceptable, the regula<strong>to</strong>rs say.<br />
“You have <strong>this</strong> odd situation where the<br />
standard setters and regula<strong>to</strong>rs are tying<br />
CVA and DVA <strong>to</strong> CDS markets just as they<br />
become more and more illiquid. There<br />
seems <strong>to</strong> be a huge amount <strong>of</strong> leeway that<br />
can be used in proxying – it’s fair <strong>to</strong> say<br />
some sophisticated banks are doing some<br />
fairly unsophisticated things. And there is a<br />
tension between what is the best approach<br />
with respect <strong>to</strong> earnings volatility and what<br />
is best for capital – it could be dangerous. I<br />
don’t think all the implications have been<br />
thought through,” says Jon Gregory, a<br />
partner at consultancy Solum Financial.<br />
Those fears are shared by some within<br />
the industry. “It’s appropriate in spirit that<br />
things contributing <strong>to</strong> accounting<br />
volatility should go in<strong>to</strong> capital requirements,<br />
but when we tied counterparty<br />
risk <strong>to</strong> CDS spreads, did we know what it<br />
would be driven by? If the big changes are<br />
driven by illiquid, model-based numbers,<br />
then is that valid? The regula<strong>to</strong>rs have<br />
chosen <strong>to</strong> add instability,” says Chris<br />
McHugh, head <strong>of</strong> CVA trading at HSBC.<br />
That certainly was not the intention, and<br />
one Basel Committee sub-group may look<br />
at the issue again, according <strong>to</strong> one<br />
international regula<strong>to</strong>r: “We’re aware <strong>of</strong> it.<br />
We had heard some concerns in the<br />
industry about it, so our team is trying <strong>to</strong><br />
determine whether there is any interest in<br />
revisiting it. But we still haven’t got a good<br />
feel for that,” says one senior regula<strong>to</strong>r.<br />
Another regula<strong>to</strong>ry source is more defiant,<br />
however: “No-one has presented any real<br />
evidence it is happening or – if it is – that<br />
it is having a significant impact. Even if it<br />
is, it’s not a justification for changing the<br />
rules,” he says.<br />
It depends what counts as evidence, <strong>of</strong><br />
course – but the Natixis example is just<br />
one illustration <strong>of</strong> the market’s fragility.<br />
From Oc<strong>to</strong>ber 31, 2011 <strong>to</strong> July 12, 2012,<br />
the ABN Amro CDS traded only once,<br />
but the bank’s spreads saw a peak <strong>of</strong><br />
329bp and a trough <strong>of</strong> 143bp during that<br />
period, with the latter coming a day after<br />
its CDS was trading at 174bp and a day<br />
before it bounced back up <strong>to</strong> 167bp – a<br />
drop <strong>of</strong> 17.8% followed by a 16.7% jump,<br />
without any trades going through.<br />
In mid-2012, Nordea’s CDS went 54<br />
trading days in which the contract was<br />
executed once, but the spread declined<br />
9% during the period. Nomura’s CDS<br />
spread fell from 274bp <strong>to</strong> 231bp in the<br />
space <strong>of</strong> five trading days, starting on<br />
November 23 last year – a decline <strong>of</strong> 16%.<br />
There were four trades during that period.<br />
If those three banks had all been using<br />
their own CDS spreads <strong>to</strong> calculate DVA<br />
during the above periods, their perceived<br />
creditworthiness would be improving in<br />
the absence <strong>of</strong> any real trading activity<br />
– purely based on the quotes <strong>of</strong> marketmakers<br />
– and they would be reporting<br />
losses as a result.<br />
CVA concerns<br />
For CVA, illiquidity for individual<br />
contracts poses similar concerns, and<br />
there is the additional problem <strong>of</strong><br />
coverage – there are no CDS contracts on<br />
the vast majority <strong>of</strong> derivatives users.<br />
“Most weeks there are between 700 and<br />
900 names trading, yet there will be<br />
2,000 names reported – leaving around<br />
1,200 names that are based on quotes<br />
from the investment banks, with no<br />
trades behind those numbers. Some <strong>of</strong><br />
these names hardly ever trade at all,” says<br />
Kamakura’s van Deventer.<br />
In illiquid contracts, sudden spikes in<br />
trade frequency appear <strong>to</strong> result in a<br />
change in spreads, but van Deventer warns<br />
there is not enough data <strong>to</strong> analyse the<br />
relationship between the two. “The<br />
question is: is it wise <strong>to</strong> base your accounting<br />
– let alone capital requirements – on<br />
such numbers? I would say no,” he argues.<br />
Market-makers – and, possibly,<br />
accountants or regula<strong>to</strong>rs – may argue the<br />
lack <strong>of</strong> trading volume doesn’t matter.<br />
IFRS 13 specifies that banks should use a<br />
“quoted market price in an active market”<br />
– not necessarily the price <strong>of</strong> the last<br />
trade. As long as the various sell-side<br />
banks are actually willing <strong>to</strong> execute at<br />
the levels they <strong>of</strong>fer, then a real market<br />
exists. And if there are no reliable CDS<br />
spreads, both Basel III and IFRS 13 allow<br />
the industry <strong>to</strong> use alternatives.<br />
But from that point on, banks are in<br />
uncharted waters. “If you’re sitting on a<br />
book containing thousands <strong>of</strong> names, it<br />
will always have been a pretty small part<br />
that had liquid CDSs – but even <strong>this</strong> is now<br />
shrinking and you will see more names<br />
move in<strong>to</strong> the illiquid portfolio. What you<br />
do about these names is fairly ill-defined,<br />
and there are a variety <strong>of</strong> approaches across<br />
the Street,” says Jeremy Vice, head <strong>of</strong> CVA<br />
trading at UniCredit in London.<br />
For CVA, accounting rules specify three<br />
alternatives when reliable market data on<br />
counterparty credit is lacking. Banks can<br />
use another suitable asset, generate a proxy<br />
spread based on information such as<br />
rating, geography and industrial sec<strong>to</strong>r<br />
– sometimes known as mark-<strong>to</strong>-matrix – or<br />
simply model everything.<br />
The first <strong>of</strong> these options frequently runs<br />
in<strong>to</strong> the same liquidity problems encountered<br />
in the CDS market, and the third is a<br />
last resort, so banks have been developing<br />
different flavours <strong>of</strong> the mark-<strong>to</strong>-matrix<br />
approach. This might mean that if a liquid<br />
spread is not available for a specific<br />
German au<strong>to</strong> supplier, for example, the<br />
bank should apply the spread for another,<br />
similarly rated German company in the<br />
same industrial sec<strong>to</strong>r – but the resulting<br />
matrix can be quite complex. Using data<br />
provider Markit’s eight ratings bands, 11<br />
industry sec<strong>to</strong>rs and 12 regions generates a<br />
matrix with 1,056 cells, for example, many<br />
<strong>of</strong> which still lack a constituent with a<br />
liquid CDS spread. Even if a spread is<br />
available in the right cell, there is no<br />
guarantee that the proxy will be closely<br />
correlated with the original name – and<br />
while it might satisfy the accountants, it<br />
may be difficult <strong>to</strong> hedge, driving up<br />
capital requirements.<br />
“It’s the classical proxy s<strong>to</strong>ry – you can<br />
come up with very tiny subsets <strong>of</strong> names<br />
split by geography and sec<strong>to</strong>r but it tends<br />
<strong>to</strong> increase a spurious volatility, which can<br />
have negative implications for capital,”<br />
says UniCredit’s Vice.<br />
As such, the goal is not always <strong>to</strong> find<br />
another single name – and banks <strong>of</strong>ten<br />
allow the available hedges <strong>to</strong> influence the<br />
choice <strong>of</strong> proxy. The most popular<br />
hedging instruments are liquid contracts<br />
such as indexes and sovereigns, with the<br />
latter used in particular for corporates<br />
based in that country, or for municipal<br />
governments. Genuinely liquid singlename<br />
corporates will also be used, <strong>to</strong>o. As<br />
an example, Ian Harris, head <strong>of</strong> CVA<br />
trading at Credit Suisse, recalls an<br />
occasion on which the desk hedged a<br />
European utility with a rival company<br />
from a neighbouring country, for<br />
16 <strong>Risk</strong> March 2013
1 Bank CDSs – one liquid name and three illiquid ones<br />
Five-year spread (bp)<br />
ABN Amro<br />
350<br />
300<br />
250<br />
200<br />
150<br />
100<br />
50<br />
0<br />
Feb 22,<br />
2011<br />
Aug 22,<br />
2011<br />
Feb 22,<br />
2012<br />
5Y spread<br />
Contracts<br />
traded<br />
Aug 22,<br />
2012<br />
8<br />
7<br />
6<br />
5<br />
4<br />
3<br />
2<br />
1<br />
0<br />
Contracts traded<br />
Five-year spread (bp)<br />
Bank <strong>of</strong> America<br />
600<br />
500<br />
400<br />
300<br />
200<br />
100<br />
0<br />
Feb 22,<br />
2011<br />
Aug 22,<br />
2011<br />
Feb 22,<br />
2012<br />
Aug 22,<br />
2012<br />
5Y spread<br />
Contracts<br />
traded<br />
400<br />
350<br />
300<br />
250<br />
200<br />
150<br />
100<br />
50<br />
0<br />
Contracts traded<br />
Five-year spread (bp)<br />
450<br />
400<br />
350<br />
300<br />
250<br />
200<br />
150<br />
100<br />
Nomura<br />
5Y spread<br />
Contracts<br />
traded<br />
50<br />
0<br />
Feb 22,<br />
2011<br />
Aug 22,<br />
2011<br />
Feb 22,<br />
2012<br />
Aug 22,<br />
2012<br />
50<br />
45<br />
40<br />
35<br />
30<br />
25<br />
20<br />
15<br />
10<br />
5<br />
0<br />
Contracts traded<br />
Five-year spread (bp)<br />
250<br />
200<br />
150<br />
100<br />
50<br />
Nordea<br />
0<br />
Feb 22,<br />
2011<br />
Aug 22,<br />
2011<br />
Feb 22,<br />
2012<br />
Aug 22,<br />
2012<br />
5Y spread<br />
Contracts<br />
traded<br />
40<br />
35<br />
30<br />
25<br />
20<br />
15<br />
10<br />
5<br />
0<br />
Contracts traded<br />
Source: Kamakura, Markit<br />
example, though <strong>this</strong> was unusual.<br />
These hedging options feed back in<strong>to</strong><br />
the choice <strong>of</strong> proxy, ensuring a bank is<br />
able <strong>to</strong> mitigate the volatility created<br />
when calculating the counterparty<br />
exposure. “We tend <strong>to</strong> mark things as<br />
some fac<strong>to</strong>r times the high-yield index, so<br />
we can hedge. We have a control process<br />
with our research guys and back <strong>of</strong>fice,<br />
but the disagreements are typically over<br />
the scale <strong>of</strong> the multiplier rather than the<br />
choice <strong>of</strong> proxy,” says one European<br />
bank’s head <strong>of</strong> CVA trading. HSBC’s<br />
McHugh agrees: “I prefer <strong>to</strong> have it<br />
relative <strong>to</strong> something I can trade.”<br />
So much for objective proxying. But even<br />
some liquid curves won’t meet regula<strong>to</strong>ry<br />
back-testing requirements, dealers say, so<br />
another curve – more liquid but less<br />
correlated – may need <strong>to</strong> be selected. In<br />
extreme cases, the best option may be a<br />
regional sovereign index, or a similarly<br />
rated corporate in an entirely different<br />
sec<strong>to</strong>r – gradually, the proxy is pulled<br />
further from the specifics <strong>of</strong> the underlying<br />
risk, increasing the chance that a host <strong>of</strong><br />
illiquid names end up being mapped <strong>to</strong> the<br />
same liquid one and creating a kind <strong>of</strong><br />
synthetic concentration <strong>of</strong> exposure.<br />
The traders’ fear <strong>of</strong> spurious volatility<br />
– and the determination <strong>of</strong> CVA desks<br />
not <strong>to</strong> stray <strong>to</strong>o far from an easy hedge –<br />
means modelled approaches try <strong>to</strong> stay<br />
simple, according <strong>to</strong> Solum Financial’s<br />
Gregory. It also means the validity <strong>of</strong> the<br />
numbers as measures <strong>of</strong> actual counterparty<br />
risk is undermined. “You can try <strong>to</strong><br />
do it exactly, and get the closest liquid<br />
name, but I think there is a lot <strong>of</strong><br />
proxying only by rating, or only geography,<br />
going on. There’s always a lot <strong>of</strong><br />
subjectivity,” he says.<br />
Some banks have been more open about<br />
their approach than others. For example,<br />
Royal Bank <strong>of</strong> Scotland uses a loosely<br />
mark-<strong>to</strong>-matrix approach, involving a<br />
shuffling <strong>of</strong> his<strong>to</strong>rical data <strong>to</strong> ensure<br />
coherent simulation in the value-at-risk<br />
engine that generates the CVA capital<br />
number. This methodology was presented<br />
last Oc<strong>to</strong>ber at a <strong>Risk</strong> conference in<br />
London by Dherminder Kainth, the bank’s<br />
head <strong>of</strong> the quantitative research centre<br />
within group market risk.<br />
Nomura uses what it calls cross-sectional<br />
proxying – another mark-<strong>to</strong>-matrix<br />
approach, and an allusion <strong>to</strong> guidance<br />
provided by the European Banking<br />
Authority (EBA) in July 2012, which<br />
advised banks <strong>to</strong> use a so-called intersection<br />
approach. The EBA method involves<br />
separating counterparties in<strong>to</strong> buckets<br />
and replacing illiquid names with a proxy<br />
derived from the average <strong>of</strong> spreads for its<br />
liquid peers. Nomura sees <strong>this</strong> as flawed<br />
– its cross-sectional proxies are generated<br />
on the basis <strong>of</strong> correlations <strong>to</strong> fundamental<br />
fac<strong>to</strong>rs, which it argues produces more<br />
sensible results (see pages 20–21).<br />
As the EBA example shows, regula<strong>to</strong>rs<br />
have gone in<strong>to</strong> more detail than accountants<br />
when describing what they want <strong>to</strong><br />
see – but <strong>this</strong> extra detail has left some<br />
dealers confused. As an example, the<br />
Basel Committee states a valid CVA<br />
proxy should seek <strong>to</strong> match the region,<br />
internal rating and business type <strong>of</strong> the<br />
original counterparty. And while the<br />
proxying rules insist on maximum<br />
granularity, guidance published by the<br />
committee in December warned that a<br />
proxy eligible for CVA calculation<br />
purposes may not be an eligible hedge for<br />
the purposes <strong>of</strong> capital relief. Banks<br />
would only be able <strong>to</strong> mitigate CVA<br />
capital requirements by hedging with an<br />
index containing the proxy, and would<br />
then also have <strong>to</strong> model the spread basis<br />
between the CVA proxy and the hedge.<br />
That has prompted some head-scratching<br />
among dealers. “I find it bizarre. If the<br />
index is acceptable as a hedge because it<br />
contains the proxy name, why isn’t the<br />
proxy name itself eligible?” asks the<br />
European bank’s head <strong>of</strong> CVA trading.<br />
As an example, he considers a hypothetical<br />
exposure <strong>to</strong> a French corporate<br />
that uses the CDS on France as a proxy<br />
and is hedged using the sovereign<br />
contract. This would not qualify for<br />
capital relief and would itself attract<br />
capital as a separate position. Only a hedge<br />
in Markit’s index <strong>of</strong> European sovereign<br />
CDSs – the iTraxx SovX Western Europe<br />
– would provide capital relief, he says. By<br />
contrast, under IFRS 13, the CVA<br />
exposure could be calculated using the<br />
sovereign CDS as a proxy and also hedged<br />
risk.<strong>net</strong>/risk-magazine 17
cover s<strong>to</strong>ry<br />
with the same contract – resulting in a<br />
perfect <strong>of</strong>fset and zero earnings volatility.<br />
The result is a tug-<strong>of</strong>-war between<br />
earnings and capital. The most effective<br />
hedge from an earnings perspective will<br />
consume additional capital, while the<br />
most effective capital relief would mean<br />
using an index <strong>of</strong> 19 European sovereigns<br />
<strong>to</strong> hedge a single French company.<br />
“These kinds <strong>of</strong> prescriptive rules<br />
generally serve <strong>to</strong> increase volatility. If<br />
banks only get capital benefit for index –<br />
rather than proxy – hedging, you will see<br />
<strong>this</strong> misalignment between capital<br />
management and liquidity. The market<br />
will be pushed <strong>to</strong>wards indexes,” says<br />
UniCredit’s Vice.<br />
That would reinforce the existing trend<br />
in CDS markets – with single-name<br />
volumes dwindling and index volumes<br />
growing – and some see <strong>this</strong> as an<br />
unspoken intention. “It’s hard <strong>to</strong> see<br />
anything other than a deliberate push away<br />
from single names behind <strong>this</strong> logic. As the<br />
business gets more capital-intensive there<br />
will be every reason <strong>to</strong> reduce capital, even<br />
if it causes pr<strong>of</strong>it and loss volatility,” warns<br />
Solum Financial’s Gregory.<br />
For DVA, the issue initially appears<br />
simpler – at least for larger banks that have<br />
relatively liquid CDSs – but it quickly<br />
becomes complex. Some institutions<br />
choose <strong>to</strong> ignore the earnings volatility<br />
created by own-credit effects on liabilities,<br />
while others choose <strong>to</strong> hedge it – five <strong>of</strong> 19<br />
banks fell in<strong>to</strong> <strong>this</strong> category in the Ernst &<br />
Young survey. For these banks, a disconnection<br />
immediately appears – they cannot<br />
hedge using the same instrument that<br />
drives the DVA, because it would require<br />
them <strong>to</strong> sell protection on themselves. The<br />
question <strong>of</strong> how <strong>to</strong> create a proxy hedging<br />
curve remains.<br />
“We are still pricing our DVA <strong>of</strong>f our<br />
CDSs and have no plans <strong>to</strong> change that<br />
– it’s still the best indica<strong>to</strong>r <strong>of</strong> what the<br />
spread should be. But it’s a massive driver<br />
<strong>of</strong> earnings and not something we can do<br />
a huge amount about, so we have <strong>to</strong><br />
effectively hedge ourselves. A significant<br />
amount <strong>of</strong> thought goes in<strong>to</strong> how we pick<br />
the instruments,” says the head <strong>of</strong> CVA<br />
trading at a European bank.<br />
These issues are compounded for<br />
smaller banks that have not tried <strong>to</strong><br />
calculate DVA until now – the German<br />
landesbanks for instance. In many cases,<br />
these institutions have CDSs that trade<br />
even less frequently, meaning they need<br />
<strong>to</strong> find an own-credit proxy just <strong>to</strong><br />
report DVA, as well as for any hedging<br />
they choose <strong>to</strong> do. The technical and<br />
modelling challenges are also new. A<br />
spokesman for the Deutscher Sparkassen-<br />
und Giroverband, which represents<br />
the country’s public banks, says the issue<br />
“is a concern for our members, particularly<br />
in the required additional systems<br />
and modelling”. n<br />
Decline and fall<br />
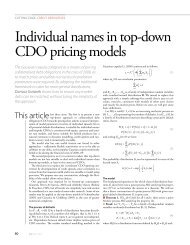
In the first half <strong>of</strong> 2008, <strong>to</strong>tal outstanding notional in the single-name credit default swap<br />
(CDS) market hit $33.4 trillion – the summit <strong>of</strong> a roughly decade-long ascent. Since then,<br />
it has been shrinking as rapidly as it grew, according <strong>to</strong> the twice-yearly survey carried<br />
out by the Bank for International Settlements. During the first half <strong>of</strong> last year, notional<br />
outstanding reached $15.6 trillion, with much <strong>of</strong> that concentrated in the 200 or so names<br />
that trade $100 million notional or more a week. Of the 1,130 names traded from July 16,<br />
2010 <strong>to</strong> the end <strong>of</strong> 2012, almost 70% did so less than once a week (see figure 3).<br />
“We’ve been staring down the barrel <strong>of</strong> <strong>this</strong> market for a while. There are a lot <strong>of</strong> traders<br />
– a lot <strong>of</strong> my traders – sitting here doing nothing,” says a senior CDS trader at a North<br />
American bank. There are a few reasons for <strong>this</strong>. One is a general decline in risk aversion<br />
– since European Central Bank (ECB) chief Mario Draghi’s bald statement in July last year<br />
that the ECB would do “whatever it takes” <strong>to</strong> prevent a break-up <strong>of</strong> the single currency,<br />
eurozone fears have receded. That may prove a temporary respite, but other constraints<br />
are more structural than cyclical – pre-crisis correlation trades are maturing or being<br />
sold, reducing demand for CDS hedges. Europe has banned so-called naked short positions<br />
in sovereign CDSs, meaning the protection has <strong>to</strong> <strong>of</strong>fset a corresponding long<br />
position – which one dealer says has depressed demand for sovereigns by 40%. And<br />
Basel III is making certain types <strong>of</strong> exposure more costly, so dealers are trying <strong>to</strong> run<br />
leaner books comprising standardised, shorter-dated assets that can also be cleared.<br />
Credit Suisse, for example, cut the gross notional size <strong>of</strong> its flow CDS book by 45% last<br />
year by unwinding thousands <strong>of</strong> positions, roughly halving its one-day value-at-risk <strong>to</strong><br />
$21 million (<strong>Risk</strong> January 2013, pages 54–55, www.risk.<strong>net</strong>/2233322). Other banks have<br />
been through similar work.<br />
One result is that big trades are less easily accommodated. “Bid-<strong>of</strong>fer spreads have<br />
been reasonably constant – and low – in recent years, but you’ve seen a reduction in<br />
what you can get done on that. Nowadays a $5 million trade is equivalent <strong>to</strong> $20 million<br />
or $30 million in 2007. The five-year point has always been the most liquid, but there<br />
were days last year when the market was only really open for that maturity and for only<br />
the most liquid names,” says Niall Cameron, global head <strong>of</strong> credit trading at HSBC.<br />
That does not mean traders are moping around. “Running a CDS book has always<br />
been as much about the art <strong>of</strong> portfolio management as it has about market-making. I<br />
don’t know why people are that worried about it. It costs more because <strong>of</strong> Basel III and<br />
all the rest <strong>of</strong> it, but that’s the cost <strong>of</strong> doing business. If they don’t want <strong>to</strong> be in the<br />
business, send me the book,” says the North American bank’s credit trader.<br />
2 Outstanding notional volumes for single- and multiplename<br />
CDSs<br />
$ trillion<br />
3 Infrequent trading <strong>of</strong> single-name CDSs<br />
Number <strong>of</strong> reference names<br />
40<br />
35<br />
30<br />
25<br />
20<br />
15<br />
10<br />
5<br />
0<br />
800<br />
700<br />
600<br />
500<br />
400<br />
300<br />
200<br />
100<br />
0<br />
0.75–1.0<br />
0.5–0.75<br />
0.25–0.5<br />
0–0.25<br />
0.75–1.0<br />
0.5–0.75<br />
0.25–0.5<br />
0–0.25<br />
Multiple-name CDSs<br />
1H05<br />
2H05<br />
1H06<br />
2H06<br />
1H07<br />
2H07<br />
1H08<br />
2H08<br />
Single-name CDSs<br />
1H09<br />
2H09<br />
1H10<br />
2H10<br />
1H11<br />
2H11<br />
1H12<br />
Blue bars = l-h axis<br />
Red bars = r-h axis<br />
≤1 2 3 4 5 6 7 8<br />
Source: Kamakura<br />
Trades per week<br />
100<br />
90<br />
80<br />
70<br />
60<br />
50<br />
40<br />
30<br />
20<br />
10<br />
0<br />
Source: BIS<br />
% <strong>of</strong> all reference names<br />
18 <strong>Risk</strong> March 2013