Spillway Test - Bureau of Reclamation
Spillway Test - Bureau of Reclamation
Spillway Test - Bureau of Reclamation

Create successful ePaper yourself
Turn your PDF publications into a flip-book with our unique Google optimized e-Paper software.
July 1985<br />
Engineering and Research Center<br />
u. s. Department <strong>of</strong> the Interior<br />
<strong>Bureau</strong><br />
<strong>of</strong> <strong>Reclamation</strong>
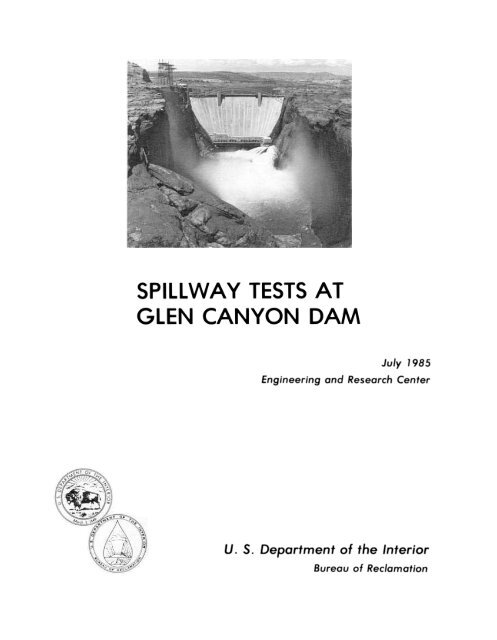
Cover:<br />
Colorado River below Glen Canyon Dam. The<br />
discharge from the 4 1 -footdiameter left tunnel spillway<br />
is 50,000 ft3/s and the four 96-inch hollow-jet<br />
'valves are releasing a combined flow <strong>of</strong> 4,000 ft3/s.<br />
These flows occurred August 1 2, 1 984, during tests<br />
to evaluate the newly constructed aeration slot in the<br />
left spillway.
SPILLWAY TESTS AT GLEN CANYON<br />
DAM<br />
by<br />
K. Warren Frizell<br />
Hydraulics Branch<br />
Division <strong>of</strong> Research and Laboratory Services<br />
Engineering and Research Center<br />
Denver. Colorado<br />
July 1985<br />
UNITED STATES DEPARTMENT OF THE INTERIOR<br />
*<br />
BUREAU OF RECLAMATION
ACKNOWLEDGIMENTS<br />
for their involvement in mak-<br />
I would like to thank the following<br />
ing this a successful test:<br />
Clifford Barrett. Regional Director. and the Upper Colorado<br />
Regional Office in Salt Lake City. Utah. for the funding and<br />
planning support.<br />
Thomas Gamble and the staff <strong>of</strong> the Colorado River Storage<br />
Project Office in Page. Arizona.<br />
Richard White and the operations staff at Glen Canyon Dam.<br />
Jack Tyler and the construction<br />
Dam.<br />
<strong>of</strong>fice staff at Glen Canyon<br />
Theodore Whitmoyer.<br />
photographer.<br />
G. F. Atkinson Company. spillway repair contractor.<br />
Principal designer. David Hinchliff. and other involved parties<br />
from the Division <strong>of</strong> Dams and Waterway Design. E&R<br />
Center.<br />
Hydraulics Branch staff. notably Lee Elgin. who participated<br />
in the testing. Division <strong>of</strong> Research and Laboratory Services.<br />
E&R Center.<br />
As the Nation's principal conservation agency. the Department <strong>of</strong> the<br />
Interior has responsibility for most <strong>of</strong> our nationally owned public<br />
lands and natural resources. This includes fostering the wisest use <strong>of</strong><br />
our land and water resources. protecting our fish and wildlife. preserving<br />
the environmental and cultural values <strong>of</strong> our national parks and<br />
historical places. and providing for the enjoyment <strong>of</strong> life through outdoor<br />
recreation. The Department assesses our energy and mineral<br />
resources and works to assure that their development is in the best<br />
interests <strong>of</strong> all our people. The Department also has a major responsibility<br />
for American Indian reservation communities and for people<br />
who live in Island Territories under U.S.Administration.
CONTENTS<br />
Introduction . . . . . . . . . . . . . . . . . . . . . . . . . .<br />
<strong>Test</strong> Background.. . . . . . . . . . . . . . . . . . . . . . . .<br />
Instrumentation and Data Acquisition . . . . . . . . . . . .. . .<br />
Instrumentation. . . . . . . . . . . . . . . . . . . . . . . .<br />
Dataacquisition. . . . . . . . . . . . . . . . . . . . . . .<br />
Pretest Preparation. . . . . . . . . . . . . . . . . . . . . . .<br />
<strong>Test</strong>ing. . . . . . . . . . . . . . . . . . . . . . . . . . . . .<br />
Results and Discussion . . . . . . . . . . . . . . . . . . . . .<br />
Air slot instrumentation. . . . . . . . . . . . . . . . . . .<br />
Elbowinstrumentation. . . . . . . . . . . . . . . . . . . . .<br />
Observations . . . . . . . . . . . . . . . . . . . . . . . . . .<br />
Conclusions. . . . . . . . . . . . . . . . . . . . . . . . . . .<br />
Bibliography . . . . . . . . . . . . . . . . . . . . . . . . . .<br />
Appendix - Travel Report . . . . . . . . . . . . . . . . . . . .<br />
Page<br />
1<br />
1<br />
2<br />
5<br />
6<br />
7<br />
8<br />
10<br />
10<br />
14<br />
31<br />
34<br />
35<br />
37<br />
TABLES<br />
Table<br />
1 Operation record - Glen Canyon Damleft spillway. . . . . .<br />
2 Averagevelocity versus spillway discharge. . . . . . . . .<br />
3 Averagestatic pressures. . . . . . . . . . . . . . . . . .<br />
9<br />
10<br />
14<br />
i i i
CONTENTS<br />
- Continued<br />
FIGURES<br />
Figure<br />
1 Glen Canyon Dam- spillwayrepair. . . . . . . . . . . . .<br />
2 Data acquisition equipmentin the access tunnel. . . . . .<br />
3 Air velocity measurementsin the air slot. . . . . . . . .<br />
4 Air demand comparison - computed-model-prototype . . . . .<br />
5 Dynamic pressure fluctuations, Sta. 24+20 (Box 7),<br />
Q = 6, 500 ft 3/ s . . . . . . . . . . . . . . . . . . . . .<br />
6 Dynamic pressure fluctuations, Sta. 24+20 (Box 7),<br />
Q = 10,000 ft3/s . . . . . . . . . . . . . . . . . . . .<br />
7 Dynamic pressure fluctuations, Sta. 24+20 (Box 7),<br />
Q = 20,000 ft3/s . . . . . . . . . . . . . . . . . . . .<br />
8 Dynamic pressure fluctuations, Sta. 24+20 (Box 7),<br />
Q = 50,000 ft3/s . . . . . . . . . . . . . . . . . . . .<br />
9 Dynamic pressure fluctuations, Sta. 25+80 (Box 3),<br />
Q = 6,500 ft3/s . . . . . . . . . . . . . . . . . . . . .<br />
10 Dynamic pressure fluctuations, Sta. 25+80 (Box 3),<br />
Q = 10,000 ft3/s . . . . . . . . . . . . . . . . . . . .<br />
11 Dynamic pressure fluctuations, Sta. 25+80 (Box 3),<br />
Q = 20,000 ft3/s . . . . . . . . . . . . . . . . . . . .<br />
12 Dynamic pressure fluctuations, Sta. 25+80 (Box 3),<br />
Q = 35,000 ft3/s . . . . . . . . . . . . . . . . . . . .<br />
13 Dynamic pressure fluctuations, Sta. 25+80 (Box 3),<br />
Q = 50,000ft3/s. . . . . . . . . . . . . . . . . . . . .<br />
14 Dynamic pressure fluctuations, Sta. 26+20 (Box 2),<br />
Q = 6, 500 ft 3/ s . . . . . . . . . . . . . . . . . . . . .<br />
15 Dynamic pressure fluctuations, Sta. 26+20 (Box 2),<br />
Q = 10,000 ft3/s . . . . . . . . . . . . . . . . . . . .<br />
16 Dynamic pressure fluctuations, Sta. 26+20 (Box 2),<br />
Q = 20,000 ft3/s . . . . . . . . . . . . . . . . . . . .<br />
17 Dynamic pressure fluctuations, Sta. 26+20 (Box 2),<br />
Q = 35,000 ft3/s . . . . . . . . . . . . . . . . . . . .<br />
18 Dynamic pressure fluctuations, Sta. 26+20 (Box 2),<br />
Q = 50,000 ft3/s . . . . . . . . . . . . . . . . . . . .<br />
19 Energy spectrums <strong>of</strong> dynamic pressure fluctuation at<br />
Sta. 24+20 (Box 7) for flows <strong>of</strong> 10,000, 20,000,<br />
and 35,000 ft3/s . . . . . . . . . . . . . . . . . . . .<br />
20 Model-prototype comparison <strong>of</strong> static pressures at<br />
Sta. 24+60 (Box 6) and Sta. 25+80 (Box 3) . . . . . . . .<br />
21 Prototype frequency spectrums (by FTT) <strong>of</strong> dynamic<br />
pressure fluctuations at Sta. 24+20 (Box 7) . . . . . . .<br />
Page<br />
3<br />
6<br />
11<br />
12<br />
15<br />
16<br />
17<br />
18<br />
19<br />
20<br />
21<br />
22<br />
23<br />
24<br />
25<br />
26<br />
27<br />
28<br />
29<br />
30<br />
32<br />
iv
INTRODUCTION<br />
<strong>Test</strong>s were performed on the left spillway tunnel <strong>of</strong> Glen Canyon Dam<br />
August 11 through 17, 1984. The tests were used to evaluate:<br />
1. The effectiveness <strong>of</strong> the air slot<br />
2. The adequacy <strong>of</strong> the tunnel lining repair specification<br />
3. The model to prototype conformance<br />
The evaluations were made through a series <strong>of</strong> measurements and observations.<br />
Results showed the newly installed air slot to be operating satisfactorily.<br />
Evidence <strong>of</strong> cavitation damage was not observed.<br />
TEST<br />
BACKGROUND<br />
During the summer <strong>of</strong> 1983, both tunnel spillways at Glen Canyon Dam<br />
experienced major cavitation and erosion damage [IJ.* As part <strong>of</strong><br />
the tunnel repair, an air slot was constructed in the left and right<br />
tunnels. The air slots were designed to reduce the potential for<br />
cavitation damage by entraining air into the flow to lower the sonic<br />
velocity, and in turn lessen the impact <strong>of</strong> shock waves caused by the<br />
imploding vapor bubbles. Although general flow patterns could be<br />
observed in the <strong>Bureau</strong>'s 1:42.8 scale hydraulic model [2J, a prototype<br />
test was needed to evaluate the air slot's effectiveness for preventing<br />
cavitation damage. Previously, two <strong>Bureau</strong> <strong>of</strong> <strong>Reclamation</strong> tunnel spillways<br />
had been equipped with air slots; Yellowtail Dam (1968) and Flaming<br />
Gorge Dam (1982). However, neither spillway has operated sufficiently<br />
to evaluate the designs in detail.<br />
*Number in brackets refer to the Bibliography.
Glen Canyon Damprovided a unique opportunity for a prototype test.<br />
The provisions for instrumentation could be made during the repair<br />
at a fraction <strong>of</strong> the cost <strong>of</strong> instrumenting one <strong>of</strong> the previously mentioned<br />
existing spillways. In addition, the reservoir was in a surcharge<br />
condition providing water for an extended spillway test.<br />
INSTRUMENTATION AND DATA ACQUISITION<br />
An instrumentation scheme was developed in which various measurement<br />
locations were provided throughout the spillway tunnel. Eleven instrumentation<br />
boxes were installed and connected by electrical conduit to a junction<br />
box in the plugged access tunnel. The instrument boxes consist <strong>of</strong>:<br />
(1) A I5-in length <strong>of</strong> 6-in-diameter pipe<br />
(2) A removable steel top plate<br />
(3) A I-I/2-in conduit connection running to the access tunnel<br />
The instrument boxes were installed flush with the tunnel inside surface<br />
as the new concrete was placed in the tunnel invert and in the air<br />
slot. Details <strong>of</strong> the instrument boxes and their locations are shown<br />
on figure 1. Problems occurred with leakage into these boxes at the<br />
connections with the electrical conduit. In addition, scale and rust<br />
accumulated on the removable steel plates. Electrical signal cable<br />
was pulled into each instrument box and the appropriate instrument<br />
connected. A computer-based data acquisition system was configured<br />
to poll and record outputs from all tunnel instrumentation.<br />
2
1<br />
'<br />
I<br />
-------------<br />
(Left spl J Iway tume I -f NC conduIt aJonr;! crown <strong>of</strong> spIllway<br />
A<br />
NC CQn::Jult oro )urx;tlon<br />
00,1( for o8rat Ion .slot<br />
/fl$trl.f!l6nts~-<br />
Access turnsl ad/t.<br />
S88 (J499)<br />
Saven Instrl.f!l6nt boxlJS<br />
10cat6d left <strong>of</strong>" Invert<br />
2'<br />
P LAN<br />
( ACC6SS tunnal<br />
plUf) ond ra:np<br />
-L=S:-/"'"~<br />
Termlno I box not shown<br />
rfSPIII.ay<br />
','-'<br />
,<br />
Access tunntll plUfJ.<br />
see (J499)<br />
SECT ION A-A<br />
LimIt<br />
<strong>of</strong><br />
excavotlon<br />
<strong>of</strong><br />
IJ- 010, fIrst $to(le concrote)<br />
I<br />
SECT JON C-C<br />
Wrap sPOnr;!o rubPor or suItable<br />
moterlol to top <strong>of</strong>" coupJJno<br />
to prevent bond Ing<br />
~f ~~~/jO~<br />
~r;~u~~~~1<br />
be ustKi for wJre pull.<br />
~<br />
,<br />
:<br />
/-}'-;;;;;1;-.-;;;;;'---+-- -<br />
/ p"'lat: ~~"'d~):"'<br />
,~,<br />
~<br />
':<br />
','~..<br />
'~:"<br />
FIRST STAGE' . j.<br />
:..,::, ><br />
I','<br />
- 6--J50 f Blank<br />
fOn;Je we fIdad to<br />
threaded lanoe<br />
SCNcut-<br />
2"<br />
1500 Threaded or<br />
6"-<br />
weldable flonr;!a<br />
6~/:.e8~/~~~<br />
~<br />
~..<br />
~ 6 '-<br />
INSTRUMENT BOX DETAIL<br />
-y: ~rl<br />
.'f..<br />
I<br />
,<br />
Wl<br />
,<br />
'.<br />
- .<br />
, ,<br />
,-<br />
' '<br />
I<br />
~:',.<br />
Second stage concrete, '<br />
,~,'<br />
.', "<br />
:<br />
'<br />
I<br />
"<br />
---~jfF1rst<br />
~- ~:.
Instrumentation<br />
All measurements in the spillway tunnel were made with various types<br />
<strong>of</strong> pressure transducers. By operating the transducers using a current<br />
loop, it allowed for the use <strong>of</strong> long cable lengths which were required<br />
to connect the transducers with the data acquisition system in the<br />
access tunnel.<br />
Pressure measurements (both static and dynamic) were planned for instrument<br />
Boxes 1 through 7 in the invert <strong>of</strong> the spillway tunnel elbow. Sealed,<br />
absolute static pressure transducers were installed in Boxes 1, 2,<br />
3, and 6. Dynamic pressure transducers were installed in Boxes 2,<br />
3, 4, 5, and 7. These transducers were mounted flush with the tunnel<br />
surface and were <strong>of</strong> a piezoelectric type.<br />
Four transducers were installed in the air slot area in Boxes 8 through 11.<br />
Static LVDT transducers (linear variable differential pressure transducers)<br />
were installed in Boxes 8 and 9. One <strong>of</strong> the differential ports was<br />
sealed, the other was vented to the tunnel interior. The same type<br />
transducers were used with the air velocity probes in Boxes 10 and 11.<br />
Transducers (Nos. 10 and 11) were used to sense the differential on<br />
pitot-static type probes. The probes were located at elevations determined<br />
from the model study to sense the maximum air velocities for spillway<br />
discharges <strong>of</strong> 20,000- (Box 10) and 50,000-ft3/s (Box 11). A detailed<br />
account <strong>of</strong> the instrumentation installation is given in the appendix.<br />
Calibration <strong>of</strong> all pressure transducers was completed prior to installing<br />
them. The pitot-static probes were calibrated in the <strong>Bureau</strong>'s E&R<br />
Center hydraulic laboratory air test facility.<br />
5
Data<br />
Acquisition<br />
The data acquisition system consisted <strong>of</strong>:<br />
-System controller (desktop calculator with disk drives)<br />
-Scanner<br />
-High-speed digital voltmeter<br />
-Anti-aliasing analog filters<br />
-Spectrum analyzer<br />
Sampling and recording <strong>of</strong> the various transducer outputs was controlled<br />
by the desktop calculator through a computer program. The scanner performed<br />
the switching function between transducers. allowing the highspeed<br />
digital voltmeter to measure the different outputs. The analog<br />
filters were used as low pass filters to prevent aliasing <strong>of</strong> digital data<br />
taken at fast rates. The spectrum analyzer was used to obtain frequency<br />
information about the dynamic pressure fluctuations occurring in<br />
the tunnel elbow. All data were recorded on magnetic disks for future<br />
analysis. Figure 2 shows the data acquisition equipment used for the test.<br />
Figure 2. - Data acquisition equipment in the access tunnel.<br />
watertight door leading into spillway tunnel.)<br />
(Note<br />
6
PRETEST<br />
PREPARATION<br />
Several days before the scheduled test program, the data acquisition<br />
system was set up in the access tunnel and the instruments were checked.<br />
In the six weeks following the installation <strong>of</strong> the transducers, water<br />
had infiltrated the conduits and instrument boxes. Consequently,<br />
only two transducers were operating properly. In most cases, water<br />
had created a short circuit in the connector or wire splice. However,<br />
in some <strong>of</strong> the transducers, water had moved up the insulation<br />
<strong>of</strong> the signal wires by capillary action and damaged the internal electronic<br />
circuits.<br />
Because a limited time was available to correct the faulty transducers,<br />
the most important measurements were identified and test priorities<br />
were defined. In the air slot area, all four transducers (Boxes 8-11)<br />
were beyond repair. Only two replacement transducers were available<br />
and they were installed in Boxes 10 and 11 to measure pressures from<br />
the air velocity probes. Boxes 8 and 9 were left open so that water<br />
would be free to drain out <strong>of</strong> the interconnected electrical conduit.<br />
In the tunnel elbow, Boxes 1 through 5 were opened. The dynamic transducers<br />
were removed and dried in an oven overnight' (as suggested by the<br />
manufacturer) before being reconnected. All wires and connectors<br />
were checked for continuity searching for possible shorts and breaks.<br />
Boxes 6 and 7 were left closed since the transducers were operating<br />
properly. A check <strong>of</strong> the repaired instruments showed seven transducers<br />
to be operating: static cells in Boxes 3 and 6; dynamic cells in<br />
Boxes 2, 3, and 7; and the two differential cells on the air velocity<br />
probes in Boxes 10 and 11. Even though several transducers were still<br />
inoperative, the test proceeded on schedule with adequate instrumentation<br />
operational.<br />
7
TESTING<br />
The proposed test program consisted <strong>of</strong> two phases:<br />
Phase 1. - <strong>Test</strong>s at 5,000-, 10,000-, 20,000-, and 50,000-ft3/s<br />
for about an hour each. These tests were proposed to collect data<br />
at a variety <strong>of</strong> flow conditions.<br />
Phase 2. - A continuous operating test at 20,000 ft3/s for 48 hours<br />
including tunnel inspections after 24 hours and at the end <strong>of</strong> test.<br />
This duration at this flow would provide enough exposure to produce<br />
minor cavitation damage if the air slot did not function as expected.<br />
The actual test program was similar to the proposed program. Table<br />
1 shows a synopsis <strong>of</strong> the spillway operation at Glen Canyon Damduring<br />
the test period. Two major differences were implemented: (1) the<br />
addition <strong>of</strong> a test point at a flow <strong>of</strong> 35,000 ft3/s during phase 1,<br />
to gradually decrease the river flow after the 50,000-ft3/s test,<br />
and (2) an additional sixteen hours <strong>of</strong> operation at a flow <strong>of</strong> 20,000 ft3/s<br />
between the 20,000 ft3/s and 50,000 ft3/s test points to increase<br />
the river water temperature gradually and lessen any shock on the<br />
fish downstream.<br />
8
Table 1. - Operation Record - Glen Canyon Dam Left <strong>Spillway</strong> - August 11-17<br />
August 11<br />
August 12<br />
August 13<br />
August 14<br />
August 15<br />
August 16<br />
August 17<br />
7:00 a.m. - 2:00 p.m.<br />
2:00<br />
4:30<br />
p.m.<br />
p.m.<br />
- 4:00 p.m.<br />
6:00 p.m.<br />
7:30 p.m.<br />
Noon<br />
1:00 p.m.<br />
1:30 p.m.<br />
2:00 p.m.<br />
2:15 p.m. - 3:30 p.m.<br />
3:30 p.m. - 5:00 p.m.<br />
5:00 p.m. - 6:00 p.m.<br />
8:15 p.m.<br />
9:15 p.m.<br />
9:15 p.m.<br />
7:00 a.m. - 9:00 a.m.<br />
9:00 a.m. - 5:00 p.m.<br />
5:00 p.m. - 7:00 p.m.<br />
7:15 p.m.<br />
8:15 p.m.<br />
8:15 p.m.<br />
6:00 a.m. - 8:00 a.m.<br />
8:00 a.m. - 11:00 a.m.<br />
10:00 a.m. - 3:00 p.m.<br />
8:00 a.m. - 11:00 a.m.<br />
Inspection <strong>of</strong> left spillway<br />
Removed pumps and access cart<br />
Phase 1 test began<br />
Established flip at 15,000 ft3/s<br />
then immediately reduced<br />
to 6,500 ft3/s<br />
Powerplant discharge 25,000 ft3js<br />
<strong>Spillway</strong> increased to 10,000 ft3/s<br />
<strong>Spillway</strong> increased to 20,000 ft3/s<br />
<strong>Spillway</strong> increased to 50,000 ft3/s,<br />
river outlets opened to release<br />
4,000 ft3/s<br />
Powerplant reduced from 25,000 ft3/s<br />
to 21,000 ft3/s<br />
<strong>Spillway</strong> decreased to 35,000 ft3/s<br />
Powerplant discharge increased<br />
to 25,000 ft3/s<br />
<strong>Spillway</strong> decreased to 20,000 ft3/s<br />
<strong>Spillway</strong> and river outlet closed<br />
Rigged in access cart and pumped out<br />
tunnel<br />
Inspection <strong>of</strong> left spillway<br />
Removed pumps and access cart<br />
Phase 2 test began<br />
Opened spillway gates to 10,000 ft3/s<br />
<strong>Spillway</strong> increased to 20,000 ft3/s<br />
<strong>Spillway</strong> closed, pumped out tunnel<br />
Rigged in access cart<br />
Left spillway inspected<br />
Removed pumps and access cart<br />
Phase 2 test continued<br />
Opened spillway to 10,000 ft3/s<br />
<strong>Spillway</strong> increased to 20,000 ft3/s<br />
<strong>Spillway</strong> closed, pumped out tunnel<br />
Rigged in access cart<br />
Removed instruments at left air slot<br />
Left spillway inspected<br />
Instruments removed from left elbow<br />
9
RESULTS AND DISCUSSION<br />
Air Slot Instrumentation<br />
The average air velocities were measured with the two pitot-static<br />
probes and are shown in table 2.<br />
Table 2. - Average air velocity, V vs. spillway discharge, Q<br />
Discharge Q,ft3/s Air Velocity V, ft/s<br />
Box 10 - Probe 1 Box 11 - Probe 2<br />
6,500<br />
10,000<br />
20,000<br />
35,000<br />
50,000<br />
-*<br />
64.1<br />
124.9<br />
231.8<br />
113.1 247.3<br />
*Denotes a negative differential pressure on the pitot-static probe.<br />
Negative values are possible due to positioning the probes to read<br />
maximum air velocities at 20,000 ft3/s and 50,000 ft3/s.<br />
A comparison <strong>of</strong> these velocities with scaled model values is shown<br />
on figure 3. The single point velocity data can be integrated into<br />
a volumetric flowrate by assuming a velocity distribution in the slot.<br />
A standard logarithmic distribution was assumed along with symmetric<br />
performance <strong>of</strong> the slot. A comparison <strong>of</strong> air demand, for model, prototype,<br />
and computed data is shown on figure 4. It should be noted that<br />
measurements in the model and prototype only reflect air demand passing<br />
through the slot. Additional air is entrained through shear drag on<br />
the free surfaces <strong>of</strong> the jet and at flows below 30,000 ft3/s air may<br />
enter beneath the jet downstream from the slot because the sides <strong>of</strong><br />
the jet are not sealed against the tunnel walls.<br />
10
2Sl.1<br />
GLEN CANYON DAM - LEFT SPILLWAY<br />
AVERAGE AIR VELOCITY IN THE SLOT<br />
211.1<br />
- ~ 1~1<br />
-<br />
><br />
I<br />
-<br />
t-<br />
.....<br />
g<br />
J<br />
L&J<br />
><br />
0:: 1&1<br />
.....<br />
<<br />
~I<br />
ohQ.8WmL<br />
A PROTOTYPE DATA<br />
11<br />
- I - I I<br />
DISCHARGE - Q (ft3/.)<br />
I<br />
I<br />
-Figure 3. - Air velocity measurements in the air slot.<br />
11
Lit<br />
GLEN CANYON DAM - LEFT SPILLWAY<br />
AIR SLOT AIR DEMAND<br />
ill<br />
ill<br />
i71<br />
0 CIIfUTER PlDICTIIW aurAl AIR IBWIJ)<br />
c 1142.8 DE IDE. (AIR U AIR IIJWID<br />
A fIIIJTUTYPE-MIm 1!IU (AIR 9lJT AIR IBWIJ)<br />
to<br />
CD<br />
ill<br />
-+><br />
0<br />
=- CJ<br />
'- .~ i~<br />
0<br />
CJ<br />
J<br />
<<br />
~ i4M<br />
B.JJ<br />
i211<br />
ill<br />
Lit<br />
aD<br />
~ [J<br />
I<br />
£I ~<br />
---a--<br />
I I I I<br />
DISCHARGE - (awater (ft 3/.,<br />
D<br />
I- I-<br />
Figure 4. - Air demand comparison - computed-model-prototype.<br />
12
,..... 25.0<br />
N<br />
C<br />
.- 20.0<br />
'\.<br />
..c<br />
- 15.0<br />
'-'<br />
(J)<br />
Z 10.0<br />
0<br />
..... H<br />
c.1'1<br />
I- a:<br />
5.0<br />
:J<br />
U<br />
:J 0.0<br />
-l<br />
l.L.<br />
W -5.0<br />
~:J<br />
(J)<br />
(J)<br />
W<br />
Q..<br />
-10.0<br />
~-15.0<br />
GLEN CANYON DAM: LEFT SPILLWAY<br />
PROTOTYPE TESTS AUGUST 1984<br />
DYNAMIC PRESSURES @Sta. 24+20<br />
Q=6500 ft3/s<br />
5.0 10.0<br />
15.0<br />
TIME<br />
(s)<br />
Figure 5. - Dynamic pressure fluctuations, Sta. 24+20 (Box 7), Q = 6,500 ft3js.
.....<br />
0'1<br />
,.... 25.8<br />
N<br />
c<br />
.... 28.8<br />
"..a<br />
'-'<br />
15.8<br />
(J)<br />
Z 18.8<br />
0<br />
H<br />
I- 5.8<br />
a:<br />
:J U<br />
:J 8.8<br />
-1<br />
u..<br />
W -5.8<br />
G::<br />
:J<br />
(J) -18.8<br />
(J)<br />
W<br />
~ -15.8<br />
0..<br />
-28.88.8<br />
GLEN CANYON DAM: LEFT SPILLWAY<br />
PROTOTYPE TESTS AUGUST 1984<br />
DYNAMIC PRESSURES @Sta. 24+20<br />
Q=10000 ft3/s<br />
5.8 18.8 15.8<br />
TIME<br />
Figure 6. - Dynamicpressure fluctuations, Sta. 24+20 (Box 7), Q = 10,000 ft3/s<br />
(s)
-<br />
H<br />
,..... 25.0<br />
N<br />
C<br />
''''' 20.0<br />
"..c<br />
- 15.0<br />
'-'<br />
U)<br />
Z 10.0<br />
0<br />
"'-J<br />
I 5.0 ā:<br />
:J<br />
U<br />
:J 0.0<br />
...J<br />
u..<br />
-5.0<br />
W<br />
a:::<br />
:J<br />
U) -10.0<br />
U)<br />
W<br />
a::: -15.0<br />
0..<br />
GLEN CANYON DAM: LEFT SPILLWAY<br />
PROTOTYPE TESTS AUGUST 1984<br />
DYNRMIC PRESSURES @Sta. 24+20<br />
Q=20000 ft 3/s<br />
-20.00.0<br />
5.0 10.0 15.0<br />
TIME (s)<br />
Figure 7. - Dynamic pressure fluctuations, Sta. 24+20 (Box 7), Q = 20,000 ft3/s.
......<br />
co<br />
25.0<br />
r"-.<br />
(\!<br />
c<br />
or- 20.0<br />
"..Q<br />
'-J<br />
15.0<br />
UJ<br />
Z 10.0<br />
0<br />
H<br />
~ 5.0<br />
IT:<br />
::J<br />
U<br />
:3<br />
0.0<br />
l.1.. ! i<br />
! ; i<br />
.<br />
'<br />
I<br />
W -5.0 t-t-t- .!,;! '!<br />
~ -10.0__-t- l l i +- I<br />
H-<br />
UJ I I I I I I<br />
~ -15.8 I I<br />
-20.00.0<br />
GLEN CANYON DAM: LEFT SPILLWAY<br />
PROTOTYPE TESTS RUGUST 1984<br />
DYNRMIC PRESSURES @Sta. 24+20<br />
Q=50000 ft3/s<br />
II<br />
I<br />
L '<br />
H--<br />
I<br />
l<br />
J-I<br />
1~+-+-+-+---1<br />
I<br />
I<br />
I<br />
I<br />
r<br />
I<br />
.<br />
I<br />
I<br />
l-++-1-<br />
~-+-4-<br />
I I I<br />
,I Ii. I I I<br />
TIME (s)<br />
~-l<br />
I<br />
I<br />
I<br />
L-L<br />
I<br />
I<br />
I<br />
:<br />
I<br />
: '<br />
Figure 8. - Dynamicpressure fluctuations, Sta. 24+20 (Box 7), Q = 50,000 ft3/s.<br />
I<br />
I<br />
15.0
.... H<br />
U)<br />
,-.. 25.0<br />
N<br />
C<br />
.- 20.0<br />
".c<br />
- 15.0<br />
'-/<br />
(J)<br />
Z 10.0<br />
0<br />
I- a:<br />
5.0<br />
::J<br />
U<br />
::J 0.0<br />
...J<br />
u..<br />
W -5.0<br />
0::<br />
::J<br />
(J) -10.0<br />
(J)<br />
W<br />
a::: -15.0<br />
a..<br />
GLEN CANYON DAM: LEFT SPILLWAY<br />
PROTOTYPE TESTS RUGUST 1984<br />
DYNRMIC PRESSURES @Sta. 25+80<br />
Q=6500 ft3/s<br />
-20.00.0 5.0 10.0 15.0<br />
TIME (s)<br />
Figure 9. - Dynamic pressure fluctuations, Sta. 25+80 (Box 3), Q = 6,500 ft3/s.
N<br />
,.... 25.0<br />
N<br />
c:<br />
.... 20.0<br />
"..c<br />
-<br />
15.0<br />
(f)<br />
Z 10.0<br />
0<br />
H<br />
0<br />
f-<br />
a:<br />
5.0<br />
::J<br />
U<br />
:J 0.0<br />
-1 La...<br />
W -5.0<br />
G::<br />
:J<br />
(f) -10.0<br />
(f)<br />
W G:: -15.0<br />
a..<br />
GLEN CANYON DAM: LEFT SPILLWAY<br />
PROTOTYPE TESTS AUGUST 1984<br />
DYNAMIC PRESSURES @Sta. 25+80<br />
Q=10000 ft3/s<br />
-20.00.0 5.0 10.0 15.0<br />
TIME (s)<br />
Figure 10. - Dynamic pressure fluctuations, Sta. 25+80 (Box 3), Q = 10,000 ft3/s.
,.... 25.0<br />
N<br />
C<br />
.....<br />
'-<br />
..Q<br />
20.0<br />
GLEN CANYON DAM: LEFT SPILLWAY<br />
PROTOTYPE TESTS RUGUST 1984<br />
DYNRMIC PRESSURES @St a. 25+80<br />
Q=20000 ft 3/s<br />
'\.J<br />
15.0<br />
N<br />
......<br />
(J)<br />
Z 10.0<br />
0<br />
H<br />
I-<br />
a:<br />
5.0<br />
::J<br />
U<br />
::J 0.0<br />
-1<br />
u...<br />
-5.0<br />
W<br />
a::<br />
::J<br />
(J) -10.0<br />
(J)<br />
w<br />
a:: -15.0<br />
CL<br />
TIME<br />
(s)<br />
10.0 15.0<br />
Figure 11. - Dynamic pressure fluctuations, Sta. 25+80 (Box 3), Q = 20,000 ft3/s.
N<br />
N<br />
.--.. 25.0<br />
("\l<br />
C<br />
....<br />
'\.<br />
-C<br />
20.0<br />
'-J 15.0<br />
(f)<br />
~ 10.0<br />
H<br />
I- a: 5.0<br />
I-<br />
:J<br />
U 0.0<br />
:J<br />
-.J<br />
u..<br />
-5.0<br />
W<br />
a::<br />
:J -10.0<br />
(f)<br />
(f)<br />
W<br />
a:: -15.0<br />
a..<br />
-20.00.0<br />
GLEN CANYON DAM: LEFT SPILLWAY<br />
PROTOTYPE TESTS AUGUST 1984<br />
DYNAMIC PRESSURES @Sta. 25+80<br />
Q=35000 ft3/s<br />
5.0 10.0 15.0<br />
TIME<br />
Figure 12. - Dynamic pressure fluctuations, Sta. 25+80 (Box 3), Q = 35,000 ft3/s.<br />
(s)
N<br />
w<br />
,... 25.8<br />
N<br />
c:<br />
.- 28.8<br />
"..a<br />
- 15.8<br />
....,<br />
(J)<br />
Z 18.8<br />
0<br />
H<br />
t-<br />
a:<br />
5.8<br />
:J U<br />
:J 8.8<br />
GLEN CANYON DAM: LEFT SPILLWAY<br />
PROTOTYPE TESTS RUGUST 1984<br />
DYNRMIC PRESSURES @Sta. 25+80<br />
Q=50000 ft 3/s<br />
..J<br />
l.L<br />
W -5.8<br />
~:J -18.8 (J)<br />
(J)<br />
W<br />
~-15.8<br />
CL<br />
-28.88.8 S.8 18.8 15.8<br />
TIME (s)<br />
Figure 13. - Dynamic pressure fluctuations, Sta. 25+80 (Box 3), Q = 50,000 ft3/s.
N<br />
,-,. 25.0<br />
N<br />
c::<br />
.,.. 20.0<br />
".0<br />
-- 15.0<br />
'-J<br />
U")<br />
Z 10.0<br />
O<br />
H<br />
~ta:<br />
5.0<br />
:J U<br />
:J 0.0<br />
GLEN CANYON DAM: LEFT SPILLWAY<br />
PROTOTYPE TESTS RUGUST 1984<br />
DYNRMIC PRESSURES @Sta. 26+20<br />
Q=6500 ft3/s<br />
I I<br />
i<br />
+- 1 - -.<br />
j<br />
I<br />
I<br />
-<br />
I<br />
L I--<br />
I -<br />
--' u..<br />
W -5.0<br />
~:J<br />
U")<br />
U")<br />
-10.0<br />
W<br />
CL ~-15.0<br />
I<br />
I<br />
I<br />
---+ t-II<br />
-1-<br />
I<br />
t<br />
I<br />
!<br />
!<br />
t-I<br />
i<br />
-20.00.0<br />
5.0<br />
10.0 15.0<br />
TIME<br />
Figure 14. - Dynamic pressure fluctuations, Sta. 26+20 (Box 2), Q = 6,500 ft3/s.<br />
(s)
N<br />
(J"1<br />
,.....<br />
N<br />
C<br />
'''- 20.0<br />
"..0<br />
'-'<br />
15.0<br />
(j)<br />
Z 10.0<br />
0<br />
H<br />
I-<br />
5.0<br />
cr:<br />
:.J<br />
U<br />
:.J 0.0<br />
..J<br />
u..<br />
-5.0<br />
W<br />
0=:<br />
:.J<br />
(j) -10.0<br />
(j)<br />
W<br />
0=: -15.0<br />
CL<br />
GLEN CANYON DAM: LEFT SPILLWAY<br />
PROTOTYPE TESTS RUGUST 1984<br />
DYNRMIC PRESSURES @Sta. 26+20<br />
Q=10000 ft3/s<br />
-20.00.0 5.0 10.0 15.0<br />
TIME (s)<br />
Figure 15. - Dynamic pressure fluctuations, Sta. 26+20 (Box 2), Q = 10,000 ft3/s.
I\)<br />
0\<br />
,... 25.B<br />
N<br />
C<br />
.- 2B.B<br />
'\.<br />
..c<br />
-<br />
15.B<br />
U)<br />
Z<br />
0<br />
H<br />
IB.B<br />
GLEN CANYON DAM: LEFT SPILLWAY<br />
PROTOTYPE TESTS AUGUST 1984<br />
DYNAMIC PRESSURES @Sta. 26+20<br />
Q=20000 ft3/s<br />
I-<br />
a:<br />
S.B<br />
:J<br />
U :J B.B<br />
...J<br />
u..<br />
W -5.B<br />
~:J<br />
U) :IB.B<br />
!-1<br />
U)<br />
w ~-15.B<br />
Cl..<br />
-2B.BB.B 5.B IB.B<br />
TIME (s)<br />
Figure 16. - Dynamic pressure fluctuations, Sta. 26+20 (Box 2), Q = 20,000 ft3/s.
N<br />
......<br />
,.... 25.0<br />
N<br />
C<br />
.... 20.0<br />
"..a<br />
-<br />
15.0<br />
(J)<br />
Z 10.0<br />
0<br />
H<br />
r-<br />
a:<br />
5.0<br />
:J<br />
U<br />
:J 0.0<br />
-1<br />
u..<br />
W -5.0<br />
~:J<br />
(J) -10.0<br />
(J)<br />
W<br />
~-15.0<br />
a..<br />
GLEN CANYON DAM: LEFT SPILLWAY<br />
PROTOTYPE TESTS RUGUST 1984<br />
DYNRMIC PRESSURES @Sta. 26+20<br />
Q=35000 ft3/s<br />
-20.00.0 5.0 10.0 15.0<br />
TIME (s)<br />
Figure 17. - Dynamic pressure fluctuations, Sta. 26+20 (Box 2), Q = 35,000 ft3/s.
,-.. 25.0<br />
GLEN CANYON DAM: LEFT SPILLWAY<br />
PROTOTYPE TESTS AUGUST 1984<br />
DYNAMIC PRESSURES @Sta. 26+20<br />
Q=50000 ft 3/s<br />
('-I<br />
C<br />
''- 20.0<br />
"..c<br />
N<br />
00 H<br />
r-<br />
15.0<br />
'-'<br />
(J)<br />
Z 10.0<br />
0<br />
a:<br />
5.0<br />
:J<br />
U<br />
:J 0.0<br />
-.J<br />
La...<br />
-5.0<br />
W<br />
~:J<br />
(J) -10.0<br />
(J)<br />
W<br />
~-15.0<br />
a..<br />
-20.00.0 5.0 10.0 15.0<br />
TIME (s)<br />
Figure 18. - Dynamic pressure fluctuations, Sta. 26+20 (Box 2), Q = 50,000 ft3/s.
GLEN CRNYON DRM<br />
LEFT SPILLWRY Sta. 24+20<br />
N<br />
\0<br />
W<br />
Q<br />
~ .8<br />
H<br />
I<br />
0-<br />
E<br />
a:<br />
.6<br />
Q<br />
w<br />
N<br />
H<br />
I<br />
a:<br />
.4<br />
~ .2<br />
0<br />
z<br />
1<br />
(2)<br />
(S)<br />
(S)<br />
If')<br />
(S)<br />
(S)<br />
FREQUENCY<br />
(S)<br />
If')<br />
-" -"<br />
(Hz)<br />
(S)<br />
(S)<br />
('\J<br />
U>0'<br />
~~ e~<br />
(S) /~ \9~ \9,?>I ~"")<br />
If') \9~ \9 ~<br />
('\J<br />
\9<br />
S(.<br />
Figure 19. - Energy spectrums <strong>of</strong> dynamic pressure fluctuations at Sta. 25+80 (Box 7),<br />
for flows <strong>of</strong> 10,000, 20,000, and 35,000 ft3/s.<br />
0.
25.8<br />
GLEN CANYON DAM<br />
LEFT<br />
SPILLWAY<br />
0<br />
.<br />
STA 25+88 - MODEL DATA<br />
STA 25+88 - PROTOTYPE DATA<br />
A<br />
STA 24+68 - MODEL DATA<br />
2B.B<br />
... STA 24+68 - PROTOTYPE DATA<br />
~ c:<br />
....<br />
.......<br />
...a<br />
-,<br />
c.. 15.8<br />
I<br />
IJJ<br />
a:::<br />
::3 (J)<br />
(J)<br />
IJJ<br />
a:::<br />
c..<br />
ụ ....<br />
I-<br />
~ 118<br />
(J)<br />
IJJ<br />
to:)<br />
a:::<br />
<<br />
IJJ<br />
><br />
<<br />
5.8<br />
18<br />
..<br />
I -<br />
I<br />
DISCHARGE<br />
I<br />
I<br />
- Q (ft3/e)<br />
Figure 20. - Model-prototype comparison <strong>of</strong> static pressures at sta. 24+60 (Box 6),<br />
and Sta. 25+80 (Box 3).<br />
30<br />
I<br />
I<br />
I<br />
I
Both methods yielded similar results. The spectrum analyzer was capable<br />
<strong>of</strong> covering a frequency range up to 25 kHz, while the digital data<br />
allowed frequency analysis only up to 250 Hz. The major energy in<br />
the frequency spectrum occurred below 100 Hz as shown on figure 21;<br />
this is FFT data from digital recordings (Refer to figure 19 for a<br />
similar plot <strong>of</strong> spectrum analyzer data.). Correlation between model<br />
and prototype dynamic pressure fluctuations was not found. Frequency<br />
appears to function as a dependant variable; therefore, it does not<br />
allow separate scaling <strong>of</strong> the fluctuation amplitudes. The model spectrums<br />
show major spectral power caused by bubble noise which does not<br />
show up in the prototype.<br />
OBSERVATIONS<br />
A great deal also was learned from observing the flow and inspecting<br />
the tunnel surfaces. Flow observations tend to be subjective, but<br />
in comparison with the left spillway flows during 1983 many observers<br />
agreed that the tunnel outflow appeared to have much more air. The<br />
test flows entrained more air and did not flip into the river as far<br />
as similar spills prior to air slot construction. However, the main<br />
observations used to evaluate the air slots' effectiveness were the<br />
tunnel inspections performed throughout the test sequence. These observations<br />
did not show cavitation damage. Construction techniques resulted<br />
in some concrete IpOpouts" and minor surface damage. However, these<br />
did not grow appreciably during extended operation, indicating that<br />
with known <strong>of</strong>fsets into and away from the flow, cavitation damage did<br />
not occur. Past experience shows cavitation damage can be expressed<br />
in terms <strong>of</strong> a cavitation damage index [4J. The following is a comparison<br />
<strong>of</strong> cavitation damage indexes caused by previous flows in the Glen Canyon<br />
Dam left spillway to those during this test (1984):<br />
31
GLEN CRNYON DRM<br />
LEFT SPILLWRY Sta. 24+20<br />
1<br />
w ~~<br />
H<br />
.8<br />
a...<br />
--'<br />
L .6<br />
a:<br />
W<br />
N<br />
~ w<br />
N .4<br />
H<br />
--' a:<br />
~ .2<br />
0<br />
z<br />
0<br />
IS)<br />
IS)<br />
If)<br />
IS)<br />
IS)<br />
IS)<br />
If)<br />
....... .......<br />
FREQUENCY<br />
(Hz)<br />
IS)<br />
IS)<br />
C\J<br />
~<br />
O"~<br />
~ 9~<br />
1S)9 ~ C99 '?>/~)<br />
If) ~9 ~<br />
C\J l~<br />
0<br />
Figure 21. - Prototype frequency spectrums (by FFT) <strong>of</strong> dynamic pressure fluctuations<br />
at Sta. 24+20 (Box?).<br />
~~<br />
C9
1981 - 1/2-in high <strong>of</strong>fsets at Sta.<br />
Damage index 13,100<br />
1983 - 1/2-in high <strong>of</strong>fsets at Sta.<br />
Damage index 21,500<br />
1984 - 1/2-in high <strong>of</strong>fsets at Sta.<br />
Damage index 17,800<br />
- 1/2-in high <strong>of</strong>fsets at Sta.<br />
Damage index 23,500<br />
24+25 caused 1/2-in deep holes<br />
24 + 12 caused 3-ft deep holes<br />
24+50 did not cause damage<br />
26+25 did not cause damage<br />
The air slot addition was the only modification to the spillway structure<br />
in 1984. The fact that cavitation damage did not occur during the<br />
1984 test can be tied directly to the new air slot.<br />
33
CONCLVSIONS<br />
Evaluation <strong>of</strong> all prototype data indicates that the air slot operates<br />
satisfactorily. Cavitation damage was not observed and measurements<br />
<strong>of</strong> air demand and pressures (static and dynamic) support this finding.<br />
Many parameters are still under investigation in the <strong>Bureau</strong>'s E&RCenter<br />
Hydraulics Branch which will provide additional information about the<br />
air slot design. Both model and prototype data from Glen Canyon Dam<br />
are being used, as well as model data from Blue Mesa Damand Hoover<br />
Dam. Items currently under study are:<br />
1. Further analysis <strong>of</strong> dynamic pressure fluctuations. USBR Program<br />
Related Engineering and Scientific Studies Project No. DR-458<br />
- Scaling <strong>of</strong> Dynamic Pressures.<br />
2. Measurement <strong>of</strong> the model velocity distribution in the air<br />
slot with the laser-doppler velocimeter.<br />
3. <strong>Test</strong>ing in the <strong>Bureau</strong>'s low ambient pressure chamber <strong>of</strong> <strong>of</strong>fsets<br />
which were cast from "popouts" and joint misalignments in the<br />
Glen Canyon left spillway during the testing. These tests will<br />
show if damage could have been incurred without the addition <strong>of</strong><br />
air through the slot.<br />
4. Development <strong>of</strong> an air concentration probe for future use in<br />
model and prototype tests.<br />
34
BIBLIOGRAPHY<br />
[1] Burgi, P. J., B. M. Moyes, and T. W. Gamble, "Operation <strong>of</strong> Glen<br />
Canyon Dam <strong>Spillway</strong>s - Summer1983," Proceedings <strong>of</strong> the Conference,<br />
Water for Resource Development, ASCEHydraulic Division Specialty<br />
Conference, page 260, August 14-17, 1984.<br />
[2] Pugh, C. A.,"Modeling Aeration Devices for Glen Canyon Dam." Proceedings<br />
<strong>of</strong> the Conference, Water for Resource Development, ASCEHydraulics<br />
Division Specialty Conference, page 412, August 14-17, 1984.<br />
[3] Pinto, Nelson L. de S., and Sinildo H. Neidert, "Model Prototype<br />
Conformity in Aerated <strong>Spillway</strong> Flow," International Conference on<br />
Hydraulic Modeling <strong>of</strong> Civil Engineering Structures, BHRAFluid Engineering,<br />
Paper E.6, pp 22-24.09.83, Coventry, England, 1983.<br />
[4] Falvey, H. T., "Monograph on Cavitation," <strong>Bureau</strong> <strong>of</strong> <strong>Reclamation</strong>,<br />
Denver, Colo., unpublished.<br />
35
APPENDIX
BUREAU<br />
OF RECLAMATION<br />
Engineering and Research Center<br />
Denver. Colorado<br />
TRAVEL<br />
REPORT<br />
Code : D-1532 Date: July 12. 1984<br />
To : Chief. Division <strong>of</strong> Research and Laboratory Services<br />
From<br />
: K. Warren Frizell and Lee E. Elgin<br />
Subject: Instrumentation Instal)ation in the Left <strong>Spillway</strong> <strong>of</strong> Glen Canyon<br />
Dam<br />
1. Travel period (dated): June 14. 1984 - June 27. 1984.<br />
2. Places or <strong>of</strong>fices visited: Glen Canyon Dam. Page Arizona.<br />
3. Purpose <strong>of</strong> trip: To install pressure transducers and air velocity<br />
probes in the modified left spillway <strong>of</strong> Glen Canyon Damfor future testing.<br />
4. Synopsis <strong>of</strong> trip: Wedeparted the Denver Federal Center in a Government<br />
van and arrived at Glen Canyon Damon June 15. 1984. We carried down the<br />
equipment necessary to install instrumentation in the left spillway and<br />
also took all our computerized data acquisition equipment. After talking<br />
with Jack Tyler. the Construction Engineer. and finding out that the tests<br />
would not be run until mid-July at the earliest, we stored our data acquisition<br />
equipment in the <strong>Bureau</strong> warehouse in Page and proceeded to get on with<br />
the installation <strong>of</strong> the instrumentation. Wediscussed our plans with Art<br />
Graff. the Field Engineer. and with Dave Deacon and Jim Landreath <strong>of</strong><br />
Newberry Industrial. the electrical subcontractor. We took a look at<br />
instrument boxes 1-7, and talked about the pulling <strong>of</strong> the signal wires and<br />
what type <strong>of</strong> water diversion we would need for the installation.<br />
On June 16. the electricians pulled the signal wires into instrument<br />
boxes 1-7. Two wires were pulled into each box; a RG59 coaxial cable, and a<br />
4-conductor shielded cable. Water diverters had been installed upstream <strong>of</strong><br />
each box. and small grout dams were placed around the boxes as well. This<br />
system kept the boxes and conduit from filling with water while the pulling<br />
<strong>of</strong> wire and instrument installation took place. Before the electrical<br />
connections <strong>of</strong> the transducers were made. each wire was rung out with voice<br />
powered telephones to check on continuity and make proper identification.<br />
The transducers had been mounted onto their appropriate cover plates so<br />
i~stallation simply required soldering the electrical connections. covering<br />
the connections with heat shrink material. and then putting the cover<br />
plate back into place. Before the plates were screwed down into their<br />
frames. new O-rings greased with No.2 permatex were installed and duct<br />
tape was placed over the exposed transducer diaphragms. The installations<br />
started at box 7 and proceeded downstream to box 1.<br />
39
Travelers: K. Warren Frizell and Lee E. "Elgin<br />
Page 2<br />
Date: July 12, 1984<br />
On June 18, we contacted Richard Fehr, a mechanical engineer out <strong>of</strong> the O&M<br />
<strong>of</strong>fice about possibly using a barometer during the upcoming tests. He<br />
said we could use the one in his <strong>of</strong>fice any time we needed it. Wealso<br />
spoke to him about making some vibration measurements on the hollow-jet<br />
conduits. He said it would be fine and he wo~ld be interested in any<br />
results we might come up with. Later that day we picked up Dave Mayturn,<br />
D-254, and Randy Brammer, D-1543, at the Page airport. They had come down<br />
to install strain gages on the radial gate arms so they can evaluate the<br />
pin moment as the gates are raised.<br />
We took vibration measurements on the hollow-jet conduits on June 19.<br />
Several positions for taking measurements had been located on each <strong>of</strong> the<br />
four conduits. The measurements were made with a Dymacportable vibration<br />
meter and a spectrum analyzer. As the accelerometer was held onto the<br />
conduits at each <strong>of</strong> the predetermined locations, displacement and acceleration<br />
readings from the Dymacmeter were recorded and the major frequencies<br />
<strong>of</strong> the vibration was noted from the spectrum analyzer. The noise caused by<br />
the vibration lead us to think that conduits 1 and 2 were vibrating more<br />
than conduits 3 and 4; however, this difference in noise level appears to<br />
be only a function <strong>of</strong> the size <strong>of</strong> the vaults that each pair <strong>of</strong> conduits<br />
run through.<br />
On June 20, the electricians pulled four, 4-conductor shielded cables up<br />
to the air slot and into box 11. Box 9, located on the tunnel centerline<br />
was inaccessible (underneath the man-car ramp) so the wire pull could not<br />
be completed The jumbo was then moved back down the tunnel into the elbow<br />
to allow workers to dress some epoxy patches which were unacceptable.<br />
Tom Friedman <strong>of</strong> the Upper Colorado Public Affairs Office was down on June 21<br />
and took some movie footage <strong>of</strong> our instrument boxes in the lower tunnel.<br />
He said he would make arrangements to get some more footage <strong>of</strong> our equipment<br />
at the time <strong>of</strong> the test.<br />
On June 23, whi1e still waiting for the jumbo to return up to the ai r slot<br />
area, we talked with Jack Tyler about installation <strong>of</strong> the air velocity<br />
probes. He had concerns that they were not sturdy enough to hold up<br />
throughout the test and asked us to investigate possible methods to strengthen<br />
the installation. We talked with one <strong>of</strong> the contractor's mechanics and had<br />
a new anchor plate and connecting arrangement made for both probes.<br />
However, after talking to Cliff Pugh, D-1531, it was decided not to add any<br />
further structure to the probes as it would tend to bring the natural<br />
frequency <strong>of</strong> the probes closer to the vortex shedding frequency that is<br />
expected. The idea is to separate these two frequencies as far as possible<br />
to prevent lock;n at the resonant frequency and sure destruction <strong>of</strong> the<br />
probes.<br />
On June 25, we installed the remaining four instruments into the air slot<br />
area. The wires were pulled just ahead <strong>of</strong> each installation. The area was<br />
very wet, but the water control around our instrument boxes was adequate<br />
40
Page 3<br />
Travelers: K. Warren Frizell and Lee E. Elgin<br />
Date: July 12, 1984<br />
considering these conditions. We began installing at box 11. Air probe II<br />
was located in this box, and we experienced some problems with a11nement<br />
<strong>of</strong> the probe. The anchor plate had to be relocated to remove stress from<br />
the turnbuckle connection. The installation <strong>of</strong> air probe I in box 10 went<br />
smoother, and no problems were experienced. The jumbo was lowered down to<br />
box 8 to aid installation. A static pressure transducer was installed in<br />
this location. Then the jumbo was moved back up and a static pressure<br />
transducer was installed in box 9. All connections and fastening down <strong>of</strong><br />
the cover plates was done in the same manner as with boxes 1-7, discussed<br />
previ ously.<br />
We departed Glen Canyon Damon June 26 in a Government van and returned to<br />
the Denver Federal Center June 27.<br />
5. Conclusions:<br />
a. Installation <strong>of</strong> all instruments was completed successfully.<br />
b. At least 3 days will be required prior to testing to set up data<br />
acquisition equipment and connect instruments.<br />
c. Arrangements were made for associated items we will need during<br />
testings; tables, chairs, power, lighting, etc.<br />
d. Photographs <strong>of</strong> instrumentation and installation are included in the<br />
appendix.<br />
e. Vibration measurements taken on the hollow-jet conduits are being<br />
analyzed and a memorandumsummarizing the results will follow.<br />
f. We appreciate the support and coordination <strong>of</strong>fered to us by the Glen<br />
Canyon <strong>Spillway</strong> Repair Construction Office and the help <strong>of</strong> G. F. Atkinson<br />
and NewberryIndustrial personnel.<br />
~~~~~<br />
KL:~,<br />
Enclosures<br />
Copy to: Regional Director, Salt Lake City, Utah, Attention:<br />
Construction Engineer, Page, Arizona<br />
Power Operations Manager, Page, Arizona<br />
UC-100<br />
f/~.,<br />
Blind to: D-200<br />
D-210<br />
D-220<br />
D-1500<br />
D-1530<br />
vD~1.531 (fi 1e)<br />
D-1532<br />
KWFrizell:flh<br />
41<br />
~<br />
JU}7 0 19&1<br />
c"'<br />
}( t:Ja1f~-<br />
- ~~<br />
.<br />
C' i<br />
'--f':'~:'" vi I:~csea\'ch<br />
.~';';e J v\. ~ "..d) .<br />
~C.\\~\) and l"ba~ato,~ Services<br />
~
(a) Front face with tap.<br />
(b) Rear face with transducer and wiring.<br />
Figure 10 - Kulite absolute pressure cell, installed in boxes 1 and 6.<br />
42
(a) Front face with static tap and dynamic flushmount.<br />
(b) Rear face with transducer connections.<br />
Figure 2. - Kistler dynamic pressure cells and Kulite static cells<br />
mounted side by side, installed in boxes 2 and 3.<br />
43
(a) Kistler flushmount dynamic cell, front faceo<br />
(b) Transducer mounting and body.<br />
Figure 3. - Kistler dynamic pressure cell, installed in boxes 4,5, and 7.<br />
44
(a) Front face, air pressure transducer tape<br />
(b) Shaevitz differential pressure cell body and wiring.<br />
Figure 4. - Schaevitz differential pressure transducer, installed in<br />
boxes 8 and 9.<br />
45
Figure 5. - Air velocity probe using Schaevitz differential pressure cell,<br />
mounted in boxes 10 and 11.<br />
46
(a) Boxes 1-7 with water diversion structures in placeo<br />
(b) Typical installation.<br />
Figure 60 - Boxes 1-7 in lower elbow and horizontal tunnel section <strong>of</strong><br />
left spillway.<br />
47
(a) Air slot and probe locations from jumbo deck.<br />
(b) Installing air probe II in box 110<br />
Figure 7. - Air velocity probe installation.<br />
48
.<br />
(c) Drilling for anchoring <strong>of</strong> probeso<br />
(d) View <strong>of</strong> two probes, installation completeo<br />
Figure<br />
70 - (continuedo)<br />
49
(a) Water diverter being placed for installation <strong>of</strong> box 80<br />
(b) Signal wire being connected to transducer, box 8.<br />
Figure 8. - Installation <strong>of</strong> static pressure transducer in box 80<br />
50
(c) Tightening cover plate to box frameo<br />
(d) View on finished installation, box 80<br />
Figure 8. - (continued)<br />
51
(a) Pulling signal wire into box 9.<br />
(b) Wiring and installing pressure transducer.<br />
Figure 9. - Installation <strong>of</strong> static pressure transducer in box 9, air slot.<br />
52<br />
GPO 846-977
Mission <strong>of</strong> the <strong>Bureau</strong> <strong>of</strong> <strong>Reclamation</strong><br />
The <strong>Bureau</strong> <strong>of</strong> <strong>Reclamation</strong> <strong>of</strong> the US. Department <strong>of</strong> the Interior is<br />
responsible for the development and conservation <strong>of</strong> the Nation's<br />
water resources in the Western United States.<br />
The <strong>Bureau</strong>'s original purpose "to provide for the reclamation <strong>of</strong> arid<br />
and semiarid lands in the West" today covers a wide range <strong>of</strong> interrelated<br />
functions These include providing municipal and industrial water<br />
supplies; hydroelectric powr meretion; irrigation water for agriculture;<br />
water quality improvement; flood control; river navigation;<br />
river regulation and control; fish and wildlife enhancement; outdoor<br />
recreation; and research on water-related &sign, construction, materials,<br />
atmovheric management, and wind and solar power.<br />
<strong>Bureau</strong> programs rndst frequently are the result <strong>of</strong> close cooperation<br />
with the U.S. Congress, other Federal agencies, States, local governments,<br />
academic institutions, water-user organizations, and other<br />
concerned groups<br />
A free pamphlet is available from the <strong>Bureau</strong> entitled, "Publications<br />
for Sale". It describes some <strong>of</strong> the technical publications currently<br />
available, their cost, and how to order them. The pamphlet can be<br />
obtained upon request from the <strong>Bureau</strong> <strong>of</strong> <strong>Reclamation</strong>, Attn 0-922,<br />
P 0 Box 25007, Denver Federal Center, Denver CO 80225-0007.