2011 Citizen Survey - Roanoke
2011 Citizen Survey - Roanoke
2011 Citizen Survey - Roanoke

You also want an ePaper? Increase the reach of your titles
YUMPU automatically turns print PDFs into web optimized ePapers that Google loves.
City of <strong>Roanoke</strong><br />
<strong>2011</strong> <strong>Citizen</strong>s <strong>Survey</strong><br />
Summary of Results<br />
Prepared by:<br />
The Virginia Tech Center for <strong>Survey</strong> Research<br />
January 2012
Table of Contents<br />
Section Title<br />
Page Number<br />
Introduction 1<br />
1 Methodology 2<br />
2 Respondent Demographic Profile 7<br />
3 Quality of Life and Selected Issues 8<br />
4 City of <strong>Roanoke</strong> Services 12<br />
5 Perceptions of Safety 16<br />
6 Customer Service 18<br />
7 City Government Communication With <strong>Citizen</strong>s 20<br />
8 Data Storage 22<br />
Appendix A<br />
Appendix B<br />
Appendix C<br />
Appendix D<br />
<strong>2011</strong> <strong>Survey</strong> Instrument<br />
Response Frequencies For Close-ended <strong>Survey</strong> Items<br />
Response Frequencies of City Service Items Tabulated Excluding<br />
Responses of “Not Familiar With Service” and “Don‟t Know”<br />
Responses For Open-ended <strong>Survey</strong> Items
CSR<br />
Virginia Tech Center for <strong>Survey</strong> Research<br />
Introduction<br />
The Virginia Tech Center for <strong>Survey</strong> Research (CSR) has conducted citizens surveys<br />
periodically with the citizens of the City of <strong>Roanoke</strong> since the year 2000. The series of<br />
telephone surveys was designed to measure citizen opinions regarding municipal services and<br />
projects and to assess the strategic initiatives of the City of <strong>Roanoke</strong> government. Although<br />
different survey instruments were used each year for the survey administration, the surveys were<br />
designed such that comparability in citizen ratings of services and initiatives was possible across<br />
years. The overall objective of the survey process is to garner public input that will guide the use<br />
of City resources and foster continual improvement in the services provided to citizens.<br />
Presentations of the results from the survey are made by CSR in each survey year to groups such<br />
as the <strong>Roanoke</strong> City Council and the City of <strong>Roanoke</strong> Department Leadership Team.<br />
For the administration of the <strong>2011</strong> <strong>Roanoke</strong> <strong>Citizen</strong>s <strong>Survey</strong>, the CSR conducted a<br />
telephone survey of 600 residents of the City of <strong>Roanoke</strong>. This report summarizes the data<br />
collection procedures and results of the <strong>2011</strong> survey. Section 1 provides an overview of the<br />
survey instrument development and data collection procedures utilized by the CSR for the<br />
collection of the data. Section 2 provides a demographic profile of the survey respondents.<br />
Section 3 provides the findings from the <strong>2011</strong> survey for a variety of City issues and a<br />
comparison of the <strong>2011</strong> results from the survey on these items to the survey results from<br />
previous years. Section 4 provides an overview of findings related to City services along with<br />
1<br />
City of <strong>Roanoke</strong> <strong>2011</strong> <strong>Citizen</strong> <strong>Survey</strong><br />
Summary of Results
CSR<br />
Virginia Tech Center for <strong>Survey</strong> Research<br />
comparisons between the <strong>2011</strong> findings related to City services with those from previous survey<br />
years. Section 5 includes the survey findings related to survey respondent feelings of safety in<br />
the City. Section 6 provides an overview of findings regarding City of <strong>Roanoke</strong> government<br />
employee customer service. Section 7 provides the survey findings related to government<br />
communication with citizens. Section 8 includes a statement about data storage for the project.<br />
The <strong>2011</strong> survey instrument is included in Appendix A. Appendix B provides tables of<br />
response frequencies to all close-ended survey items. Appendix C provides response frequencies<br />
of the City service rating items re-tabulated to exclude responses of “not familiar with service”<br />
and “don‟t know.” Appendix D lists all responses provided by respondents to open-ended survey<br />
questions.<br />
1<br />
Methodology<br />
Sampling and <strong>Survey</strong> Instrument Design<br />
A random-digit dialing (RDD) method was employed by the CSR for the administration<br />
of the <strong>2011</strong> survey. Both listed and unlisted telephone numbers were included in the sample for<br />
this project. Cellular numbers were also included in the random sample for the study. CSR<br />
worked with <strong>Survey</strong> Sampling International of Fairfield, CT, to define the parameters of the<br />
2<br />
City of <strong>Roanoke</strong> <strong>2011</strong> <strong>Citizen</strong> <strong>Survey</strong><br />
Summary of Results
CSR<br />
Virginia Tech Center for <strong>Survey</strong> Research<br />
sample. The survey sample was randomly generated from numbers available to City of <strong>Roanoke</strong><br />
residents. Because some exchanges border areas outside the City of <strong>Roanoke</strong> and because<br />
survey respondents sometimes report residing in a neighboring geographic area to the target area,<br />
a screener question was also included in the survey. The screener question confirmed City of<br />
<strong>Roanoke</strong> residence prior to beginning the survey with a potential respondent. Sample members<br />
reporting residence in a locality other than the City of <strong>Roanoke</strong> were eliminated from the eligible<br />
sample pool for calling. There were 1,604 sample members with this final call disposition code.<br />
Based on a total of 600 completed interviews, the survey has a sampling error of<br />
±3.8 percent. Therefore, in 95 out of 100 surveys completed with this number of interviews<br />
using the same sampling methodology and parameters, the results obtained would fall in a range<br />
of ±3.8 percent of the results that would be achieved if interviews were completed with every<br />
potential respondent (in households with working land or cellular telephones) residing in the City<br />
of <strong>Roanoke</strong>. Smaller sampling errors are present for items on which there is polarized response<br />
(e.g. 90 percent identical response on an item).<br />
While the <strong>2011</strong> survey instrument is based on the surveys used in previous years, the City<br />
elected to add survey items regarding the level of perceived importance of each City service in<br />
the survey this year. The addition of these survey items allows for a comparison of service<br />
ratings compared with the perceived level of importance of each service among citizens.<br />
3<br />
City of <strong>Roanoke</strong> <strong>2011</strong> <strong>Citizen</strong> <strong>Survey</strong><br />
Summary of Results
CSR<br />
Virginia Tech Center for <strong>Survey</strong> Research<br />
Data Collection Procedures<br />
All telephone calls for the survey were made by CSR staff members utilizing a<br />
Computer-Assisted Telephone Interviewing (CATI) system at the Blacksburg, Virginia location<br />
of the Virginia Tech Center for <strong>Survey</strong> Research. All calls were made during the period between<br />
October 14, <strong>2011</strong> through November 8, <strong>2011</strong>. CSR wrote a calling program to be used with<br />
CATI for administering the <strong>2011</strong> City of <strong>Roanoke</strong> <strong>Citizen</strong>s <strong>Survey</strong>. The program provides<br />
scripted survey items, precludes out of range responses and facilitates real-time data entry of all<br />
responses gathered on the telephone.<br />
Each interviewer collecting data for the survey project participated in a project-specific<br />
training session for the project. All interviewers working on the project have worked on a<br />
variety of survey projects (indeed, some of the interviewers for this survey worked on<br />
administrations of the City of <strong>Roanoke</strong> survey in previous years) and have participated in<br />
multiple training sessions in both interviewing techniques and CATI. All interviews were<br />
monitored by a CSR Call Center Supervisor in order to ensure accuracy and proper interviewing<br />
protocol. Clarifying notes for specific survey items appeared on the CATI screens for<br />
interviewers to ensure that identical prompts were used for respondents requesting additional<br />
information about survey items or response categories.<br />
4<br />
City of <strong>Roanoke</strong> <strong>2011</strong> <strong>Citizen</strong> <strong>Survey</strong><br />
Summary of Results
CSR<br />
Virginia Tech Center for <strong>Survey</strong> Research<br />
CSR programmed all call scheduling such that each sample member remaining as a nonrespondent<br />
was attempted to be reached at least six times at different times of day on different<br />
days of the week. A total of 12,309 telephone numbers were attempted during the survey<br />
administration. Sample members reporting residence in a locality other than the City of <strong>Roanoke</strong><br />
were excluded from the eligible sample pool (N=1,604); likewise, respondents who indicated a<br />
language or hearing barrier such that they could not respond or request that another adult in the<br />
household respond, were also excluded from the eligible sample pool (N=117). Households for<br />
which interviewers were told that only minors resided in the home were excluded from the<br />
eligible sample pool (N=13). Non-working telephone numbers (fax tones, out of<br />
service/disconnected numbers, automated disconnect services) were also excluded from the<br />
eligible sample pool (N=1,459). Non-residential numbers (N=620) were excluded from the<br />
eligible pool of sample members as well.<br />
After the elimination of all the ineligible records described above, the remaining number<br />
of eligible sample members was 8,496. A total of 600 interviews were completed for this study.<br />
Table 1 provides an overview of the final call dispositions for all sample members. Many<br />
sample members were never reached after numerous attempts and a final disposition of “no<br />
answer” was assigned. Therefore, the residency rate among these households is unknown.<br />
5<br />
City of <strong>Roanoke</strong> <strong>2011</strong> <strong>Citizen</strong> <strong>Survey</strong><br />
Summary of Results
CSR<br />
Virginia Tech Center for <strong>Survey</strong> Research<br />
It may be assumed that a number of these households are indeed, ineligible sample<br />
members due to non-residence. CSR utilizes a standard conversion calling protocol in which all<br />
calls that are coded as “soft refusals” are re-attempted utilizing more senior interviewing staff. A<br />
call is coded as a “soft refusal” when the potential respondent refuses but does not indicate a<br />
reason for exclusion from the calling pool (i.e. refusal due to illness, request to be removed from<br />
calling pool, etc.). Likewise, all telephone numbers deemed to be temporarily disconnected are<br />
attempted periodically throughout the duration of the study.<br />
Table 1<br />
Total Initial Sample 12,309<br />
Ineligible Sample:<br />
Residence outside the City of <strong>Roanoke</strong> (1,604)<br />
Language/Hearing Barrier (117)<br />
Non-working telephone number (fax tones, out of service/disconnected numbers,<br />
automated disconnect services) (1,459)<br />
No Adult in Home (13)<br />
Non-residential telephone number (620)<br />
Eligible Sample 8,496<br />
Total Number of Completed Interviews 600<br />
Non-respondents:<br />
Final disposition of no answer, busy, answering machine or callback after six attempts<br />
(6,688)<br />
Refusals (1,208) 7,896<br />
6<br />
City of <strong>Roanoke</strong> <strong>2011</strong> <strong>Citizen</strong> <strong>Survey</strong><br />
Summary of Results
CSR<br />
Virginia Tech Center for <strong>Survey</strong> Research<br />
2<br />
Respondent Demographic Profile<br />
Three-fourths (75%) of respondents to the survey reported that they are white, with 19<br />
percent of respondents reporting they are African American or Black. The remaining four<br />
percent of respondents reported being Asian, Hispanic or a member of some other group. Two<br />
percent of respondents refused to report their race. As has consistently been the case in previous<br />
administrations of the City of <strong>Roanoke</strong> <strong>Citizen</strong>s <strong>Survey</strong>, more women than men responded (64%<br />
vs. 36%). The majority of respondents to the survey are 40 years of age or older (84%), with 13<br />
percent reporting that they are younger than 40 years of age, and three percent of respondents<br />
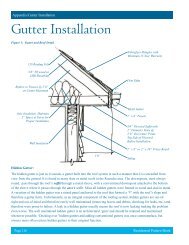
who did not report their age. Figure 1 depicts the income distribution reported by respondents to<br />
the <strong>2011</strong> survey.<br />
Figure 1. <strong>2011</strong> <strong>Roanoke</strong> <strong>Citizen</strong>s <strong>Survey</strong> Respondent Incomes<br />
100<br />
90<br />
80<br />
70<br />
60<br />
50<br />
40<br />
30<br />
20<br />
10<br />
0<br />
13.0 11.7 11.5 14.5 15.7<br />
Less Than $15,000<br />
Between $15,000 and Less Than $25,000<br />
Between $25,000 and Less Than $35,000<br />
Between $35,000 and Less Than $50,000<br />
Between $50,000 and Less Than $75,000<br />
Between $75,000 and $100,000<br />
Over $100,000<br />
6.5<br />
7.5<br />
Percentage<br />
7<br />
City of <strong>Roanoke</strong> <strong>2011</strong> <strong>Citizen</strong> <strong>Survey</strong><br />
Summary of Results
CSR<br />
Virginia Tech Center for <strong>Survey</strong> Research<br />
3<br />
Findings Related to Quality of Life and Selected Issues<br />
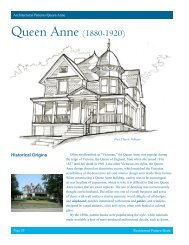
More than three-fourths of <strong>Roanoke</strong>‟s citizens (76%) rate the quality of life in the City as<br />
either „excellent‟ or „good‟. As depicted in Figure 2, citizen responses to the survey item asking<br />
respondents to rate the quality of life in the community have remained positive across all survey<br />
years in which the item was asked.<br />
Figure 2. <strong>Citizen</strong> Ratings of Quality of Life<br />
in the City of <strong>Roanoke</strong><br />
100<br />
80<br />
60<br />
40<br />
20<br />
0<br />
79.4<br />
79.3<br />
77.2 75.1 77.1 75.8<br />
24.9<br />
19.7 20.0 21.8 22.0 23.5<br />
Excellent/Good Fair/Poor Don't know/Refuse<br />
0.8<br />
0.8<br />
1.0<br />
0.0<br />
1.0<br />
2000<br />
2002<br />
2003<br />
2005<br />
2007<br />
<strong>2011</strong><br />
0.7<br />
8<br />
City of <strong>Roanoke</strong> <strong>2011</strong> <strong>Citizen</strong> <strong>Survey</strong><br />
Summary of Results
CSR<br />
Virginia Tech Center for <strong>Survey</strong> Research<br />
As has been true in the previous survey years, there are some differences in citizen<br />
perceptions of quality of life in the City of <strong>Roanoke</strong> when viewed by certain respondent<br />
demographic characteristics. Overall, <strong>Roanoke</strong> residents with higher incomes tend to rate the<br />
quality of life in the City more favorably than those with lower incomes. For example, in the<br />
<strong>2011</strong> survey, respondents using the categories „excellent‟ or „good‟ to describe the quality of life<br />
in the City of <strong>Roanoke</strong> by self-reported income category are as follows:<br />
Less than $15,000: 68%<br />
Between $15,000 and Less Than $25,000: 67%<br />
Between $25,000 and Less Than $35,000: 77%<br />
Between $35,000 and Less Than $50,000: 70%<br />
Between $50,000 and Less Than $75,000: 83%<br />
Between $75,000 and Less Than $100,000: 87%<br />
Over $100,000: 93%<br />
Differences in perceptions of quality of life in the City of <strong>Roanoke</strong> were also evident<br />
when viewed by respondent age. Specifically, older respondents are more likely to rate the<br />
quality of life in <strong>Roanoke</strong> as „excellent‟ or „good‟ than younger respondents are. For example, in<br />
the <strong>2011</strong> survey, respondents using the categories „excellent‟ or „good‟ to describe the quality of<br />
life in the City of <strong>Roanoke</strong> by self-reported age are as follows:<br />
18-25: 55.0%<br />
26-35: 60.0%<br />
36-50: 70.6%<br />
51-65: 74.3%<br />
>65: 84.7%<br />
9<br />
City of <strong>Roanoke</strong> <strong>2011</strong> <strong>Citizen</strong> <strong>Survey</strong><br />
Summary of Results
CSR<br />
Virginia Tech Center for <strong>Survey</strong> Research<br />
Quality of life in the City is also viewed differently according to the race of the respondent.<br />
Respondents who report their race as White are more likely to rate quality of life in the City of<br />
<strong>Roanoke</strong> as either „excellent‟ or „good‟ than are respondents who report their race as African<br />
American/Black. In the <strong>2011</strong> survey administration, 82 percent of White respondents rated<br />
quality of life in the City as „excellent‟ or „good‟ (an identical percentage as the 2007 rating)<br />
with 56 percent of African American/Black respondents using the same response categories to<br />
describe quality of life in the City (down from 63 percent of African American/Black<br />
respondents responding with these ratings in 2007).<br />
There are also differences in the ratings of quality of life in the City when the responses are<br />
viewed by respondent gender. This year 73 percent of male respondents (79% in 2007) and 76<br />
percent of female respondents (77% in 2007) rate quality of life in the City as either „excellent‟<br />
or „good‟.<br />
A highly positive finding from the <strong>2011</strong> survey is that citizens in the City of <strong>Roanoke</strong> were<br />
far more favorable than in previous years regarding ten out of the thirteen strategic initiatives or<br />
issues addressed in the survey. Indeed, on the three items on which citizens were not<br />
significantly more positive in <strong>2011</strong>, one of the items yielded an identical response percentage as<br />
in 2007, one item was asked for the first time in <strong>2011</strong>, and one item was re-worded in <strong>2011</strong><br />
which likely affected the level of agreement. Specifically, the item “educational resources and<br />
10<br />
City of <strong>Roanoke</strong> <strong>2011</strong> <strong>Citizen</strong> <strong>Survey</strong><br />
Summary of Results
CSR<br />
Virginia Tech Center for <strong>Survey</strong> Research<br />
opportunities available to you and your family in <strong>Roanoke</strong>” was changed from a rating item to an<br />
agreement item and was re-worded to “City of <strong>Roanoke</strong>‟s support of educational resources and<br />
opportunities available to you and your family in <strong>Roanoke</strong>.” Table 2 depicts these highly<br />
favorable findings.<br />
Table 2. <strong>Citizen</strong> Responses Regarding Selected Strategic Issues and Questions<br />
<strong>Survey</strong> Item 2000 2001 2002 2003 2005 2007 <strong>2011</strong><br />
City does good job offering<br />
multicultural events and attractions. 85.5 NA 79.0 NA 79.6 74.6 86.3<br />
<strong>Roanoke</strong>'s neighborhoods are good<br />
places to live. 83.2 NA 87.4 NA 85.3 76.9 85.3<br />
City government’s greenway<br />
development effort is a valuable asset to<br />
the City and its residents. NA NA NA NA 75.2 67.6 82.7<br />
<strong>Roanoke</strong>’s transportation system allows<br />
for a good mix of transportation options<br />
like auto, public transit, pedestrian, and<br />
bicycle traffic. 65.0 NA 74.1 NA 77.6 71.8 79.3<br />
There is a good mix of housing types and<br />
affordability in <strong>Roanoke</strong>. 75.4 NA 77.0 NA 74.9 70.4 75.7<br />
City government does a good job of<br />
informing/educating citizens about City<br />
services. 74.3 NA 66.3 NA 65.9 55.0 71.7<br />
The services provided by the City of<br />
<strong>Roanoke</strong> are worth the taxes paid by its<br />
citizens. 65.8 75.1 70.3 69.7 67.1 57.4 63.8<br />
City government officials actively<br />
involve citizens in the business of<br />
government. 63.9 NA 65.5 NA 60.2 48.7 63.2<br />
City government does a good job of<br />
providing health and human services to<br />
citizens who need them. 71.0 NA 72.5 NA 70.9 60.5 60.5<br />
Downtown off-street parking (both<br />
garages and lots) is readily available. NA NA NA NA NA NA 58.8<br />
City government performance is<br />
improving in <strong>Roanoke</strong>. 72.9 75.9 63.1 61.5 61.2 53.1 57.2<br />
11<br />
City of <strong>Roanoke</strong> <strong>2011</strong> <strong>Citizen</strong> <strong>Survey</strong><br />
Summary of Results
CSR<br />
Virginia Tech Center for <strong>Survey</strong> Research<br />
Table 2. <strong>Citizen</strong> Responses Regarding Selected Strategic Issues and Questions<br />
<strong>Survey</strong> Item 2000 2001 2002 2003 2005 2007 <strong>2011</strong><br />
(City of <strong>Roanoke</strong>’s support of)<br />
Educational resources and opportunities<br />
available to you and your family in<br />
<strong>Roanoke</strong>* 64.9 NA 64.3 NA 67.1 59.9 53.7<br />
City government does a good job of<br />
focusing on the unique needs of youths. 56.3 NA 56.3 NA 49.7 39.9 50.2<br />
4<br />
City of <strong>Roanoke</strong> Services<br />
In the <strong>2011</strong> survey, 84 percent of respondents indicated that they are satisfied with the<br />
overall quality of services that the City of <strong>Roanoke</strong> government provides given its available<br />
resources. More than 8 in 10 citizens (81%) were satisfied in 2007 with the overall quality of<br />
services that the City of <strong>Roanoke</strong> government provides so the <strong>2011</strong> overall quality of service<br />
satisfaction among citizens has risen. In the <strong>2011</strong> survey, citizens were not only asked to rate the<br />
quality of services provided by the City but were also asked to rate the level of importance of<br />
each service included in the survey. Table 3 provides a comparison of the ratings among<br />
citizens of City services compared to respondent ratings of importance for each service. All<br />
responses of “not familiar with service,” “don‟t know,” or “refuse to answer” were excluded in<br />
the tabulation of the percentages and means reported for each service. The service rating column<br />
includes responses of „excellent‟ and „good‟ and the importance column includes responses of<br />
12<br />
City of <strong>Roanoke</strong> <strong>2011</strong> <strong>Citizen</strong> <strong>Survey</strong><br />
Summary of Results
CSR<br />
Virginia Tech Center for <strong>Survey</strong> Research<br />
„very important‟. The services in Table 3 are ranked in descending order with the highest<br />
quality ratings at the top.<br />
Table 3. <strong>2011</strong> City Service Ratings Compared with Importance of Service Ratings<br />
City Service<br />
Quality<br />
Rating<br />
Importance<br />
Rating<br />
The 911 emergency call center 94.4 97.0<br />
Fire protection services 94.2 90.5<br />
Emergency medical services and rescue 93.9 94.8<br />
Public library services and programs 91.5 77.5<br />
Weekly trash collection 85.4 87.0<br />
Police service 85.0 92.6<br />
Recycling 78.1 71.1<br />
The condition of the City’s parks, trails, and recreation facilities 78.1 55.1<br />
The quality of <strong>Roanoke</strong>’s athletic fields 75.9 51.6<br />
The quality of events offered by the Civic Center 74.4 48.3<br />
Animal control 73.3 68.3<br />
Street lighting 72.4 76.8<br />
Bi-weekly pick-up of large trash items and brush 72.3 72.0<br />
Mowing and maintenance of City parks 72.2 53.6<br />
Valley Metro bus transportation services 72.1 72.8<br />
The quality of the City’s recreation programs 71.6 54.5<br />
The City’s marketing of its parks and recreation programs and services 70.1 50.0<br />
Code enforcement services 65.3 60.2<br />
City government support of neighborhood organizations 63.9 62.3<br />
The maintenance of trees along City streets and within parks 63.7 52.2<br />
Removal of snow and ice from City streets 63.2 87.0<br />
<strong>Citizen</strong>s getting information about City services and activities 61.4 60.4<br />
Mowing of rights of way, street medians, and roadsides 60.2 52.0<br />
The quality of the City’s sidewalks 58.7 55.9<br />
The City’s efforts to promote environmental awareness to citizens 57.6 54.4<br />
Transportation planning for traffic 57.4 71.0<br />
Efforts of the City to improve the quality of housing in the City 55.9 71.5<br />
The current level of bagged leaf collection service 54.1 57.9<br />
Street paving, maintenance and repair 48.2 75.8<br />
13<br />
City of <strong>Roanoke</strong> <strong>2011</strong> <strong>Citizen</strong> <strong>Survey</strong><br />
Summary of Results
CSR<br />
Virginia Tech Center for <strong>Survey</strong> Research<br />
Another positive finding from the survey is that the services that received the highest<br />
quality ratings tended to also be those that are very important to citizens. Table 4 provides the<br />
combined percentage of „excellent‟ and „good‟ ratings for each City service included in the <strong>2011</strong><br />
survey along with the citizen ratings the service received in the surveys since 2000. As noted in<br />
the table, all service items were not asked in each year. Items not asked in a given year appear as<br />
“NA.” All „don‟t know/refuse‟ and „not familiar‟ responses were excluded from the total<br />
number of responses for the percentage tabulations included in the table.<br />
Table 4. Service Ratings, Percentage “Excellent” and “Good” Combined 2000-<strong>2011</strong><br />
City Service 2000 2001 2002 2003 2005 2007 <strong>2011</strong><br />
The 911 emergency call center 93.0 87.9 95.6 94.1 91.5 92.5 94.4<br />
Fire protection services 95.4 93.3 94.8 95.1 92.2 91.6 94.2<br />
Emergency medical services and rescue 93.6 91.9 95.1 93.0 91.7 91.4 93.9<br />
Public library services and programs 84.9 91.7 95.3 92.6 90.7 92.2 91.5<br />
Weekly trash collection 87.7 76.4 90.0 84.6 85.9 87.5 85.4<br />
Police service 79.9 75.7 84.1 79.1 80.4 79.1 85.0<br />
Recycling services 72.3 75.3 85.8 74.2 77.7 74.7 78.1<br />
The condition of the City’s parks, trails, and<br />
recreation facilities NA NA NA NA NA NA 78.1<br />
The quality of <strong>Roanoke</strong>’s athletic fields NA NA NA NA 57.8 58.6 75.9<br />
Quality of events offered by the Civic Center NA NA NA NA NA 50.6 74.4<br />
Animal control 72.1 66.4 83.8 67.9 65.3 67.5 73.3<br />
Street lighting 72.9 66.5 75.3 69.1 68.7 68.9 72.4<br />
Bi-weekly pick-up of large items and brush 63.4 68.2 84.5 75.6 76.5 76.5 72.3<br />
Mowing and maintenance of City parks NA NA 93.6 81.9 79.3 80.8 72.2<br />
Valley Metro bus transportation services 72.6 77.0 86.8 80.4 79.7 75.3 72.1<br />
The quality of the City’s recreation programs NA NA NA NA NA NA 71.6<br />
The City’s marketing of its parks and recreation<br />
programs and services NA NA NA NA NA 68.2 70.1<br />
Code enforcement services NA NA NA 54.3 43.8 46.3 65.3<br />
City government support for neighborhood<br />
organizations 63.9 62.9 80.1 64.3 59.9 55.9 63.9<br />
The maintenance of trees along City streets and<br />
within parks NA NA NA NA 67.2 70.6 63.7<br />
14<br />
City of <strong>Roanoke</strong> <strong>2011</strong> <strong>Citizen</strong> <strong>Survey</strong><br />
Summary of Results
CSR<br />
Virginia Tech Center for <strong>Survey</strong> Research<br />
Table 4. Service Ratings, Percentage “Excellent” and “Good” Combined 2000-<strong>2011</strong><br />
City Service 2000 2001 2002 2003 2005 2007 <strong>2011</strong><br />
Removal of snow and ice from City streets 68.5 63.1 78.4 65.3 66.9 65.8 63.2<br />
<strong>Citizen</strong>s getting information about City<br />
services/activities 67.7 65.1 77.5 64.1 56.7 59.3 61.4<br />
Mowing right of ways, street medians, and<br />
roadsides NA NA 84.9 72.5 66.7 68.5 60.2<br />
Quality of the City’s sidewalks NA NA NA NA 49.3 43.1 58.7<br />
City’s efforts to promote environmental<br />
awareness to citizens NA NA NA 50.2 50.8 45.3 57.6<br />
Transportation planning for traffic 57.4 56.2 67.9 53.6 48.6 47.2 57.4<br />
Efforts of the City to improve quality of housing in<br />
City NA NA NA 52.4 50.0 50.0 55.9<br />
Current level of bagged leaf collection service NA NA NA 74.9 71.6 73.7 54.1<br />
Street paving, maintenance and repair 52.2 51.2 63.8 48.2 40.4 42.7 48.2<br />
Among the 29 rating items for City services in the <strong>2011</strong> survey, 18 increased with regard<br />
to citizen ratings of the quality of services since 2007, 9 decreased, and 2 were treated as new<br />
items because they have completely different wording than in previous survey years and<br />
therefore, have no comparison data.<br />
Included in the 18 City services for which citizen ratings increased since 2007 are 11<br />
services for which citizen ratings increased at least five percentage points since the last survey.<br />
There are 4 services for which citizen ratings decreased at least five percentage points since the<br />
last survey. These services with substantial increases or decreases in ratings are as follows:<br />
Police service increased from 79 to 85 %<br />
The Quality of <strong>Roanoke</strong>‟s Athletic Fields increased from 59 to 76 %<br />
The Quality of Events Offered by the Civic Center increased from 51 to 74 %<br />
Animal control increased from 67 to 73 %<br />
Code enforcement services increased from 46 to 65 %*<br />
City government support for neighborhood organizations increased from 56 to 64 %<br />
15<br />
City of <strong>Roanoke</strong> <strong>2011</strong> <strong>Citizen</strong> <strong>Survey</strong><br />
Summary of Results
CSR<br />
Virginia Tech Center for <strong>Survey</strong> Research<br />
The quality of the City‟s sidewalks increased from 43 to 59 %**<br />
City‟s efforts to promote environmental awareness to citizens increased from 45 to 58 %<br />
Transportation planning for traffic increased from 47 to 57 %<br />
Efforts of the City to improve quality of housing in the City increased from 50 to 56 %<br />
Street paving, maintenance, and repair increased from 43 to 48 %<br />
*<strong>Survey</strong> item was “code enforcement” in <strong>2011</strong> and “enforcement of property maintenance<br />
codes and other nuisance codes” in 2007<br />
**<strong>Survey</strong> item was “the quality of the City‟s sidewalks” in <strong>2011</strong> and “maintenance of City‟s<br />
existing sidewalks” in 2007<br />
Mowing and maintenance of city parks decreased from 81 to 72 %<br />
The maintenance of trees along City streets and within parks decreased from 71 to 64 %<br />
Mowing right of ways, street medians, and roadsides decreased from 68 to 60 %<br />
Current level of bagged leaf collection service decreased from 74 to 54 %<br />
5<br />
<strong>Citizen</strong> Perceptions of Safety<br />
As depicted in Figure 3, City of <strong>Roanoke</strong> residents feel even safer in their neighborhoods<br />
in <strong>2011</strong> than they did in 2007. However, fewer respondents to the survey in <strong>2011</strong> reported<br />
feeling „very safe‟ or „somewhat safe‟ in downtown <strong>Roanoke</strong> than they did in 2007. There are<br />
differences in the survey responses related to feelings of safety when viewed by respondent<br />
gender. For example, in the <strong>2011</strong> survey more women than men reported feeling „very safe‟ or<br />
16<br />
City of <strong>Roanoke</strong> <strong>2011</strong> <strong>Citizen</strong> <strong>Survey</strong><br />
Summary of Results
CSR<br />
Virginia Tech Center for <strong>Survey</strong> Research<br />
„somewhat safe‟ in their neighborhoods (92% vs. 89%). However, far fewer women than men<br />
74% vs. 82%) reported feeling „very safe‟ or „somewhat safe‟ in downtown <strong>Roanoke</strong>. <strong>Roanoke</strong><br />
citizens reporting a higher household income are more likely to feel „very safe‟ or „somewhat<br />
safe‟ in their neighborhoods, with fewer than 90 percent of citizens in all income categories<br />
below $50,000.00 using these response categories and 95 percent or more among citizens in<br />
income categories above $50,000.00 using these response categories. Likewise, less than 80<br />
percent of <strong>Roanoke</strong> citizens with household income categories less than $50,000.00 used the<br />
categories „very safe‟ or „somewhat safe‟ to describe their feelings of safety in downtown<br />
<strong>Roanoke</strong>. Whereas, 90 percent or more of citizens reporting a household income in a category of<br />
at least $50,000.00 used the categories „very safe‟ or „somewhat safe‟ to describe their feelings<br />
of safety in downtown <strong>Roanoke</strong>.<br />
Figure 3. Feelings of Safety in <strong>Roanoke</strong>: 2003-<strong>2011</strong><br />
91.0<br />
Neighborhood<br />
90.1<br />
90.7<br />
91.2<br />
Downtown<br />
76.8<br />
81.9<br />
81.8<br />
81.5<br />
<strong>2011</strong><br />
2007<br />
2005<br />
2003<br />
0 10 20 30 40 50 60 70 80 90 100<br />
Percentage Reporting 'Very' or 'Somewhat' Safe<br />
17<br />
City of <strong>Roanoke</strong> <strong>2011</strong> <strong>Citizen</strong> <strong>Survey</strong><br />
Summary of Results
CSR<br />
Virginia Tech Center for <strong>Survey</strong> Research<br />
Among survey respondents reporting their race as African American/Black, 87 percent<br />
feel „very safe‟ or „somewhat safe‟ in their neighborhoods compared with 92 percent of White<br />
respondents. However, more African American/Black respondents than White respondents (82%<br />
vs. 75%) reported feeling „very safe‟ or „somewhat safe‟ in downtown <strong>Roanoke</strong>. Respondent<br />
age also makes a difference in feelings of safety in the City of <strong>Roanoke</strong>. Among respondents in<br />
age categories 50 years of age and younger, fewer than 90 percent reported feeling „very safe‟ or<br />
„somewhat safe‟ in their neighborhoods, with 90 percent or more respondents in age categories<br />
older than 50 years of age reporting feeling „very safe‟ or „somewhat safe‟ in their<br />
neighborhoods. The only respondent age category in which there is a significant decrease in<br />
perceptions of safety in downtown <strong>Roanoke</strong> is the age category 65 years of age and older (with<br />
65% of respondents in this age category reporting feeling „very safe‟ or „somewhat safe‟<br />
downtown). In all other respondent age categories, more than 80 percent of respondents report<br />
feeling „very safe‟ or „somewhat safe‟ downtown.<br />
6<br />
City Government Customer Service<br />
A variety of items measuring citizen ratings of City government employee customer<br />
service are included in the survey. In <strong>2011</strong>, in order to accommodate additional City servicerelated<br />
items, some customer service items were deleted. Among the customer service-related<br />
18<br />
City of <strong>Roanoke</strong> <strong>2011</strong> <strong>Citizen</strong> <strong>Survey</strong><br />
Summary of Results
CSR<br />
Virginia Tech Center for <strong>Survey</strong> Research<br />
survey items included in <strong>2011</strong>, the lowest rated aspect among citizens was related to City parking<br />
facility staff. However, agreement with the item “city parking facility staff are generally polite<br />
and responsive” was down only slightly from 2007, with 66 percent of respondents agreeing in<br />
<strong>2011</strong> and 67 percent of respondents agreeing in 2007. A positive finding from the <strong>2011</strong> survey is<br />
that the other three customer-service related items included in the survey all showed significant<br />
increases in respondent agreement since 2007. Table 5 provides an overview of the survey<br />
findings from the customer service items included in the survey.<br />
Table 5<br />
<strong>Citizen</strong> Agreement on Selected Aspects of Customer Service in the City<br />
(‘Strongly Agree’ and ‘Somewhat Agree’)<br />
<strong>Survey</strong> Item 2000 2001 2002 2003 2005 2007 <strong>2011</strong><br />
City government employees are generally<br />
friendly, courteous, and helpful 86.8 87.9 85.4 86.2 88.9 82.1 85.5<br />
City government employees provide prompt<br />
service 74.4 77.2 77.4 73.3 78.0 67.9 73.3<br />
It is easy to contact the appropriate City<br />
government office when you need a<br />
particular service or have a question 72.3 70.9 70.1 68.2 66.7 61.5 70.3<br />
City parking facility staff are generally polite<br />
and responsive NA NA 79.6 73.3 75.4 67.0 65.7<br />
Two new customer service items in the <strong>2011</strong> survey asked citizens‟ agreement with the<br />
statement “excluding emergency calls, when I contact the City with a customer service request,<br />
City staff quickly assess and acknowledge my request” to which 71 percent of citizens agreed,<br />
and “excluding emergency calls, when I contact the City with a customer service request, City<br />
staff quickly resolve my request,” to which 80 percent agreed.<br />
19<br />
City of <strong>Roanoke</strong> <strong>2011</strong> <strong>Citizen</strong> <strong>Survey</strong><br />
Summary of Results
PLAY magazine<br />
City's website<br />
PLAY Wire<br />
weekly emails<br />
My<strong>Roanoke</strong><br />
news releases<br />
Word of mouth<br />
Do not receive<br />
information<br />
Not<br />
familiar/DK/RF<br />
CSR<br />
Virginia Tech Center for <strong>Survey</strong> Research<br />
7<br />
City Government Communication with <strong>Citizen</strong>s<br />
A new series of survey items included in <strong>2011</strong> are related to how citizens learn about<br />
recreation programs and park amenities in the City. The findings for these items appear in<br />
Figure 4 below.<br />
100<br />
80<br />
60<br />
40<br />
20<br />
0<br />
Figure 4. How <strong>Citizen</strong>s Learn About Recreation Programs and Park Amenities:<br />
<strong>2011</strong><br />
22.8<br />
13.2<br />
5.7<br />
26.5<br />
37.3<br />
16.7<br />
10.0<br />
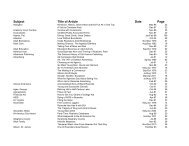
As was the case in the previous years‟ surveys, the <strong>2011</strong> survey instrument included an<br />
item regarding the method of communication citizens prefer when receiving information from<br />
the City. Even though this item has been included in the survey instrument since 2001, the<br />
communication options have changed over time such that it is not feasible to compare the <strong>2011</strong><br />
findings with findings on these items from previous survey years. Figure 5 depicts the<br />
preferred methods of communication among citizens for receiving information from the City.<br />
20<br />
City of <strong>Roanoke</strong> <strong>2011</strong> <strong>Citizen</strong> <strong>Survey</strong><br />
Summary of Results
CSR<br />
Virginia Tech Center for <strong>Survey</strong> Research<br />
Figure 5. <strong>Citizen</strong>s' Preferred Methods of Communication for<br />
Receiving Information From the City in <strong>2011</strong> (Percentages of<br />
Respondents Selecting Method)<br />
Other way<br />
11.0<br />
Newspaper, radio news, TV news<br />
72.2<br />
City's TV shows/message board RVTV<br />
20.0<br />
City's web site<br />
14.3<br />
City's My<strong>Roanoke</strong> emails<br />
15.3<br />
E-newsletter sent monthly by City<br />
16.8<br />
City News Kiosks at library<br />
5.3<br />
Magazine<br />
34.8<br />
0 10 20 30 40 50 60 70 80 90 100<br />
A stand alone survey item asked citizens how often they view information about City<br />
services by watching the City‟s Inside <strong>Roanoke</strong> television show. More than a third of citizens<br />
(35%) view information this way at least twice a month, with 23 percent of that group of<br />
respondents saying they view information about City services this way at least once a month.<br />
Slightly fewer than four in ten citizens (39%) are aware that “the City has a centralized<br />
customer service phone number that is 853-2000.” When asked which methods they would<br />
choose to contact the City, 62 percent of citizens would call the specific department involved, 12<br />
21<br />
City of <strong>Roanoke</strong> <strong>2011</strong> <strong>Citizen</strong> <strong>Survey</strong><br />
Summary of Results
CSR<br />
Virginia Tech Center for <strong>Survey</strong> Research<br />
percent would call the City Manager‟s Office, 10 percent would visit, 10 percent would send a<br />
written letter, 13 percent would send an email, one percent would send a message through<br />
Facebook or Twitter, seven percent would submit a service request on-line through the City‟s<br />
website, 42 percent would call the City‟s centralized customer service number, and two percent<br />
would choose to contact the City some other way.<br />
8<br />
Data Storage<br />
An SPSS dataset from which the <strong>2011</strong> data in this summary report were derived<br />
accompanies this report in electronic format. All variable and value labels are provided on the<br />
SPSS dataset. All electronic files of the survey instrument, report, tabulations and presentations<br />
related to the data are the property of the City of <strong>Roanoke</strong>. However, the Center for <strong>Survey</strong><br />
Research will retain copies of all project materials for a period of at least one year. No<br />
information from this survey will be shared by the CSR with anyone other than project team<br />
members from the Office of the City of <strong>Roanoke</strong> Manager without the express permission of that<br />
office.<br />
22<br />
City of <strong>Roanoke</strong> <strong>2011</strong> <strong>Citizen</strong> <strong>Survey</strong><br />
Summary of Results