Condensed consolidated income statement - Rolls-Royce
Condensed consolidated income statement - Rolls-Royce
Condensed consolidated income statement - Rolls-Royce

You also want an ePaper? Increase the reach of your titles
YUMPU automatically turns print PDFs into web optimized ePapers that Google loves.
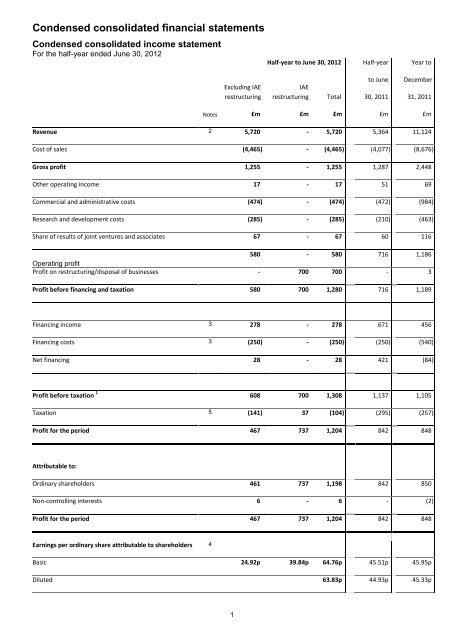
<strong>Condensed</strong> <strong>consolidated</strong> financial <strong>statement</strong>s<br />
<strong>Condensed</strong> <strong>consolidated</strong> <strong>income</strong> <strong>statement</strong><br />
For the half-year ended June 30, 2012<br />
Half-year to June 30, 2012 Half-year Year to<br />
Excluding IAE<br />
restructuring<br />
IAE<br />
restructuring<br />
Total<br />
to June<br />
December<br />
30, 2011 31, 2011<br />
Notes £m £m £m £m £m<br />
Revenue 2 5,720 - 5,720 5,364 11,124<br />
Cost of sales (4,465) - (4,465) (4,077) (8,676)<br />
Gross profit 1,255 - 1,255 1,287 2,448<br />
Other operating <strong>income</strong> 17 - 17 51 69<br />
Commercial and administrative costs (474) - (474) (472) (984)<br />
Research and development costs (285) - (285) (210) (463)<br />
Share of results of joint ventures and associates 67 - 67 60 116<br />
580 - 580 716 1,186<br />
Operating profit<br />
Profit on restructuring/disposal of businesses - 700 700 - 3<br />
Profit before financing and taxation 580 700 1,280 716 1,189<br />
Financing <strong>income</strong> 3 278 - 278 671 456<br />
Financing costs 3 (250) - (250) (250) (540)<br />
Net financing 28 - 28 421 (84)<br />
Profit before taxation 1 608 700 1,308 1,137 1,105<br />
Taxation 5 (141) 37 (104) (295) (257)<br />
Profit for the period 467 737 1,204 842 848<br />
Attributable to:<br />
Ordinary shareholders 461 737 1,198 842 850<br />
Non-controlling interests 6 - 6 - (2)<br />
Profit for the period 467 737 1,204 842 848<br />
Earnings per ordinary share attributable to shareholders 4<br />
Basic 24.92p 39.84p 64.76p 45.51p 45.95p<br />
Diluted 63.83p 44.93p 45.33p<br />
1
<strong>Condensed</strong> <strong>consolidated</strong> financial <strong>statement</strong>s (continued)<br />
Underlying earnings per ordinary share are shown in note 4.<br />
Payments to ordinary shareholders in respect of 6<br />
the period<br />
7.6p 6.9p 17.5p<br />
Pence per share<br />
Total 142 129 328<br />
1 Underlying profit before taxation 2 637 - 637 595 1,157<br />
<strong>Condensed</strong> <strong>consolidated</strong> <strong>statement</strong> of comprehensive <strong>income</strong><br />
For the half-year ended June 30, 2012<br />
Half-year Half-year<br />
Year to<br />
to June to June<br />
December<br />
30, 2012 30, 2011<br />
31, 2011<br />
£m £m<br />
£m<br />
Profit for the period 1,204 842 848<br />
Other comprehensive <strong>income</strong> (OCI)<br />
(102) 76 (102)<br />
Foreign exchange translation differences on foreign operations<br />
Movements in post-retirement schemes (216) (81) 123<br />
Amount credited to cash flow hedging reserve (1) 30 -<br />
Share of OCI of joint ventures and associates 14 5 (10)<br />
Related tax movements 74 17 (54)<br />
Total comprehensive <strong>income</strong> for the period 973 889 805<br />
Attributable to:<br />
Ordinary shareholders 968 889 808<br />
Non-controlling interests 5 - (3)<br />
Total comprehensive <strong>income</strong> for the period 973 889 805<br />
2
<strong>Condensed</strong> <strong>consolidated</strong> financial <strong>statement</strong>s (continued)<br />
<strong>Condensed</strong> <strong>consolidated</strong> balance sheet<br />
At June 30, 2012<br />
June June December<br />
30, 2012 30, 2011 31, 2011<br />
Notes £m £m £m<br />
ASSETS<br />
Non-current assets<br />
Intangible assets 7 2,865 3,027 2,882<br />
Property, plant and equipment 2,394 2,205 2,338<br />
Investments – joint ventures and associates 1,833 469 1,680<br />
Investments – other 10 11 10<br />
Other financial assets 8 302 485 327<br />
Deferred tax assets 464 309 368<br />
Post-retirement scheme surpluses 9 337 249 503<br />
8,205 6,755 8,108<br />
Current assets<br />
Inventories 2,742 2,612 2,561<br />
Trade and other receivables 4,015 4,070 4,009<br />
Taxation recoverable 15 5 20<br />
Other financial assets 8 73 187 91<br />
Short-term investments 12 3 11<br />
Cash and cash equivalents 2,160 2,526 1,310<br />
Assets held for sale 5 9 313<br />
9,022 9,412 8,315<br />
Total assets 17,227 16,167 16,423<br />
LIABILITIES<br />
Current liabilities<br />
Borrowings (4) - (20)<br />
Other financial liabilities 8 (110) (56) (111)<br />
Trade and other payables (6,732) (6,116) (6,236)<br />
Current tax liabilities (177) (173) (138)<br />
Provisions for liabilities and charges (253) (306) (276)<br />
3
<strong>Condensed</strong> <strong>consolidated</strong> financial <strong>statement</strong>s (continued)<br />
Liabilities associated with assets held for sale - - (135)<br />
(7,276) (6,651) (6,916)<br />
Non-current liabilities<br />
Borrowings (1,407) (1,140) (1,184)<br />
Other financial liabilities 8 (803) (742) (919)<br />
Trade and other payables (659) (1,248) (1,314)<br />
Deferred tax liabilities (490) (483) (445)<br />
Provisions for liabilities and charges (204) (219) (226)<br />
Post-retirement scheme deficits 9 (907) (930) (900)<br />
(4,470) (4,762) (4,988)<br />
Total liabilities (11,746) (11,413) (11,904)<br />
Net assets 5,481 4,754 4,519<br />
EQUITY<br />
Attributable to ordinary shareholders<br />
Called-up share capital 374 374 374<br />
Share premium account - - -<br />
Capital redemption reserve 172 - 173<br />
Cash flow hedging reserve (58) (11) (52)<br />
Other reserves 350 606 433<br />
Retained earnings 4,589 3,781 3,590<br />
5,427 4,750 4,518<br />
54 4 1<br />
Non-controlling interests<br />
Total equity 5,481 4,754 4,519<br />
4
<strong>Condensed</strong> <strong>consolidated</strong> financial <strong>statement</strong>s (continued)<br />
<strong>Condensed</strong> <strong>consolidated</strong> cash flow <strong>statement</strong><br />
For the half-year ended June 30, 2012<br />
* Restated<br />
Half-year<br />
Half-year<br />
Year to<br />
to June<br />
to June<br />
December<br />
30, 2012<br />
30, 2011<br />
31, 2011<br />
Notes<br />
£m<br />
£m<br />
£m<br />
Reconciliation of cash flows from operating activities<br />
Profit before taxation 1,308 1,137 1,105<br />
Share of results of joint ventures and associates (67) (60) (116)<br />
Profit on restructuring/disposal of businesses (700) - (3)<br />
Profit on disposal of property, plant and equipment (9) (10) (8)<br />
Net financing 3 (28) (421) 84<br />
Taxation paid (69) (95) (208)<br />
Amortisation of intangible assets 115 73 169<br />
Depreciation of property, plant and equipment 122 111 241<br />
Decrease in provisions (38) (36) (28)<br />
Increase in inventories (200) (152) (140)<br />
Increase in trade and other receivables (248) (90) (62)<br />
(Decrease)/increase in trade and other payables (69) 150 416<br />
Movement in other financial assets and liabilities 7 52 68<br />
Net defined benefit post-retirement cost/(credit) recognised in profit<br />
before financing<br />
75 (107) (43)<br />
9<br />
Cash funding of defined benefit post-retirement schemes 9 (143) (146) (304)<br />
Share-based payments 27 20 59<br />
Dividends received from joint ventures and associates 65 31 76<br />
Net cash inflow from operating activities 148 457 1,306<br />
Cash flows from investing activities<br />
Disposals of unlisted investments - - 1<br />
Additions of intangible assets (126) (152) (363)<br />
Disposals of intangible assets - 1 6<br />
Purchases of property, plant and equipment (237) (209) (412)<br />
Government grants received 8 22 38<br />
5
<strong>Condensed</strong> <strong>consolidated</strong> financial <strong>statement</strong>s (continued)<br />
Disposals of property, plant and equipment 26 22 31<br />
Acquisitions of businesses (2) - (19)<br />
Restructuring of IAE 953 - -<br />
Disposals of businesses - 2 7<br />
Investments in joint ventures and associates (16) (37) (1,329)<br />
Transfer of subsidiary to associate (1) - -<br />
Repayment of/(increase in) loan to Engine Holding GmbH 167 - (167)<br />
Net cash inflow/(outflow) from investing activities 772 (351) (2,207)<br />
Cash flows from financing activities<br />
Repayment of loans - (567) (567)<br />
Proceeds from increase in loans 221 - -<br />
Net cash flow from increase/(decrease) in borrowings 221 (567) (567)<br />
Interest received 7 9 19<br />
Interest paid (40) (39) (50)<br />
(Increase)/decrease in short-term investments (1) 325 316<br />
Issue of ordinary shares (net of expenses) - 1 (1)<br />
Purchase of ordinary shares (94) (57) (57)<br />
Other transactions in ordinary shares - 21 -<br />
Redemption of C Shares (124) (141) (315)<br />
Net cash outflow from financing activities (31) (448) (655)<br />
Net increase/(decrease) in cash and cash equivalents 889 (342) (1,556)<br />
Cash and cash equivalents at January 1 1,291 2,851 2,851<br />
Exchange gains on cash and cash equivalents (23) 17 (4)<br />
2,157 2,526 1,291<br />
Cash and cash equivalents at period end<br />
* Restated to show government grants, previously included in trade and other payables, separately.<br />
6
<strong>Condensed</strong> <strong>consolidated</strong> financial <strong>statement</strong>s (continued)<br />
Half-year<br />
to June<br />
30, 2012<br />
£m<br />
Half-year<br />
to June<br />
30, 2011<br />
£m<br />
Year to<br />
December<br />
31, 2011<br />
£m<br />
Reconciliation of movements in cash and cash equivalents to movements in net funds<br />
Net increase/(decrease) in cash and cash equivalents 889 (342) (1,556)<br />
Net cash flow from (increase)/decrease in borrowings (221) 567 567<br />
Net cash flow from increase/(decrease) in short-term investments 1 (325) (316)<br />
Change in net funds resulting from cash flows 669 (100) (1,305)<br />
Exchange (losses)/gains on net funds (23) 18 (5)<br />
Fair value adjustments (2) 136 92<br />
Movement in net funds 644 54 (1,218)<br />
Net funds at January 1 excluding the fair value of swaps 117 1,335 1,335<br />
Net funds at period end excluding the fair value of swaps 761 1,389 117<br />
Fair value of swaps hedging fixed rate borrowings 108 62 106<br />
Net funds at period end 869 1,451 223<br />
The movement in net funds (defined by the Group as including the items shown below) is as follows:<br />
At January 1,<br />
2012<br />
Funds<br />
flow<br />
Exchange<br />
differences<br />
Fair value<br />
adjustments<br />
At June<br />
30, 2012<br />
£m<br />
£m<br />
£m<br />
£m<br />
£m<br />
1,285 (634) (19) - 632<br />
Cash at bank and in hand<br />
11 458 - - 469<br />
Money market funds<br />
Short-term deposits 14 1,049 (4) - 1,059<br />
Overdrafts (19) 16 - - (3)<br />
Cash and cash equivalents 1,291 889 (23) - 2,157<br />
Investments 11 1 - - 12<br />
Other current borrowings (1) - - - (1)<br />
Non-current borrowings (1,183) (221) - (2) (1,406)<br />
Finance leases (1) - - - (1)<br />
Net funds excluding the fair value of swaps 117 669 (23) (2) 761<br />
Fair value of swaps hedging fixed rate borrowings 106 2 108<br />
Net funds 223 669 (23) - 869<br />
7
Share<br />
capital<br />
Share<br />
premium<br />
Capital<br />
redemption<br />
reserve<br />
Cash flow<br />
hedging<br />
reserve<br />
Other<br />
reserves<br />
Retained<br />
earnings<br />
Total<br />
Non-controlling<br />
interests<br />
Total equity<br />
<strong>Condensed</strong> <strong>consolidated</strong> financial <strong>statement</strong>s (continued)<br />
<strong>Condensed</strong> <strong>consolidated</strong> <strong>statement</strong> of changes in equity<br />
For the half-year ended June 30, 2012<br />
Attributable to ordinary shareholders<br />
£m £m £m £m £m £m £m £m £m<br />
At January 1, 2011 374 133 209 (37) 527 2,769 3,975 4 3,979<br />
- - - 26 79 784 889 - 889<br />
Total comprehensive <strong>income</strong> for the period<br />
Arising on issues of ordinary shares - 1 - - - - 1 - 1<br />
Issue of C Shares - (120) - - - 2 (118) - (118)<br />
Redemption of C Shares - - 143 - - (143) - - -<br />
Ordinary shares purchased - - - - - (57) (57) - (57)<br />
Share-based payments – direct to equity - - - - - 56 56 - 56<br />
Effect of scheme of arrangement 1 2,434 (14) (352) - - (2,068) - - -<br />
Effect of capital reduction 1 (2,434) - - - - 2,434 - - -<br />
Related tax movements - - - - - 4 4 - 4<br />
Other changes in equity in the period - (133) (209) - - 228 (114) - (114)<br />
At June 30, 2011 374 - - (11) 606 3,781 4,750 4 4,754<br />
Total comprehensive <strong>income</strong> for the period - - - (41) (173) 133 (81) (3) (84)<br />
Issue of C Shares - - - - - (178) (178) - (178)<br />
Redemption of C Shares - - 174 - - (174) - - -<br />
Share-based payments – direct to equity - - - - - 21 21 - 21<br />
Effect of scheme of arrangement - - (1) - - (1) (2) - (2)<br />
Related tax movements - - - - - 8 8 - 8<br />
Other changes in equity in the period - - 173 - - (324) (151) - (151)<br />
At December 31, 2011 374 - 173 (52) 433 3,590 4,518 1 4,519<br />
Total comprehensive <strong>income</strong> for the period - - - (6) (83) 1,057 968 5 973<br />
Issue of C Shares - - (129) - - 2 (127) - (127)<br />
Redemption of C Shares - - 128 - - (128) - - -<br />
Ordinary shares purchased - - - - - (94) (94) - (94)<br />
Share-based payments – direct to equity - - - - - 35 35 - 35<br />
Transactions with non-controlling interests 2 - - - - - 115 115 48 163<br />
8
<strong>Condensed</strong> <strong>consolidated</strong> financial <strong>statement</strong>s (continued)<br />
Related tax movements - - - - - 12 12 - 12<br />
Other changes in equity in the period - - (1) - - (58) (59) 48 (11)<br />
At June 30, 2012 374 - 172 (58) 350 4,589 5,427 54 5,481<br />
1<br />
On May 23, 2011, under a scheme of arrangement between <strong>Rolls</strong>-<strong>Royce</strong> Group plc, the former holding company of the Group, and its shareholders under Part<br />
26 of the Companies Act 2006, and as sanctioned by the High Court, all the issued ordinary shares in that company were cancelled and the same number of<br />
new ordinary shares were issued to <strong>Rolls</strong>-<strong>Royce</strong> Holdings plc in consideration for the allotment to shareholders of one ordinary share in <strong>Rolls</strong>-<strong>Royce</strong> Holdings<br />
plc for each ordinary share in <strong>Rolls</strong>-<strong>Royce</strong> Group plc held on the record date (May 20, 2011).<br />
On May 23, 2011, pursuant to the scheme of arrangement noted above, 1,872,188,709 ordinary shares of 150 pence were issued. As required by Section 612<br />
of the Companies Act 2006, no share premium was recognised.<br />
On May 24, 2011, the share capital of <strong>Rolls</strong>-<strong>Royce</strong> Holdings plc was reduced by reducing the nominal value of the ordinary shares from 150 pence to 20 pence<br />
as sanctioned by the High Court.<br />
2 On January 2, 2012, the Group contributed its interest in Bergen Engines AS to Engine Holding GmbH, a company jointly held by <strong>Rolls</strong>-<strong>Royce</strong> and Daimler AG.<br />
Under the terms of agreement with Daimler, <strong>Rolls</strong>-<strong>Royce</strong> has retained certain rights such that Bergen Engines continues to be classified as a subsidiary and<br />
<strong>consolidated</strong>.<br />
9
<strong>Condensed</strong> <strong>consolidated</strong> financial <strong>statement</strong>s (continued)<br />
1 Basis of preparation and accounting policies<br />
Reporting entity<br />
<strong>Rolls</strong>-<strong>Royce</strong> Holdings plc is a company domiciled in the UK. These condensed <strong>consolidated</strong> half-year financial <strong>statement</strong>s of the<br />
Company as at and for the six months ended June 30, 2012 comprise the Company and its subsidiaries (together referred to as the<br />
"Group") and the Group's interests in joint ventures and associates.<br />
The <strong>consolidated</strong> financial <strong>statement</strong>s of the Group as at and for the year ended December 31, 2011 (2011 Annual report) are<br />
available upon request from the Company Secretary, <strong>Rolls</strong>-<strong>Royce</strong> Holdings plc, 65 Buckingham Gate, London SW1E 6AT.<br />
Statement of compliance<br />
These condensed <strong>consolidated</strong> half-year financial <strong>statement</strong>s have been prepared in accordance with IAS 34 Interim Financial<br />
Reporting as adopted by the European Union. They do not include all of the information required for full annual <strong>statement</strong>s, and<br />
should be read in conjunction with the 2011 Annual report.<br />
The comparative figures for the financial year December 31, 2011 are not the Group's statutory accounts for that financial year.<br />
Those accounts have been reported on by the Group's auditors and delivered to the registrar of companies. The report of the<br />
auditors was (i) unqualified, (ii) did not include a reference to any matters to which the auditors drew attention by way of emphasis<br />
without qualifying their report, and (iii) did not contain a <strong>statement</strong> under section 498(2) or (3) of the Companies Act 2006.<br />
The Board of directors approved the condensed <strong>consolidated</strong> half-year financial <strong>statement</strong>s on July 25, 2012.<br />
Significant accounting policies<br />
The accounting policies applied by the Group in these condensed <strong>consolidated</strong> half-year financial <strong>statement</strong>s are the same as<br />
those that applied to the <strong>consolidated</strong> financial <strong>statement</strong>s of the Group for the year ended December 31, 2011 (International<br />
Financial Reporting Standards issued by the International Accounting Standards Board, as adopted for use in the EU effective at<br />
December 31, 2011).<br />
Key sources of estimation uncertainty<br />
In applying the accounting policies, management has made appropriate estimates in many areas, and the actual outcome may<br />
differ from those calculated. The key sources of estimation uncertainty at the balance sheet date were the same as those that<br />
applied to the <strong>consolidated</strong> financial <strong>statement</strong>s of the Group for the year ended December 31, 2011.<br />
10
<strong>Condensed</strong> <strong>consolidated</strong> financial <strong>statement</strong>s (continued)<br />
2 Analysis by business segment<br />
The analysis by business segment is presented in accordance with IFRS 8 Operating segments, on the basis of those segments<br />
whose operating results are regularly reviewed by the Board. Following the transfer of Bergen Engines AS to Engine Holding<br />
GmbH on January 2, 2012, the comparative figures for 2011 have been restated to put them on a consistent basis.<br />
The operating results are prepared on an underlying basis that excludes items considered to be non-underlying in nature. The<br />
principles adopted are:<br />
Underlying revenues – Where revenues are denominated in a currency other than the functional currency of the Group undertaking,<br />
these reflect the achieved exchange rates arising on settled derivative contracts.<br />
Underlying profit before financing – Where transactions are denominated in a currency other than the functional currency of the<br />
Group undertaking, this reflects the transactions at the achieved exchange rates on settled derivative contracts. The revaluation<br />
effects of acquisition accounting are excluded and, in 2012, the profit arising on the restructuring of IAE is also excluded. In 2011,<br />
the effects of one-off past-service credits on post-retirement schemes were excluded.<br />
Underlying profit before taxation – In addition to those adjustments in underlying profit before financing, this:<br />
Includes amounts realised from settled derivative contracts and revaluation of relevant assets and liabilities to exchange rates<br />
forecast to be achieved from future settlement of derivative contracts; and<br />
Excludes unrealised amounts arising from revaluations required by IAS 39 Financial Instruments: Recognition and<br />
Measurement, changes in value of financial RRSP contracts arising from changes in forecast payments and the net impact of<br />
financing costs related to post-retirement scheme benefits.<br />
This analysis also includes a reconciliation of the underlying results to those reported in the <strong>consolidated</strong> <strong>income</strong> <strong>statement</strong>.<br />
Half-year to June 30, 2012 Half-year to June 30, 2011 Year to December 31, 2011<br />
Original<br />
equipment<br />
Aftermarket<br />
Total<br />
Original<br />
equipment<br />
Aftermarket<br />
Total<br />
Original<br />
equipment<br />
Aftermarket<br />
Total<br />
£m<br />
£m<br />
£m<br />
£m<br />
£m<br />
£m<br />
£m<br />
£m<br />
£m<br />
Underlying revenues<br />
Civil aerospace 1,314 1,720 3,034 1,047 1,557 2,604 2,232 3,340 5,572<br />
559 575 1,134 504 584 1,088 1,102 1,133 2,235<br />
Defence aerospace<br />
Marine 622 448 1,070 695 476 1,171 1,322 949 2,271<br />
Energy 179 266 445 312 229 541 527 556 1,083<br />
Engine Holding 66 76 142 88 84 172 185 146 331<br />
Eliminate intra-segment revenue (17) (51) (68) (55) (58) (113) (110) (105) (215)<br />
2,723 3,034 5,757 2,591 2,872 5,463 5,258 6,019 11,277<br />
Half-year<br />
Half-year to<br />
June 30,<br />
2012<br />
to June<br />
30, 2011<br />
Year to<br />
December<br />
31, 2011<br />
£m £m £m<br />
Underlying profit before financing<br />
Civil aerospace 310 250 499<br />
Defence aerospace 196 219 376<br />
Marine 147 157 287<br />
Energy (5) (7) 16<br />
11
<strong>Condensed</strong> <strong>consolidated</strong> financial <strong>statement</strong>s (continued)<br />
Engine Holding 52 25 80<br />
Eliminate intra-segment profit (6) - -<br />
Reportable segments 694 644 1,258<br />
Underlying central items (26) (25) (52)<br />
Underlying profit before financing and taxation 668 619 1,206<br />
Underlying net financing (31) (24) (49)<br />
Underlying profit before taxation 637 595 1,157<br />
Underlying taxation (140) (153) (261)<br />
Underlying profit for the period 497 442 896<br />
Total assets Total liabilities Net assets/(liabilities)<br />
June<br />
30, 2012<br />
June<br />
30, 2011<br />
December<br />
31, 2011<br />
June<br />
30, 2012<br />
June<br />
30, 2011<br />
December<br />
31, 2011<br />
June<br />
30, 2012<br />
June<br />
30, 2011<br />
December<br />
31, 2011<br />
£m<br />
£m<br />
£m<br />
£m<br />
£m<br />
£m<br />
£m<br />
£m<br />
£m<br />
Civil aerospace<br />
8,621 (5,701) (5,506) (5,982) 2,884 3,315 2,639<br />
8,585 8,821<br />
Defence aerospace 1,360 1,440 1,311 (1,773) (1,784) (1,831) (413) (344) (520)<br />
Marine 2,167 2,410 2,031 (1,458) (1,730) (1,440) 709 680 591<br />
Energy 1,295 1,125 1,234 (528) (569) (546) 767 556 688<br />
Engine Holding 1,543 229 1,654 (120) (110) (164) 1,423 119 1,490<br />
Reportable segments 14,950 14,025 14,851 (9,580) (9,699) (9,963) 5,370 4,326 4,888<br />
Eliminations (819) (1,012) (746) 819 1,012 746 - - -<br />
Net funds 2,280 2,591 1,427 (1,411) (1,140) (1,204) 869 1,451 223<br />
Tax assets/(liabilities) 479 314 388 (667) (656) (583) (188) (342) (195)<br />
Post-retirement scheme<br />
surpluses/(deficits) 337 249 503 (907) (930) (900) (570) (681) (397)<br />
17,227 16,167 16,423 (11,746) (11,413) (11,904) 5,481 4,754 4,519<br />
Group employees at period end<br />
June<br />
30, 2012<br />
June<br />
30, 2011<br />
December<br />
31, 2011<br />
Civil aerospace 21,100 19,400 20,000<br />
Defence aerospace 7,800 7,900 8,000<br />
Marine 8,800 8,700 8,800<br />
Energy 3,600 3,400 3,600<br />
Engine Holding 1,000 900 900<br />
42,300 40,300 41,300<br />
12
<strong>Condensed</strong> <strong>consolidated</strong> financial <strong>statement</strong>s (continued)<br />
Underlying revenue adjustments<br />
Half-year<br />
to June<br />
30, 2012<br />
Half-year to<br />
June<br />
30, 2011<br />
Year to<br />
December 31,<br />
2011<br />
£m<br />
£m<br />
£m<br />
Underlying revenue 5,757 5,463 11,277<br />
Recognise revenue at exchange rate on date of transaction (37) (99) (153)<br />
Revenue per <strong>consolidated</strong> <strong>income</strong> <strong>statement</strong> 5,720 5,364 11,124<br />
Underlying profit adjustments<br />
Profit<br />
before<br />
financing<br />
Half-year to June 30, 2012 Half-year to June 30, 2011 Year to December 31, 2011<br />
Net<br />
financing<br />
Taxation<br />
Profit<br />
before<br />
financing<br />
Net<br />
financing<br />
Taxation<br />
Profit<br />
before<br />
financing<br />
Net<br />
financing<br />
Taxation<br />
£m<br />
£m<br />
£m<br />
£m<br />
£m<br />
£m<br />
£m<br />
£m<br />
£m<br />
Underlying performance 668 (31) (140) 619 (24) (153) 1,206 (49) (261)<br />
Realised (gains)/losses on settled derivative<br />
contracts 1 (26) 26 - (71) 2 - (116) 24 -<br />
Net unrealised fair value changes to<br />
(6) 66 - 6 456 - (5) (49) -<br />
derivative contracts 2<br />
Effect of currency on contract accounting (14) - - 10 - - 4 - -<br />
Revaluation of trading assets and liabilities - (4) - - (10) - - - -<br />
Financial RRSPs – exchange differences<br />
and changes in forecast payments<br />
Effect of acquisition accounting<br />
- 2 - - 5 - - 2 -<br />
(42) - - - - - (64) - -<br />
Post-retirement scheme past-service<br />
- - - 152 - - 164 - -<br />
costs 3,4<br />
Net post-retirement scheme financing<br />
Related tax effect<br />
- (31) - - (8) - - (12) -<br />
- - (1) - - (142) - - 4<br />
700 - 37 - - - - - -<br />
IAE restructuring (note 12)<br />
Total underlying adjustments 612 59 36 97 445 (142) (17) (35) 4<br />
Reported per <strong>consolidated</strong> <strong>income</strong><br />
<strong>statement</strong> 1,280 28 (104) 716 421 (295) 1,189 (84) (257)<br />
1 The adjustments for realised (gains)/losses on settled derivative contracts include adjustments to reflect the (gains)/losses in the same period as<br />
the related trading cash flows. It excludes amounts settled in respect of the IAE restructuring (£6m loss).<br />
2 The adjustments for unrealised fair value changes to derivative contracts include those in respect of in equity accounted joint ventures and<br />
exclude those for which the related trading contracts have been cancelled when the fair value changes are recognised immediately in underlying<br />
profit.<br />
3<br />
In 2010, the UK Government announced changes to the basis of the statutory indexation for pension increases. As a result, the relevant<br />
arrangements were amended, resulting in a gain in the 2011 <strong>income</strong> <strong>statement</strong> of £130m, which has been excluded from underlying profit.<br />
4 During 2011, the Group agreed revised post-retirement healthcare arrangements on certain of its overseas schemes. This resulted in a net gain in<br />
the <strong>income</strong> <strong>statement</strong> of £34m (2011 half year £22m) which was excluded from underlying profit.<br />
13
<strong>Condensed</strong> <strong>consolidated</strong> financial <strong>statement</strong>s (continued)<br />
3 Net financing<br />
Half-year to June 30, 2012 Half-year to June 30, 2011 Year to December 31, 2011<br />
Per<br />
<strong>consolidated</strong><br />
<strong>income</strong><br />
<strong>statement</strong><br />
Underlying<br />
financing<br />
Per<br />
<strong>consolidated</strong><br />
<strong>income</strong><br />
<strong>statement</strong><br />
Underlying<br />
financing<br />
Per<br />
<strong>consolidated</strong><br />
<strong>income</strong><br />
<strong>statement</strong><br />
Underlying<br />
financing<br />
£m £m £m £m £m £m<br />
Financing <strong>income</strong><br />
Interest receivable 5 5 10 10 20 20<br />
Fair value gains on foreign currency contracts 79 - 452 - -<br />
Financial RRSPs – foreign exchange differences and<br />
changes in forecast payments 2 - 5 - 2<br />
- - 4 - -<br />
Fair value gains on commodity derivatives<br />
Expected return on post-retirement scheme assets 170 - 200 - 410<br />
Net foreign exchange gains 22 - - - 24<br />
Financing costs<br />
-<br />
278 5 671 10 456 20<br />
Interest payable (25) (25) (24) (24) (51) (51)<br />
Fair value losses on foreign currency contracts - - - -<br />
(21) -<br />
(5) (5) (5) (5) (11) (11)<br />
Financial charge relating to financial RRSPs<br />
Fair value losses on commodity derivatives (13) - - - (28)<br />
Interest on post-retirement scheme liabilities (201) - (208) - (422)<br />
Net foreign exchange losses - - (8) - -<br />
Other financing charges (6) (6) (5) (5)<br />
(7) (7)<br />
(250) (36) (250) (34) (540) (69)<br />
-<br />
-<br />
-<br />
-<br />
-<br />
-<br />
-<br />
Net financing 28 (31) 421 (24) (84) (49)<br />
Analysed as:<br />
Net interest payable (20) (20) (14) (14) (31) (31)<br />
Net post-retirement scheme financing (31) - (8) - (12)<br />
-<br />
Net other financing 79 (11) 443 (10) (41) (18)<br />
Net financing 28 (31) 421 (24) (84) (49)<br />
4 Earnings per ordinary share (EPS)<br />
Basic EPS are calculated by dividing the profit attributable to ordinary shareholders by the weighted average number of ordinary<br />
shares in issue during the period, excluding ordinary shares held under trust, which have been treated as if they had been<br />
14
<strong>Condensed</strong> <strong>consolidated</strong> financial <strong>statement</strong>s (continued)<br />
cancelled. Diluted EPS are calculated by adjusting the weighted average number of ordinary shares in issue during the period for<br />
the bonus element of share options.<br />
Half-year to June 30, 2012 Half-year to June 30, 2011 Year to December 31, 2011<br />
Potentially<br />
dilutive<br />
share<br />
options Diluted Basic<br />
Potentially<br />
dilutive<br />
share<br />
options Diluted Basic<br />
Potentially<br />
dilutive<br />
share<br />
options Diluted<br />
Basic<br />
Profit/(loss) (£m) 1,198 - 1,198 842 - 842 850 - 850<br />
1,850 25 1,875<br />
Weighted average shares (millions) 1,850 27 1,877 1,850 24 1,874<br />
EPS (pence) 64.76 (0.93) 63.83 45.51 (0.58) 44.93 45.95 (0.62) 45.33<br />
The reconciliation between underlying EPS and basic EPS is as follows:<br />
Half-year to June 30, 2012 Half-year to June 30, 2011 Year to December 31, 2011<br />
Pence £m Pence £m Pence £m<br />
Underlying EPS / Underlying profit attributable to ordinary<br />
shareholders 26.54 491 23.89 442 48.54 898<br />
Total underlying adjustments to profit before tax (note 2) 36.27 671 29.30 542 (2.81) (52)<br />
Related tax effects 1.95 36 (7.68) (142) 0.22 4<br />
EPS / Profit attributable to ordinary shareholders 64.76 1,198 45.51 842 45.95 850<br />
Excluding IAE restructuring 24.92 461 45.51 842 45.95 850<br />
IAE restructuring 39.84 737 - - - -<br />
Diluted underlying EPS 26.16 23.59 47.89<br />
15
<strong>Condensed</strong> <strong>consolidated</strong> financial <strong>statement</strong>s (continued)<br />
5 Taxation<br />
The effective tax rate for the half year is 8.0% (2011: half year 25.9%, full year 23.3%). Excluding the impact of the IAE<br />
restructuring, the effective tax rate for the half year is 23.2%. Pursuant to the Substantial Shareholdings Exemption, the majority of<br />
the upfront proceeds received on the IAE restructuring are not subject to tax, which has the effect of reducing the effective tax rate.<br />
The tax credit of £37m relating to the IAE restructuring arises as a consequence of the derecognition of various assets and liabilities<br />
on completion of the transaction.<br />
The UK corporation tax rate reduced from 26% to 24% on April 1, 2012 and the effective tax rate takes this into account. The<br />
impact of the reduction to 25% was reflected in the 2011 closing deferred tax balances as the rate change was substantively<br />
enacted prior to the year end. As the further reduction to 24% was substantively enacted on March 26, 2012, the closing deferred<br />
tax assets and liabilities have been remeasured. The proposed future reductions in the rate to 22% will be reflected when the<br />
relevant legislation is substantively enacted. The impact of the reduction in the rate on the effective tax rate for the full year is not<br />
expected to be significant.<br />
6 Payments to shareholders in respect of the period<br />
Payments to shareholders in respect of the period represent the value of C Shares to be issued in respect of the results for the<br />
period. Issues of C Shares were declared as follows:<br />
Half-year to June 30, 2012 Year to December 31, 2011<br />
Pence per<br />
Pence per<br />
share £m<br />
share £m<br />
Interim (issued in January) 7.6 142 6.9 129<br />
Final (issued in July) 10.6 199<br />
7.6 142 17.5 328<br />
7 Intangible assets<br />
Goodwill<br />
Certification costs<br />
and participation<br />
fees<br />
Development<br />
expenditure<br />
Recoverable<br />
engine costs<br />
Software<br />
and<br />
other<br />
Total<br />
£m<br />
£m<br />
£m<br />
£m<br />
£m<br />
£m<br />
Cost:<br />
At January 1, 2012 1,106 720 954 464 490 3,734<br />
Exchange differences (18) (2) (3) - (1) (24)<br />
Additions - 16 14 30 41 101<br />
On acquisition of business 2 - - - - 2<br />
Disposals/write-offs - (6) (6) - - (12)<br />
At June 30, 2012 1,090 728 959 494 530 3,801<br />
Accumulated amortisation:<br />
At January 1, 2012 7 197 268 231 149 852<br />
Exchange differences - - - - - -<br />
Charge for the period - 17 25 27 27 96<br />
Disposals/write-offs - (6) (6) - - (12)<br />
At June 30, 2012 7 208 287 258 176 936<br />
16
<strong>Condensed</strong> <strong>consolidated</strong> financial <strong>statement</strong>s (continued)<br />
Net book value at:<br />
June 30, 2012 1,083 520 672 236 354 2,865<br />
December 31, 2011 1,099 523 686 233 341 2,882<br />
Certification costs and participation fees, development expenditure and recoverable engine costs have been reviewed for<br />
impairment in accordance with the requirements of IAS 36 Impairment of Assets. Where an impairment test was considered<br />
necessary, it has been performed on the following basis:<br />
The carrying values have been assessed by reference to value in use. These have been estimated using cash flows from the<br />
most recent forecasts prepared by management, which are consistent with past experience and external sources of information<br />
on market conditions over the lives of the respective programmes.<br />
The key assumptions underlying cash flow projections are assumed market share, programme timings, unit cost assumptions,<br />
discount rates, and foreign exchange rates.<br />
The pre-tax cash flow projections have been discounted at 11% (2011 full year 11%), based on the Group’s weighted average<br />
cost of capital.<br />
No impairment is required on this basis. However, a combination of changes in assumptions and adverse movements in<br />
variables that are outside the Company’s control (discount rate, exchange rate and airframe delays), could result in impairment<br />
in future periods.<br />
17
<strong>Condensed</strong> <strong>consolidated</strong> financial <strong>statement</strong>s (continued)<br />
8 Other financial assets and liabilities<br />
Half-year to June 30, 2012 Half-year to June 30, 2011 Year to December 31, 2011<br />
Assets Liabilities Net<br />
Liabilities Net Assets Liabilities Net<br />
Assets<br />
£m<br />
£m £m<br />
£m £m<br />
£m £m £m<br />
£m<br />
Foreign exchange contracts 279 (647) (368) 598 (531) 67 321 (768) (447)<br />
Commodity contracts 7 (32) (25) 29 (7) 22 14 (26) (12)<br />
Interest rate contracts 89 (3) 86 45 (4) 41 83 (2) 81<br />
Derivative financial instruments 375 (682) (307) 672 (542) 130 418 (796) (378)<br />
Financial RRSPs - (224) (224) - (256) (256) - (230) (230)<br />
C Shares - (7) (7) - - - - (4) (4)<br />
375 (913) (538) 672 (798) (126) 418 (1,030) (612)<br />
Current 73 (110) 187 (56) 91 (111)<br />
Non-current 302 (803) 485 (742) 327 (919)<br />
375 (913) 672 (798) 418 (1,030)<br />
Derivative financial instruments<br />
Half-year to June 30, 2012<br />
Half-year<br />
to June<br />
30, 2011<br />
Year to<br />
December<br />
31, 2011<br />
Foreign<br />
exchange<br />
Commodity<br />
Interest<br />
rate<br />
Total<br />
Total<br />
Total<br />
£m<br />
£m<br />
£m<br />
£m<br />
£m<br />
£m<br />
(447) (12) 81 (378) (140) (140)<br />
At January 1<br />
Movements in fair value hedges (1) - 4 3 41 85<br />
Movements in cash flow hedges (3) - - (3) 29 (1)<br />
Movements in other derivative contracts 79 (13) 1 67 457 (48)<br />
Contracts settled 4 - - 4 (257) (274)<br />
At period end<br />
(368) (25) 86 (307) 130 (378)<br />
Financial risk and revenue sharing partnerships (RRSPs)<br />
Half-year<br />
Half-year<br />
Year to<br />
to June<br />
to June<br />
December<br />
30, 2012<br />
30, 2011<br />
31, 2011<br />
£m<br />
£m<br />
£m<br />
At January 1 (230) (266) (266)<br />
Cash paid to partners 6 13 46<br />
Exchange adjustments included in OCI 3 (3) (1)<br />
18
<strong>Condensed</strong> <strong>consolidated</strong> financial <strong>statement</strong>s (continued)<br />
9 Pensions and other post-retirement benefits<br />
The net post-retirement scheme deficit as at June 30, 2012 is calculated on a year to date basis, using the latest valuation as at<br />
December 31, 2011, updated to June 30, 2012 for the principal schemes.<br />
Movements in the net post-retirement position recognised in the balance sheet were as follows:<br />
UK schemes<br />
Overseas<br />
schemes<br />
Total<br />
£m £m £m<br />
At January 1, 2012 252 (649) (397)<br />
Exchange adjustments - 6 6<br />
Current service cost (61) (18) (79)<br />
Past service (cost)/credit (1) 5 4<br />
Interest on post-retirement scheme liabilities (177) (24) (201)<br />
Expected return on post-retirement scheme assets 156 14 170<br />
Contributions by employer 123 20 143<br />
Actuarial losses (542) (34) (576)<br />
Movement in unrecognised surplus 1 329 - 329<br />
Movement on minimum funding liability 2 31 - 31<br />
At June 30, 2012 110 (680) (570)<br />
Analysed as:<br />
Post-retirement scheme surpluses - included in non-current assets 329 8 337<br />
Post-retirement scheme deficits - included in non-current liabilities (219) (688) (907)<br />
110 (680) (570)<br />
1 Where a surplus has arisen on a scheme, in accordance with IAS 19 and IFRIC 14, the surplus is recognised as an asset only if it represents an<br />
unconditional economic benefit available to the Group in the future. Any surplus in excess of this benefit is not recognised in the balance sheet.<br />
2 A minimum funding liability arises where the statutory funding requirements require future contributions in respect of past service that will result in<br />
a future unrecognisable surplus.<br />
10 Contingent liabilities and contingent assets<br />
In connection with the sale of its products the Group will, on some occasions, provide financing support for its customers. The<br />
Group’s contingent liabilities related to financing arrangements are spread over many years and relate to a number of customers<br />
and a broad product portfolio.<br />
The discounted values of contingent liabilities relating to delivered aircraft and other arrangements where financing is in place, less<br />
insurance and indemnity arrangements and relevant provisions were:<br />
June 30, 2012 December 31, 2011<br />
£m $m £m $m<br />
Gross contingent liabilities 602 944 612 951<br />
Contingent liabilities net of relevant security 76 119 124 192<br />
Contingent liabilities net of relevant security reduced by 20% 1 145 228 201 312<br />
20
<strong>Condensed</strong> <strong>consolidated</strong> financial <strong>statement</strong>s (continued)<br />
1<br />
Although sensitivity calculations are complex, the reduction of the relevant security by 20% illustrates the sensitivity of the contingent liability to<br />
changes in this assumption.<br />
The reduction in net contingent liabilities since December 31, 2011 is primarily a result of the IAE restructuring.<br />
Contingent liabilities exist in respect of guarantees provided by the Group in the ordinary course of business for product delivery,<br />
performance and reliability. The Group has, in the normal course of business, entered into arrangements in respect of export<br />
finance, performance bonds, countertrade obligations and minor miscellaneous items. Various Group undertakings are parties to<br />
legal actions and claims which arise in the ordinary course of business, some of which are for substantial amounts. While the<br />
outcome of some of these matters cannot precisely be foreseen, the directors do not expect any of these arrangements, legal<br />
actions or claims, after allowing for provisions already made, to result in significant loss to the Group.<br />
11 Related party transactions<br />
Transactions with related parties are shown on page 118 of the Annual report 2011. Significant transactions in the current financial<br />
period are as follows:<br />
Half-year<br />
to June<br />
30, 2012<br />
Half-year<br />
to June<br />
30, 2011<br />
Year to<br />
December<br />
31, 2011<br />
£m £m £m<br />
Sales of goods and services to joint ventures and associates 1,976 1,280 2,864<br />
Purchases of goods and services from joint ventures and associates (1,410) (1,044) (2,380)<br />
12 Restructuring of IAE<br />
On June 29, 2012, the Group and Pratt & Whitney completed the restructuring of their participation in IAE, which produces the<br />
V2500 engine for the Airbus A320 family of aircraft. As a result of the restructuring, <strong>Rolls</strong>-<strong>Royce</strong> sold its equity, programme share<br />
and related goodwill in IAE to Pratt & Whitney for US$1.5 billion, giving rise to a profit before tax of £700 million.<br />
As <strong>Rolls</strong>-<strong>Royce</strong> continues to be responsible for the manufacture of high-pressure compressors, fan blades as well as the provision<br />
of engine support and final assembly of 50 per cent of V2500 engines, the transaction is not considered to give rise to a<br />
discontinued operation.<br />
21
Principal risks and uncertainties<br />
Whilst the Group has a consistent strategy and long performance cycles, it continues to be exposed to a number of risks and has<br />
an established, structured approach to identifying, assessing and managing those risks.<br />
The principal risks facing the Group for the remaining six months of the financial year are unchanged from those reported on page<br />
34 and 35 of the Annual report 2011, and are summarised below:<br />
<br />
<br />
<br />
<br />
<br />
<br />
<br />
<br />
Significant external events affecting demand;<br />
Failure to minimise the environmental impact of the<br />
Group’s products and operations;<br />
Reduction in government spending;<br />
Failure of counterparties;<br />
Fluctuations in foreign currency exchange rates;<br />
Regulatory changes relating to financial derivatives;<br />
The Group’s products, services and pricing do not remain<br />
competitive;<br />
Non-compliance with applicable legislation and<br />
regulations;<br />
<br />
<br />
<br />
<br />
<br />
<br />
<br />
<br />
<br />
Failure to grow capable resource globally;<br />
Product performance not meeting expectations;<br />
Disruption of supply chain;<br />
Downgrade in credit rating;<br />
Failure to conduct business in an ethical and socially<br />
responsible manner;<br />
Failure to manage multiple complex product programmes<br />
effectively;<br />
Breach of IT security;<br />
Failure to execute the programme to modernise the IT<br />
infrastructure; and<br />
Loss or unintended disclosure of Intellectual Property.<br />
Going concern<br />
After making enquiries, the directors have a reasonable expectation that the Group has adequate resources to continue in<br />
operational existence for the foreseeable future. For this reason they continue to adopt the going concern basis in preparing the<br />
<strong>consolidated</strong> financial <strong>statement</strong>s. The financial risk management objectives and policies of the Group and its exposure to price,<br />
credit, liquidity and cash flow risks are considered in the Finance Director’s review on pages 14 to 17 and in Additional financial<br />
information on pages 36 and 37 of the Annual report 2011.<br />
Payments to shareholders<br />
The Company makes payments to shareholders by allotting non-cumulative redeemable preference shares of 0.1 pence each<br />
(C Shares). Shareholders can opt to redeem the C Shares for a cash payment, or reinvest the cash proceeds by purchasing<br />
additional ordinary shares via the C Share Reinvestment Plan (CRIP), which is operated by our Registrar, Computershare Investor<br />
Services PLC. On January 2, 2013, 76 C Shares, with a total nominal value of 7.6 pence, will be allotted for each ordinary share to<br />
those shareholders on the register on October 26, 2012. The final day of trading with entitlement to C Shares is October 23, 2012.<br />
Shareholders wishing to redeem their C Shares, or participate in the CRIP, must lodge instructions with our Registrar to arrive no<br />
later than 5.00 pm on December 3, 2012. The payment of C Shares redemption monies will be made on January 4, 2013.<br />
Statement of directors' responsibilities<br />
The directors confirm that, to the best of their knowledge:<br />
<br />
<br />
the condensed <strong>consolidated</strong> half-year financial <strong>statement</strong>s have been prepared in accordance with IAS 34 Interim Financial<br />
Reporting as adopted by the EU;<br />
the interim management report includes a fair review of the information required by:<br />
(a) DTR 4.2.7R of the Disclosure and Transparency Rules, being an indication of important events that have occurred during<br />
the first six months of the financial year and their impact on the condensed <strong>consolidated</strong> half-year financial <strong>statement</strong>s; and<br />
a description of the principal risks and uncertainties for the remaining six months of the year; and<br />
(b) DTR 4.2.8R of the Disclosure and Transparency Rules, being related party transactions that have taken place in the first<br />
six months of the current financial year and that have materially affected the financial position or performance of the entity<br />
during that period; and any changes in the related party transactions described in the last Annual report that could do so.<br />
The directors of <strong>Rolls</strong>-<strong>Royce</strong> Holdings plc at February 8, 2012 are listed in its Annual report 2011 on pages 38 and 39. Since that<br />
date, the following changes have taken place:<br />
Sir Peter Gregson retired as a non-executive director at the conclusion of the Annual General Meeting held on May 4, 2012; and<br />
Jasmin Staiblin was appointed as a non-executive director on May 21, 2012.<br />
By order of the Board<br />
John Rishton<br />
Mark Morris<br />
Chief Executive<br />
Finance Director<br />
July 25, 2012 July 25, 2012<br />
22
<strong>Condensed</strong> <strong>consolidated</strong> financial <strong>statement</strong>s (continued)<br />
Independent review report to <strong>Rolls</strong>-<strong>Royce</strong> Holdings plc<br />
Introduction<br />
We have been engaged by the company to review the condensed set of financial <strong>statement</strong>s in the half-yearly<br />
financial report for the six months ended June 30, 2012 which comprises the condensed <strong>consolidated</strong> <strong>income</strong><br />
<strong>statement</strong>, the condensed <strong>consolidated</strong> <strong>statement</strong> of comprehensive <strong>income</strong>, the condensed <strong>consolidated</strong><br />
balance sheet, the condensed <strong>consolidated</strong> cash flow <strong>statement</strong>, the condensed <strong>consolidated</strong> <strong>statement</strong> of<br />
changes in equity and the related explanatory notes. We have read the other information contained in the halfyearly<br />
financial report and considered whether it contains any apparent mis<strong>statement</strong>s or material inconsistencies<br />
with the information in the condensed set of financial <strong>statement</strong>s.<br />
This report is made solely to the company in accordance with the terms of our engagement to assist the company<br />
in meeting the requirements of the Disclosure and Transparency Rules ("the DTR") of the UK's Financial<br />
Services Authority ("the UK FSA"). Our review has been undertaken so that we might state to the company<br />
those matters we are required to state to it in this report and for no other purpose. To the fullest extent permitted<br />
by law, we do not accept or assume responsibility to anyone other than the company for our review work, for this<br />
report, or for the conclusions we have reached.<br />
Directors' responsibilities<br />
The half-yearly financial report is the responsibility of, and has been approved by, the directors. The directors are<br />
responsible for preparing the half-yearly financial report in accordance with the DTR of the UK FSA.<br />
As disclosed in note 1, the annual financial <strong>statement</strong>s of the group are prepared in accordance with IFRSs as<br />
adopted by the EU. The condensed set of financial <strong>statement</strong>s included in this half-yearly financial report has<br />
been prepared in accordance with IAS 34 Interim Financial Reporting as adopted by the EU.<br />
Our responsibility<br />
Our responsibility is to express to the company a conclusion on the condensed set of financial <strong>statement</strong>s in the<br />
half-yearly financial report based on our review.<br />
Scope of review<br />
We conducted our review in accordance with International Standard on Review Engagements (UK and Ireland)<br />
2410 Review of Interim Financial Information Performed by the Independent Auditor of the Entity issued by the<br />
Auditing Practices Board for use in the UK. A review of interim financial information consists of making enquiries,<br />
primarily of persons responsible for financial and accounting matters, and applying analytical and other review<br />
procedures. A review is substantially less in scope than an audit conducted in accordance with International<br />
Standards on Auditing (UK and Ireland) and consequently does not enable us to obtain assurance that we would<br />
become aware of all significant matters that might be identified in an audit. Accordingly, we do not express an<br />
audit opinion.<br />
Conclusion<br />
Based on our review, nothing has come to our attention that causes us to believe that the condensed set of<br />
financial <strong>statement</strong>s in the half-yearly financial report for the six months ended June 30, 2012 is not prepared, in<br />
all material respects, in accordance with IAS 34 as adopted by the EU and the DTR of the UK FSA.<br />
AJ Sykes<br />
for and on behalf of KPMG Audit Plc<br />
Chartered Accountants, London<br />
July 25, 2012<br />
23