RoSPA Drinking and Driving Policy Paper 2007
RoSPA Drinking and Driving Policy Paper 2007
RoSPA Drinking and Driving Policy Paper 2007

You also want an ePaper? Increase the reach of your titles
YUMPU automatically turns print PDFs into web optimized ePapers that Google loves.
The Royal Society for the Prevention of Accidents<br />
<strong>Drinking</strong> <strong>and</strong> <strong>Driving</strong> <strong>Policy</strong> <strong>Paper</strong><br />
Updated May <strong>2007</strong><br />
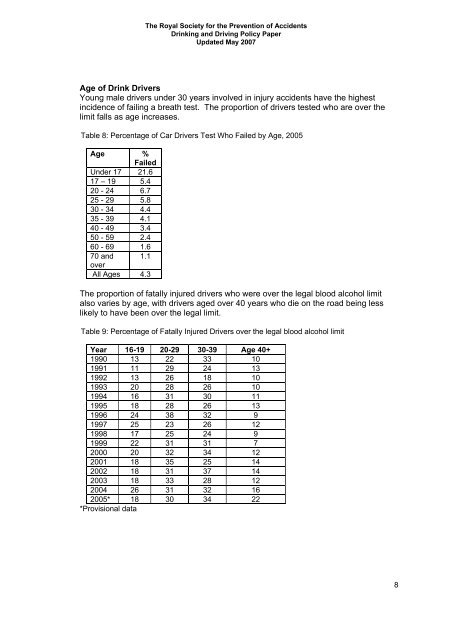
Age of Drink Drivers<br />
Young male drivers under 30 years involved in injury accidents have the highest<br />
incidence of failing a breath test. The proportion of drivers tested who are over the<br />
limit falls as age increases.<br />
Table 8: Percentage of Car Drivers Test Who Failed by Age, 2005<br />
Age %<br />
Failed<br />
Under 17 21.6<br />
17 – 19 5.4<br />
20 - 24 6.7<br />
25 - 29 5.8<br />
30 - 34 4.4<br />
35 - 39 4.1<br />
40 - 49 3.4<br />
50 - 59 2.4<br />
60 - 69 1.6<br />
70 <strong>and</strong> 1.1<br />
over<br />
All Ages 4.3<br />
The proportion of fatally injured drivers who were over the legal blood alcohol limit<br />
also varies by age, with drivers aged over 40 years who die on the road being less<br />
likely to have been over the legal limit.<br />
Table 9: Percentage of Fatally Injured Drivers over the legal blood alcohol limit<br />
Year 16-19 20-29 30-39 Age 40+<br />
1990 13 22 33 10<br />
1991 11 29 24 13<br />
1992 13 26 18 10<br />
1993 20 28 26 10<br />
1994 16 31 30 11<br />
1995 18 28 26 13<br />
1996 24 38 32 9<br />
1997 25 23 26 12<br />
1998 17 25 24 9<br />
1999 22 31 31 7<br />
2000 20 32 34 12<br />
2001 18 35 25 14<br />
2002 18 31 37 14<br />
2003 18 33 28 12<br />
2004 26 31 32 16<br />
2005* 18 30 34 22<br />
*Provisional data<br />
8